
Abstract
The dialects theory of cross-cultural communication suggests that due to culture-specific characteristics in the expression of emotion, we can recognise own-culture emotional expressions more accurately than other-culture emotional expressions. This effect is suggested to occur due to the nonconvergent social evolution that takes place in different geographical regions. Based on the evolutionary value of own-culture social signals, previous research has suggested that own-culture emotional expressions can be appraised without conscious awareness. The current study tested this hypothesis. We developed, validated, and made open access what is to our knowledge the first labelled, multicultural facial stimuli set, including freely expressed and Facial Action Coding System instructed emotional expressions. We assessed emotional recognition and cultural familiarity responses during brief backward-masked presentations in British participants. We found that emotional recognition and cultural familiarity were higher for own-culture faces. A Bayesian analysis of face-detection and emotional-recognition performance revealed that faces were not processed subliminally. Further analysis of awareness, using hits (correct detection/recognition) and misses (incorrect detection/recognition), showed that face-detection hits were a necessary condition for reporting higher familiarity for own-culture faces. These findings suggest that the own-culture emotional recognition advantage is preserved under conditions of backwards masking and that the appraisal of cultural familiarity involves conscious awareness.
Introduction
In the past 15 years, we have been provided with an unprecedented access to cross-cultural communication. Not only are we now, more than ever, part of multicultural societies, but we can have face-to-face personal and professional contact with individuals from other nations without leaving the comfort of our living room or office. These contemporary privileges have yielded an increase in cross-cultural professional collaborations and have even influenced peer and romantic partner selection (Bochner, 2013). In our contemporary world, cross-cultural emotional recognition is vital and necessary on a social (Castells, 2004) and a professional level. But do we recognise emotion equally well in individuals from our own culture compared with other cultures, and do we recognise emotion equally well across other cultures indiscriminately?
Psychologists have spent considerable resources in the past decades exploring these questions. Cultural agreement in the expression of emotion was first addressed in the popularised studies conducted by Ekman and Friesen (1971) in indigenous tribal populations. Their seminal, for social and cultural psychology, findings suggested that basic facial emotions such as fear, anger, surprise, happiness, sadness, and disgust are universally recognised (Ekman, 2004). In more recent years, this concept has been expanded (Elfenbein & Ambady, 2003). Recent psychological research (Elfenbein, 2015) has adopted a linguistic metaphor (Tomkins & McCarter, 1964) for interpreting cross-cultural emotional communication. According to this approach, although basic emotional expressions are considered a universal language, there are culture-specific dialects that influence the expression and recognition of emotion (Elfenbein, Beaupré, Lévesque, & Hess, 2007). These dialects include display and decoding rules. Display and decoding rules refer to the particular way that a cultural group is allowed or encouraged or prohibited from expressing and interpreting emotion respectively (Matsumoto, Frank, & Hwang, 2013).
Based on these concepts (Russell, Bachorowski, & Fernández-Dols, 2003), researchers working in this field have suggested that there are subtle but recognisable cross-cultural differences in the expression and recognition of emotion (Elfenbein, 2013). For example, Western individuals are more likely to express high-intensity emotional facial expressions (Marsh, Elfenbein, & Ambady, 2003) and less likely to recognise low-intensity emotions, possibly because these are not accurately recognised as communicating salient emotional information. On the other hand, Eastern individuals are more likely to express context-specific positive emotional expressions (Masuda, Gonzalez, Kwan, & Nisbett, 2008) and less likely to express or acknowledge negative affect, possibly because it could signify an abrupt termination of the social transaction (Matsumoto et al., 2013). These cultural accents are suggested to confer an in-group emotional recognition advantage for own-culture faces (Elfenbein & Ambady, 2003) and an out-group emotional recognition disadvantage for cultures that are distinctly different to our own (cross-cultural bias, see Elfenbein, 2017).
Along these lines, freely expressed emotion could potentially enhance the own-culture recognition advantage and instructed emotion could possibly decrease or eliminate it (Elfenbein & Ambady, 2003). In this context, freely expressed emotion could enhance the effect because it allows culture-specific expressions that can be more accurately recognised by own-culture members due to their in-group social value. Instructed emotion, on the other hand, could decrease the effect because it forces cross-cultural homogeneity in the expression of emotion and eliminates in-group emotional expressive characteristics (for comprehensive review, see Elfenbein & Ambady, 2002a, 2002b, 2003). The suggestion that particularly freely expressed culture-specific emotion induces higher in-group emotional recognition accuracy (Haxby, Hoffman, & Gobbini, 2002) has resulted in the hypothesis that own-culture emotional expressions have shared region-specific evolutionary and sociobiological value, and that they could be processed without conscious awareness (Chiao et al., 2008; Smith, Dijksterhuis, & Chaiken, 2008).
Previous research has provided some findings that could be relevant here. For example, Chiao et al. (2008) showed that both Japanese and Caucasian participants automatically responded with higher bilateral, and more pronounced right-lateral, BOLD 1 activation in the amygdala, when presented for 1 s with own-culture instructed fearful faces compared with instructed fearful faces from other cultures. This could be interpreted to suggest that own-culture fearful expressions were more salient elicitors of fear compared with other-culture fearful expressions. Previous research (Eberhardt, Goff, Purdie, & Davies, 2004; Smith et al., 2008) also reported that different-culture and different-race neutral faces presented either for very brief durations (e.g., 33.33 milliseconds) or suppressed by separately presenting colour patterns to the dominant or nondominant eye (Schlossmacher, Junghöfer, Straube, & Bruchmann, 2017; Tong, Meng, & Blake, 2006) decrease emotional recognition accuracy for subsequently presented supraliminal faces showing own-culture expressions of emotion (Nosek, Hawkings, & Frasier, 2011). This could be interpreted to suggest that even when presented under conditions that could preclude conscious awareness, other-culture and other-race faces decrease the ability to recognise emotion in subsequently presented faces.
Although subliminal and unconscious processing is in general supported by several studies (for review, see Brooks et al., 2012), many researchers disagree that subliminal emotional processing is possible (Pessoa & Adolphs, 2010). For example, Pessoa, Japee, Sturman, and Ungerleider (2005) showed that bilateral BOLD activation in the amygdala during brief presentations (33.33 and 66.67 milliseconds) occurs only when the participants correctly detected (hits) fearful faces and not when participants did not detect a presented fearful face (misses) in a posttrial signal detection assessment task. In a study related to cross-cultural emotional processing and consciousness, Amihai, Deouell, and Bentin (2011) used continuous-flash-suppression (Tsuchiya & Koch, 2004, 2005) and showed that exposure to racially ambiguous artificial faces (adaptors) biased recognition accuracy for subsequent supraliminal racially unambiguous artificial faces in the opposite category of the adaptor only when the adaptors were not successfully suppressed, such as when participants responded with hits (correct detection) for seeing an artificial adaptor, but not when participants responded with misses (incorrect nondetection) for not seeing an artificial adaptor in a posttrial signal detection assessment task (Gaillard et al., 2009; Pessoa, 2005; Pessoa & Adolphs, 2010, 2017). These findings suggest that there is an effect of culture and race in emotional recognition but that this is not necessarily due to subliminal or unconscious processing.
The current study follows from these findings. Our first objective was to test if the own-group emotional recognition advantage can be preserved during visual suppression such as backward-masked presentations of faces for the durations for which they were presented in previous studies (e.g., 33.33 milliseconds). Our second objective was to test whether cultural familiarity can be appraised without conscious awareness, such as for misses for face-detection and emotional-recognition responses in a posttrial signal detection assessment task, or whether the appraisal of cultural familiarity requires conscious awareness of the presented faces, such as hits for face-detection and emotional-recognition responses in a posttrial signal detection assessment task (Pessoa, 2005).
An important motivation for the current research was to test if faces showing freely expressed emotions and instructed emotions from different cultures can influence conscious and unconscious emotional processing (Ekman, Friesen, & Ellsworth, 2013). Hence, we included freely expressed and instructed facial expressions in our experimental design (Elfenbein & Ambady, 2002a, 2002b, 2003). Due to the lack of a labelled multicultural facial dataset in the area, we developed a cross-cultural facial stimuli dataset that included freely expressed and Facial Action Coding System (FACS) instructed facial expressions from different continental geographical regions based on U21 2 institutional availability (Britain, New Zealand, Chile, and Singapore). We tested the dataset using cultural and emotional questionnaires, participant assessment, and automatic emotional recognition software, to validate whether differences between cultures were due to cultural differences in the expression of emotion. The purpose of this assessment was to test whether the expressed emotional dialects conferred cross-cultural communication differences as opposed to differences due to sampling variables, such as occupational and life-style choices, that are not necessarily and uncontestedly related to emotional culturation (see Russell et al., 2003, pp. 331–337).
We used this dataset to present British participants with backward-masked own-culture and other-culture FACS instructed and freely expressed emotional faces and assessed responses for face detection, emotional recognition, and cultural familiarity. To implement a balanced design for the exploration of cross-cultural emotional differences, we treated each culture as a separate emotional elicitor and presented an equal number of repetitions per type of emotion and expression for each country of origin (see Elfenbein & Ambady, 2002b, pp. 223–227). To accurately assess participant responses during the masking condition, we used the method we developed for the assessment for conscious awareness described in detail in our previous research (Tsikandilakis, Bali, & Chapman, 2019; Tsikandilakis, Bali, Derrfuss, & Chapman, 2019a, 2019b, 2019c; Tsikandilakis & Chapman, 2018; Tsikandilakis, Chapman, & Peirce, 2018). This method included unbiased nonparametric signal detection theory criteria to measure face-detection and emotional-recognition performance (Stanislaw & Todorov, 1999; Zhang & Mueller, 2005), Bayesian analysis for the assessment of chance-level signal detection performance (Dienes, 2015), that would indicate unawareness for the presentation of facial targets and their expressed emotional type (Erdelyi, 2004), and hits (correct detection/recognition) and misses (incorrect detection/recognition) analysis (Fawcett, 2006) for the assessment of cultural familiarity responses (Pessoa, 2005).
Using these criteria, we tested whether the own-culture emotional-recognition advantage can be preserved under conditions of backwards masking for freely expressed and FACS instructed cross-cultural emotional expressions, and whether cultural familiarity can be appraised during backwards masking with and without conscious awareness, such as for hits and misses for face-detection and emotional-recognition responses.
Study 1
Stage 1: Stimulus Development
Aims
The first objective of the current stage was to develop a multicultural facial dataset that would include nonprofessional actors from Britain, New Zealand, Chile, and Singapore. The second objective of the current stage was to assess the actors that were part of the dataset using cultural and emotional questionnaires to explore if emotional differences between cultures were due to cultural—and not random population sampling—differences (Russell et al., 2003).
Participants
A total of 104 nonprofessional actors (58 females) from Britain, New Zealand, Chile, and Singapore volunteered to participate in this stage. All participants reported normal or corrected-to-normal vision. The inclusion criteria for the current stage were having been born in the country of interest, having attended primary, secondary, and higher education in the country of interest and in the language of the country of interest; having previously resided only and currently residing permanently in the country of interest; and characterising themselves as part of the culture of the country of interest (Yes/No). Participants were additionally screened with the Somatic and Psychological Health Report Questionnaire (SPHRQ; Hickie et al., 2001) and an online Alexithymia-Emotional Blindness questionnaire (Alexithymia, 2018). Two participants were excluded from the study due to having a joint nationality. Data from one participant were excluded from further analysis due to having a SPHRQ score that indicated a possible psychiatric diagnosis. Data from three participants were excluded due to scores that indicated possible alexithymic traits. Data from one participant were excluded due to lack of compliance with the experimental tasks. The final sample consisted of 97 participants (56 females) with mean age of 24.19 years (SD = 3.69) from Britain (n = 29; mean age = 22.93 years (SD = 3.63); 18 females), New Zealand (n = 22; mean age = 23.67 years (SD = 4.27); 15 females), Chile (n = 20; mean age = 22.47 years (SD = 2.5); 10 females), and Singapore (n = 26; mean age = 23.2 years (SD = 2.2); 13 females). All participants gave informed consent to participate in the study and for their data to be used for further research purposes. The experiment was approved separately by the Ethics Committee of the School or Department of Psychology or Medicine of each contributing institution.
Stimuli and procedures
This stage took place at universities in Britain, New Zealand, Chile, and Singapore. Questionnaires and instruction material were provided in the participants’ native language. Participants in each contributing institution were invited into a brightly illuminated laboratory space. After the initial screening processes, they were asked to complete the Hofstede Cultural Dimensions Questionnaire (CDQ; Hofstede, 2003) and the Emotional Regulation Questionnaire (ERQ; Gross & John, 2003). Subsequently, they were asked to produce a set of expressions including fearful, angry, happy, sad, disgusted, neutral (Ekman, 1999), and calm (Tottenham et al., 2009) facial expressions in different conditions.
In the freely expressed condition, photographs were taken while participants were asked to freely express basic emotions in three levels (mild, moderate, and intense) and neutral and calm expressions (see also Appendix A). Subsequently, actors were asked to show instructed emotional expressions. In the instructed condition, photographs for each emotional expression were taken after the participants were trained and subsequently instructed on how to use specific facial action units (AU) 3 to portray basic emotions according to the FACS (Ekman, 1992a; 1992b; Ekman & Friesen, 1978; Ekman & Rosenberg, 1997; Figure 1). A minimum of three photos per condition and emotional expression were taken for each actor. The resulting stimuli were sorted and labelled. They were adjusted for interpupillary distance, transformed to grey scale, and resized to a standard 1,024 × 768 pixels resolution. Their luminescence was averaged in SHINE, MATLAB Toolbox, and finally, the stimuli were spatially aligned and framed into pure white within a cropped circle with set dimensions (height: 6 cm and width: 4 cm).
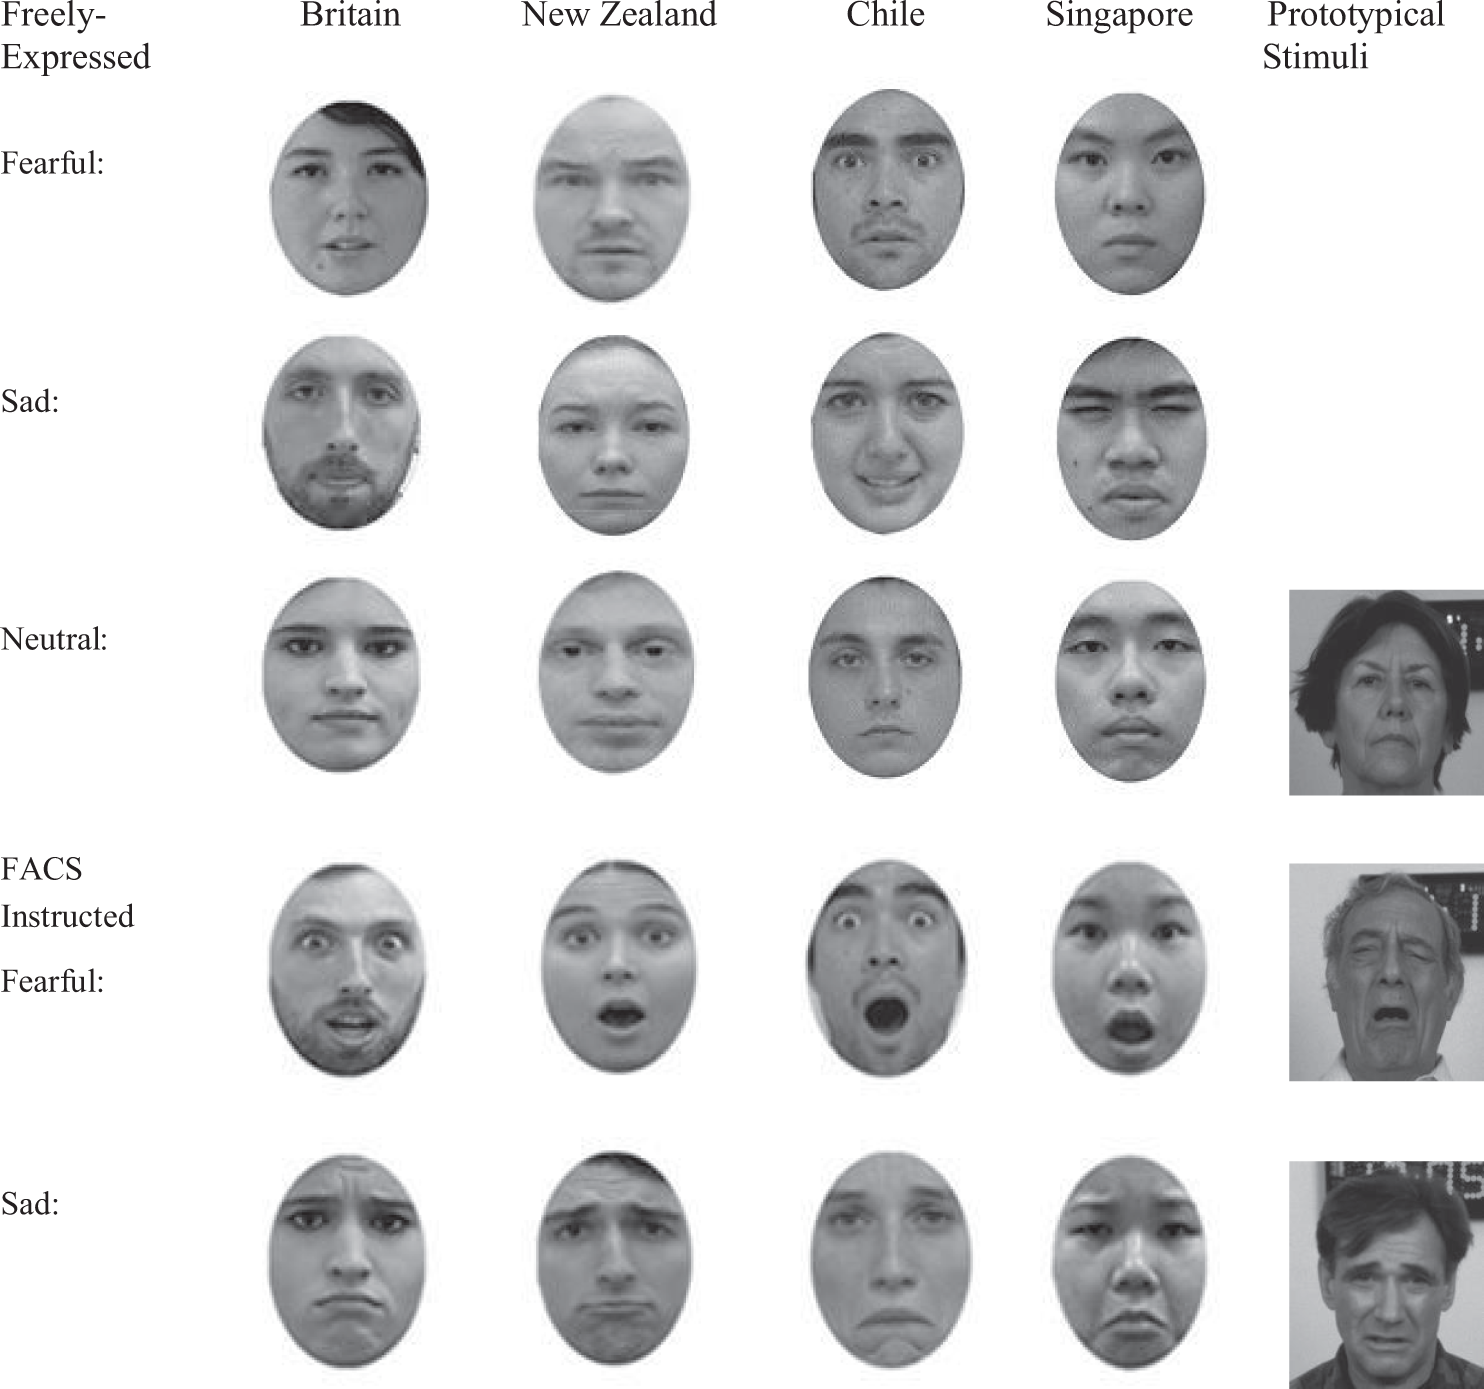
Cross-cultural faces of emotion. Example emotional expressions for each country. Prototypical stimuli were not part of any subsequent stage and are presented here for illustration purposes (Gur et al., 2002).
Analysis and discussion
To explore whether cultural groups were characterised by cultural—and not random sampling—differences in the expression of emotion, the actors’ scores in the ERQ and CDQ questionnaires were assessed (Russell et al., 2003; see also Appendix C). An analysis of variance (ANOVA) was run with independent variable Country of Origin of the Actors (Britain, New Zealand, Chile, and Singapore) and dependent variable Cultural Dimensions Scores (power distance, individualism, masculinity, uncertainty-avoidance, and long-term orientation). The analysis revealed a significant Country of Origin of the Actors effect—F(3,42) = 4.92, p < .01; partial eta-squared = .26. Further Bonferroni-corrected post hoc comparisons revealed that uncertainty avoidance was higher for British actors (M = 72.14, SD = 9.23) compared with actors from Singapore (M = 53.23, SD = 10.72; p < .01; d = 1.89). Actors from New Zealand (M = 71.45, SD = 8.49; p < .01; d = 1.88) and Chile (M = 67.6, SD = 9.53; p < .01; d = 1.42) also reported higher uncertainty-avoidance scores compared with actors from Singapore. No other comparisons survived the Bonferroni corrections. To further explore emotional differences between cultural groups, an ANOVA was run with independent variable Country of Origin (Britain, New Zealand, Chile, and Singapore) and dependent variable Emotional Expression Facets (Cognitive Reappraisal and Emotional Suppression). The analysis revealed a significant effect of Country of Origin—F(3,51) = 4.5, p < .01; partial eta-squared = .21. Further Bonferroni-corrected post hoc comparisons revealed that Expressive Suppression was significantly lower for British actors (M = 10.97, SD = 2.85) compared with Singaporean actors (M = 16.11, SD = 3.56; p < .01; d = 1.59), and for Chilean actors (M = 10.5, SD = 4.51) compared with Singaporean actors (p < .01; d = 1.38). No other comparisons survived the Bonferroni corrections.
Stage 2: Automatic Facial Recognition Software Assessment
Aims
The aims of this stage were to assess the dataset using automatic facial recognition software and use the output to select the stimuli that were validated for racial background, gender, and expressed emotion.
Stimuli and procedures
A total of 2,964 photographs from 97 actors were assessed using Noldus Face-Reader 7.0 (Noldus, 2018). The analysis of the stimuli was run using the Viola–Jones cascaded algorithm (Viola & Jones, 2004) and an active appearance model that employed a 500-point Euclidean transformation (Cootes, Edwards, & Taylor, 2001) to eliminate static identification variability for image quality, lighting, background variation, and orientation (Lewinski, den Uyl, & Butler, 2014). The analysis was conducted using a custom template analysis, and each participant was evaluated with respect to the expressed emotion after controlling for the influence of AU that were present in their own neutral expressions using the participant calibration module (Noldus, 2018). The General61 face module was used to assess British, New Zealand, and Chilean actors and the East Asian face module was used to assess actors from Singapore. Gender and cultural-background analysis 4 was also conducted per participant and expressed emotion.
Output and discussion
Stimuli that were not correctly identified with respect to gender and cultural background were excluded from further analysis; a total of 47 photographs were excluded. The remaining 2,917 stimuli were further reduced to be able to meet the time restrictions for Study 2. The ethics approval for Study 2 included a time restriction for 1 hour of stimuli presentation. To provide sufficient trial repetitions to achieve the required power (P(1–β) ≥ .8) within the approved time frame we chose, for further facial recognition assessment and consideration for inclusion in the masking stage, the face types that reported a significant in-group advantage and a cross-cultural bias effect in previous research (Elfenbein et al., 2007). We included mid-intensity freely expressed faces, to control for possible effects relating to very subtle (low-intensity) or exaggerated (high-intensity) emotional expressiveness (Ekman & Rosenberg, 1997) and approximate normative and realistic cultural responses (Russell, 1994), and FACS-instructed (Bernstein, Young, & Hugenberg, 2007) fearful (Chiao et al., 2008), sad (Elfenbein & Ambady, 2002a), and neutral (Marsh et al., 2003) faces for each culture. All mid-intensity freely expressed faces that met the cultural-background and gender criteria (n = 291) were included for each culture. These could vary in emotion recognition and were not chosen based on Noldus scores (Tables 1 and 2). The FACS instructed facial expressions that reported the highest emotional recognition, racial background, and gender recognition criteria were selected (n = 291). The final subset consisted of freely expressed and Facial Action Unit System instructed facial expressions (n = 582) with the original sample demographic characteristics (Stage 1).
Emotional Recognition Scores (%).
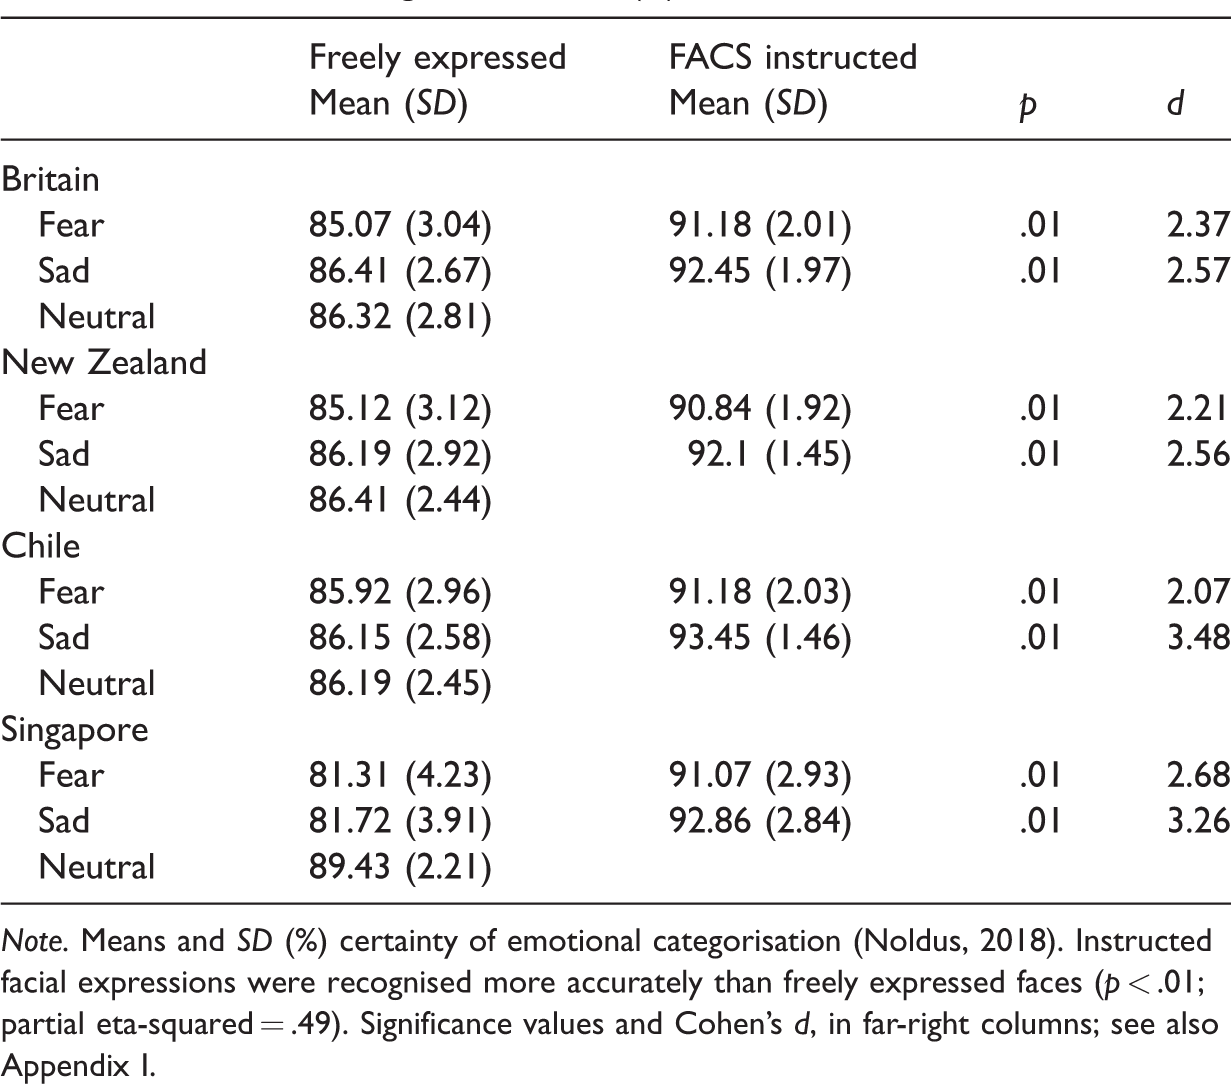
Note. Means and SD (%) certainty of emotional categorisation (Noldus, 2018). Instructed facial expressions were recognised more accurately than freely expressed faces (p < .01; partial eta-squared = .49). Significance values and Cohen’s d, in far-right columns; see also Appendix I.
Number of Actors Showing Key AUs for Instructed and Freely Expressed Emotion.
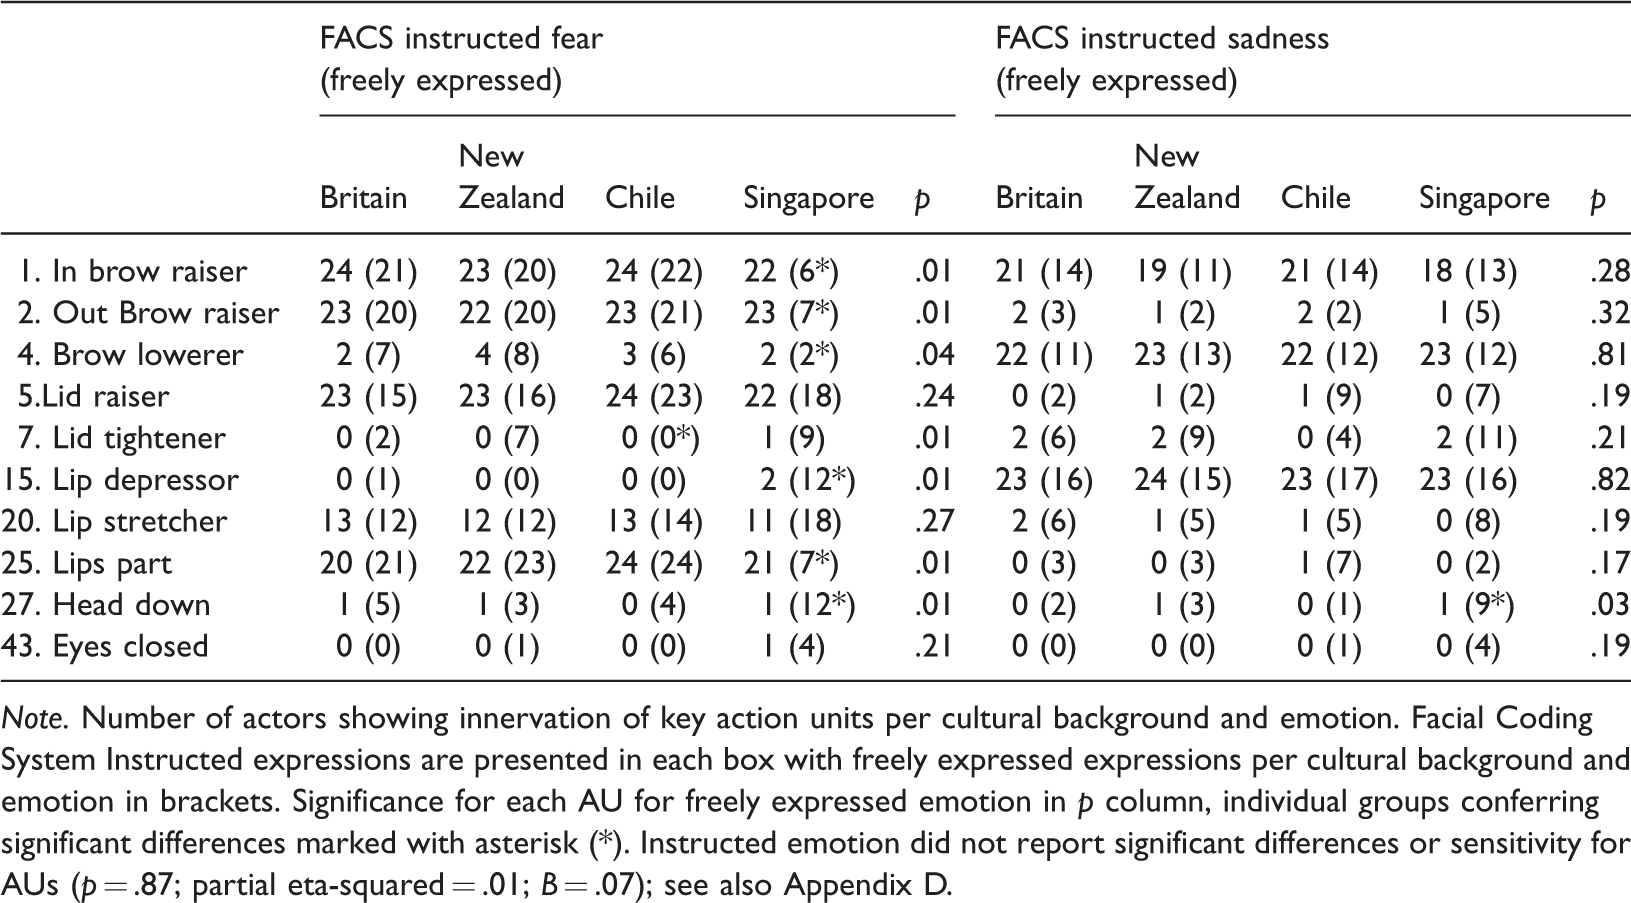
Note. Number of actors showing innervation of key action units per cultural background and emotion. Facial Coding System Instructed expressions are presented in each box with freely expressed expressions per cultural background and emotion in brackets. Significance for each AU for freely expressed emotion in p column, individual groups conferring significant differences marked with asterisk (*). Instructed emotion did not report significant differences or sensitivity for AUs (p = .87; partial eta-squared = .01; B = .07); see also Appendix D.
Stage 3: Overt Assessment
Aims
The aim in this stage was to assess participant responses for emotional recognition and cultural familiarity when the selected stimuli were presented for 1 second.
Participants
A power calculation based on medium effect sizes (partial eta-squared = .06; f = .25) and within-subject experimental trial repetitions (n = 582) was performed. The results revealed that 17 participants would be required for P(1–β) ≥ .8 (Faul, Erdfelder, Buchner, & Lang, 2009). Nineteen participants (nine females) who were not part of Stage 1 volunteered to participate in the experiment. All participants reported normal or corrected-to-normal vision. The inclusion criteria for the current study were having been born in the United Kingdom of Great Britain (hereafter United Kingdom), 5 having attended primary, secondary, and higher education in English in the United Kingdom, having previously resided only and currently residing permanently in the United Kingdom, and characterising themselves as part of the culture of the United Kingdom (Yes/No). The participants were screened for psychiatric diagnosis (Hickie et al., 2001) and alexithymia (Alexithymia, 2018). Data for one participant were excluded due to possible Alexithymic traits. Data from one participant were excluded due to possible psychiatric diagnosis. The final population sample consisted of 17 participants (9 females). The mean participant age was 27.48 years (SD = 4.71). All participants gave informed consent to participate in the study. The experiment was approved by the local Ethics Committee of the School of Psychology.
Stimuli and procedures
Participants were invited in a laboratory space in the local School of Psychology. Participants took part in two experimental runs scheduled 1-week apart at the same time slot. Each run consisted of 291 faces that were pseudo-randomised using Python to include approximately equal (±1) numbers of faces for expression type, country of origin, emotional expression, and gender. The stimuli were presented on a 60 Hz HD Lenovo monitor (16.67 milliseconds per frame). The presentation was programmed in the coder and builder components of Psychopy version 1.85.3 (Peirce, 2007).
The experimental trial started with a fixation cross for 3 seconds (±1 second). After the fixation cross, a single freely expressed or instructed face from Britain or New Zealand or Chile or Singapore showing a fearful or sad or neutral expression was presented at fixation for 1 second; order randomised. The face was immediately followed by a black and white pattern mask for 1 second (see also Figure 2). A blank screen interval was presented for 2 seconds before the rating tasks. 6 Participants were asked to respond to two on-screen stimuli-rating tasks using the keyboard; task order randomised. The participants were asked “What emotion best describes the emotion that the presented face was expressing? (fearful (f), sad (s), neutral (n), or other (o))” and “How culturally familiar was the presented face? (1: not familiar at all to 10: very familiar).” After the engagement tasks, a 2-second blank screen interval was presented before the next trial. The participants were not made aware in any way of the country of origin of the presented faces before or during the current experimental stage.

Stimuli sequence. Example stimuli sequences including a neutral Chilean face or a nonfacial blur. Participants were presented with brief culturally diverse faces. They were asked to reply if they saw a face using the keyboard by pressing W or E; key order randomised. They were then assigned with either an emotional recognition or emotional self-assessment task. Finally, they were asked to rate cultural familiarity for the presentation.
Analysis and discussion
Emotional recognition
Emotional recognition was transformed to nonparametric sensitivity index A. This measure was used for all subsequent analyses (Zhang & Mueller, 2005). Descriptive statistics for each condition can be seen in Table 3. An ANOVA with independent variables Country of Origin (Britain, New Zealand, Chile, and Singapore) and Type of Expression (freely expressed and instructed), and dependent variable emotional recognition performance (A) was run. The analysis revealed a significant effect of Country of Origin, F(3, 48) = 968.06, p < .001; partial eta-squared = .99, a significant effect of Type of Expression, F(1, 16) = 225.92, p < .001; partial eta-squared = .93, and a significant interaction, F(1.68, 26.81) = 194.4, p < .001; partial eta-squared = .93; Greenhouse-Geisser corrected. Further Bonferroni-corrected pairwise comparisons revealed that British actors were emotionally recognised more accurately than actors from New Zealand (p < .01, d = 1.55), Chile (p < .01, d = 1.55), and Singapore (p < .01, d = 8.52) for the freely expressed emotional condition. New Zealand (p < .01, d = 1.28) and Chilean (p < .01, d = 1.43) actors were emotionally recognised more accurately than actors from Singapore. No other comparisons survived the Bonferroni corrections. No significant differences were reported for instructed emotion, F(3, 48) = .3, p = .82; partial eta-squared = .02; β 7 = .03.
Emotional Recognition and Cultural Familiarity.

Note. Means and standard deviation for each condition for Stage 3. Emotional recognition and cultural recognition performance are presented here both in hit rates (percentage correct) and nonparametric index A (Zhang & Mueller, 2005).
Cultural familiarity
An ANOVA with independent variables Country of Origin (Britain, New Zealand, Chile, and Singapore) and Type of Expression (freely expressed and instructed), and dependent variable cultural familiarity ratings was run. The analysis revealed a significant effect of Country of Origin, F(3, 48) = 553.56, p < .001; partial eta-squared = .97, a significant effect of Type of Expression, F(1, 16) = 119.05, p < .001; partial eta-squared = .88, but not a significant interaction, F(3, 48) = 1.8, p = .16; partial eta-squared = .1; β = .09. Further Bonferroni-corrected pairwise comparisons revealed that British actors were rated higher for cultural familiarity than actors from New Zealand (p < .001; d (F.E. 8 ) = 2.47, d (I. 9 ) = 2.12), Chile (p < .01; d (F.E.) = 1.62, d (I.) = 1.77), and Singapore (p < .001; d (F.E.) = 9.05, d (I.) = 8.23). Chilean actors were rated as more culturally familiar than actors from New Zealand (p < .01; d (F.E.) = .43, d (I.) = .33) and Singapore (p < .001; d (F.E.) = 6.29, d (I.) = 6.96). New Zealand actors were also rated higher for familiarity than actors from Singapore (p < .001; d (F.E.) = 5.59, d (I.) = 6.89).
Study 2
Aims
The first objective of the current study was to test if the own-group emotional recognition advantage—and the other-culture emotional recognition bias—can be preserved during backward-masked presentations of brief faces for freely expressed and instructed, own, and other-culture emotional expressions. The second objective of the current study was to test whether cultural familiarity can be appraised from hits and miss responses for face detection and emotional recognition in a posttrial signal detection assessment task.
Participants
A power calculation based on medium effect sizes (partial eta-squared = .06; f = .25) and within-subject experimental trial repetitions (n = 480) was performed. The result revealed that 21 participants would be required for P(1–β) ≥ .8 (Faul et al., 2009). Twenty-six participants (13 females) who were not part of Study 1 volunteered to participate in the experiment. All participants reported normal or corrected-to-normal vision. The inclusion criteria for the current study were having been born in the United Kingdom; having attended primary, secondary, and higher education in English in the United Kingdom; having previously resided only and currently residing permanently in the United Kingdom; and characterising themselves as part of the culture of the United Kingdom (Yes/No). Participants were additionally screened with the Somatic and Psychological Health Report Questionnaire (Hickie et al., 2001) and an online Alexithymia Emotional Blindness questionnaire (Alexithymia, 2018). Three participants were excluded from the study due to joint nationality. Data from one participant were excluded from further analysis due to possible alexithymic traits and data from one participant were excluded due to possible psychiatric diagnosis. The final population sample consisted of 21 participants (10 females). The mean age for this stage was 30.21 years (SD = 5.07). All participants gave informed consent to participate in the study. The experiment was approved by the local Ethics Committee of the School of Psychology.
Stimuli and Procedures
Participants were invited into a laboratory space at the local School of Psychology. After the initial screening processes, they were administered the ERQ and CDQ. 10 They were then allowed a small break. The main experiment started with a 5-minute response training task and participants were then asked to indicate when they were ready to start the stimuli presentation using the keyboard. Previous research (Elfenbein & Ambady, 2002a, 2002b, pp. 243–247) suggests that to accomplish a balanced design when a single cultural group is exposed to cross-cultural stimuli an equal number of stimuli from each selected culture should be presented to the participants including equal emotional expression and type, and gender distributions per cultural group during the presentation. In this study, we followed these experimental guidelines to attain a balanced cross-cultural emotional recognition design. Two hundred and forty faces and an equal number of randomly generated nonfacial pattern blurs were shown (see Appendix E). Each presentation run was pseudorandomised for the face condition and assigned 120 faces per type, 80 faces per emotion, and 60 faces per nationality. Each actor identity was repeated three times to attain an equal number of male and female faces (n = 120).
The experimental trial started with a fixation cross for 3 seconds (±1 second). After the fixation cross, a nonfacial blur or a single freely expressed or instructed face from Britain or New Zealand or Chile or Singapore showing a fearful or sad or neutral expression was presented at fixation for 33.33 milliseconds; order randomised (see also Appendix F). The target was immediately followed by a black and white pattern mask for 116.67 milliseconds. After the mask, a blank screen interval was presented for 2 seconds. After the presentation, participants were asked to reply to three on-screen questions using the keyboard. First they were asked “Did you see a face? (Y/N).” After this task, we used conditional branching. If the response was “Yes,” an on-screen message asked participants “What kind of emotion was the face expressing? (fear (f), sad (s), neutral (n), or other (o)).” To balance the task length when using conditional branching, if the participants’ response was “No,” an on-screen message asked participants “What kind of emotion best describes your experience during the presentation? (fear (f), sadness (s), neutral (n), or other (o)).” This task was included to disallow participants to make their choice based on shorter engagement task length criteria. After this task, participants were asked by an on-screen message “How culturally familiar was the presentation? (1: not familiar at all to 10: very familiar).” 11 A blank screen interval was presented for 2 seconds before the next trial (Figure 2).
Apparatus and Presentation Testing
The stimuli were presented on a 60 Hz HD Lenovo monitor. The presentation was programmed in the coder and builder components of Psychopy version 1.85.3. To ensure that brief stimuli were correctly presented, an IPad PRO camera with 120 Hz refresh rate (8.33 milliseconds) recorded two pilot runs. The stimuli presentation was assessed frame by frame; no instances of dropped frames were detected. A self-developed dropped frames script report with one frame (16.67 milliseconds) tolerance threshold was coded in Python and two pilot experimental diagnostic sessions were run. The presenting monitor reported no dropped frames; prognostic estimate 1/5,000 trials. Experimental stages were subsequently run using dropped frames diagnostics; no instances of dropped frames were reported.
Analysis and Discussion
In-group advantage and cross-cultural bias for emotional recognition under conditions of backward masking
Descriptive statistics for signal detection performance can be seen in Table 4. Emotional Recognition was transformed to nonparametric sensitivity index A. 12 This measure was used for all subsequent analysis (Zhang & Mueller, 2005). An ANOVA with independent variables Type of Expression (freely expressed and instructed), Country of Origin (Britain, New Zealand, Chile, and Singapore) and Type of Emotion (fear, sadness, and neutral), and dependent variable emotional recognition performance (A) was run. The analysis revealed significant effect only for Country of Origin, F(2.01, 40.11) = 33.55, p < .001; partial eta-squared = .63. Further Bonferroni corrected pairwise comparisons revealed that actors from Britain (M = .64, SD = .11) were recognised more accurately than actors from Singapore (M = .43, SD = .11; p < .001; d = 1.82). In addition, p-values that approximated Bonferroni-corrected significance in the analysis (Schumm, Pratt, Hartenstein, Jenkins, & Johnson, 2013) were revealed for higher recognition to actors from Britain in comparison to actors from New Zealand (M = .58, SD = .13; p = .02; d = .5) and Chile (M = .58, SD = .14; p = .04; d = .48).
Hit Rates (a) and Sensitivity Index A (b) for Signal Detection Performance.

Note. (a) Mean and standard deviation percentage of correct detection (hit rates), and(b) mean and standard deviation sensitivity index A per type of expression (freely expressed and instructed) and per country of origin for detection and recognition performance.
Actors from New Zealand (p < .001; d = 1.25) and Chile (p < .001; d = 1.19) were recognised significantly more accurately with respect to what emotion they were expressing compared with actors from Singapore. This finding indicated that emotional recognition for actors from Singapore was subject to a cross-cultural emotional-recognition bias. Therefore, we tested the exploratory hypothesis that, due to higher emotional suppression scores reported during Study 1, the current results could have occurred because actors from Singapore could have been most commonly misrecognised as expressing emotional neutrality. This hypothesis was investigated further using confusion matrix analysis (Fawcett, 2006). Accuracy for recognition of an expression (A) was calculated for hits and misses for responding having seen a neutral face for each country of origin (Britain, Chile, New Zealand, and Singapore) and an ANOVA was run. We wanted to test if in particular false-positive responses (incorrectly categorising a face as neutral) were higher for participants from Singapore resulting in lower recognition; correct responses. A significant effect of Country of Origin was reported, F(2.05, 40.89) = 30.15, p < .001; partial eta-squared = .6. Further Bonferroni-corrected pairwise comparisons revealed higher false-positive rates for incorrectly labelling a face as neutral for Singaporean actors (M = .39, SD = .02), compared with actors from Britain (M = .67, SD = .03; p < .001; d = 11.51), New Zealand (M = .59, SD = .03; p < .001; d = 7.74), and Chile (M = .59, SD = .04; p < .001; d = 6.57).
Does appraisal of cultural familiarity require conscious awareness?
Descriptive statistics can be seen in Tables 4 and 5. A one-sample t test against chance-level performance (A) revealed that masked faces were detected significantly better than chance (p < .01), but they were not recognised significantly different from chance (p = .67). A Bayesian analysis (Dienes, 2015) with corrected degrees of freedom (Berry, 1996) and higher and lower bounds set at –.1 (.4) and .1 (.6), with 0 (A = .5) representing chance level performance, revealed that face detection for British (SE = .02; B > 3), New Zealand (SE = .02; B > 3), Chilean (SE = .02; B > 3), and Singaporean (SE = .02; B > 3) faces were higher than chance (Dienes, 2015). A Bayesian analysis (Dienes, 2015) with corrected degrees of freedom and higher and lower bounds set at –.1 (.15) and .1 (.35), with 0 (A = .25) representing chance-level performance, revealed that emotion recognition for British (SE = .03; B > 3), New Zealand (SE = .03; B > 3), Chilean (SE = .03; B > 3), and Singaporean (SE = .03; B > 3) faces was significantly higher than chance.
Hits and Miss Cultural Familiarity Responses Within Cultures.
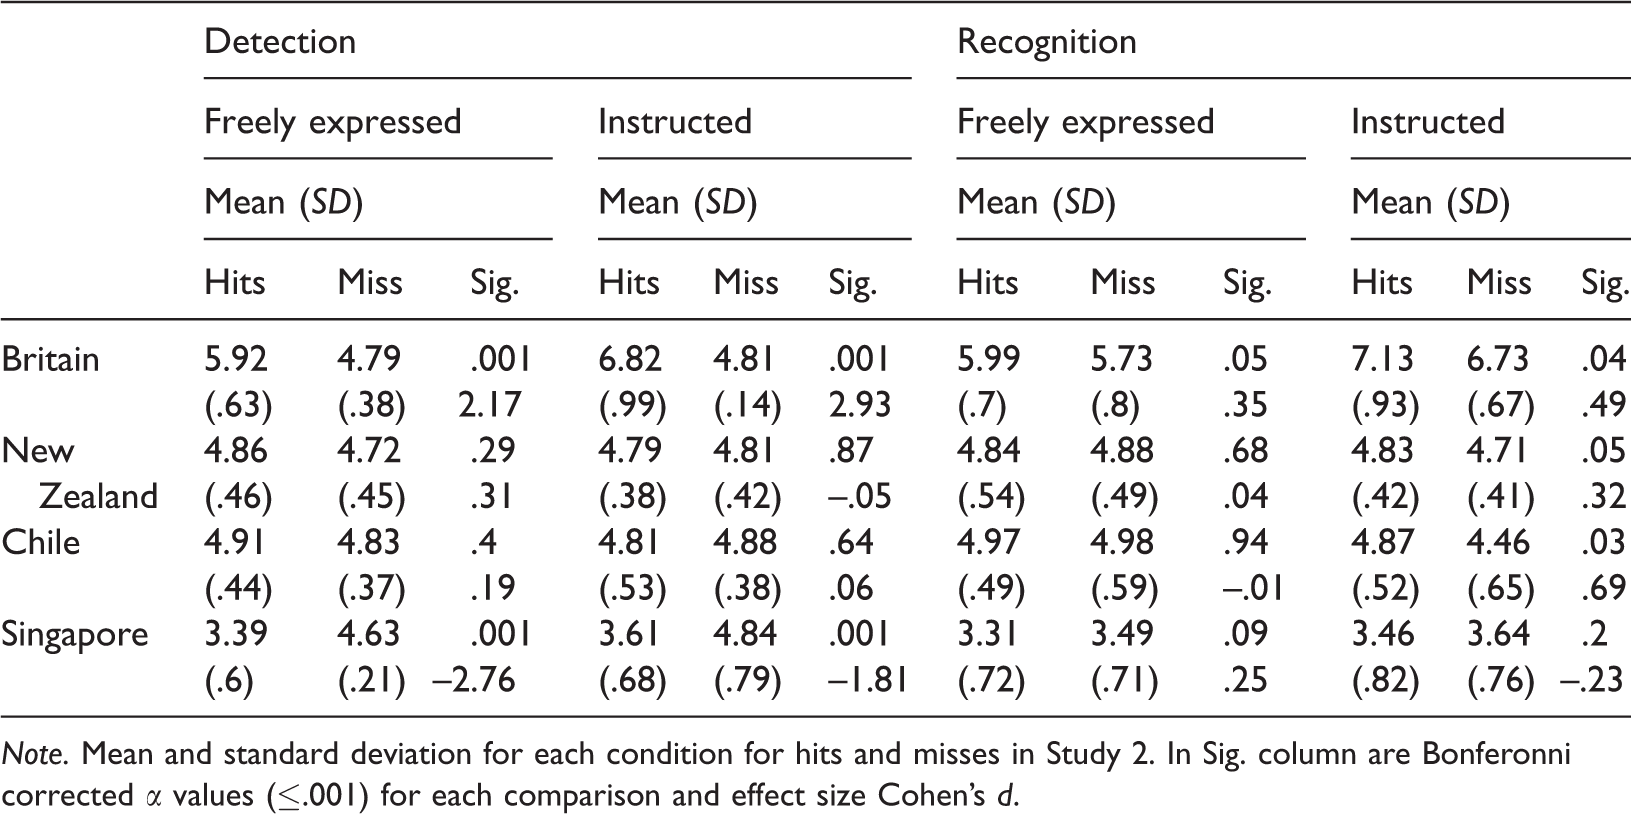
Note. Mean and standard deviation for each condition for hits and misses in Study 2. In Sig. column are Bonferonni corrected α values (≤.001) for each comparison and effect size Cohen’s d.
To explore if cultural familiarity can be appraised without conscious awareness, we ran an analysis of cultural familiarity scores for hits and misses for detection and recognition performance (Pessoa, 2005). The analysis revealed that hits for face-detection performance were associated with significant differences between cultures, F(2.33, 46.65) = 68.98, p < .001; partial eta-squared = .44, while misses were not significantly different between cultures, F(15, 210) = 1.19, p = .28; partial eta-squared = .08; β = .07. Further Bonferroni-corrected pairwise comparisons revealed that correctly detected British faces (M = 6.59, SD = .86) were rated higher in cultural familiarity than correctly detected faces from New Zealand (M = 4.8, SD = .39; p < .001; d = 2.68), Chile (M = 4.91, SD = .44; p < .001; d = 2.46), and Singapore (M = 3.48, SD = .52; p < .001; d = 4.38). A different pattern was found for recognition performance. Hits, F(2.34, 41.13) = 62.78; p < .001; partial eta-squared = .78, and misses, F(15, 120) = 14.21; p < .001; partial eta-squared = .64, in emotion recognition revealed significant differences in familiarity ratings between different cultures (Figure 3). Further Bonferroni-corrected comparisons revealed that for recognition hits British actors (M = 6.72, SD = .93) were rated higher for cultural familiarity than actors from New Zealand (M = 4.89, SD = .37; p < .001; d = 2.59), Chile (M = 4.98, SD = .46; p < .001; d = 2.37) and Singapore (M = 3.33, SD = .64; p < .001; d = 4.25). For misses in recognition, British actors (M = 6.33, SD = .68) were also rated higher than actors from New Zealand (M = 4.84, SD = .88; p < .001; d = 1.89), Chile (M = 4.9, SD = .82; p < .001; d = 1.89) and Singapore (M = 3.67, SD = .98; p < .001; d = 3.15).

Hits and miss cultural familiarity responses between cultures. Mean cultural familiarity ratings per Country of Origin for Hits and Misses in detection and recognition performance for freely expressed (F.E.) and FACS instructed (Inst.) faces for Study 2. Error bars indicate standard error of the mean (±2). Asterisks indicate Bonferonni corrected significance between different cultures (p ≤ .001).
General Discussion
In Study 1, we developed a cross-cultural facial stimulus dataset including nonprofessional actors from Britain, Chile, Singapore, and New Zealand showing freely expressed and FACS instructed emotional expressions. We assessed and validated the dataset using standard cultural dimensions and emotional expression questionnaires, automatic facial recognition software, and participant assessment. In Study 2, we used the developed dataset to explore whether the own-culture emotional recognition advantage can be preserved under conditions of backward masking and whether the appraisal of cultural familiarity from faces requires conscious awareness. We reported significant findings for an own-group emotional recognition advantage and that face-detection was a necessary condition for the appraisal of cultural familiarity. No effects were reported for misses for face detection between different cultural groups. Correct emotional recognition of own-culture faces increased ratings for cultural familiarity but was not a necessary condition for significant differences between cultures.
Previous research has reported extended evidence for a regional in-group advantage in emotional recognition (Elfenbein & Ambady, 2002a). Higher accuracy for emotional recognition for own-culture compared with other-culture faces has been reported by African American (Wickline, Bailey, & Nowicki, 2009), Canadian (Beaupré & Hess, 2005), American U.S. (Soto & Levenson, 2009), European (Sauter, Eisner, Ekman, & Scott, 2010), Chinese (Han & Northoff, 2008), Australian (Elfenbein, 2006), and Japanese (Chiao et al., 2008) participants and has been used to shape contemporary cross-cultural psychological theories (Elfenbein & Ambady, 2002b; Matsumoto, 2002). This in-group advantage is suggested to rely on culture-specific ways of expressing emotion, that is, display rules, and culture specific ways of responding to emotion, that is, decoding rules.
Contemporary cross-cultural psychologists suggest that the expression of basic emotions such as anger, fear, sadness, happiness, surprise, and disgust is considered a universal language, but they are pronounced in different ways due to the nonconvergent social evolution that takes place in different geographical regions (Elfenbein et al., 2007). This nonconvergent evolution has been suggested to confer culture-specific sociobiological value (Adolphs, 2003). Based on this hypothesis, the argument has also been raised that culture-specific emotional expressions are recognised more accurately because they are appraised without conscious awareness (Eberhardt et al., 2004; Gifford, 2008; Smith et al., 2008). Previous research has provided support for the notion of automatic appraisal of own-culture emotional faces (Chiao et al., 2008) and the notion that other-culture and own-culture faces, that are visually suppressed using either backwards masking or dichoptic rivalry, can influence our subsequent responses to supraliminal cues (Smith et al., 2008). This line of research has been challenged by findings from other research groups that suggest that, although it is possible that facial characteristics can influence participant responses during visual suppression, these effects could be due to inadequate masking of the presented stimuli and conscious awareness (Pessoa et al., 2005; Tsikandilakis et al., 2018).
In the current study, we followed on from these findings. We tested whether the effects of cross-cultural dialects in the expression of emotion can be preserved under conditions of backwards masking and whether the appraisal of cultural familiarity requires conscious awareness, such as hits and miss responses for face detection and emotional recognition in a posttrial signal detection assessment task. We found that British participants could emotionally recognise own-culture emotional faces more accurately than other-culture faces under conditions of backward masking irrespective of type of expression (freely expressed and FACS instructed) and despite the brief duration of presentation (i.e., 33.33 milliseconds). The participants in the current study were, furthermore, able to accurately rate and recognise own-culture masked negative emotions and masked negative emotions expressed by actors from Chile and New Zealand. However, they responded with a cross-cultural misrecognition bias (emotional neutrality) and the lowest familiarity ratings for masked faces from Singapore. These findings suggest that the participants employed cultural and emotional display rules for emotional recognition, and they did not experience a negative emotion decoding bias (Phaf & Rotteveel, 2005), meaning, in this context, that the participants were not reluctant to explicitly categorise a face as expressing a negative emotion (see also Johnson & Fredrickson, 2005).
The finding that the own-culture emotional recognition advantage was preserved under conditions of backward masking, for the duration for which faces were presented in previous research (i.e., 33.33 milliseconds), is not surprising. Using the current method for the assessment of subliminality, the participants did not show evidence for subliminal processing in response to the presented faces (Tsikandilakis & Chapman, 2018). Further analysis of awareness revealed that higher in-group cultural familiarity ratings were specific to the subset of trials that included hits for face detection of the presented stimuli. Emotional recognition enhanced this effect while misses for face detection did not reveal significant differences between cultural groups. During the masking study, British participants displayed an own-group emotional recognition advantage for both freely expressed and FACS instructed facial expressions, but this finding did not extend to higher familiarity and emotion recognition for other-culture FACS instructed facial expressions as compared with other-culture freely expressed faces. This finding suggests that under conditions of backward masking the most pronounced emotional differences survive the reduction in signal strength (Aru, Bachmann, Singer, & Melloni, 2012), and that the presentation of unfamiliar physiognomic characteristics in combination with the challenging task of responding to brief emotional expressions (Gaillard et al., 2009) resulted in the extinction of the other-culture FACS instructed higher emotion recognition effect (Bochner, 2013).
In relation to the dialects theory of emotion, this suggests that culture-specific emotional characteristics have an impact on emotional recognition and the appraisal of cultural familiarity during very brief presentations of facial stimuli. Nevertheless, from a psychophysics perspective, it also indicates that fixed durations of masked presentations might not be sufficient to induce subliminal visual suppression (Tsikandilakis & Chapman, 2018), particularly for own-culture emotional faces (Schlossmacher et al., 2017). In addition, when using further hits (correct detection/recognition) and miss (incorrect detection/recognition) analysis of participant responses, misses for detection did not reveal significant differences and revealed Bayesian evidence for the null (β = .07) for ratings for cultural familiarity between own and other-culture emotional faces. Therefore, the current findings suggest that detection is a necessary condition for the appraisal of differences in cultural familiarity and point towards that the appraisal of cultural familiarity from faces involves, and possibly relies on, conscious awareness for the detection of a presented face (Erdelyi, 2004; Etkin, Büchel, & Gross, 2015; Pessoa, 2005; Pessoa & Adolphs, 2010; Tsikandilakis et al., 2018). The current findings point towards that the appraisal of cultural familiarity from faces involves conscious awareness (Gaillard et al., 2009; Schlossmacher et al., 2017).
Limitations
To attain a balanced cross-cultural experimental design (Elfenbein & Ambady, 2002b), given the institutional availability for the current study, the stimuli set included three Caucasian and one Asian physiognomic group. This could have influenced the participant responses for Singaporean actors. The current study also included British participants in the masking stage, due to restrictions relating to the funding scheme that supported the current research. This poses the possibility that the current effect could be specific to the current population sample either as a function of task perception during the main experimental stage or emotional portrayal during the stimuli development stage, such as the ability of British participants to produce more distinguishable freely expressed emotional expressions. Cross-cultural replication is required to further explore if the current effect can be reported by additional cultural groups.
Conclusions
We tested whether British participants can report different cultural familiarity ratings when presented with backwards masked own and other-culture emotional faces. Our findings from the specific population sample suggest that freely expressed and instructed emotional faces from our own-culture are rated higher for cultural familiarity and are more accurately recognised compared with faces from other cultures during backward-masked presentations. Our findings also suggest that the appraisal of cultural familiarity involves, and possibly relies on, conscious awareness, such as face-detection hit responses, and that it could not be reported in the absence of conscious awareness, such as face-detection miss responses.
Footnotes
Acknowledgements
The primary author would like to acknowledge that this manuscript is the end-product of 2 years of dedicated work from a total of fifteen researchers in five international institutions. The co-authorship order indicates the order of recruitment in the current project. Co-authors two to seven were the original project members and have equal contribution and co-authorship status for the current manuscript. All measures, manipulations, and exclusions in the study were disclosed, and no data were collected after the initial analysis. Many thanks go to our families, friends, and academic colleagues who supported us during this project. The primary author would like to thank Zoltan Dienes and Talis Bachmann.
Data Accessibility Statement
Declaration of Conflicting Interests
The author(s) declared no potential conflicts of interest with respect to the research, authorship, and/or publication of this article.
Funding
The author(s) disclosed receipt of the following financial support for the research, authorship, and/or publication of this article: This project was funded by a U21 Grant awarded to Dr. Myron Tsikandilakis and Professor Jonathan Peirce.