



Abstract
Visual environments affect egocentric distance perceptions in full cue conditions. In this study, the effect of three spatial layouts was tested on the perceived location of a self-illuminated single target viewed in the dark. Blind-walking (BW) estimates of target distance were underestimated in all testing spaces, as expected, but foreshortened significantly more in the shortest of the three testing rooms. Additional experiments revealed that neither changes in the perceived angle of declination nor perceived eye height were responsible for this effect. The possibility that subjects made cognitive adjustments to BW behavior to reduce physical risk was assessed by remeasuring target locations in the three different locations with magnitude estimation and by comparing the BW results obtained from subjects who had no preview of the testing space with those who had. The results support the conclusion that the effect of spatial layout is likely due to cognitive adjustments to BW behavior. The results also indicate that the perceived angle of declination is always overestimated by at least a factor of 1.5. These results can be interpreted within the context of a theory of space perception called the angular expansion theory (AET).
Introduction
The accurate perception of egocentric distance is a necessary perceptual function needed to successfully interact with our environment. Yet, despite the large body of research on the topic of egocentric distance perception there is disagreement on its accuracy, even in full cue conditions. In other words, egocentric distance perception is sometimes found to be veridical in full cue conditions while other studies report such perceptions are distorted. For example, distance perceptions of ground-based targets have been reported to be underestimated (Foley, Ribeiro-Filho, & da Silva, 2004; Gilinsky, 1951; Loomis, da Silva, Fujita, & Fukusima, 1992). Durgin (2014) reviewed these studies and suggested that these differences may be due, in part, to differences in the perceptual indicators used to measure distance perception. Results obtained from experiments that use visually directed action-based tasks such as blind-walking (BW) to indicate egocentric distance tend to indicate distance perception is veridical whereas tasks that involve perceptual masking or direct scaling techniques indicate that egocentric distance perception is underestimated. This is still an area of active research. The results obtained from studies that investigated egocentric distance perception in the dark, however, show much more consensus. In such reduced cue situations, the perceived distance of ground-based self-illuminated targets is underestimated whether measured by action tasks or scaling techniques such as magnitude estimation (Ooi, Wu, & He, 2001, 2006; Philbeck & Loomis, 1997). These targets also appear to float above the ground, and the farther away they are perceived, the higher they seem to float (Ooi et al., 2001, 2006).
Although there are different explanations for this underestimation of perceived distance and overestimation of perceived height (discussed later and see Li & Durgin, 2012; Ooi et al., 2006), there is general agreement that the most important visual cue to a target’s egocentric distance in darkness beyond about 2 m is the determination of its angle of declination (AoD; Ooi et al., 2001, 2006; Philbeck & Loomis, 1997; Wallach & O’Leary, 1982; Williams & Durgin, 2015). Sedgwick (1983) calls this angle the horizon–distance relation. The AoD for any object located on the ground is the angle formed between the subject’s eye height and the lines of sight to the horizon and the target as seen in Figure 1(a). Clearly, the closer an object is to the observer, the greater the target’s AoD (angle α1 > angle α2).
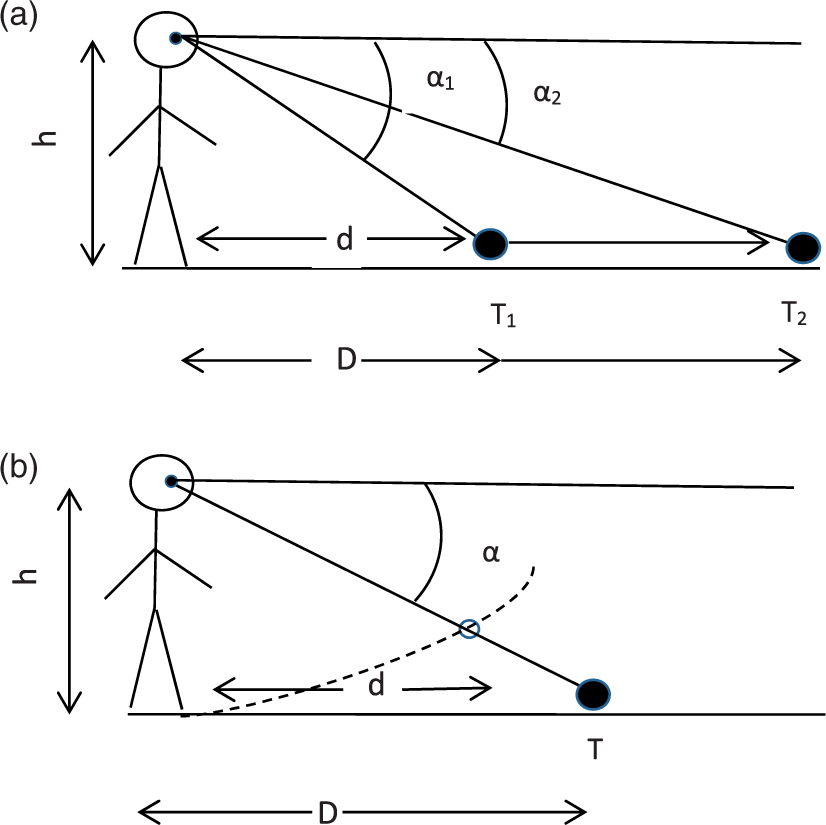
(a) Schematic representation illustrating how the perceived AoD (α) along with eye height (h) can be used to recover egocentric distance (d) of target (T). The figure also illustrates how the AoD (α2) for Target 2 (T2) is less than the AoD (α1) for Target 1 (T1). (b) This illustration, adapted from Ooi et al. (2006), indicates that the target will be perceived at the intersection of the AoD (α) and the implicit surface (dashed line).
Because the line of sight between eye height and the horizon is a reference line for determining the perceived angle of declination (PAoD), changing perceived eye height or perceived horizon height will necessarily affect the perceived distance of the target by changing its PAoD. The distance between the eyes and feet is roughly constant in adults that usually walk on level ground and can be perceived from visual, proprioceptive, and vestibular cues (Ooi et al., 2006). Presumably, in darkness, the memory of these visual cues plus cues from the proprioceptive and vestibular senses can determine perceived eye level. However, the perceived eye level is not invariant but is affected by visual cues in the environment. For example, perceived eye height is raised by the wearing of base out prisms (Ooi et al., 2001) and can be raised or lowered as the height of the focus of expansion is vertically shifted (Wu, He, & Ooi, 2005). Other visual cues from the environment such as the height of the vanishing point can also change perceived eye height. For example, artists have known for hundreds of years that in perspective drawings, lines representing parallel lines in physical space converge to a vanishing point and that this point is located on the horizon when the observer looks straight ahead. Wu, He, and Ooi (2007a) examined whether the manipulation of the linear perspective cue might change perceived eye height in a real world situation. They reported that the manipulation of the convergence point of parallel lines at ground level changed perceived eye height as well as perceived target distance. Andersen, Braunstein, and Saidpour (1998) reported that perceived target distance varied with the height of the vanishing point of a textured surface viewed on a computer screen. The vanishing point was indicated by linear perspective cues and was presumed to change the height of the perceived eye level, although they did not measure it.
The aforementioned experiments reveal that the height of the vanishing point seems to align with perceived eye height and thus affect perceived target distance, but studies also report that the height of the visual horizon below eye level can also alter the PAoD and hence perceived target location (Messing & Durgin, 2005; Rand, Tarampi, Creem-Regehr, & Thompson, 2011). In an indoor environment, the visual horizon is defined as the border between the floor and far wall directly facing the observer. Rand et al. (2011) reported that when this border is raised, perceived distances are more foreshortened than when it is lowered, presumably because a raised visual horizon will increase the PAoD, which in turn signals a closer visual target. Thus, multiple visual cues from indoor spatial environments can affect the reference line between eye level and the horizon. Perhaps differences in these cues underlie the interesting finding that the scaling of perceived distance has an exponent greater than 1.0 indoors, but less than 1.0 when judged outdoors (Teghtsoonian & Teghtsoonian, 1969, 1970). As these visual cues, such as the location of the vanishing point and the height of the visual horizon vary with each unique indoor space (but do not necessarily covary with each other), there is reason to think that the layout of the testing spaces may affect our judgments of egocentric distance. Note that the spatial environment is not visible in experiments measuring perceived target location in darkness. Thus, the visual cues from the testing space would have to exert their influence, if any, via memory of the testing space. Gajewski, Philbeck, Wirtz, and Chichka (2014) reported that perception of target distance is indeed shaped by the memory of prior visual experience with the visual environment; however, they did not vary the spatial layout of the testing space.
A few studies have reported that spatial layout does in fact affect the perception of distance in full cue conditions even when multiple cues to depth and distance are available (Gajewski, Philbeck, Pothier, & Chichka, 2010; Gajewski et al., 2014; Lappin, Shelton, & Rieser, 2006; Witt, Stefanucci, Riener, & Proffitt, 2007). Lappin et al. (2006) asked observers to judge the midpoint of three different spatial locations: a lobby, a hallway, and an open lawn. The location of the midpoints varied significantly with the testing space, but explanation for this is unknown. Witt et al. (2007) similarly observed that distance perceptions were misperceived in full cue conditions and that the misperceptions varied with the layout of the testing space, though again, the explanation is unknown. Of particular relevance to the present study is the work of Gajewski et al. (2014). In one experiment, the perceived distance of targets viewed in the dark, measured with BW, was significantly more accurate (i.e., less foreshortened) when subjects were given a 15-second preview of the testing space when compared with the results obtained from subjects who had not experienced a preview of the testing space. This result indicates that the memory of spatial layout can affect the perceived distance of targets subsequently viewed in the dark. The authors suggest that prior experience with the spatial layout might affect distance perception because the visual cues to perceived eye height were more accurately derived.
In summary, a number of factors seem capable of affecting the perceived distance of targets viewed in darkness. In this study, the location of self-illuminated targets was measured in three testing spaces with different spatial dimensions. For convenience, the testing spaces are referred to as short, medium, and long, indicating the length of the testing rooms. In the first experiment, the BW technique was used as the perceptual indicator. Subjects freely experienced the different testing spaces in full cue conditions before testing in the dark began. The results indicated that spatial layout had a significant effect on perceived target location. To determine what factors might underlie this result, a second subsequent experiment measured the PAoD and perceived eye height with magnitude estimation (ME) for each target distance in the three different testing spaces. The results indicated that neither the PAoD nor perceived eye height varied with the testing space and thus cannot underlie the observed changes in egocentric distance as measured by BW. Another explanation for the effect of testing space is that subjects may cognitively adjust their BW behavior to protect themselves from the physical risk of bumping into the far wall. Thus, the foreshortening effect may vary with testing space as the observer’s level of personal risk varies. Such changes with testing space should not occur if the perceptual indicator poses no physical threat to the subject, and this hypothesis was tested in the third experiment where target location was measured with ME. The results supported the hypothesis that subjects can adjust their BW behavior to avoid physical risk. The fourth experiment provided a further test of this hypothesis. One group of subjects was allowed to preview the testing space, while the other group was not. Again, the results support the hypothesis that subjects will adjust their BW behavior if they feel they might be at some physical risk. Subjects not only reduced the amount they BW in the shortest testing space but also as target distances got longer. In addition, the ME results show that the PAoD is not veridical, but always overestimated by at least a factor of 1.5. This contradicts the conclusions from BW experiments that indicate the PAoD is veridically perceived (Ooi et al., 2001, 2006). These results have implications for two general theories of space perception discussed in the following sections.
Experiment 1: Estimating Target Location With the BW Technique
The purpose of Experiment 1 was to examine whether different spatial layouts of the testing room effect the perceived location of a self-illuminated target viewed in the dark.
Method
Observers
Three independent groups of subjects were tested in this experiment. The testing session for each testing space took over an hour, and as the subjects were unpaid volunteer graduate students with very full schedules, it was unlikely they would return for two subsequent testing sessions. Thus, three separate groups of students were recruited and tested in each of the three testing spaces. The details of these testing spaces are described later and their spatial dimensions listed in Table 1. None of the observers had previously been tested on a BW task. All subjects were students at the Illinois College of Optometry (ICO) and had received a full eye exam within 1 year of the testing session. They self-reported monocular visual acuities of at least 20/25 and were screened for normal color vision and stereopsis. The study was approved by the ICO Institutional Review Board and was conducted in accordance with the World Medical Association Helsinki Declaration as revised in October 2008. Subjects gave written informed consent following a general explanation of the study’s purpose. Twenty observers (mean age 24.6 years, ± 1.9) were recruited and gave their informed consent to be tested in the short room (9 m in length). The mean physical eye height for this group was 1.56 m (±0.1 m). A different group of 15 visually normal ICO students (mean age 25.6 years, ±6.8) were recruited and tested in the space of medium length (11 m). The mean physical eye height for this group was 1.55 m (±0.11 m). A third group of 14 subjects was recruited for testing in the long room (18 m in length). Again, the subjects were ICO students with a mean age of 25.8 (±3.6) years with an average physical eye height of 1.61 m (±0.11 m). There was no significant difference in the eye height of the three groups (F = 0.42, p = 0.66).
Spatial Layout of the Testing Spaces.

Testing spaces
The three testing spaces differ in width as well as in length, but for convenience, they will be referred to as short, medium and long rooms. This is not meant to convey the impression that the length of the testing space offers the most compelling cues to the location of the visual horizon. The width of the space might be an important cue since the parallel lines formed by the border between the sidewalls and the floor/ceiling may provide linear perspective cues to the height of the vanishing point. The subject’s consent, ocular history, and eye height were measured and recorded in the testing space that was fully lit and clearly visible to the subjects. Subjects spent about 15 minutes in the testing space before the lights were turned off and the BW practice trials administered.
Short room
This testing space was 9.0 m × 3.8 m (Length × Width; this is the convention used for all subsequent descriptions of room dimensions). The floor was light colored 12-in. square tile. The lower two thirds of the walls were covered with wood paneling and the top third comprised of cement blocks painted pale green. The room was filled with equipment and bookshelves, which were pushed to the sides to make as much space as possible for the subjects to move comfortably. The border between the light colored floor and the room walls was of high contrast (black baseboard against white walls or wood paneling) and clearly visible in all three testing spaces.
Medium room
This space was 9 m × 11 m with white ceilings, walls, and floor. The floor was tiled with 12-in. square tiles that produced very low contrast parallel lines. This space serves as a teaching and research laboratory and is furnished with tables and chairs plus some additional equipment such as printers and desktop computers. The furniture was pushed to the side and stacked so that a wide-open area was available for all experiments. Subjects had a clear view of the artificial horizon formed between the floor and the wall directly opposite them (the far or back wall). They also had a clear view of the high contrast border between the floor and parallel sidewalls.
Long room
The third testing space was 18.62 m × 11 m that was exactly like the medium room except it was about twice as long. The tables and chairs were pushed to the side and stacked to give a wide-open space for subjects to walk. Subjects had a clear view of the high-contrast border between all walls and the floor.
BW procedure
The testing procedure for the three groups of subjects was identical. All subjects wore their habitual correction during testing, if needed. The target was a half ping-pong ball filtered red and illuminated with a penlight. This is the same target used by Ooi et al. (2001, 2006). The circular target subtended an angle 0.23° at the four testing distances of 1.5, 3.75, 5, and 6.25 m when placed at eye level. Angular subtense remained constant due to apertures that magnetically attached to the anterior portion of the tube housing the half ping pong ball and the penlight. Subjects viewed the self-illuminated targets (0.2 cd/m2) in the dark monocularly with their dominant eye, as determined by the hole in the hand method. Subjects stood at the starting point and were instructed to view the targets in darkness without moving their head. The instructions stressed the importance of not moving the head so that cues from motion parallax were eliminated. The nondominant eye was patched. Participants were asked to scan the room from far to near and the reverse, moving only their eyes to look for each target and once located, to attend to both the target’s distance and its height. They were given several practice trials without feedback. Subjects were instructed to view the self-illuminated target for as long as needed to determine the target’s perceived location, then to verbally indicate readiness to walk. At this point, the subject covered both eyes with a blindfold; the experimenter removed the target from the floor and verbally signaled permission to walk. The experimenter always stood at the same intermediate distance when communicating with the subject and music was played to mask the sounds of the experimenter moving the target and repositioning it for the next trial. The subject was instructed to walk toward the target and stop when their toes were at the remembered target distance. Veering from the straight-ahead path was minimal. Subjects indicated the target’s perceived height by either verbally stating that the target was located on the ground or by bending their knees and gesturing perceived height with the tip of the index finger. When they verbally indicated that they had marked the remembered location, a lamp was turned on so that one experimenter could make measurements of perceived distance and height, while the other walked the subject back to the starting position. The subject stayed blindfolded (both eyes) during the time the room light was on. They received no feedback regarding their judgments. The four targets were randomly presented two times each for a total of eight trials.
Results and discussion
All the statistics reported in this study were computed with a statistical software package (IBM SPSS, Version 21.0). If the analysis of variance (ANOVA) was employed to analyze the data and indicated that main effects or interaction effects were significant then planned contrasts (Helmert) were selected to determine which comparisons were significant. Best-fit linear functions were calculated using the least-squares method.
Subjects perceived the self-illuminated target to be closer than their physical distance for target distances greater than 1.5 m, for all three testing rooms as illustrated in Figure 2(a), which plots the mean and standard error. The best-fit lines for all three testing spaces have slopes less than 1.0 (gray line) indicating, as expected, that perceived target locations are underestimated when viewed in the dark. Perceived target distance for the 1.5 m target are about the same for all three test spaces, but increase as the actual test distance increases for all test spaces. Perceived target distance as a function of testing space was analyzed with a two-way, repeated measures ANOVA, mixed design, that indicated an overall significant effect of test distance, F = 228.52, p = .001, Distance × Room, F = 3.44, p = .01, and testing space, F = 6.43; p = .004. Planned comparisons (Helmert) indicated that perceived test distance increased significantly with actual test distance (p value for 1.5 m vs. the remaining three, 3.75 m vs. the remaining two, and 5.0 vs. 6.25 were all <.001). There is also a significant effect of testing space, but not at 1.5 m. Planned comparisons (Helmert) show that perceived distances measured in the short room are significantly less than those obtained from the medium and long room (p = 0.001), while those measured from the medium and long room do not significantly differ from each other (p = 0.41).
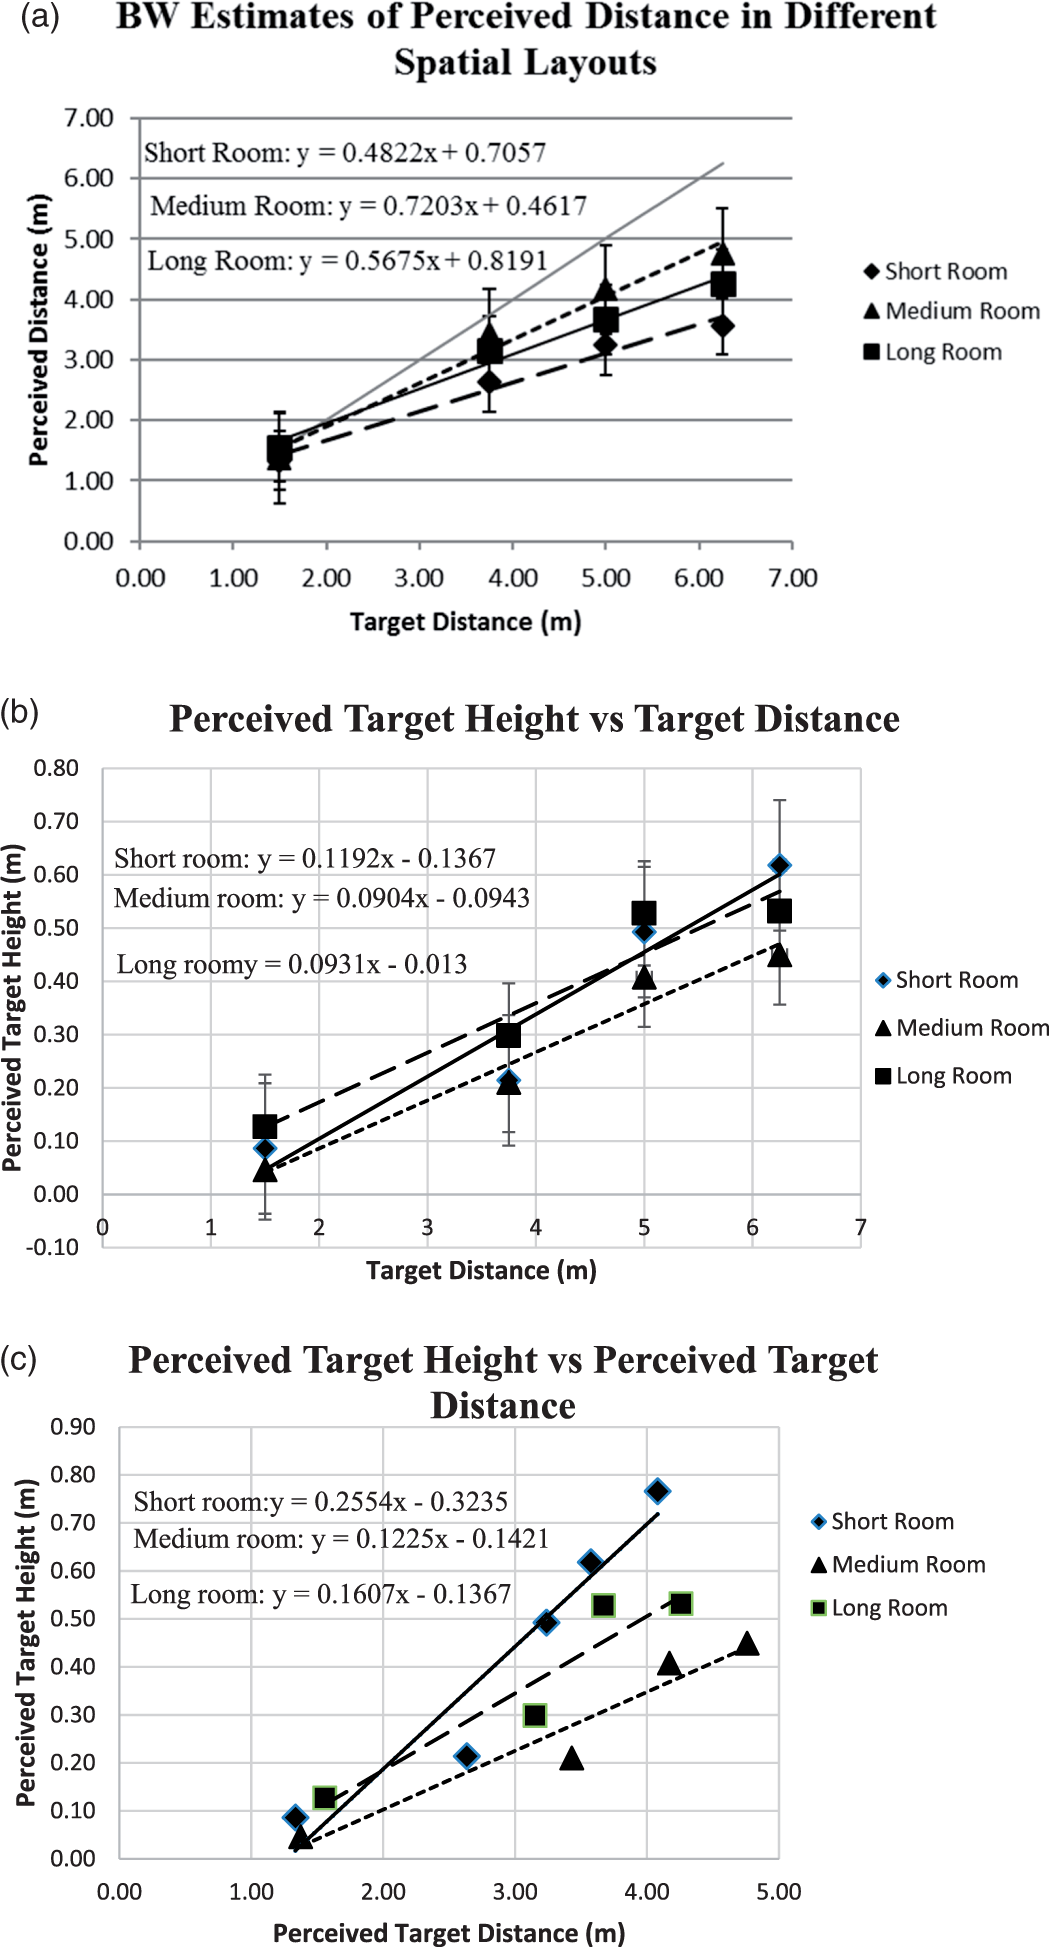
(a) Mean (±standard error) perceived target distance versus target distance. (b) Mean (±standard error) perceived target height versus target distance. (c) Mean perceived target height as a function of mean perceived target distance. Then, verse tangent of this line gives the slope of the implicit surface. BW = blind-walking.
Another way to compare the underestimates of perceived target distance is to examine the percentage of the actual target distance the subjects BW. These calculations are listed in Table 2. A score of 1.0 means that subjects BW to the actual target distance, while a score of 0.5 means they BW to half its actual distance. As can be seen, the subjects underestimated the target distance at every instance and all three target spaces, except at 1.5 m in the long room. A two-way, repeated measures ANOVA of mixed design indicated that the main effects of target distance and percent BW distance were significant, F = 31.68, p < .001; F = 2.96, p = 0.04, respectively. The interaction effect of Target distance × Test space was not significant, F = 1.85, p = 0.12. The planned contrast (Helmert) revealed that subjects walked a significantly lower percentage of the actual target distance in the short room in comparison with the two other testing spaces (p = 0.002). The percent of total distance walked did not differ between the medium and long rooms (p = 0.725). According to the geometrical arrangement illustrated in Figure 1(a), the increased foreshortening could be due to an increase in the PAoD due to an increase in perceived eye height or an increase in the height of the horizon. These differences could arise from different visual cues provided by the different testing spaces. These possibilities were tested in Experiment 2.
Percent of Target Distance That Subjects Walked or Magnitude Estimated.
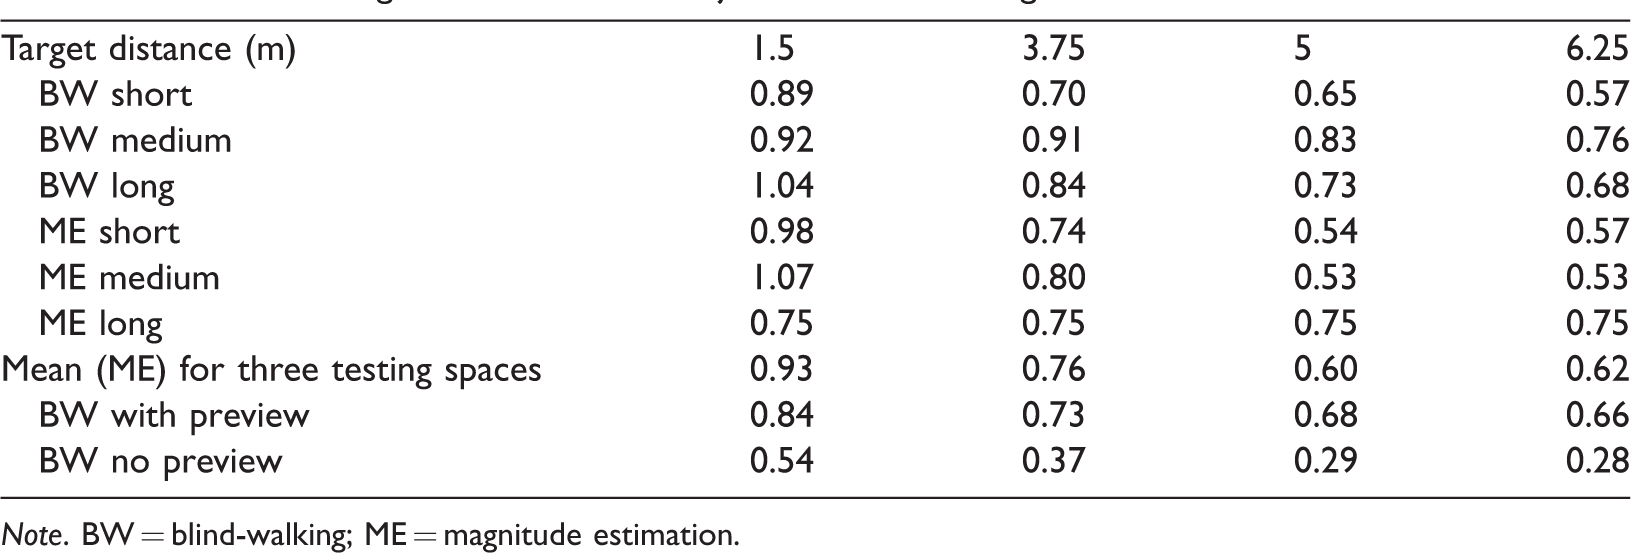
Note. BW = blind-walking; ME = magnitude estimation.
BW estimates of perceived target height, plotted in Figure 2(b), are also significantly affected by the testing space, F[2] = 9.02, p = .001, as analyzed from a two-way, repeated measures ANOVA, mixed design. As expected from previously published data (Ooi et al., 2001, 2006), perceived target height increased significantly with target distance even though all targets were located on the floor, F = 49.1, p < 0.001. Ooi and her colleagues proposed a general model of space perception in which, with full cue conditions, the perception of space is built up from integrating information from local patches of the near ground surface into a global reference frame (He, Wu, Ooi, Yarbrough, & Wu, 2004; Wu, Ooi, & He, 2004; Wu et al., 2007a; Wu, He, & Ooi, 2007b). Thus, accurate egocentric distance judgments can only be made when a relatively wide patch of the ground surface is available for visual integration. They call this the sequential surface integration hypothesis (SSIP). Of relevance to this study is their theory that an organizing ground surface is so necessary for the accurate perception of spatial relationships that in reduced cue conditions or when the ground surface is not visible, the visual system relies on an internal, default ground surface that is an inclined plane tilting upward and away from the observer (Ooi et al., 2001, 2006; Zhou, He, & Ooi, 2013). The authors called this default surface the implicit bias and hypothesized that the misperceptions of target location they observed (Ooi et al., 2001, 2006) result from the geometric arrangement shown in Figure 1(b). In this model, the target is perceived to lie at the intersection between the veridically PAoD and implicit surface explaining both the foreshortened distance and elevated target height. They propose that the slope of the implicit surface can be determined by calculating the inverse tangent of the slope of the line plotting perceived target height as a function of perceived target distance as shown in Figure 2(c). Ooi and her colleagues further hypothesize that this implicit surface reflects an intrinsic bias that functions as a frame of reference only when needed; when the characteristics of the intermediate ground plane can be built up from the information from the near ground surface, there is no need for the implicit surface to affect visual percepts. Ooi and her colleagues report a number of experiments that support the existence and use of the implicit surface in reduced cue situations (Aznar-Casanova, Keil, Moreno, & Super, 2011; Ooi et al., 2001, 2006; Wu et al., 2014; Zhou, He, & Ooi, 2010). They report the slope of the implicit surface to be somewhere between about 12° and 14° (Ooi et al., 2006; Wu et al., 2014). In this study, the computed slopes for the short, medium, and long rooms are 19.1°, 13.1°, and 9.13°, respectively. One could attribute the changes in perceived target distance in different spatial layouts observed in Experiment 1 to changes in the slope of the implicit surface. However, because the slope is not an independent confirmation of the existence of this putative surface and because no experiments in the present study were designed to confirm its existence or test this hypothesis, it will not be discussed further in this paper.
The BW data collected in this experiment can also be used to calculate the PAoD, as Ooi et al. (2006) have done if one uses the walked distance as an estimate of the perceived target distance. In other words, as shown in Figure 1(b), one can calculate the PAoD if the observer’s height and the perceived distance of the target are known. Using this method Ooi et al. (2006) concluded that the PAoD matched the actual AoD and thus the AoD was veridically perceived. The foreshortening of the perceived distance, according to their theory of space perception, is due to the visual system’s default use of the implicit surface in the dark. However, Li and Durgin (2012; Durgin, 2014; Durgin & Li, 2011) argue that the BW distance to the target location is not a true indication of egocentric distance perception. This is because their theory of space perception, the angular expansion theory (AET) proposes that the PAoD is always overestimated by a factor of about 1.5, in both full and reduced cue situations for reasons discussed later. This means that the target should always be perceived at a foreshortened distance with respect to the actual target distance. However, because this visual misperception is ever-present and consistent, the motor action of walking (in lighted environments as well as BW in the dark) has already become calibrated to the overestimated PAoD and thus reflects an adjustment or calibration of the action to the misperceived AoD. A familiar example of calibrated action to visual misinformation is the result obtained from the prism experiments conducted by Harris (1963), who along with others reported that after an adaptation period, subjects can learn to correctly make motor movements while wearing prisms that displace, reverse, or even inverse the visual world. They argue that it is the proprioceptive system that is adapting to the visual percept that remains distorted, even when the motor action has become correctly calibrated to it. The nature of the adaptation to the overestimated PAoD is described in some detail by Li and Durgin (2012), and Durgin and Li (2011) and to a lesser extent later in the General Discussion section, but in brief, it predicts that subjects will BW a longer distance to a perceived target to compensate for the underestimation of self-motion caused by the slower pattern of optic flow induced by the overestimated PAoD. The PAoD, as calculated from the BW data, is plotted in Figure 3(a), and as expected, appears veridical. The AET predicts this result but rejects the interpretation that it reflects a veridical perception of the AoD but rather as indicating that the BW action has become well calibrated to the angular misperception. This suggests that the PAoD should be measured using a nonaction task to determine if it changes with the spatial layout of the testing space and also to determine if it is systematically overestimated when viewing targets in the dark. PAoD was measured with the method of ME in Experiment 2. The perceived eye height was also measured at each test distance and in each testing space as changes in this variable may underlie the effect of testing space reported earlier.
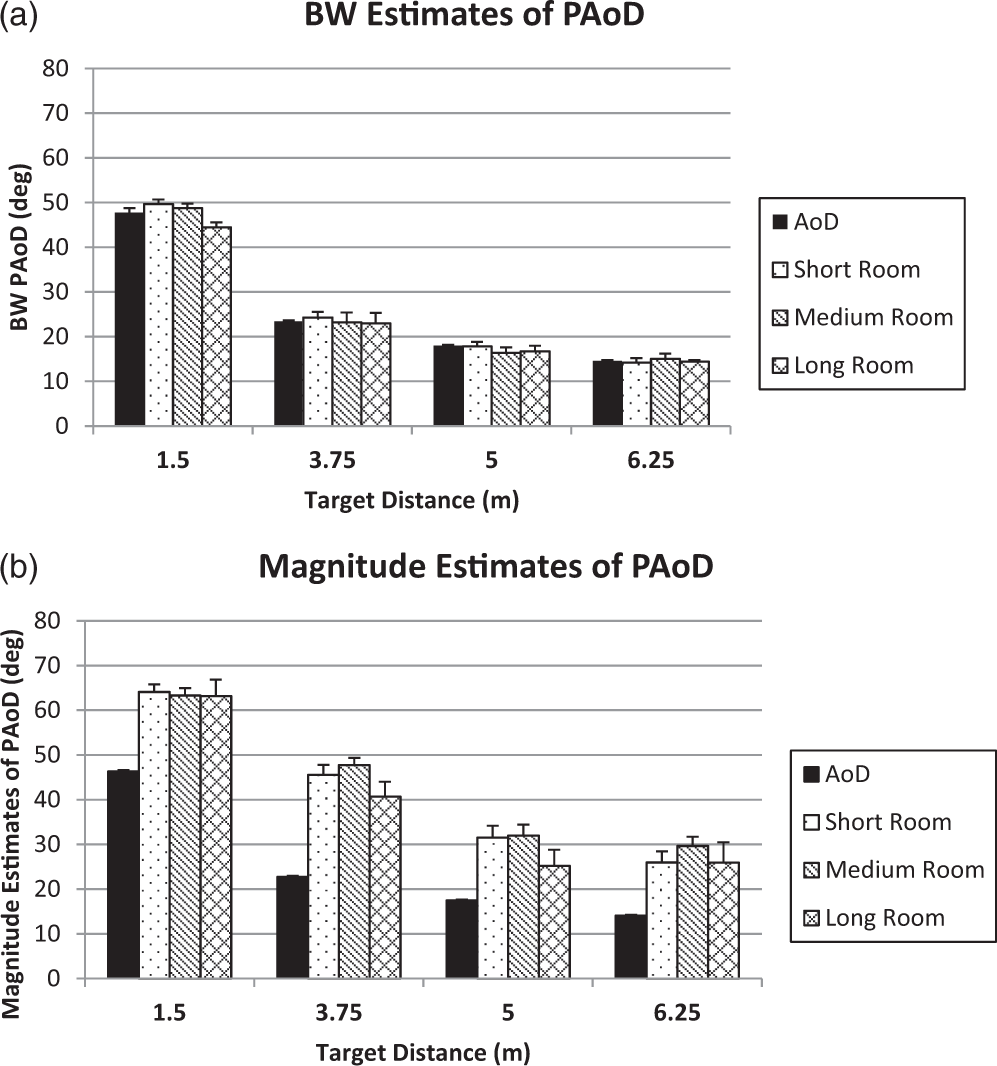
(a) PAoD calculated from BW data in the three testing spaces. The black columns in both (a) and (b) show the AoD for each test distance and testing space. (b) Magnitude estimates of the PAoD obtained for each target in each testing space. BW = blind-walking; PAoD = perceived angle of declination.
Experiment 2: Measuring PAoD and Perceived Eye Height
Experiment 2A: Measuring PAoD
Method
Observers
Because these experiments were shorter in duration than the BW experiments, multiple perceptions could be measured within all three testing spaces within a 1-hour session. Thus, the physical eye height, PAoD, and perceived eye height were measured for each subject in each testing space. The order of the testing spaces was randomized. Twelve ICO students volunteered for the study. The average age of this group was 24.91 years (±2.63) and their average eye height was 1.57 m (±0.09). All subjects had monocular acuities of at least 20/25, normal color vision, and stereopsis. All of the subjects were unpaid volunteers who were naive with respect to the specific purpose of the study. All subjects gave their informed consent as described in Experiment 1. All subjects freely observed and walked around the three different testing spaces.
Testing spaces
The medium and long rooms were the same rooms as described in Experiment 1. However, the short testing space used in Experiment 1 was demolished in a renovation so a new space was found that approximated the original short room as closely as possible. This new space had white tiled floors and white walls like the medium and long rooms. It measured 7.3 m in length × 4.3 m in width (see Table 1) and contained two tables pushed to one side to make as much open space as possible for the experiment.
Procedure
The perceived AoD was measured by asking subjects to estimate the angle they thought their eyes were making while looking at the target with respect to a reference position that was defined as the line between the eyes while looking straight ahead to the far wall. In other words, if the subjects were looking straight ahead to the far wall at eye height then there was no deviation from this reference line and thus had a value of 0°. A downward deviation from the reference line was needed to perceive the targets, and subjects were instructed to estimate the angle of this deviation from the reference line in order to see the target. The instructions stressed that they were not to estimate the angle made from the reference line to the line connecting the eyes to the target (i.e., the target’s actual AoD) but rather the angle they felt their eyes were making from the reference line to the line connecting the eyes and target. They were shown a diagram that illustrated the reference line, the 90° angle formed between the zero position of gaze (the reference line) and their toes as well as the 45° angle formed if their eyes moved halfway between the reference line and their toes.
Results and discussion
The mean magnitude estimates of the PAoD and standard errors for the four target distances are plotted in Figure 3(b). It is evident that the PAoD is greater than the AoD (black columns) for all testing spaces and all target distances, unlike the BW estimates of PAoD plotted in Figure 3(a). The overestimation of the PAoD can be quantified by calculating the gain (PAoD/AoD) for each condition and these values are listed in Table 3 for both perceptual indicators. The BW gain hovers around 1.0 for all conditions and neither testing space nor target distance affects it as determined by a two-way, repeated measures ANOVA, mixed design, F = 0.24, p = 0.79; F = 1.29, p = 0.28, respectively. In contrast, the gain is 1.5 or greater for all target distances and testing spaces measured with ME. The two-way, repeated measures ANOVA, mixed design, indicated that there was no effect of testing space on the PAoD, F = 1.37, p = 0.28, but there is a significant effect of test distance, F = 5.7, p = 0.003. Helmert’s contrast test indicated that gain at the 1.5 m target distance is significantly less than the gain at 3.75 m (p = 0.014) and 6.25 m (p = 0.03) but that gains at the other three test distances do not significantly differ from each other (p = 0.34, p = 0.23). However, the gain at 1.5 m and 5.0 m do not differ significantly from each other (p = 0.21). The gain at the 1.5 distance is the value reported by Durgin and his colleagues using very different tasks and instructions. The instructions given to subjects in his experiments direct subjects to attend to the direction of the target, while the instructions in this study focus the subject’s attention on the ocular effort needed to judge a target’s distance at a specific distance. These procedural differences may explain the overall increase in gain reported in this study versus previous reports, but does not explain the relatively lower gain observed at 1.5 m. Possibly, this is due to a slight head tilt. Although subjects were instructed to keep their head upright and only move their eyes while searching for and observing the target, we were unable to determine if this instruction was followed given the dark conditions. However, Li and Durgin (2009) measured a 2.5° forward head tilt when subjects observed a close target. Such a forward tilt may decrease the height of the line from the eye to the visual horizon and thus decrease the PAoD and reduce the gain. The larger point is that the PAoD is not perceived veridically, but overestimated when measured by ME as it was in this study.
Mean Gain (±SE).

Note. BW = blind-walking; ME = magnitude estimation.
As previously described, the SSIP and the AET have very different predictions with respect to the PAoD. The SSIP predicts that although target distance and height are misperceived, this is due to the presence of the implicit surface and not a misperceived AoD, as shown in Figure 1(b). On the other hand, the AET predicts that the PAoD will be overestimated by a factor of about 1.5 and that this fact alone can explain the distance misperceptions observed in the dark (as well as in full cue environments) without the need to invoke an implicit surface. The results of this experiment support the AET in that the PAoD was not veridical and overestimated. However, the gain of the PAoD did not significantly increase in the short room and thus cannot explain the significantly foreshortened perceived distances subjects exhibited when tested in that space. It is possible that an increase in the perceived eye height could explain this result, and this hypothesis was tested in the next experiment.
Experiment 2B: Measuring Perceived Eye Height
Subjects
The observers were the same dozen subjects described in Experiment 2A.
Testing spaces
The same three testing spaces were used as described in Experiment 2A.
Procedure
Perceived eye height was measured at each test distance in each test space by the same subjects described in Experiment 2A. A patch was placed over the nondominant eye. A tiny white light was placed at one of the randomly determined target distances in one of the testing spaces in the line of sight for the subject’s dominant eye. Once the subject was able to see this target, the experimenter moved the light either above or below this eye level. The subjects were instructed to keep their eyes level at the straight-ahead position and to wait for the white light to become level with their perceived eye level. They verbally indicated this stopping point to the experimenter. Both ascending and descending trials were administered. Subjects had one practice trial and then two test trials for each of the four target distances. Test distances were randomized within each testing space. The order of the three testing spaces was also randomized.
Results and discussion
Mean perceived eye height was lower than the actual eye height for all test distances, as expected (Stoper & Cohen, 1986) and all testing spaces as shown in Figure 4(a). The estimates of perceived eye height did not vary with testing space, F = 1.13, p = 0.35, according to a two-way, repeated measures ANOVA so the data from the three spaces were combined and plotted in Figure 4(b) to show the mean perceived eye height as a function of target distance. The ANOVA also indicated that target distance significantly affected perceived eye height, F = 13.52, p < 0.001. Helmert planned comparisons showed that perceived eye height measured at the 1.5 m distance was significantly greater than the other three distances (p ≤ .001), and the 3.75 m perceived height was significantly greater than the other two (p = .01), but the two longer target distances did not differ from each other (p = .42). Thus, the significantly decreased BW estimates of target distance obtained in Experiment 1 cannot be attributed to an increased perceived eye height that in turn would increase the PAoD according to the geometric relationships shown in Figure 1(a).

(a) The mean (±standard error) perceived eye height as measured with ME for each target distance and testing space. The actual mean subject height (±standard error) is also shown (black columns). (b) Since testing space has no effect on the perceived eye height, the data were combined and the means and standard errors plotted for each distance. ME = magnitude estimation.
Another possible explanation for the decrease in BW distance observed in the shortest testing space and with successively longer distances is that subjects make cognitive/behavioral adjustments in their BW behavior to reduce the fear of injury or embarrassment if one were to collide with the far wall of the testing space. If so, then such a cognitive, possibly unconscious behavioral adjustment would be unnecessary if the perceptual indicator posed no such physical threat. Thus, there should be no effect of testing space when ME is used as the perceptual indicator. We tested this hypothesis in Experiment 2C. In addition, the overestimated PAoD plotted in Figure 3(b) predicts that the target is actually perceived closer than its actual distance and if measured with a nonaction technique will not be corrected by a motor adaptation. Thus, these two perceptual indicators should produce different estimates of the perceived target location.
Experiment 3: Perceived Target Distance and Height Measured With ME
Method
Subjects
The observers were the same dozen subjects described in Experiment 2A.
Testing spaces
The same three testing spaces were used as described in Experiment 2A.
Procedure
The test target was the same self-illuminated red target described in Experiment 1. Within each testing space, subjects were asked to estimate the perceived distance and height of the target. The target distance was randomized and two magnitude estimates were obtained for each variable at each distance. Subjects were instructed to use positive numbers in either feet or meters and be as exact as possible. As in Experiment 1, all targets were physically located on the floor. Music was played while subjects waited in darkness for the targets to be relocated to mask auditory cues to their location. All data were converted to meters for data analysis.
Results and discussion
The results of the ME data were analyzed with a general linear model, two-way, repeated-measures ANOVA, mixed design. The data from one subject was not included for analysis (n = 11), as he misunderstood the instructions and gave smaller magnitude estimates of perceived target distance with increased target distances. Figure 5(a) plots the perceived target distance versus actual target distances determined with ME. Note that all the data points lie below the gray line with a slope of unity. As with the BW data, perceived distance is underestimated. However, unlike the BW data, there is no effect of testing space on these ME, F = 0.5, p = 0.62. The interaction effect of Testing space × Target distance is also not significant, F = 1.49, p = 0.2, indicating that the foreshortening was about the same for all distances and testing spaces, again unlike those obtained with BW. These MEs have larger standard errors than those shown in Figure 2(a) and (b). The MEs are more variable than the BW estimates, a finding that was also reported by Durgin, Leonard-Solis, Masters, Schmelz, and Li (2012). Note that the standard errors for perceived target distance increase with distance for both methods and may indicate the difficulty observers have making these judgments when the targets are located at a middle distance. Note also that the variability for perceived target height is less than for perceived distance with either method. Durgin et al. (2012) noted that when subjects were asked to verbally judge the height of poles, they did so quite accurately. Many of these subjects reported using human height as a metric for judging vertical height, but this metric may not be as accurate when applied to horizontal extents.
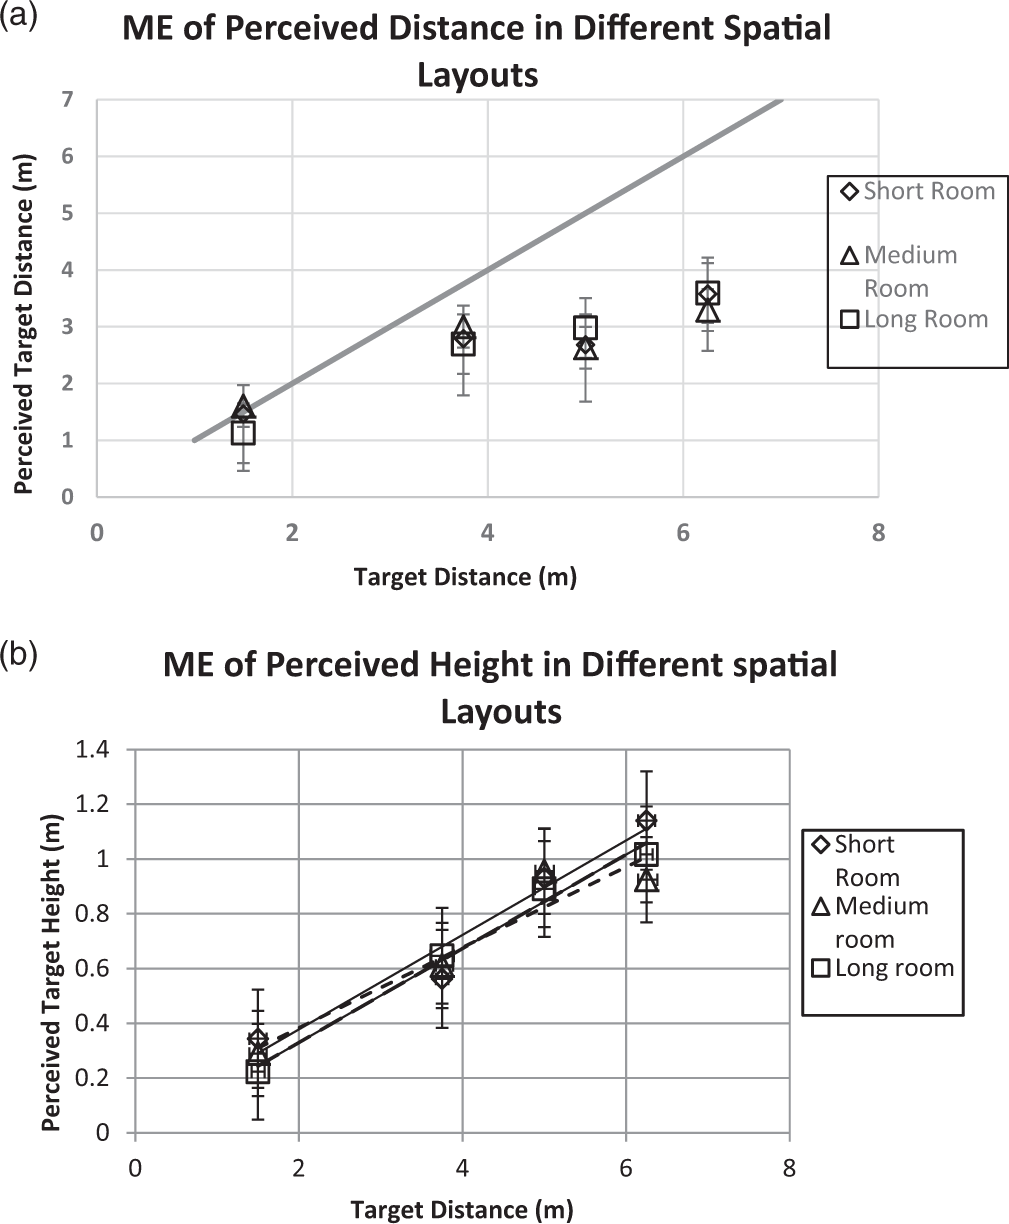
(a) Perceived mean target distance (±standard error) measured with ME as a function of testing space. (b) Perceived mean (±standard error) target height as measured by ME as a function of the testing space. ME = magnitude estimation.
Despite the lower variability, perceived target height is not veridically perceived as can be seen in Figure 5(b), similar to the results obtained with BW (Figure 2(b)). The target is seen to float higher in the visual field the farther away its physical distance, even though it is always located on the floor. Similar to ME of perceived distance, perceived target height measured with ME is not affected by the testing space, F = 0.34, p = 0.71.
The foreshortening of perceived distance measured by ME was also quantified as in Experiment 1, by calculating the percentage of the total target distance the subject estimated the target to be located. These percentages are listed in Table 2 and can be compared with the values obtained from BW. Recall that subjects BW significantly less (or foreshortened significantly more) in the shorter room and as the target distance increased. However, this pattern was not observed with the ME data. A two-way, repeated measures ANOVA, mixed design indicated that there was no effect of testing space on the ME of perceived distance, F = 0.34, p = 0.72; thus, the data from the three spaces were combined and the averaged distance walked is listed in Table 3. These results support the hypothesis that subjects may have BW significantly less in the short room because they were afraid of colliding with the far wall, not because they actually perceived the target to be closer. Experiment 4 is another test of the hypothesis that subjects can adjust their BW behavior depending upon their assessment of physical risk in different testing spaces.
Experiment 4: The Effect of Previewing the Testing Space Versus No Preview on Perceived Target Location Measured With BW
Two new groups of observers were recruited. One group of observers freely viewed and walked around the testing space, as did the subjects in the first two experiments. The second group of subjects was not allowed to preview the testing space. Both groups estimated the perceived target location (i.e., its distance and height) via the BW technique. It was predicted that if cognitive factors relative to subject safety were employed then subjects would BW longer distances to estimate perceived target location in a long testing space where they were confident they would not collide with the front wall of the testing room. On the other hand, if they were not allowed to preview the testing space and were told that it could be either long or short, they may take a more conservative approach and BW shorter distances since that would be the safer strategy.
Method
Observers
Two groups of subjects participated in this experiment. The 13 subjects in the Preview group had an average age of 25.8 yrs. (±3.58). The 11 subjects in the No Preview group were not allowed to see the testing space before or during the testing session. The mean age of this group was 24.7 years (±0.2). All subjects were ICO students and met the visual requirements listed in Experiment 1.
Testing spaces
The long room was used in this experiment (see Table 1). It was a lab space that could be open or divided as needed. All students had experienced the room in its open figuration where it was 9 m wide and about 18 m long as well as when a solid, moveable wall divided it such that the dimensions of each space were about 9 m wide × 9 m long. For this experiment, the room was always in its open configuration. All tables and chairs were pushed to the sides of the lab space to allow a wide area for walking. There was no obstruction between the subject and the far back wall.
Procedure
The Preview group was allowed to view the long room during the time it took to explain the study, obtain informed consent, measure eye height, and perform the visual screening tests. They were fully aware that this room was where the testing would occur. The Preview group was obviously aware that the room was fully open and freely viewed the 18 m length. However, the No Preview group reported for the testing session in a lab space adjacent to the long room and in this space, informed consent was obtained, eye height measured and the vision screening tests administered. After this, the No Preview subjects were told that they would be tested in the adjacent lab space (the long room) but that the lab space could be in its open configuration or closed. In other words, we did not specify which configuration would be in place during the testing session. We specifically mentioned, however, that subjects were in no danger of a collision with the back wall while they were BW, regardless of the configuration. In fact, the lab space was open for both groups. After informed consent was obtained, eye height measured and the screening tests completed, subjects in the No Preview group were blindfolded while escorted into the dark testing space. The experimenters used a small, dim penlight to navigate themselves and the subject to the starting position. Observers were allowed to remove the blindfold, view one of the self-illuminated targets used in Experiment 1, and have a few practice trials judging target distance and height while BW. For both groups, the testing procedure was identical to that described in Experiment 1. Unlike Experiment 1, however, subjects were escorted back to the starting point (while blindfolded) then asked to remove the blindfold and estimate the PAoD of the target they had just BW to, using the procedure described in Experiment 2A.
Results and discussion
The mean perceived target location versus target distance is plotted in Figure 6 for both the Preview and No Preview conditions. Subjects in both groups clearly underestimated the target’s perceived distance but did so significantly more when they were unaware of the spatial layout of the testing room. A two-way repeated measures, mixed design ANOVA used to compare the data showed that the effect of previewing the testing space significantly lengthens the perceived distance estimates of the targets, F = 48.04, p < 0.001. The foreshortening of perceived target distance is also quantified in Table 2 where the percent of target distance the subjects BW is listed.

Mean (±standard error) perceived target distance with (circles) and without (squares) knowledge of the spatial layout of the testing space. BW = blind-walking.
These data indicate that when subjects are unaware of the length of the testing space, they walk less than half the distance they do when they are aware of the testing room’s configuration. Are these differences in foreshortened estimates the result changes in the PAoD? Figure 7 plots PAoD with and without previewing the testing space. The PAoD goes down as target distance is increased, as expected, but note that it is always greater than the actual AoD. A two-way repeated measures ANOVA, mixed design, confirms that the PAoD is unaffected by whether subjects preview the testing space or not, F=0.83, p = 0.37. The calculated gain, listed in Table 3, is also the same whether the subject has previewed the testing space or not, F = 0.00, p = 0.98, according to a two-way, repeated measures ANOVA. The gain is statistically the same at all target distances, F = 3.8, p = 0.06. The mean gain, averaged across all test distances and both testing conditions is 1.81. Thus, a change in this variable is not responsible for the significantly foreshortened BW estimates obtained when subjects were tested in the No Preview condition. As discussed earlier, it is possible that subjects make cognitive adjustments to prevent collisions when the BW technique is used.

PAoD (±standard error) with and without preview of the testing space. PAoD = perceived angle of declination.
General Discussion
As expected based on previous studies, the perceived distance of ground-based targets viewed in the dark is underestimated, while target height is overestimated. However, this is the first study to report that the foreshortening of target distance and the misperceived height vary with the spatial dimensions of the testing space. However, this effect of testing space is not observed when ME is the perceptual indicator. The self-illuminated targets viewed in darkness were judged significantly closer and higher in the visual field when viewed in the shortest testing room and farther away and lower in height when measured in longer rooms. Although a number of visual cues in the environment might affect the PAoD such as linear perspective (and hence the height of the vanishing point) and height of the visible horizon, the results from Experiment 2A and Experiment 2B do not support this hypothesis. Direct measurements of these two variables at each target distance were unaffected by the layout of the testing space.
However, the results of this study do not eliminate the possibility that the environment can affect distance perception, but rather reveal that in this particular case, that the spatial environment does not affect perceived eye height or the PAoD. Other studies have shown that changes in the visual environment such as the height of the vanishing point or the height of the visible horizon significantly affect estimates of perceived distance as described in the Introduction. We did not measure the perceived height of the visible horizon or vanishing point. It is also possible that the difference between the relevant perceptual variables across the three testing spaces were too minor to significantly affect distance judgments.
As described earlier, another explanation of the effect of testing space is the risk assessment subjects might make when asked to BW to targets in short rooms or when they are located relatively far from the subject. The risk of colliding with either the side walls or the frontal wall are greater with a narrow, shorter room than with wider, longer rooms, and thus subjects may simply make a cognitive adjustment to avoid risk of injury or embarrassment. This simple explanation seems to be the case for two reasons: first, there is no effect of testing space when ME is used to estimate target location rather than BW; and second, when subjects are unsure of the spatial dimensions of the testing space, they significantly foreshorten the amount they BW. Perhaps another indication that subjects make this kind of cognitive adjustment is the decrease in variability of distance judgments when subjects are not allowed to preview the testing space (Table 2). When subjects are allowed to preview the testing space, they can make individual assessments of personal risk that vary widely. However, when the personal risk cannot be assessed as in Experiment 3, then most subjects seem to adopt a more conservative strategy hence the lower variability. Obviously such risk assessments are unnecessary when perceptual judgments are made with the ME technique.
The larger implication of these results is that the BW technique may not be an accurate indicator of spatial perception. The results of this study support Durgin and Li’s (2011) contention that BW behavior has become calibrated to the visual misperceptions caused by systematic and consistent overestimations of PAoD and thus cannot accurately assess where the subject actually perceives target location. They propose that the overestimation of the PAoD is part of a coding strategy concerned with precisely representing angular variables that are useful for the control of action (Durgin, 2014; Durgin & Li, 2011; Li & Durgin, 2012, Li, Phillips & Durgin, 2011). The AET predicts that in the dark, subjects will also overestimate the PAoD and thus perceive the targets closer to the observer than the distance indicated by BW. Their explanation is that the overestimation of the PAoD causes the optical flow to be slower than the physical optical flow causing subjects to underestimate the speed of their self-motion. Thus, they will actually walk longer than their visual perception of target location indicates, but will be unaware of this since they have become adapted to the mismatch between perceived and physical optical flow. The additional distance walked means that when subjects gesture the perceived height of the target, it will fall close to the physical AoD for the target, since there is a concurrent misperception of both PAoD and walked distance (Durgin, 2014). Durgin (2014) offers a number of examples where action measures such as walking or tossing an object fail to show any systematic perceptual error because these misperceptions are stable and our actions have become calibrated to it. He also reported experimental evidence that subjects will overestimate frontal distances but seemingly accurately perceived egocentric distances along the ground which again demonstrates the point that BW behavior can appear quite accurate, even though distance perception and the PAoD are misperceived (Li et al., 2013).
BW is not the only perceptual measure that is affected by nonperceptual factors. Durgin and his colleagues have noted that athletes make more accurate verbal estimates of egocentric distance along the ground plane than nonathletes for distances greater than 10 m. However, athletes demonstrate the same systematic perceptual biases that nonathletes show when perceptual matching tasks were employed (Durgin et al., 2012). In addition, Durgin and Li (2011) reported that golfers gave improved egocentric distance matches compared with nongolfers even though both groups overestimated the PAoD by a factor of about 1.5. In these cases, although the angular misperception was still present, the actions of the athletes were informed by exposure to, experience with, and or feedback from the local environment. As a result, their action measures were more accurate than nonathletes whose misperceptions were similarly present, but not overridden or influenced by cognitive factors. A similar interpretation can be applied to the results of this study. Although the PAoD was assumed to be always overestimated, and thus cause the foreshortened perception of target distance, cognitive factors can override this and in the case of BW in the dark, increase the perceived foreshortening even more, for safety’s sake.
In summary, these results suggest that BW, like ME, can be affected by nonperceptual factors such as his or her estimate of personal risk that the BW task entails in any given situation. In addition, the results support the AET in that the PAoD was systematically overestimated when measured directly by the ME procedure and lends additional credence to the theory’s assertion that BW is an action measure that has become calibrated to the overestimation of the PAoD. Finally, despite the many environmental visual cues that may affect perceived eye height and the height of the horizon below eye level, both variables were unaffected by changing the spatial layout of the testing space.
Footnotes
Declaration of Conflicting Interests
The author(s) declared no potential conflicts of interest with respect to the research, authorship, and/or publication of this article.
Funding
The author(s) disclosed receipt of the following financial support for the research, authorship, and/or publication of this article: the author gratefully acknowledges the funding received from ICO's Research Allocation Committee to carry out these experiments.