



Abstract
It is debated whether perceptual expertise of nonface objects, such as visual words, is indicated by holistic processing, which is regarded as a marker of perceptual expertise of faces. We address this question by frequency-tagged electroencephalography. Different parts of real or pseudo Chinese characters are presented at distinctive frequencies (6 or 7.2 Hz), which induce frequency-tagged steady-state visual-evoked potentials at occipital brain areas. The intermodulation response (e.g., 6 + 7.2 = 13.2 Hz) would emerge when holistic integration takes place. Our results suggest that the intermodulation response to the real characters is left lateralized, which is contralateral to previous findings with faces. Furthermore, at the left occipital area, the intermodulation response to real characters is more prominent than pseudo characters, suggesting that holistic integration is enhanced for real characters than for pseudo ones. Taken together, our findings suggest that holistic integration is potentially a general expertise marker for both faces and non-face objects.
Keywords
Introduction
Humans are experts in recognizing objects such as faces. Holistic processing, which describes the phenomenon that perception of an object is more than the sum of parts, has been considered as a marker of face expertise (e.g., Rossion, 2013; but see Gold et al., 2012). It is under debate whether holistic processing is an expertise marker only for faces (e.g., Robbins & McKone, 2007; see McKone et al., 2007 for a review), or a general marker for both faces and other objects (e.g., Burns et al., 2019; Diamond & Carey, 1986; see Bukach et al., 2006 for a review). For instance, given that most people are experts in recognizing visual words, it is still controversial whether the perception of words involves holistic integration. On one hand, the processing of visual words has been traditionally considered as part-based or letter-based, suggesting that identification of a word is equivalent to the identification of component letters (Farah et al., 1998; Johnston & McClelland, 1980). Some studies also showed a reduction in holistic perception in experts of letters or characters (Hsiao & Cottrell, 2009; Van Leeuwen & Lachmann, 2004). On the other hand, recent studies found that experts did show increased holistic processing in the processing of alphabetic English words (Wong et al., 2011) as well as nonalphabetic Chinese characters (H. Chen et al., 2013; Wong et al., 2012, 2019).
These inconsistent results may in part due to their use of different behavioral paradigms (see discussion in Wong et al., 2012). An implicit measurement that does not rely on observers’ subjective responses could be a favored approach in this situation. This study, therefore, used an implicit and objective neural measurement of holistic integration (Boremanse et al., 2013). This paradigm utilized frequency-tagged SSVEPs (i.e., the steady-state visual-evoked potentials) to examine holistic integration in human observers. SSVEPs are oscillatory brain responses to periodic visual stimulations (see Norcia et al., 2015 for a recent review). When two parts of an object are displayed periodically at two distinctive frequencies (f1 and f2), SSVEP responses are observed not only at fundamental frequencies f1 and f2 but also at intermodulation frequencies such as f1+f2 (in general, nf1 ± mf2, where n and m are integers). Such intermodulation responses cannot be explained solely by the inputs at f1 and f2 but can only be a result of nonlinear interactions between the input frequencies (Regan & Regan, 1988; see Gordon et al., 2019 for a recent review). By employing the frequency-tagged SSVEP technique, previous studies showed that the intermodulation response was observed when parts were bound into holistic representations such as faces (Boremanse et al., 2013, 2014), Gestalt formation (Aissani et al., 2011; Alp et al., 2016; Gundlach & Müller, 2013), and newly learned shapes (Vergeer et al., 2018). For example, Boremanse et al. (2013) frequency-tagged the left and the right half of face stimuli at different frequencies. They found that intermodulation responses were stronger for normal face stimuli compared with conditions where the face was inverted or the halves were misaligned or separated. Therefore, the intermodulation response in electroencephalography (EEG) frequency tagging is an objective and robust neural signature of holistic integration.
This study frequency-tagged the two halves of Chinese characters to test whether holistic integration can be observed. To make sure that stimuli in the left and right visual fields are perfectly balanced, we chose to use some special Chinese characters composed of two identical parts at the left and the right side (e.g., 林, which means forest). The use of symmetric characters also ruled out a potential confounding factor (i.e., stimulus symmetricity) in our experiment, as previous studies have shown that symmetric and nonsymmetric visual stimuli produced distinctive EEG responses (e.g., Makin et al., 2014, 2016; Norcia et al., 2002; see a review in Bertamini & Makin, 2014). The two sides of each character were periodically flickering at two distinctive frequencies (6 Hz and 7.2 Hz), which induced SSVEP responses at the fundamental frequencies as well as intermodulation frequencies. We tested both real Chinese characters and pseudo ones. Note that we did not choose to manipulate the spatial separation or relative alignment as Boremanse et al. (2013) did because separation or misalignment, which shifts the components away from the center into the periphery, may reduce the base SSVEP response. If base responses were found to be different between experimental and control conditions, any effect observed for intermodulations would be difficult to interpret, which could be either due to experimental manipulation or driven by the base responses (Gordon et al., 2019). To avoid such contamination, we instead chose to compare real and pseudo characters. If the visual processing of characters is holistic, we would expect enhanced intermodulation SSVEPs in real characters compared with pseudo ones. If the processing of characters is not holistic, we would instead expect comparable or even reduced intermodulation SSVEPs in real characters than pseudo ones.
Materials and Methods
Participants
Twenty observers (9 females and 11 males, average age = 21, range = 19–24) participated in the experiment. They were all right-handed and native Chinese speakers. They had no known neurological deficits and had normal or corrected-to-normal visual acuity. They signed written informed consent forms in agreement with the Declaration of Helsinki. The study was approved by the local ethics committee.
Apparatus and Stimuli
Stimuli were programmed with the Psychophysics Toolbox (Brainard, 1997; Pelli, 1997) in Matlab (Mathworks, Natick, Massachusetts, United States), displayed on a 144-Hz, 24-in. monitor. The monitor had a resolution of 1,024 × 768 pixels, extending 51° × 38° at a viewing distance of 56 cm.
Figure 1A shows the stimuli, which were 10 characters formed by identical components at the left and right side. The five real characters were meaningful Chinese characters (i.e., forest, double, friend, feather, follow, respectively), whereas the five pseudo characters did not have any meaning. The real and pseudo characters were matched in terms of the numbers of strokes (7.2 vs. 7.6 on average) and the occurrence frequency of the subcomponents (based on Cai & Brysbaert, 2010). The subcomponents were all real characters. The occurrence frequencies of subcomponents of the real characters were as follows: 木 (wood, 105 per million), 又 (again, 761), 月 (month, 356), 习 (learn, 172), and 人 (person, 7,919). The occurrence frequencies of subcomponents of the pseudo characters were as follows: 左 (left, 110), 士 (soldier, 683), 反 (reverse, 340), 千 (thousand, 170), and 个 (individual, 9,669).

Stimuli. A: The Real (Upper Row) and Pseudo (Lower Row) Chinese Characters used in the Experiment. B: During the Experiment, Each Side of the Character was on–off Flickering at 6 Hz or 7.2 Hz (Balanced Across Trials).
In the experiment, each character was displayed in the central area of the screen (about 10° × 10° in visual angle). The character was on–off flickering (Figure 1B) to induce SSVEP responses. In half of the trials, the left side was flickering at 6 Hz, and the right side was flickering at 7.2 Hz. For the other half of the trials, instead, the left side was flickering at 7.2 Hz and the right side flickering at 6 Hz.
Procedure
Each trial started with a fixation dot (diameter = 0.5°) in the center. The subject was asked to press the spacebar on a keyboard to initiate the trial. The fixation dot disappeared after 0.3 to 0.5 seconds following the button press. Then, one character was displayed for this trial, which kept flickering for 30 seconds. We chose to use long durations to increase the signal-to-noise ratio (SNR) in SSVEP responses, which is a typical choice in SSVEP studies (e.g., Boremanse et al., 2013). The subject was required to maintain fixation at the center during this period (i.e., a passive view task, see also in J. Chen, McManus, et al., 2019; J. Chen et al., 2017). After each trial, the subject could take a break and start the next one at their own pace. The total number of trials was 20, 10 with real characters and 10 with pseudo ones (Figure 1A). Each trial contained only one character, and each character was presented in two trials to balance flickering frequencies at the left and right sides (Figure 1B). The order of trials was randomized. The experiment lasted about 20 minutes including break time.
EEG Recordings and Analyses
In the experiment, the EEG was recorded from 30 passive electrodes according to the international 10 to 20 system (FP1, FP2, F7, F3, F4, F8, FC5, FC1, FC2, FC6, T3, C3, C4, T4, CP5, CP1, CP2, CP6, T5, P3, P4, T6, PO3, PO4, O1, O2, Fz, Cz, Pz, and Oz). Signals were amplified with a portable wireless amplifier (NeuSen Wireless EEG Acquisition System; Neuracle, Beijing, China) at a sampling rate of 250 Hz. Electrode impedances were kept below 5 kΩ.
Functions from the EEGlab toolbox (Delorme & Makeig, 2004) and customized scripts in Matlab were used for data analysis. EEG signals, which were online referenced to the electrode of CPz, were rereferenced to the average reference. We did not conduct any additional preprocessing (e.g., see also in Boremanse et al., 2013; Rossion & Boremanse, 2011) because SSVEP responses have high SNRs and are relatively unaffected by artifacts (Norcia et al., 2015). As each trial lasted 30 seconds, 30-second epochs were extracted from EEG signals. The epoch was detrended by removing the linear fit (Bach & Meigen, 1999) and multiplied by a Tukey window function (i.e., tapered cosine window, α = .02). The windowing procedure ensured that there was no abrupt onset and offset in the signal. Fast Fourier transformation (fft.m in Matlab) was applied to the epoch to obtain the amplitude spectrum. When calculating the SSVEP response at a given frequency, we considered the peak response at exactly the stimulation frequency relative to the baseline at nearby frequencies (Lithfous & Rossion, 2018; Liu-Shuang et al., 2016). For example, when calculating the SSVEP at 6 Hz, the average amplitude in the range of [5.5, 6.5] Hz (6 Hz and its two immediately adjacent bins were excluded) was used as the baseline. Finally, the SNR of the SSVEP response was computed by taking the peak response value and dividing it by the baseline. As the responses were confined to the three occipital electrodes O1, Oz, and O2 (Figures 3A and 4A), only SSVEPs at these electrodes were used for statistics. Note that occipital distribution of SSVEPs was generally observed in a lot of previous studies, and it is common practice to use only these occipital electrodes for analysis (e.g., Andersen et al., 2015; J. Chen et al., 2017; J. Chen, Valsecchi, et al., 2019).
Results
We measured frequency-tagged SSVEP responses to real and pseudo Chinese characters formed by two halves at the left and right sides. The two halves were flickering at two different frequencies (f1 = 6 Hz, f2 = 7.2 Hz). Figure 2 shows the grand-average amplitude spectrum of all conditions. There were clear responses at the fundamental stimulation frequencies and several harmonics, up to the fifth harmonics (5 × f1 = 30 Hz, 5 × f2 = 36 Hz). As the fifth harmonic of f2 overlapped with the sixth harmonic of f1, both at 36 Hz, we included only four harmonics for further analysis. For intermodulation responses, we analyzed various frequencies (nf1 ± mf2, where n and m are integers) following previous studies (e.g., Vergeer et al., 2018). At f2−f1 = 1.2 Hz, there was no clear response in the spectrum (Figure 2). Indeed, neither the SNR of real characters (mean = 1.02, standard deviation = 0.17) nor that of pseudo characters (mean = 1.00, standard deviation = 0.20) was significantly larger than 1, t(19) = 0.52, p = .61, and t(19) = −.032, p = .98, respectively. The response at f1+f2 = 13.2 Hz was significant (reported later). We also checked responses at higher order intermodulation frequencies (e.g., 2f1−f2, 2f2−f1, etc.), none of which came out as significant.

Amplitude Spectrum (A) and Signal-to-noise Ratios (B) Averaged for Occipital Electrodes (O1, Oz, and O2) of all Conditions. The response peaks are clear at base frequencies (f1 = 6 Hz, f2 = 7.2 Hz) and their harmonics. There is a small response at the intermodulation frequency f1+f2 = 13.2 Hz. There are no clear responses at other intermodulation frequencies (e.g., f2−f1).
SSVEP Responses at Base Frequencies
SSVEPs were observed at base frequencies (6 Hz and 7.2 Hz) and their harmonics. We calculated the SNR of the peak response relative to the noise at neighboring bins and took the average SNR of four harmonics. Figure 3A and B shows the topographic plots and the amplitude spectrum. Figure 3C shows the SNRs for real and pseudo characters as a function of electrode locations. A 2 (Type of Characters: Real vs. Pseudo) × 3 (Electrodes: O1 vs. Oz vs. O2) repeated-measures analysis of variance (ANOVA) revealed a main effect of electrodes, F(2, 38) = 4.76, p = .017,

SSVEP Responses at Base Frequencies (6 Hz and 7.2 Hz). A: Topographic Plots for Real and Pseudo Characters. Responses were Confined to Occipital Electrodes. B: The Amplitude Spectrum Averaged from O1, O2, and Oz Electrodes, Showing the Response Peaks at 6 Hz and 7.2 Hz. C: Average SNRs (of Four Harmonics) as a Function of Character Type and Electrodes. Error Bars Denote Standard Error of the Mean. SNR: Signal-to-noise Ratio.Note. Please refer to the online version of the article to view the figure in colour.
SSVEP Responses at Intermodulation Frequency, f1+f2
We found that there were SSVEP responses at the intermodulation frequency, f 1+f 2 = 13.2 Hz. The response was located at occipital electrodes (Figure 4A). Figure 4B shows that there are peaks at 13.2 Hz for both real and pseudo character conditions. Figure 4C plots the SNRs of intermodulation responses. The average SNR over three occipital electrodes was larger than 1 for both real characters, mean SNR = 1.22, t(19) = 5.34, p < .001, and for pseudo characters, mean SNR = 1.17, t(19) = 7.18, p < .001. A 2 (Type of Characters: Real vs. Pseudo) × 3 (Electrodes: O1 vs. Oz vs. O2) repeated-measures ANOVA over the SNRs showed that there was no significant main effect of character type, F(1, 19) = 1.69, p = .21,
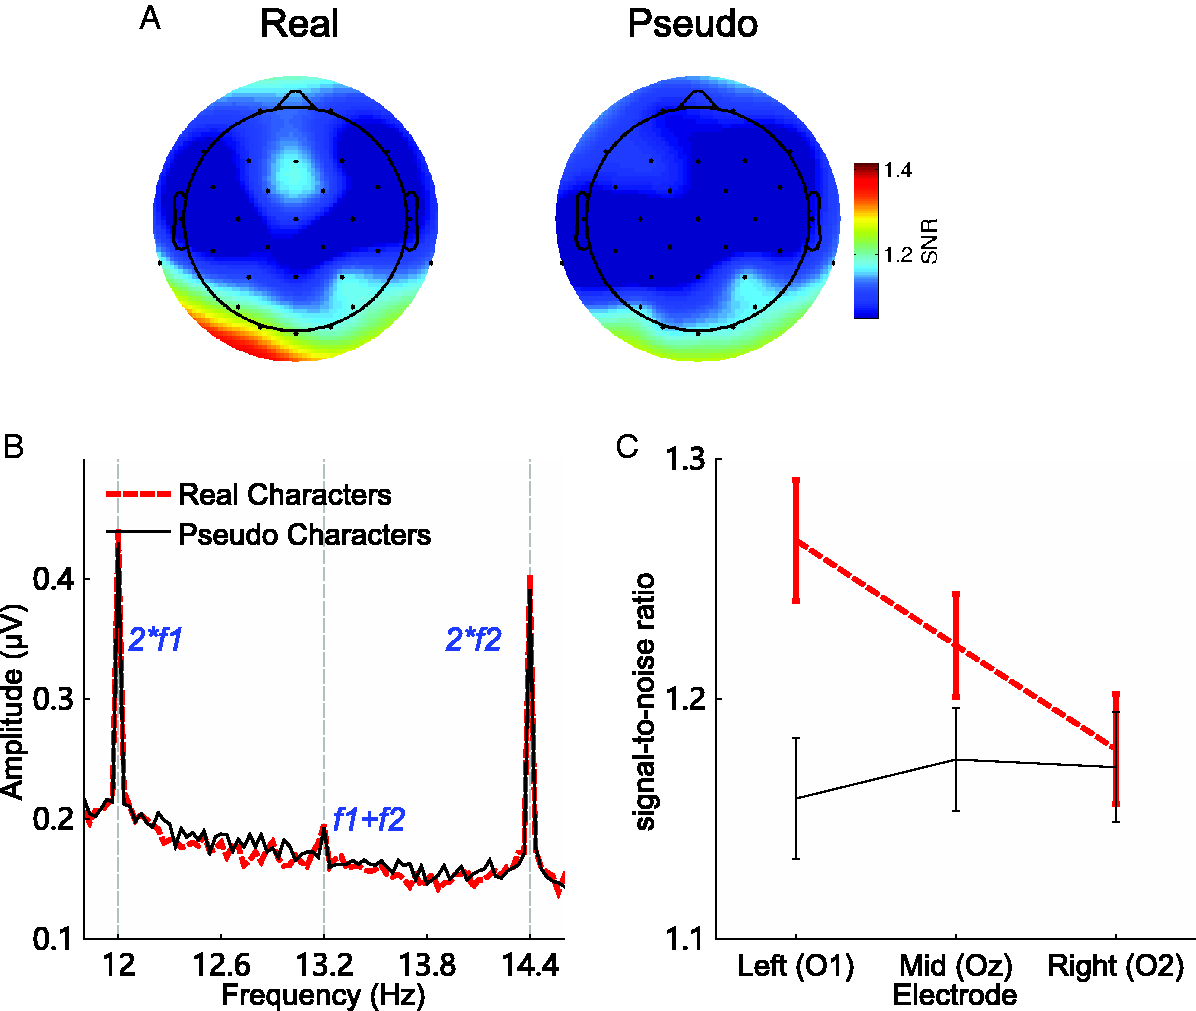
Intermodulation Responses at f1+f2 = 13.2 Hz. A: Topographic Plots for Real and Pseudo Characters. Responses were Confined to Occipital Electrodes. B: The Amplitude Spectrum Averaged from O1, O2, and Oz Electrodes, Showing the Peak at Intermodulation Frequency, f1+f2 = 13.2 Hz. The Peaks at 12 Hz and 14.4 Hz were the Second Harmonic of Base Frequencies. C: SNRs at Intermodulation Frequency as a Function of Character Type and Electrodes. Error Bars Denote Standard Error of the Mean. SNR: Signal-to-noise Ratio.Note. Please refer to the online version of the article to view the figure in colour.
The aforementioned analysis integrated SSVEP responses over 30 seconds in each trial. A further question was how stable the effect was over such a long trial duration. We, therefore, analyzed the intermodulation response at f 1+f 2 = 13.2 Hz with short time windows (5 seconds). The choice of 5-second window ensured that we had just enough frequency resolution (1/5 = 0.2 Hz) to capture the response at 13.2 Hz. The analysis procedure was the same as described earlier. Figure 5 shows the SNRs at O1, Oz, and O2 electrode over each time window. A 2 (Type of Characters) × 3 (Electrodes) × 6 (Time Windows) repeated-measures ANOVA over SNRs revealed a significant main effect of character type, F(1, 19) = 7.27, p = .014,
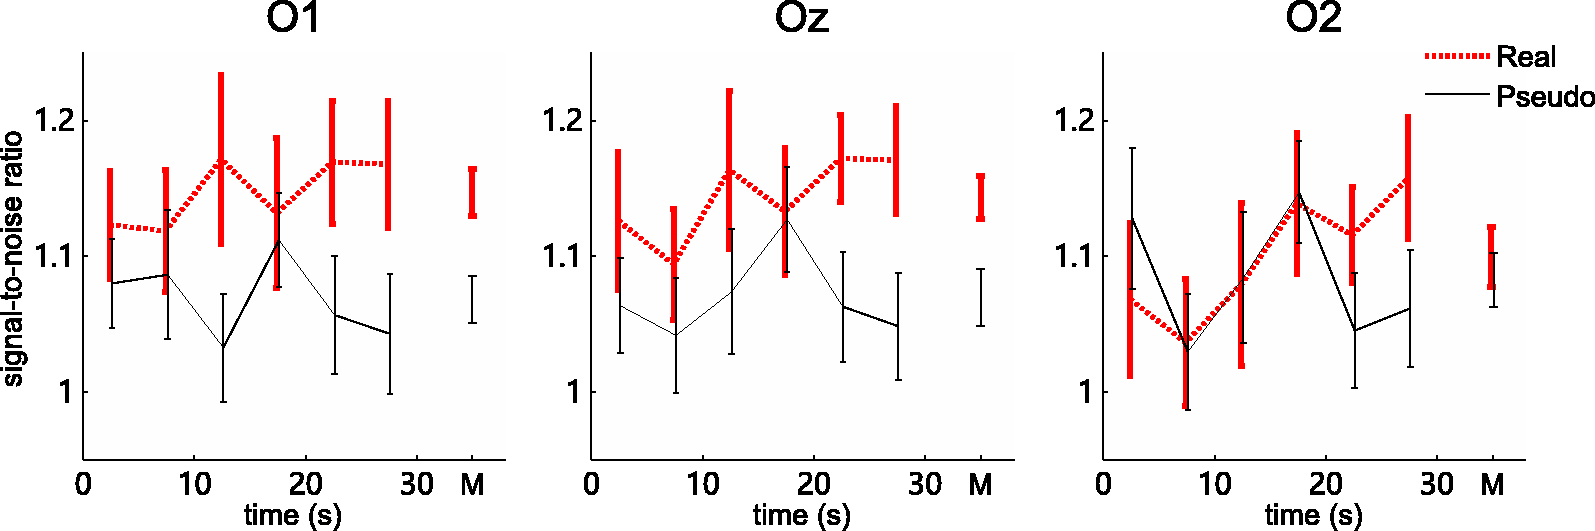
Intermodulation Response (SNR) at f1+f2 = 13.2 Hz Analyzed at Each 5-Second Time Window, Separately for O1, Oz, and O2 Electrode. The Bars at the Right Side in Each Subplot Show the Mean Overall the Time Windows. There were enhanced intermodulation responses for real than pseudo characters at O1 and Oz electrode. The effect was relatively stable over time.Note. Please refer to the online version of the article to view the figure in colour.
These results revealed enhanced intermodulation responses for real characters than pseudo ones. Also, it suggested that the intermodulation response was relatively stable over time.
Discussion
This study measured frequency-tagged SSVEP responses to real and pseudo Chinese characters. The two halves of each character were flickering at two different frequencies (f 1 = 6 Hz, f 2 = 7.2 Hz). The main observation is that real characters compared with pseudo ones elicited enhanced SSVEP responses at intermodulation frequency f 1+f 2. As intermodulation responses are produced by nonlinear interactions between input frequencies (Regan & Regan, 1988), the result suggests that the intermodulation SSVEPs in real characters most likely represent holistic integrations of parts in the processing of visual words.
Our further analysis showed that the intermodulation response was relatively stable over the 30-second trial duration (Figure 5). Even though most previous studies examining intermodulations adopted long trial durations (from seconds to minutes), few had analyzed the temporal dynamic. To our knowledge, the only exception is Aissani et al. (2011). They investigated intermodulation responses produced by pairs of bars moving as a group and found sustained and stable responses over the 1-second stimulation duration. Consistent with Aissani et al.’s (2011) result, this study further showed that intermodulation responses could be stable at an even larger time scale up to half a minute. It seems that the intermodulation as a marker of holistic integration is relatively robust to fluctuations in attention or fatigue throughout the trial.
An alternative explanation for the enhanced intermodulation response could be that observers may have paid more attention to real characters than pseudo ones. The attention account, however, is unlikely to be the case. In the literature, it is generally found that increased attention to the target stimulus would increase the SSVEP response at the driving frequency (Morgan et al., 1996; see reviews in Andersen et al., 2011; Norcia et al., 2015). Numerous studies have been utilizing SSVEP responses at the driving frequencies as an index of attentional deployments (e.g., Müller & Hübner, 2002; see reviews in Andersen et al., 2011; Norcia et al., 2015). In our result, if the attention account was true, we would expect higher SSVEP responses at driving frequencies for real characters than pseudo ones. Nevertheless, we did not find any significant difference in the SSVEP response at driving frequencies between real and pseudo characters in our results (Figure 3). Of course, statistically speaking, the fact that there was no significant difference does not necessarily mean that their responses were equal. We, therefore, did a Bayes factor analysis (Rouder et al., 2009). The result indicated that the null hypothesis (base SSVEPs are equal for real and pseudo characters) was 4.25 times more likely to be true than the alternative hypothesis (base SSVEPs are different for real and pseudo characters). This provided substantial evidence supporting that there was no difference in SSVEPs at base frequencies between real and pseudo characters. Therefore, it is unlikely that observers paid more attention to the real characters than the pseudo ones in this study.
Our results suggest that the parts are integrated into a whole representation in the processing of Chinese characters. It argues against the traditional view that visual word processing is part-based (Farah et al., 1998; Johnston & McClelland, 1980) and is consistent with the recent proposal that word processing is holistic, similar to the case of face processing (Wong et al., 2012, 2019). For example, Wong et al. (2019) found that Chinese experts were more sensitive than novices to configural relationships between different parts of a word, which is one type of holistic processing. Similarly, this study showed that the neural integration of different parts is enhanced in the processing of real words than pseudo words. These findings highlight the importance of holistic processing in the process of visual words and suggest that holistic processing is potentially a general expertise marker for both faces and nonface objects.
The left lateralization of intermodulation SSVEPs to real characters is consistent with previous studies showing that the middle fusiform gyrus of the left hemisphere, named as the visual word form area (VWFA), is selectively activated by visual words from both alphabetic languages and morpho-syllabic languages such as Chinese (Cohen et al., 2000; see a review in Dehaene & Cohen, 2011). The intermodulation responses at the left hemisphere may be directly linked to brain activities in VWFA during the visual processing of characters. The fact that we observed a difference in intermodulations between real and pseudo characters, at a first glance, seems to conflict with previous functional magnetic resonance imaging (fMRI) results, as VWFA has been found to respond equally to real and pseudo words (Dehaene et al., 2002; Liu et al., 2008; Vinckier et al., 2007). However, Dehaene and Cohen (2011) suggest that the equal responses to the real and pseudo words could be due to methodological issues with fMRI, as fMRI integrates brain signals over a long period. The SSVEP approach in this study may be a more sensitive measure to capture the difference in the processing of real versus pseudo visual words.
We observed left lateralization of intermodulations induced by visual words, whereas previous studies found that intermodulations for other stimuli such as faces were lateralized to the right hemisphere (Boremanse et al., 2013, 2014). The different lateralization effects may be due to the fact that words and faces are processed in different hemispheres. Intermodulations to face stimuli are observed in the right hemisphere probably because the face itself is processed preferentially by the right hemisphere. And intermodulation responses to visual words, in this study, are observed in the left hemisphere because visual words are processed dominantly in the left hemisphere. It suggests that intermodulation response is generated in a feature-specific fashion, produced by the same brain areas used for processing the specific stimulus.
For pseudo characters, intermodulation responses were present as well but were weaker than those of real characters and were without any hemispheric lateralization. It implies that a certain level of integration does occur for pseudo characters. Psuedo characters do appear to be characters visually but cannot reach the lexical level to be recognized. The intermodulation response observed for pseudo characters may result from lower level visual processing, whereas the intermodulation response for real characters resulted from a combination of integration processings at lower and higher level vision (e.g., semantic level). Note that it is commonly found in the literature that different levels of nonlinear integration can be indexed by the strength of intermodulations (Gordon et al., 2019). For example, Alp et al. (2016) observed intermodulation responses to both Gestalt Kanizsa illusory figure as well as non-Gestalt figure, but the response to Gestalt figure was stronger. Their result suggested that the intermodulation can be a signature of the enhanced visual integration that occurred in Gestalt formation. Boremanse et al. (2013) investigated intermodulation responses to faces and found weak, bilateral intermodulation responses for inverted faces, and stronger, right-lateralized responses for upright faces. The enhanced intermodulation most likely signified a stronger holistic integration in the processing of normal faces compared with inverted ones. Therefore, the intermodulation response could indicate the degree to which the stimuli are processed holistically. Consistently, our study suggested that the increased intermodulation may constitute a signature of enhanced holistic integration for real characters compared with pseudo characters. It is, however, still an open question on what exactly drives the intermodulation response for pseudo characters. Two processes could be involved. First, the two parts in pseudo characters were spatially proximate. Gestalt grouping based on proximity (Wagemans et al., 2012) could potentially contribute to the intermodulation response. Second, as the parts of pseudo characters were meaningful characters, recognition of the two parts simultaneously might induce certain kinds of interaction between them. Further research is needed to address these possibilities.
Another factor worth noting is the symmetric property of stimuli. Previous studies have been consistently shown that symmetric and nonsymmetric stimuli generated distinctive EEG responses (e.g., Norcia et al., 2002; see Bertamini & Makin, 2014 for a review). Among different types of symmetricity, Alp et al. (2018) examined intermodulations induced by mirror-symmetric, rotational-symmetric, and nonsymmetric pattern stimuli and found that mirror-symmetric stimuli produced the largest intermodulation response. In this study, both mirror-symmetric and transitional-symmetric characters were used, although we cannot compare them due to the unbalanced number of samples (two mirror-symmetric and eight transitional-symmetric characters). However, please note that our main finding based on the comparison between real and pseudo conditions was not affected by the symmetric property, which was balanced between two conditions with one mirror-symmetric character and four transitional-symmetric characters in each condition.
The role of symmetricity in word processing could be explored in further research based on the current paradigm. Specifically, one could investigate how the intermodulation response is affected by symmetricity (symmetric vs. nonsymmetric) and by the type of symmetricity (mirror vs. transitional). Symmetricity could most likely affect the overall amplitude of intermodulation responses. However, we would expect that intermodulations would still be observed even for nonsymmetric characters, based on Alp et al.’s (2018) finding that intermodulations were observed for nonsymmetric pattern stimuli. In addition, further research could be conducted to determine whether the familiarity of real characters also plays a role in generating the intermodulation response. To this end, one possible approach is to test a relatively large number of characters and check whether the intermodulation amplitude is correlated with the occurrence frequency of individual characters.
Footnotes
Declaration of Conflicting Interests
The author(s) declared no potential conflicts of interest with respect to the research, authorship, and/or publication of this article.
Funding
The author(s) disclosed receipt of the following financial support for the research, authorship, and/or publication of this article: This work was supported by the National Natural Science Foundation of China (31900758), the National Social Science Foundation (17ZDA323), the Humanities and Social Sciences Youth Foundation of Ministry of Education of China (18YJC740003), the Shanghai Sailing Program (19YF1445900), the Shanghai Program for High-Level Overseas Talents (TP2019071), the collaborative research grant of the Key Laboratory of Machine Perception (MOE) at Peking University (K-2019-08), the Shanghai Committee of Science and Technology (19ZR1416700), and the Hundred Top Talents Program from Sun Yat-sen University. The funding sources were not involved in study design, in data collection and analysis, in the writing of the report, or in the decision to publish.
