



Abstract
We measured the eccentricity effect of deformation thresholds of circular contours for two types of the radial frequency (RF) patterns with their centers at the fixation point: constant circular contour frequency (CCF) RF patterns and constant RF magnified (retino-cortical scaling) RF patterns. We varied the eccentricity by changing the mean radius of the RF patterns while keeping the centers of the RF patterns at the fixation point. Our peripheral stimulus presentation was distinguished from previous studies which have simply translated RF patterns at different locations in the visual field. Sensitivity for such shape discrimination fell off as the moderate and high CCF patterns were presented on more eccentric sites but did not as the low CCF patterns. However, sensitivity held constant as the magnified RF patterns were presented on more eccentric sites, indicating that the eccentricity effects observed for the high and moderate CCF patterns were neutralized by retinocortical mapping. Notably, sensitivity for the magnified RF patterns with large radii (4°–16°) presented in the peripheral field revealed a similar RF dependence observed for RF patterns with small radii (0.25°–1.0°) presented at the fovea in previous studies.
Keywords
The shape processing mechanism involves hierarchical stages: the initial stage involves encoding local orientation and spatial frequency information (Hubel & Wiesel, 1968), and the intermediate stages involve processing local curvatures and angles (Dobbins et al., 1987, 1989; Hegde & Van Essen, 2000; Ito & Komatsu, 2004). In the next stage, these distributed local features are integrated over space to extract an overall form such as complex shapes and objects (Logothetis et al., 1995), including faces (Kanwisher & Yovel, 2006; Tsao & Livingstone, 2008). In the highest stage, the shape is encoded independent of the spatial scale and retinal position.
Radial frequency (RF) patterns, introduced by Wilkinson et al. (1998), have frequently been used to investigate aspects of shape processing. The simple mathematical definition of RF patterns has made them popular stimuli in psychophysical, physiological, and imaging studies (Loffler, 2008, 2015; Salmela et al., 2016; Wilkinson et al., 2000). However, Wilkinson et al. (1998) explained the mathematical limitations of RF patterns and stressed their differences from Fourier shape descriptors, which can in principle be used to create any kind of closed, two-dimensional shape. The representational and perceptual limitations of RF patterns were pointed out by Schmidtmann and Fruend (2019), who demonstrated that only a very small subset of natural and synthetic shapes can be reliably represented by RF compound patterns and that this subset is perceptually distinct. However, despite these limitations, the visual performances of RF patterns that have been observed in a wide range of stimulus conditions have provided deep insight into the shape processing mechanism of the visual system.
Many researchers have previously studied the local or global processing of RF patterns. Wilkinson et al. (1998) argued that RF deformation thresholds cannot be explained by local analyses of either orientation or curvature, proposing that local processing involves pooling patterns into a global representation of shapes. A global shape model has been supported by a number of psychology studies on RF detection (Bell & Badcock, 2008; Bell et al., 2007, 2009; Dickinson et al., 2012, 2013; Hess et al., 1999, 2001; Jeffrey et al., 2002; Kempgens et al., 2013; Loffler et al., 2003; Poirier & Wilson, 2006; Schmidtmann et al., 2012; Tan et al., 2013).
Furthermore, a multiple-channels model that RF patterns may be processed by several RF channels has been proposed. Each channel is selectively sensitive to a limited band of radial frequencies (Bell et al., 2007, 2008; 2009, 2010, 2011; Habak et al., 2006), polar angles or corners (Bell et al., 2008; Dickinson et al., 2013), and curvatures (convexities; Bell et al., 2009; Schmidtmann et al., 2012, 2013; Schmidtmann & Kingdom, 2017). The evidences from these psychophysical studies are expected to converge toward the understanding of the intermediate stage of shape processing.
A thorough knowledge of the peripheral visual function is important for a complete understanding of the human visual system. It is well known that visual performance declines with eccentricity. The luminance increment threshold (Aulhorn & Harms, 1972; Harvey & Poppel, 1972), the temporal order detection threshold (Westheimer, 1983), the visual detection and resolution threshold (Johnson et al., 1978), and the motion detection threshold (Johnson & Leibowitz, 1976; Tyler & Torres, 1972) increase with eccentricity. The spatial frequency contrast sensitivity decreases with eccentricity (Baldwin et al., 2012; Hilz & Cavonius, 1974; Peli et al., 1991; Pointer & Hess, 1989; Robson & Graham, 1981).
However, most of the previous studies for RF patterns have been extensively focused on foveal visual performance but not on peripheral performance. Surprisingly, to the best of our knowledge, only a few researchers have paid attention to the peripheral visual performance for RF patterns.
Regarding visual field preference for many shapes presented in para-central locations, Schmidtmann et al. (2015) showed that peripheral sensitivity was isotropic for orientation and curvature but significantly better at discriminating shapes (small RF patterns with a radius of 0.5°–1.5°) throughout the lower visual field compared with elsewhere. For faces, peak sensitivity was found in the left visual field.
Regarding the eccentricity effect of RF patterns, Wilson et al. (1997) suggested that peripheral (out to 12° eccentricity) performance for circularity detection was only slightly worse than its fovea counterpart. Achtman et al. (2000) showed that the performance of RF patterns with radii of 0.5° or 1.0° declined with eccentricity (up to 20°) for all radial frequencies (4–10 cycles/360°) and that the higher the RF was the faster the sensitivity falloff with eccentricity. Achtman et al. also showed that the eccentricity effects were neutralized by scaling with respect to cortical magnification factors. In these studies, the stimulus eccentricity was varied by simply translating the centers of RF patterns at different locations in the visual field. The stimulus eccentricity was specified by the center of the RF patterns. Thus, some parts of the RF stimuli were at the underscaled eccentricity and some were at the overscaled eccentricity. The degree of the underscaled or overscaled eccentricity depended on the stimulus size.
In this study, by using RF patterns with their centers at the fixation points, we examined the eccentricity effects of the RF patterns presented in various field locations. The centers of the present RF patterns were always at the fixation point. We varied the stimulus eccentricity by changing the mean radius of the RF patterns. This method of stimulus presentation can make it possible to avoid some parts of the stimuli from being at the underscaled or overscaled eccentricity irrespective of stimulus size. Our stimulus eccentricity was distinguished from the previous studies with reference to the center of the stimulus contour. The stimulus contours of the present and the previous studies were presented in the peripheral visual field, but they were quite different arrangements. The considerably different arrangements may yield different results.
We asked the following four questions regarding the eccentricity effect on the deformation threshold of circular contour of RF patterns with their centers at the fixation points: How does the deformation threshold vary with eccentricity?; what is difference in eccentricity effect between different arrangements of stimulus eccentricity?; can spatial scaling (the retinocortical transformation) neutralize the eccentricity effect?; and is there a difference in the deformation threshold as a function of RF between foveal and peripheral stimulus presentation?
By using a series of constant circular contour frequency (CCF) patterns with different radii whose visual performances can be compared with each other, we examined the effect of eccentricity on deformation threshold for the RF patterns.
As a consequence, we found different properties in eccentricity effects from those of Achtman et al. (2000). Our eccentricity effects depended the circular contour frequencies. However, in terms of the scaling, our results were similar to those of the aforementioned study (Achtman et al., 2000). The thresholds for the scaling stimuli versus RF function were similar to the function observed in the fovea by Wilkinson et al. (1998).
General Methods
Participants
The participants included one of the authors and five healthy students (three males, 27.7 ± 3.8 years old). All participants had normal vision or corrected-to-normal vision and provided written informed consent for the procedure, which was previously approved by the ethics committee of Okayama University and was conducted in accordance with the Declaration of Helsinki.
Apparatus
MATLAB (MathWorks, Inc.) and the Psychophysics Toolbox (Brainard, 1997), which provides high-level access to the C-language Video Toolbox (Pelli, 1997), were used to generate the custom stimuli used in this experiment. The program was run on a ThinkPad T540p notebook (Lenovo). Stimuli were presented on a SHARP-PN455 (SHARP) display with a 60-Hz frame rate, eight-bit colors, and 1,920 × 1,080 pixels. The gamma nonlinearity of the screen was corrected using a look-up table that was obtained via calibration through a KONICA-MINOLTA CS-100A (Konica Minolta Japan, Inc.) spectroradiometer. The color of the stimuli was set to Commission Internationale de l’Éclairage (CIE) 1931, x = 0.34, y = 0.33. The cross-sectional luminance was modulated by Equation 1 around a mean luminance of 175 cd/m2 about each eccentricity, while the mean luminance was maintained in the remainder of the screen.
The participants viewed the display monocularly under dim room illumination at a distance of 80 cm. Each display subtended 63.3° horizontally and 38.2° vertically. The participants were instructed to sit in a chair, put their chin on a chin stand to ensure that the head did not move and was maintained at the above distance from the screen, and fixate on the fixation point presented in the center of the display when the target stimuli were presented. In the additional experiments, the participants’ fixation points were monitored by LiveTrack Lighting, Cambridge Research Systems.
Base Stimuli
The base pattern used in this study was a circular contour with a cross-sectional luminance profile defined by a radial fourth derivative of a Gaussian (D4). The pattern used in this study was the same as that used by Wilkinson et al. (1998).
The equation for the circle was as follows:


Its full spatial frequency bandwidth is 1.24 octaves.
The base circle was deformed by applying a radial sinusoidal modulation to the radius r0 in Equation 1 such that the radius of the deformed pattern at polar angle θ (in radians) was

Procedure
In an experimental trial, by manipulating the modulation amplitude of the target stimulus, the amplitude thresholds to detect the deformations of the base circles were measured. In Experiments 1 and 2, the measurements were carried out by a double-random staircase method with trials from two independent staircases that were randomly intermixed to prevent the participants from anticipating the next modulation amplitude of the target. The staircase method is extremely efficient for determining perceptual thresholds (Cornsweet, 1962). To investigate the effects of the radius change themselves, the other spatial cues were controlled as much as possible, the target stimuli were tested using fixed-phase conditions, in which the local elements were considered to have the least spatial uncertainty, resulting in the lowest deformation thresholds (the highest sensitivity) for RF patterns (Green et al., 2017; Loffler et al., 2003).
There was a 5-minute dark adaptation period to the dim room and a 3-minute light adaptation period to the mean luminance of the display. This procedure was performed to acclimate the participant’s eyes quickly to the mean luminance of the experimental display. Afterward, each session began with the presentation of a black fixation point followed by the presentation of a 50 milliseconds flash cue (a white point that replaced the black fixation point) and a 200 milliseconds target stimulus, as shown in Figure 1. Two examples are shown in Figure 1: one shows the unmodulated (circle) stimulus (A = 0) and the other shows the modulated stimulus (the amplitude A of the pattern illustrated is 20 times larger than the threshold). The participants were required to make a binary decision about the various amplitudes of the stimuli based on their own judgment. The participant judged whether the stimulus was modulated or unmodulated (circle) and responded modulation or nonmodulation (circle) by pressing one of the two buttons. First, the participant identified the starting point of the downward staircase at which the target deformation was detected reliably by adjusting the modulation amplitude of the target, while the starting point of the upward staircase was set to zero. Thus, the two starting points bracketed the set of amplitudes containing the modulation amplitude threshold value. Next, each staircase independently followed the same rule for step size: The step size was 10% of the difference between the two starting points before the first reversal and 5% after the first reversal. The modulation response was followed by a constant decrement in the modulation amplitude of the RF pattern, whereas the nonmodulation (circle) response was followed by a constant increment. Each staircase was terminated when five reversals were made. The modulation amplitude threshold was defined as the average of the last three peaks and three valleys in the resulting sequences (e.g., the last three values from each staircase). The presentation of cue and the participant’s responses (the setting of the starting points and the modulation or nonmodulation (circle) responses) were marked by auditory tones. The cue with auditory tones was used for participant’s preparation to keep their fixation on the fixation point without blinking or eye movement. The auditory tones were also the signal that participants’ response was definitely supplemented. Without this signal, participants would not know if your computer had responded exactly to the response. Notifying by the auditory tones was comfortable for participants. The next trial began after the upward and downward staircases were terminated. The stimulus radii (4°, 8°, 12°, and 16°) were randomly presented across trials. One session was composed of four trials. The other stimulus parameter, the CCF was held constant within a session but was varied across sessions. Three sessions were carried out for each participant.

Time Course of the Deformation Detection Experiment. Each trial consisted of 200-millisecond stimulus presentation intervals preceded by a 50-millisecond cue and followed by a response interval. Two example trials are shown: one shows an unmodulated stimulus (A = 0); the other shows a modulated stimulus (the amplitude A of the pattern illustrated is 20 times greater than threshold). The participant was required to make a binary decision about the various amplitudes of the stimulus based on their own judgment. The participant judged whether the stimulus was modulated or unmodulated by pressing one of the two buttons. The measurements were carried out by a double-random staircase method with trials from two independent staircases randomly intermixed.(for details see “Procedure” section).
In the additional experiments, we employed the method of constant stimuli with seven different amplitudes, within a two-interval forced choice paradigm. Participants had to identify which interval contained the target that differed from a circle. Participants indicated their decision by pressing one of the two keys on a computer keyboard. The targets differed in RF amplitudes. In the additional experiments, we monitored participants’ eye movement during the presentation of the target with an eye tracker (Live Track Lighting, Cambridge Research Systems). Seven modulation amplitudes were tested. Each modulation amplitude was tested more than 50 times. If there was the eye movement during the presentation of the target, the result of the measurement was ignored. The deformation thresholds were derived based on the 50 valid measurements for each amplitude.
Experiment 1
Experimental Stimuli: Constant CCF RF Patterns
To examine the eccentricity effect of deformation thresholds for detecting RF patterns, we used RF patterns with their centers at the fixation points which were similar to the stimuli employed by Feng et al. (in press). We determined the deformation threshold as a function of the pattern radius while keeping the CCF of RF patterns constant.
The CCF is defined by the number of radial cycles per degree of unmodulated(circle) contour length, which is measured in degree of the viewing angle. The CCF is an important factor in determining the deformation thresholds of RF patterns because regardless of the RF or radius, the radial deformation thresholds are closely matched across the entire range of circular contour frequencies, suggesting that the patterns with the same CCF should have the same radial deformation thresholds (Jeffrey et al., 2002).
The constant CCF RF patterns were created by covarying the radius and RF such that they had an identical CCF even when the radius changed. Figure 2A shows a schematic of an example of a constant CCF RF pair. The two patterns with different radii have the same CCF. Their cycles of modulation travel the same length in physical space. Moreover, the σ of the two patterns remains constant. These patterns can be used to compare the discriminability between different presentation of RF patterns. Figure 2B shows examples of three series of constant CCF (CCF = 0.159, 0.239, and 0.358 cycles/cl-deg) patterns. The CCF was held constant within a session but different across session.

Constant CCF Patterns in Experiment 1. To examine the dependence of deformation thresholds on the radius (eccentricity), we use a series of CCF constant patterns with different radii (4°, 8°, 12°, and 16°). CCF is defined by the number of radial cycles per degree of unmodulated (circle) contour length measured in degree of viewing angle and calculated by ω/2πr0 cycles/cl-deg. The cl-deg indicates the contour length in viewing angle. The CCF is considered to be an important factor in the visual performance of radial frequency (RF) patterns regardless of RF or radius (see text). A: Schematic examples explaining how two patterns with different radii (r0) and radial frequencies (ω) have the same CCF (CCF = 0.159 cycles/cl-deg). B: Examples of three series of modulation (A of the patterns illustrated are 10–20 times greater than threshold) stimuli with constant CCF. The RFs (ω) increases with increasing radius to keep the CCF constant; mean while the σ of the patterns remains constant (σ = 1°). The CCF hold constant (0.159, 0.239, and 0.358 cycles/cl-deg as shown in (1), (2), and (3)) within a session but are different across sessions. CCF = circular contour frequency.
Results
In Figure 3, the mean of deformation thresholds (r0A) for the six participants are plotted against the logarithmic of the radius of the pattern (eccentricity).
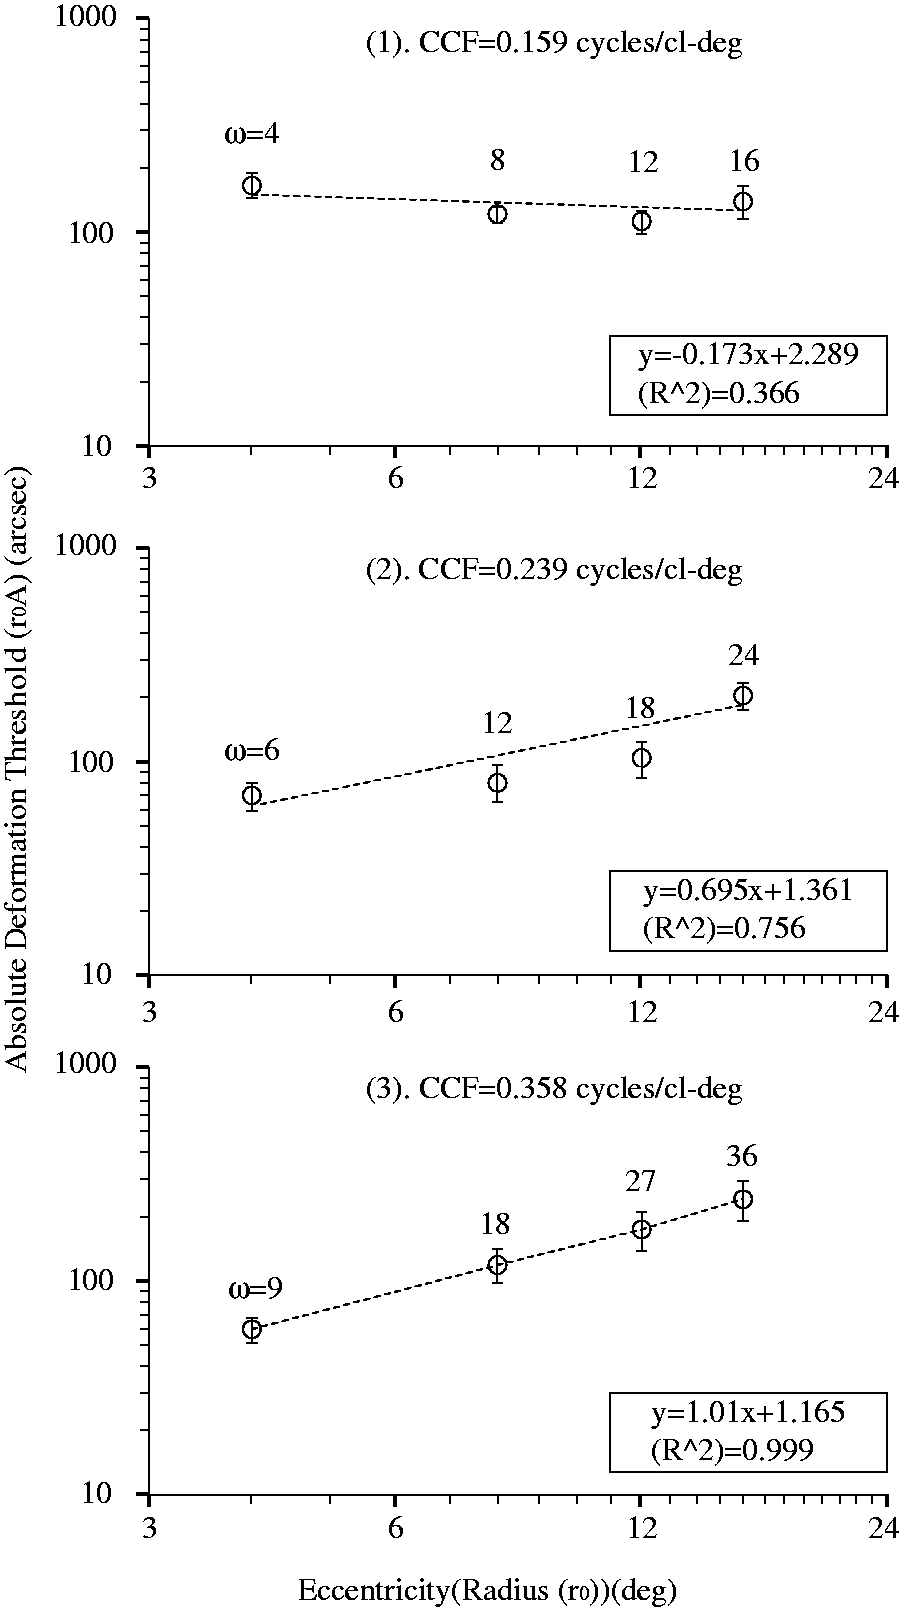
Results of Deformation Detection for Experiment 1. Mean deformation thresholds for six participants plotted against the radius (4°, 8°, 12°, and 16°). Thresholds are expressed as the value of the absolute deformation amplitude (r0A) on the ordinate. The CCF was held constant in each session but varied across sessions; deformation thresholds are shown for the low CCF: 0.159 cycles/cl-deg (1), the moderate CCF: 0.239 cycles/cl-deg (2), and the high CCF: 0.358 cycles/cl-deg (3). Error bars = 1 standard error.
The deformation threshold versus radius functions for the constant CCF RF patterns showed different functional forms dependent on the CCF (0.159, 0.239, and 0.358 cycles/cl-deg). To compare the relative falloffs in sensitivity for the different conditions, we fitted straight lines to the log/log plots in the figures. The slope of the fitting straight line increases with increasing the RF of CCF patterns. There is a clear significant effect of CCF.
To test for significant differences in the group data, we used two-way analysis of variance (ANOVA) models. ANOVA with the radius and CCFs included as factors was used to test for any main effects. Based on the ANOVA results, no main effect of CCFs, F(2, 10) = 0.593, p = .485, was found. However, a main effect of the radius, F(3, 15) = 22.750, p < .05, was found. There was a significant interaction effect, F(6, 30) = 6.922, p < .05, and post hoc analysis revealed that there was significant difference between the radius when CCF were 0.239 and 0.358 cycles/cl-deg, but there was no significant difference between radius when CCF was 0.159.
Discussion
The Effect of the Pattern Contrast (100%)
We used the pattern contrast of 100% through all present experiments.
The relationship between the physical variables and circular deformation detections does not always involve a simple one-to-one mapping between the two variables. The other stimulus characteristics which are likely to modify the relationship include the contrast and spatial frequency of the base stimulus. We used the stimulus contrast of 100% and the peak spatial frequency of 0.45 c/deg in the Experiment 1. The perceived contrast of the Gabor patches decreases with increasing eccentricity (0°–13°) even partially compensating by scaling stimulus size in the periphery (Vanston et al., 2018). The shape deformation threshold of RF pattern of 4 cycles/360° from a circle decreases with increasing stimulus contrast from about 20% to 100% for the condition of spatial frequency = 1 cpd and radius = 2.5° but not for the condition of spatial frequency 5 to 10 cpd and radius = 2.5° or 1°; Ivanov & Mullen, 2012). The deformation threshold of RF pattern decreases with increasing stimulus contrast from 12.5% to 100% for the condition of RF of 5 to 12 cycles but not for the condition of RF of 2 to 4 cycles/360° (Wilkinson et al., 1998).
This implies that the reduction in the perceived contrast with increasing eccentricity may result in increase of the circular deformation thresholds with increasing eccentricity. However, only the reduction in the perceived contrast with increasing eccentricity cannot explain our result indicating the constant deformation thresholds regardless of eccentricity change for the condition of CCF = 0.159. However, this assertion dose not exclude the possibility that the reduction in the perceived contrast effect may explain our results shown in Figure 3, because CCF condition may affect the reduction in the perceived contrast, the lower CCF yielding the smaller contrast reduction.
Eccentricity Effect in the Deformation Threshold for Constant CCF RF Patterns
Jeffrey et al. (2002), using a log–log scale, showed that the deformation threshold decreased as a linear function of CCF when plotted on a log–log scale before reaching a plateau at 1.3 to 2.6 cycles/cl-deg and was closely matched at a given CCF, resulting in a simple converged functional form independent of the RF (2–16 cycles/360°) or radius (0.125°–4°). To compare our results with the results reported by Jeffrey et al., we replotted our results in Figure 4 with the deformation threshold now plotted as a function of the CCF on a log–log scale of cycles/cl-deg.

Thresholds Versus CCF on a Log–Log Scale. For a comparison of our results with previous studies, mean deformation thresholds for six participants plotted against the CCF (0.159, 0.239, and 0.358 cycles/cl-deg). Thresholds are expressed as the value of the absolute deformation amplitude (r0A) on the ordinate. Error bars = 1 standard error. CCF = circular contour frequency.
The function for the radius of 4° is similar to the converged function obtained by Jeffrey et al. (2002). However, our functions for radii of 8° to 16° are quite different from the aforementioned converged functions. Our functions diverge as the contour frequency increases. It is clear that the rule obtained by Jeffrey et al. in the radius range of 0.125° to 4° does not apply to our range of 4° to 16°, indicating eccentricity affects CCF RF patterns differently.
An increase in the contour frequency implies a decrease in the physical length of a single cycle and the angular extent of the curvature feature of the polar angle of RF patterns and, presumably a decrease in the size of the units responsible for encoding a single cycle of the RF pattern. The narrow-band RF shape channel hypothesis suggests that high RF and low RF patterns are processed by separate channels (Bell & Badcock, 2009). Low RF patterns may be processed by units with receptive fields larger than those that process higher RF patterns. The idea that shapes are discriminated by the angular separation of their corners is consistent with the proposition by Cadieu et al. (2007), which was based on the physiological recordings shown by Pasupathy and Connor (2001, 2002), which shows that neurons in V4 that respond selectively to curvature features at specific polar angles relative to the center of an object.
The receptive field of the shape channels responsible for encoding a single cycle of RF patterns used here may be largest for the CCF of 0.159 cycles/cl-deg and smallest for the CCF of 0.358 cycles/cl-deg.
Several studies on different eccentricity effects on the sensitivity of the processing units (neural channels) with different receptive field sizes have previously been conducted.
By investigating the eccentricity effect of different-sized spotlight stimuli, Khuu and Kalloniatis (2015) showed that contrast thresholds decreased more rapidly with increasing eccentricity for a small target than for a large target.
Regarding the eccentricity effect of stimuli of different spatial frequencies, Tyler (1973) showed that the sensitivity (periodic Vernier acuity) to sinusoidal curvatures at 10° in the periphery, compared with the sensitivity at the fovea, was considerably lower for high spatial frequencies but only slightly lower at low frequencies.
Robson and Graham (1981), Pointer and Hess (1989), Peli et al. (1991), and Baldwin et al. (2012) showed that a more rapid falloff in sensitivity with increasing eccentricity occurs for high spatial frequencies compared with low spatial frequencies. Pointer and Hess (1989) by using a temporal, two-alternative, forced-choice technique, showed that in absolute terms, there was a more rapid falloff in sensitivity for the Gaussian-weighted sinusoidal grating patterns with increasing eccentricity for higher as compared with low spatial frequencies (0.05 to 12 c/deg). These studies indicate that in terms of sensitivity, the eccentricity effect strongly depends on stimulus parameters such as the stimulus size and spatial frequency and, presumably, on the receptive field size of the processing units responsible for encoding the stimuli. Note here that the size of a single cycle of the spatial frequency pattern subtends the visual angle calculated by the inverse of the spatial frequency. That is, for example, the single cycle of spatial frequency of 12 c/deg subtends visual angles of 0.08°, that of spatial frequency of 1 c/deg subtends visual angles of 1°, and that of spatial frequency of 0.1 c/deg subtends visual angles of 10°. This implies that smaller stimuli and higher spatial frequency stimuli may be processed by units with receptive fields smaller than those that process larger stimuli and lower spatial frequency stimuli. This implication is true for our experimental stimuli as well. The sensitivity to high CCF (0.358 cycles/cl-deg) RF patterns, processed by units with the smallest receptive fields, decreases with increasing eccentricity; For moderate CCF (0.239 cycles/cl-deg) RF patterns, processed by units with medium-sized receptive fields, the sensitivity decreases gradually with increasing eccentricity. For low CCF (0.159 cycles/cl-deg) RF patterns, processed by units with the largest receptive fields, the sensitivity is relatively constant given when the eccentricity changes.
Regarding the eccentricity effect of different RF patterns, Achtman et al. (2000) showed that deformation thresholds for RF patterns with a radius of 0.5° or 1° and for RF patterns of 4, 6, or 10 cycles/360° increased as a linear function of eccentricity of the presentation position of the stimulus plotted on a log–log scale, independent of the RF and radius. The slopes of the fitted linear functions for three participants were approximately 0.5 to 1.25, depending on RF. The increasing slopes for the low RF (4 cycles/360°) were lower than those for the high RF (10 cycles/360°). The CCFs of the stimuli in the previous study were 0.64 to 3.25 cycles/cl-deg, which are higher than those of our stimuli (0.159–0.358 cycles/cl-deg). The slopes of our fitted linear functions are zero for the lowest CCF (0.159 cycles/cl-deg), 0.5 for the moderate CCF (0.239 cycles/cl-deg), and 1.0 for the highest CCF (0.358 cycles/cl-deg), as shown in Figure 5. The results we obtained for the 0.239 and 0.358 cycles/360° CCFs share the same general trends as those in the observations by Achtman et al. (2000). However, our results for the 0.159 cycles/360° CCF are consistent with the findings by Pointer and Hess (1989), who showed that the contrast sensitivity for 0.1 c/deg spatial frequency patterns (where a single cycle of the patterns subtends a 10° of viewing angle) was constant regardless of the eccentricity.
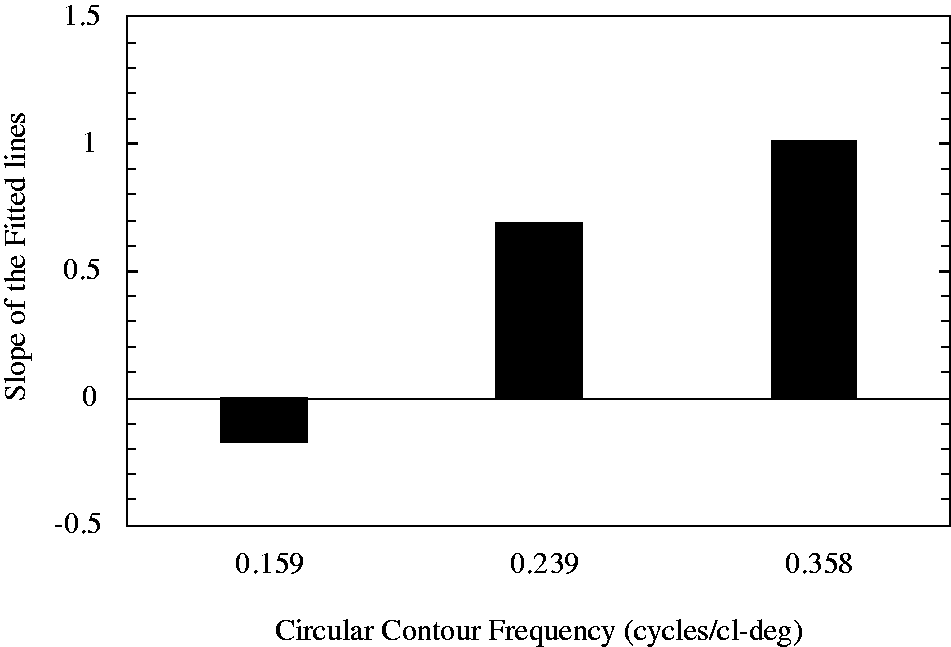
Comparison of the Slope of the Fitted Line in Figure 3 (1), (2), or (3). Each histogram represents the slope of the fitted line for the CCF (L-R: 0.159, 0.239, or 0.358 cycles/cl-deg).
Pointer and Hess (1989) also showed that in relative units of eccentricity (eccentric displacement in grating periods, i.e., the product of test spatial frequency in c/deg and absolute eccentricity in degree, the slope of the sensitivity decline was constant irrespective of spatial frequency for the limited range of spatial frequency (1∼12 c/deg, 0.2–0.8 c/deg, or 0.05–0.1 c/deg), although the slope is a little different among 1 to 12, 0.2 to 0.8, and 0.05 to 0.1 c/deg spatial frequency ranges. This suggests that in relative units of eccentricity, our deformation thresholds may have a similar functional form irrespective of CCF. To examine this suggestion, as shown in Figure 6, we replotted the relative deformation thresholds in the relative units of eccentricity (eccentric displacement in CCF periods, i.e., the product of test CCF in cycles/cl-deg and absolute eccentricity [mean radius] in degree). Here, the relative deformation thresholds were the thresholds normalized by the minimum threshold for each CCF. It is likely that the replotted curves for the three CCFs may be sample different parts of the same. These properties for the three CCF patterns are similar to the properties of contrast sensitivity for grating stimuli as a function of eccentricity expressed in relative units (i.e., periods of stimulus) obtained by Pointer and Hess (1989). It is suggested that our constant CCF RF patterns may be processed by the visual systems whose sensitivity in the circular deformation detections is characterized by a decreasing function of eccentric displacement in CCF patterns periods.

Normalized Deformation Threshold Versus Eccentricity in Relative Units. The deformation thresholds were normalized by the minimum threshold for each CCF shown in Figure 3. The abscissa is scaled in relative units of eccentricity: eccentric displacement in CCF periods, that is, the product of test CCF in cycles/cl-deg and absolute eccentricity (mean radius) in degree. The normalized deformation thresholds are shown for the low CCF: 0.159 cycles/cl-deg (circle), the moderate CCF: 0.239 cycles/cl-deg (triangle), and the high CCF: 0.358 cycles/cl-deg (square).CCF = circular contour frequency.
Consequently, our finding that the relationship between deformation threshold and radius function strongly depends on the CCF can be well explained by the different eccentricity effects ascribed by the different receptive field sizes of the units responsible for encoding a single cycle of the RF pattern.
Experiment 2
Experimental Stimuli: Magnified RF Pattern Stimuli
Experiment 2 was designed to test whether spatial scaling (the retinocortical transformation) can neutralize the eccentricity effect that was observed in Experiment 1. Many magnification factors have been reported (Anstis, 1974; Farrell & Desmarais, 1990; Higgins et al., 1996; Levi et al., 1985; Melmoth & Rovamo, 2003; Rovamo & Virsu, 1979; Schwartz, 1977; Watson, 1987; Whitaker et al., 1992). In the present experiment, we used Schwartz’s retinocortical mapping function.
The magnified RF patterns were created using Schwartz’s retinocortical mapping function. Schwartz (1977) showed that the two-dimensional retinocortical mapping functions can be represented by complex variables as shown in Equation 4:

If one changes r0 and σ are changed proportionally with the eccentricity while A and ω remain constant, then the changed patterns will have a similar form; however, their radii will be different and are linearly dependent on the eccentricity. If these changed patterns, as shown in Figure 7A (the magnified RF patterns), are transformed from the retinal plane into the cortical plane using Equation 4, the transformed patterns will be in different positions; however, they will have the same cortical length of modulation cycles.

Magnified Patterns in Experiment 2. A: Schematic examples created by using Schwartz’s retinocortical mapping function. These patterns are different in position in the cortical plane but have the same forms and radii, implying that all the transformed patterns activate the cortical area equally. B: Examples of three series of modulation (A of the patterns illustrated are 2–6 times greater than threshold) stimuli with constant RF. The σ increases with increasing radius, while the RFs (ω) are constant (4, 6, 9, and 18 cycles/360° as shown in (1), (2), (3), and (4)) within a session but are different across sessions.
In this experiment, we used the magnified RF patterns with identical radial frequencies. The RF (4, 6, 9 and 18 cycles/360°) was held constant within a session but was different across sessions, as shown in Figure 7B. In addition, to determine whether the difference in pattern thickness affected the deformation thresholds, we measured the thresholds for the two conditions of thickness (σ = 1.0°, the peak frequency = 0.45°, and the bandwidth = 1.24 octaves at half amplitude) and (σ = 0.5°, the peak frequency = 0.9°, and the bandwidth = 1.24 octaves at half amplitude), for three participants.
Results
Figure 8 shows the means of the deformation thresholds for the six participants plotted against the radius for different radial frequencies. The deformation thresholds remained constant across all radii but are significantly dependent on the RF.
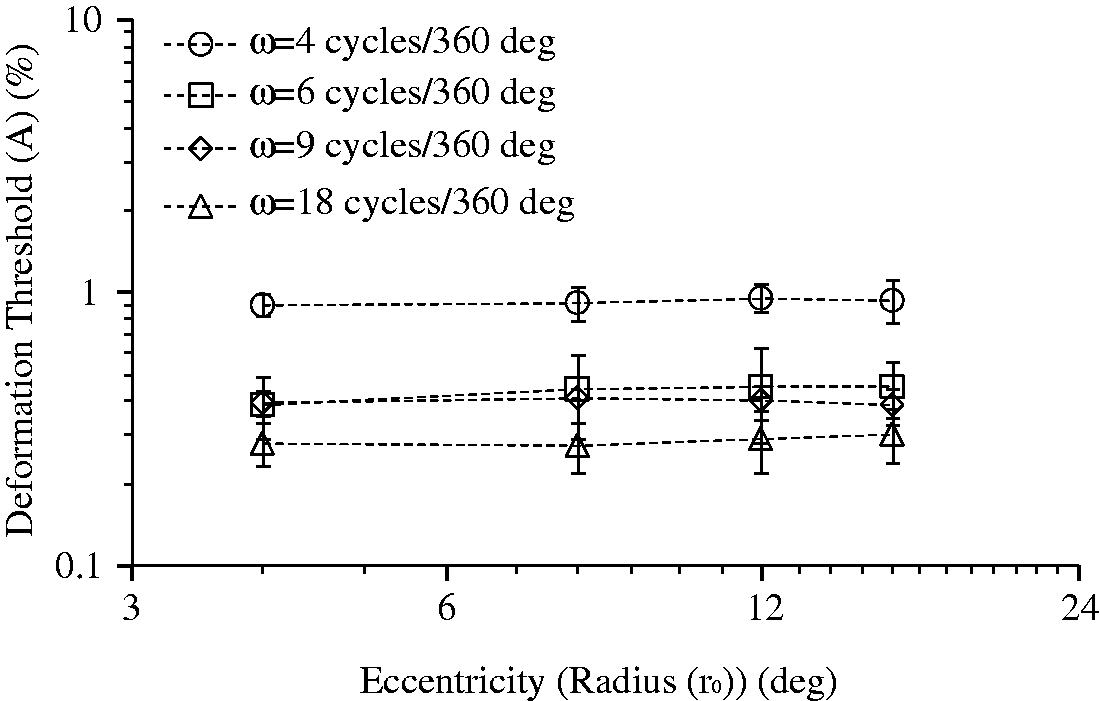
Results of Deformation Detection for Experiment 2. Mean deformation thresholds for six participants plotted against the radius (4°, 8°, 12°, and 16°). Thresholds are expressed as the value of the deformation amplitude (A) on the ordinate. The RF was held constant in each session but varied across sessions: 4 cycles/360° (circle), 6 cycles/360° (square), 9 cycles/360° (diamond), and 18 cycles/360° (triangle). Error bars = 1 standard error.
To test for significant differences in the group data, we used two-way ANOVA. ANOVA with the radius and RFs included as factors was used to test for any main effects. Based on the ANOVA results, no main effect of radius, F(3, 15) =0.677, p = .497, was found. However, a main effect of the RFs, F(3, 15) = 20.224, p < .05, was found.
Figure 9 shows the means of the deformation thresholds for the three participants plotted against the radius for two different thicknesses, and the deformation thresholds remained constant across all radii. To test for significant differences in the group data, we used a three-way ANOVA. ANOVA with the RF, pattern thickness, and radius included as factors was used to test for any main effects. Based on the ANOVA results, no main effect of radius, F(3, 6) = 2.12, p = .282, or thickness, F(1, 2) = 1.235, p = 3.82, was found. However, a main effect of the RF, F(1, 2) = 24.306, p < .05, was found.

Results of Deformation Detection for Two Different Thicknesses. Mean deformation thresholds for six participants plotted against the radius (4°, 8°, 12°, and 16°). Thresholds are expressed as the value of the deformation amplitude (A) on the ordinate. Error bars = 1 standard error.
Discussion
Cancelling Out of the Eccentricity Effect by Retinocortical Scaling
Experiment 2 was designed to test whether retinocortical scaling can cancel out the eccentricity effect. The deformation thresholds that showed increasing functions for the radius for the constant CCF RF patterns in Figure 3B and C were no longer present in the functions for the magnified patterns, as shown in Figure 8. It is clear that retinocortical scaling neutralizes the eccentricity effect that was observed in Experiment 1. This finding is similar to the findings of Achtman et al. (2000), which showed that once scaling was taken into account, the level of sensitivity was similar across all eccentricities. Note here that our experimental stimuli were concentric presentations of RF patterns, which were different from the eccentric stimuli used by Achtman et al.
General Discussion
Compliance for Eye Movements
In Experiments 1 and 2, we used a short cue for informing of the presentation of the stimulus and a brief presentation of 200 milliseconds for subjects’ fixation compliance without eye movement. However, we did not monitor fixation and record eye movements. So, for fixation compliance, we carried out the additional experiments while measuring eye movements with an eye tracker (LiveTrack Lighting, Cambridge Research Systems). If there was the eye movement during the measurement of deformation thresholds, the result of the measurement was ignored.
Additional experiments were performed to determine whether the properties obtained in the experimental results of Experiments 1 and 2 were contaminated by eye movements. The additional experiments were performed for three conditions of Experiment 1 and two conditions of Experiment 2 for two patinas.
In Figure 10, the absolute deformation thresholds (r0A) are plotted against the logarithmic of the radius of the pattern (eccentricity), for three different CCFs for each participant.

Results of Additional Experiment for Experiment 1. Deformation thresholds for two participants plotted against the radius (4°, 8°, 12°, and 16°). Thresholds are expressed as the value of the absolute deformation amplitude (r0A) on the ordinate. The CCF was held constant in each session but varied across sessions; deformation thresholds are shown for the low CCF: 0.159 cycles/cl-deg (1), the moderate CCF: 0.239 cycles/cl-deg (2), and the high CCF: 0.358 cycles/cl-deg (3). CCF = circular contour frequency.
The deformation threshold versus radius functions showed different functional forms dependent on the CCF (0.159, 0.239, and 0.358 cycles/cl-deg). To compare the relative falloffs in sensitivity for the different conditions, we fitted straight lines to the log/log plots in the figure. Figure 11 which is counterpart of Figure 5 shows that the slope of the fitting straight line increases with increasing the RF of CCF patterns. There is a clear significant effect of CCF.

Comparison of the Slope of the Fitted Line in Figure 9 (1), (2), or (3). Each histogram represents the slope of the fitted line for the CCF (L-R: 0.159, 0.239 or 0.358 cycles/cl-deg).
Figure 12 shows the deformation thresholds plotted against the radius for different radial frequencies for each participant. The deformation thresholds remained constant across all radii but are significantly dependent on the RF. The thresholds for the lower RF 4 cycles/360° are higher than those for the higher RF 9 cycles/360°.
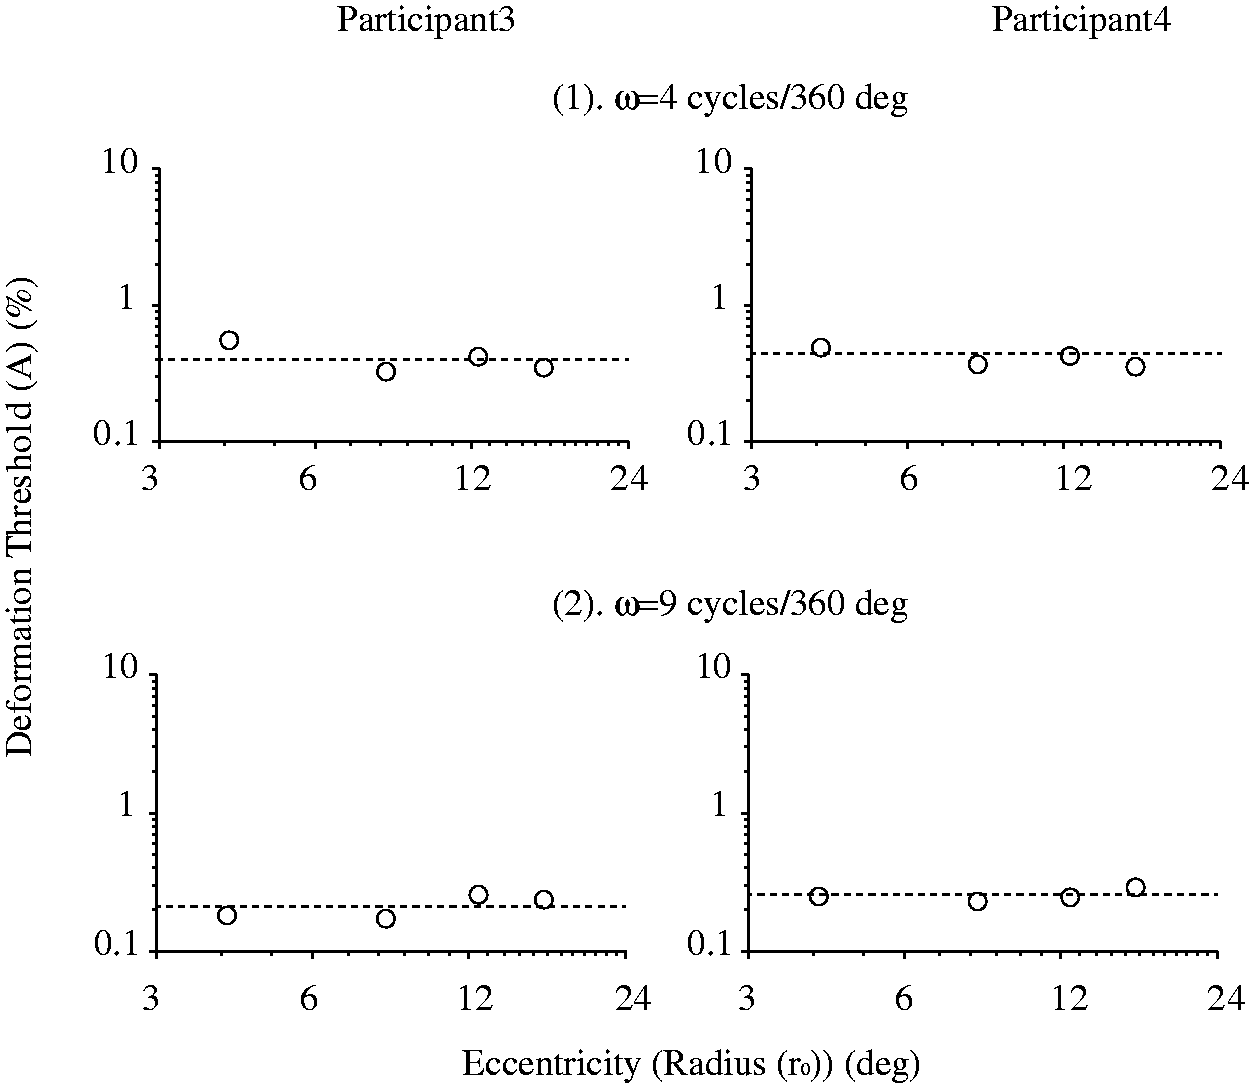
Results of Additional Experiment for Experiment 2. Deformation thresholds for two participants plotted against the radius (4°, 8°, 12°, and 16°). Thresholds are expressed as the value of the deformation amplitude (A) on the ordinate. The RF was held constant in each session but varied across sessions: 4 cycles/360° and 9 cycles/360°.
The general trends obtained in Experiments 1 and 2 are also observed in Figures 10, 11 and 12, respectively. Thus, one could say that our finding obtained in Experiments 1 and 2 may not be contaminated by eye movements.
Dependence on RF for Magnified RF Patterns
Figure 13 shows the means of the deformation thresholds for the four radii plotted against the RF, which were replotted from Figure 8. The deformation thresholds decrease with increasing RF. The threshold decreases from 0.9% to 0.3% as the RF increases from 4 to 18 cycles/360°. The improvement in performance as the RF increases has been reported in previous studies (Ivanov & Mullen, 2012; Mullen & Beaudot, 2002; Mullen et al., 2011; Wilkinson et al., 1998; Wilson et al., 1997). Some of the previous studies (Ivanov & Mullen, 2012; Mullen & Beaudot, 2002; Mullen et al., 2011) showed a U-shaped dependence of the shape discrimination threshold on RF, with optimum performance occurring at approximately 3 to 6 cycles/360°, while others (Wilkinson et al., 1998; Wilson et al., 1997) did not detect a deterioration in performance at high radial frequencies, indicating that the deformation threshold remains constant in the high RF range regardless of the RF. The discrepancy in the dependences of the deformation threshold on RF may be in part due to the stimulus contrast used. The group showing a U-shaped dependence used low contrast stimuli (five-fold contrast deformation threshold), while the group that did not detect a deterioration in performance at high radial frequencies used 100% contrast. We also used 100% contrast stimuli and did not detect a deterioration in performance at high radial frequencies either. Notably, the deformation thresholds for the magnified RF patterns with large radii (4°–16°) and presented in the peripheral field reveal a similar RF dependence as the thresholds for RF patterns with small radii (0.25°–1.0°) presented in the fovea.

The Means of the Deformation Thresholds for Four Radii. Mean of the deformation thresholds of four radii plotted against radial frequency (RF), replotted from Figure 8. Thresholds are expressed as the value of the deformation amplitude (A) on the ordinate. Each point represents the average threshold of six participants for four radii of the different RFs (4, 6, 9, and 18 cycles/360°). Error bars = 1 standard error.
Consequently, the deformation performances of circular contours do not reveal a specialized function limited to foveal vision.
Conclusion
We found that sensitivity decreases with eccentricity are dependent of RF of CCF. However, this eccentricity effect was neutralized by retinocortical mapping of RF patterns. Feng et al. (in press), using the similar stimuli as our stimuli and the RF discrimination task different from our task, showed that the effect of eccentricity on RF pattern discrimination was observed for the constant CCF patterns and that the eccentricity effect was neutralized by retinocortical mapping of RF patterns. The both findings may provide a deep insight into the understanding of the intermediate stage of shape processing.
Footnotes
Authors' Note
Yang Feng is also affiliated with Department of Psychology, Suzhou University of Science and Technology.
Acknowledgements
The authors would like to express our gratitude to the individuals who participated in our study.
Declaration of Conflicting Interests
The author(s) declared no potential conflicts of interest with respect to the research, authorship, and/or publication of this article.
Funding
The author(s) disclosed receipt of the following financial support for the research, authorship, and/or publication of this article: This study was supported by the Japan Society for the Promotion of Science KAKENHI (grant numbers 17K18855, 18H05009, 18K12149, 18K8835, 18H01411, 19KK0099 and 20K04381), National Natural Science Foundation of China (31700939), and a Grant-in-Aid for Strategic Research Promotion from Okayama University.
