



Abstract
Various glares can decrease visual performance and cause discomfort, thus increasing drivers’ risk for traffic accidents in real life. The current study aimed to systematically investigate glare sensitivity in the central and peripheral visual fields by measuring contrast sensitivity function (CSF) under nonglare, steady glare, and transient glare conditions. Nine observers with normal visual acuity in the dominant eye were enrolled. The CSF in central and peripheral vision (the 5° upper left visual field) was measured in a mesopic environment while the stimulus was displayed under three conditions: nonglare, steady glare, and transient glare. An orientation identification task was used to obtain the CSF. After the experiment, the observers were asked to report their level of discomfort in the presence of the glare. The area under the log CSF (AULCSF) and cut-off spatial frequency served as indicators of visual performance. In agreement with previous studies, both steady and transient glare reduced the AULCSF and cut-off frequency. However, the AULCSF and cut-off frequency were reduced more for central vision than for nearly peripheral vision. In addition, the extent of the decreases in the AULCSF and cut-off frequency was greater for steady glare than for transient glare; in contrast, more discomfort was associated with transient glare than steady glare.
As a fundamental aspect of vision, contrast sensitivity (CS) reflects the threshold between visible and invisible stimuli (Pelli & Bex, 2013). By measuring CS over a wide range of spatial frequencies, researchers can obtain the contrast sensitivity function (CSF), which provides a comprehensive characterization of spatial vision and contributes to our understanding of various disorders, such as amblyopia (Hou et al., 2010; Huang et al., 2008; Levi & Harwerth, 1980; Zheng et al., 2018), aging-related changes (Burton et al., 1993; Crassini et al., 1988; Yan et al., 2017), glaucoma (Bambo et al., 2016; Richman et al., 2010), macular degeneration (Kleiner et al., 1988; Rosen et al., 2015), multiple sclerosis (Fahy et al., 1989; Nordmann et al., 1987; Soler García et al., 2014), diabetes mellitus (Sokol et al., 1985; Sun & Zhang, 2012), depression (Fam et al., 2013), schizophrenia (Nogueira & Santos, 2013; Shoshina & Shelepin, 2015), and autism (Guy et al., 2016; Koh et al., 2010). The CSF predicts functional vision better than acuity (Lesmes et al., 2010). Many studies showed that CS deficits are evident even when acuity or perimetry tests appear normal (Jindra & Zemon, 1989; Woods & Wood, 1995).
Interestingly, an increasing number of studies have explored how CS is altered by extreme environmental conditions, such as low oxygen (Benedek et al., 2002; Pescosolido et al., 2015), sleep deprivation (Koefoed et al., 2015), display terminal fatigue (Gur & Ron, 1992), high gravity (Chou et al., 2003), low light (Müller et al., 2019), and glare (Finlay & Wilkinson, 1984; Puell et al., 2006). The current study is mainly focused on the effect of glare on CS. Glare refers to a phenomenon by which different sources of light can interact with the optics of the eye to impair visual function. Studies have repeatedly shown that CS can be lost under glare conditions. For example, Finlay and Wilkinson (1984) measured CSF under adjustable steady glare and no glare conditions and found that of all frequencies, the greatest impairment in CS was observed at approximately 3 c/°. In Paulsson and Sjostrand’s (1990) study, CS was measured in normal subjects and cataract patients under adjusted conditions. Impaired CS was only observed in the cataracts patients because the luminance of the glare source was not very high (e.g., 110 cd/m2). Other researchers have assessed the effects of glare by measuring CS with specific equipment, such as a Pelli-Robson chart (Williamson et al., 1992) and the Contrast Glare-tester 1000 (Puell et al., 2006), and found that CS induced by glare (disability glare) was significantly worse in the dry eye group than in the control group. In summary, previous studies have explored the effects of glare on CS and shown that they depend on the population, the luminance level of the glare, and the spatial frequency of the stimulus.
However, previous studies have only determined the effect of glare on CS in the central visual field. A thorough knowledge of peripheral visual functions is also important for obtaining a complete understanding of our visual system (Venkataraman et al., 2017). Compared to the fovea, the periphery is characterized by reduced neural sampling (Curcio & Allen, 1990) and degraded optics (Gustafsson et al., 2001; Lundström et al., 2009; Mathur et al., 2008). Peripheral vision plays an important role in many daily tasks, such as locomotion (Marigold, 2008), scene recognition (Wang & Cottrell, 2017), and driving (Larson & Loschky, 2009; Lemmink et al., 2005; Wood, 2002). Because of this, the CSF should be evaluated in both the central and peripheral fields to obtain a complete understanding of the effects of glare.
The effect of glare on CS is usually measured under steady glare conditions. However, in real life, glare often appears over a very short duration and with sudden onset, such as in response to an oncoming headlight at night, which might reduce driving performance (Babizhayev, 2003; Babizhayev et al., 2009; Fejer, 1995). Traditionally, glare is divided into disability glare and discomfort glare. The former can cause a reduction of visual performance, and the latter refers to the subjective discomfort caused by glare with no measurable effect on visual function (Abrahamsson & Sjostrand, 1986). Generally, disability glare is accompanied by discomfort (Bargary & Barbur, 2012; Friedland et al., 2017). As mentioned earlier, transient glare seems to be more common than steady glare when driving at night, but the degree of subjective discomfort experienced in the presence of transient glare is unknown. Thus, the current study measured subjective discomfort under both steady and transient glare conditions.
The purpose of this study was to examine glare sensitivity and subjective discomfort in the central and nearly peripheral visual fields under steady glare, transient glare, and nonglare conditions. Glare sensitivity reflects the extent of the effects of glare on CSF. The CSF in the dominant eye was measured in a mesopic environment that simulated nighttime.
Methods
Observers
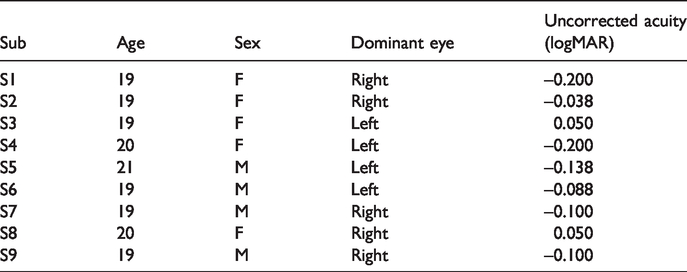
The nine college students who participated in the current study had normal visual acuity (VA) in the dominant eye with cycloplegic spherical equivalence (SE) not exceeding ±0.5 diopter (D) (see Table 1 for details). VA was measured with the Chinese Tumbling E Chart and converted to minimum angle of resolution (MAR) acuity. None of the participants were aware of the purpose of the study, and they all provided written informed consent before participating. The study was approved in advance by the university Research Ethics Committee and adhered to the principles of the Declaration of Helsinki. Observers who had known notable ocular diseases (including cataract, glaucoma, and impaired accommodation/oculomotor/contrast/color sensation/visual field) were excluded from the experiment. The observers were nonsmokers, and they were prohibited from using alcohol and caffeine prior to the tests.
Observer characteristics.
Apparatus
The study was conducted on a PC computer running MATLAB (MathWorks, Natick, MA) with PsychToolbox extensions (Brainard, 1997). The stimuli were displayed on a gamma-corrected monitor with a spatial resolution of 1,920 × 1,080 pixels, a refresh rate of 85 Hz, and a mean luminance of 3 cd/m2. The observers placed their chin on a chin rest and viewed the displays monocularly in a dimly lit room with an opaque patch on the nondominant eye. The display subtended 5.56°×3.13° at a viewing distance of 3.42 m. The whole experiment was performed without optical correction.
Glare Test
Glare was generated by a dimmable 3.0 cm diameter diffuse LED light fixture (10 W) mounted on the upper side of the stimulus at a visual angle of 12° (Figure 1). The luminance was 4500 cd/m2 at the observers’ eyes if they looked directly into the stimulus. The observers were tested under three conditions: nonglare, steady glare, and transient glare. The steady glare referred to keeping the light on during the test. For the test with transient glare, the duration of the light was 500 ms, and the interval was 500–1000 ms. Before testing CSF with glare, the glare source was turned on without stimulus for above 30 s to allow adaptation.
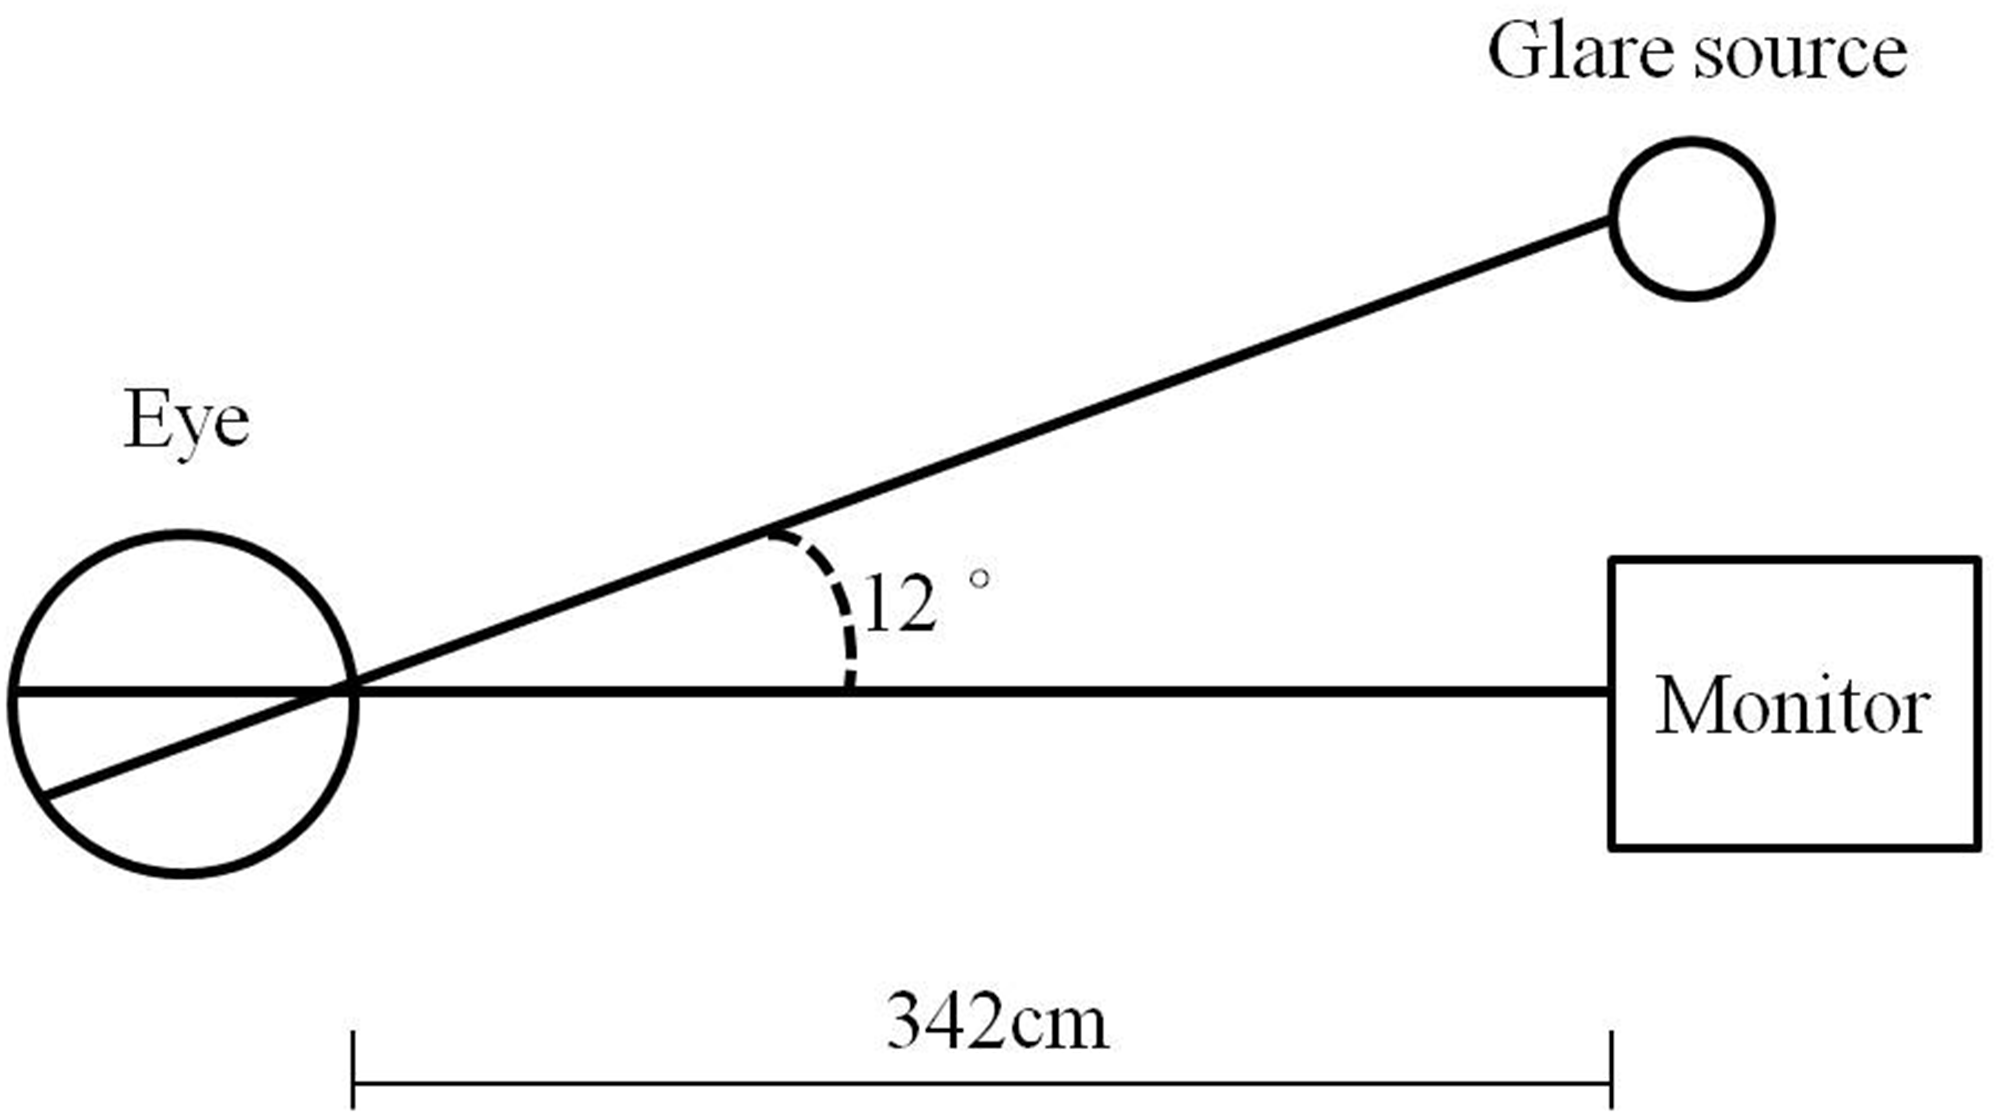
Schematic illustration of the experimental apparatus.
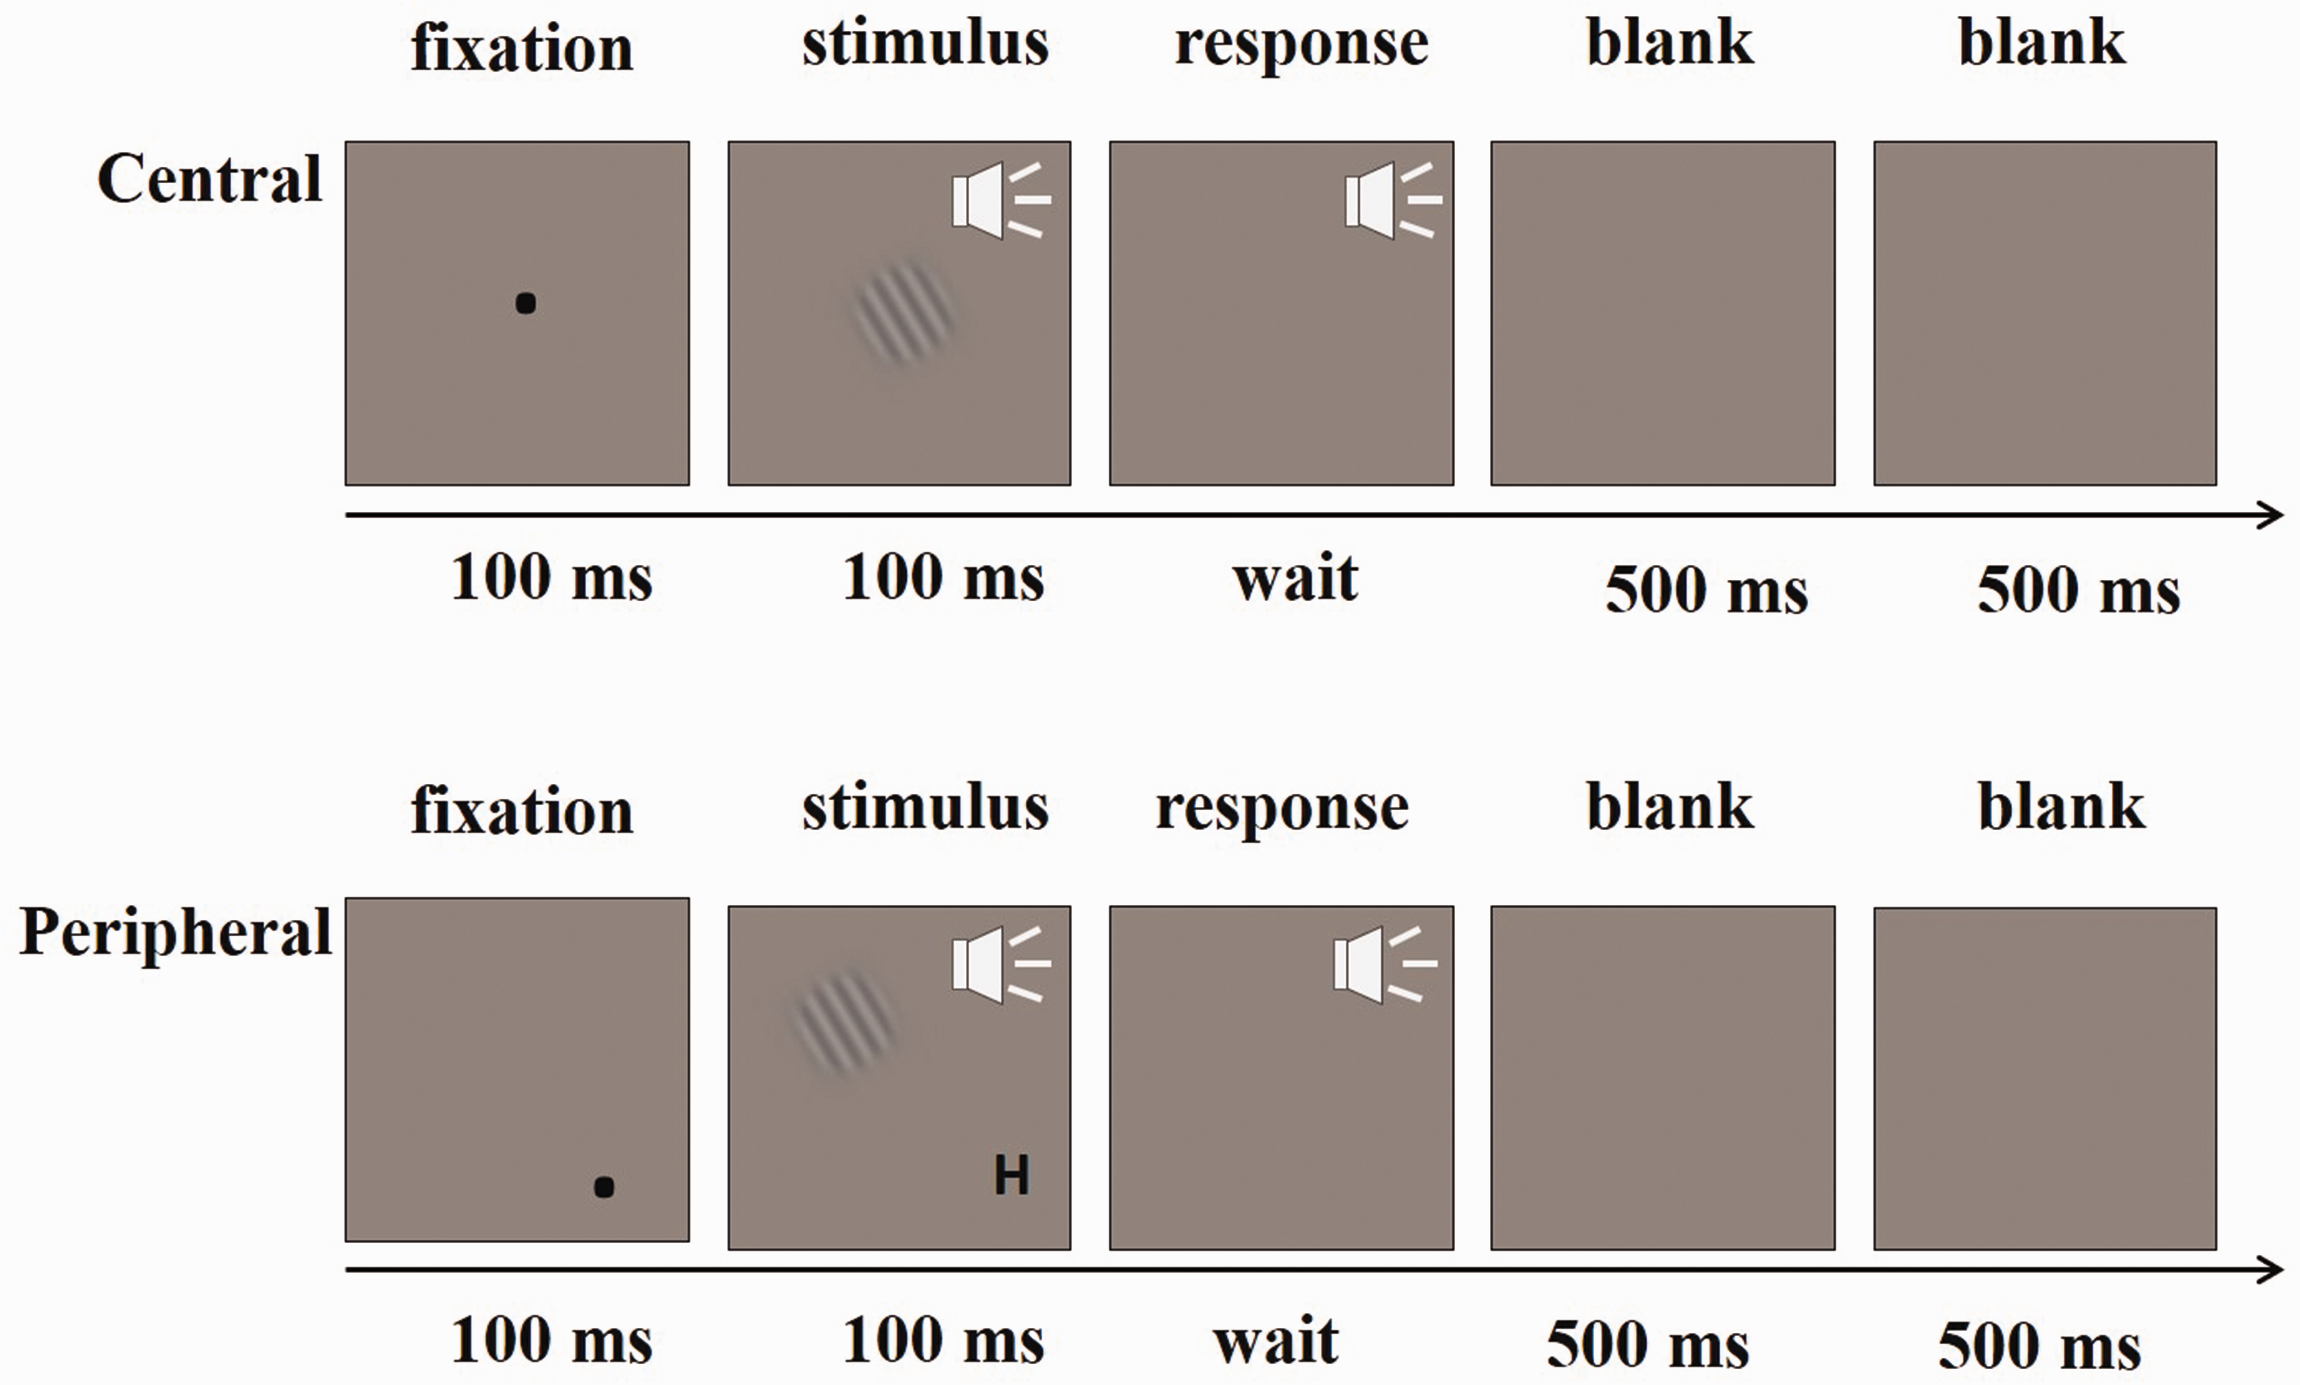
A typical trial in the forced-choice procedure for testing csf in the central and peripheral visual fields.
All the experiments were performed in a darkroom. After 10 min of dark adaptation, each observer was required to finish the CSF tests once per day for 6 days: each of the 2 stimulus positions (central and peripheral) × 3 types of glare (non, steady, and transient glare). The order of the measurements was counterbalanced.
Assessment of CSF
The computer program was used to measure CSF. A one-interval, forced-choice, sine-wave grating orientation identification task was used for assessment of the CSF.
The target grating was 2° in diameter with a half-Gaussian ramp (σ = 0.25) that could be tilted either left (–45°) or right (45°). Observers were asked to judge the orientation of the presented grating. CS was defined as the reciprocal of the contrast threshold for discriminating the orientation of a sine-wave grating with 79.3% accuracy at five spatial frequencies: 1, 2, 4, 8, and 16c/°. All spatial frequencies were interleaved among the trials. The task contained five blocks of 80 trials and lasted approximately 25 min.
For the CSF test in the central field, a fixation point (0.2°) was presented in the center of the screen for 100 ms. Then, a target grating was signaled by a brief tone at the beginning and presented for 100 ms (Figure 2). The observers indicated the orientation of the target grating by using the computer keyboard. A brief tone followed each response regardless of the accuracy of the response. Each response also initiated the next trial. All observers practiced approximately 50 trials before the formal measurements.
For the CSF test in the peripheral field, a fixation point was presented at the bottom-right corner of the screen for 100 ms. Then, a target grating was presented in the upper left view field at 5° retinal eccentricity (positional jitter = 0.25°) for 100 ms. Specifically, the target grating moved within the radius of 0.25°. The aim of this design is to prevent observers from remembering the position of stimulus subliminally. A black letter (H or N) then appeared at fixation and was maintained in place for 100 ms. A brief tone sounded at the beginning of the stimulus appearance (Figure 2). The observers were asked to make two judgments: the foveal letter (H or N) for fixation control and the orientation of the target grating. The purpose of the foveal letter report was to guarantee fixation. The observers pressed the up button when H was present and the down button when N was present. Subsequently, they indicated the orientation of the target grating by pressing the left or right button. During the threshold assessment, auditory feedback was given after each of the two judgments regardless of their accuracy. Notably, the above procedure was available only for the observers whose dominant eye was the left eye. For observers with the right dominant eye, the fixation point and the target grating presented in a symmetrical position based on the vertical center line of the screen. In addition, since the target grating was located above the center of the screen, the glare source was moved up approximately 2.5° to make the glare source have the same angle in the central and peripheral tests.
Thresholds were assessed using an adaptive staircase method known as a three-down/one-up staircase procedure (Levitt, 1971). This method, which is expected to asymptote at 79.3% correct, decreased signal contrast by 10% (multiplied the previous value by 0.9) after every three consecutive correct responses and increased signal contrast by 10% after every incorrect response. Eighty trials were used to estimate the contrast threshold at a particular spatial frequency. A reversal resulted when the staircase changed its direction (changing from increasing to decreasing contrast or vice versa). Following the standard practice, the first five (if the number of total reversals was odd) or four (if even) reversals were excluded. We averaged the contrasts of the remaining reversals to assess the contrast threshold for detecting the grating at a certain spatial frequency. Based on the results from the pilot testing, the starting contrast for each staircase was set near the expected threshold. After each measurement, the observers were debriefed and thanked and received 40¥ (Chinese yuan) as payment.
Assessment of Subject Discomfort
After all CSF measurements were obtained, the observers were asked to report their subjective feeling under the steady and transient glare conditions: “How did you feel in the presence of glare?” Their answers were rated on a scale from 1 = strong comfort to 7 = strong discomfort.
Data Analysis
Unless otherwise noted, the significance level was p < .05, and marginal significance corresponded to .05 ≤ p < .10 throughout the study.
The log CSF graphs show log contrast sensitivity (1/threshold) as a function of spatial frequency. The spatial frequency axis is also in log scale. The area under the log CSF (AULCSF), which provides a broad measure of contrast sensitivity across all spatial frequencies, was calculated to evaluate the visual performance in various conditions.
The magnitude of the reductions under glare conditions was calculated from CS, AULCSF and cut-off spatial frequency as:

In the results section, the average magnitude of the reductions calculated at the group level was reported as follows: 
Results
Effect of Glare on CSF
Figure 3A presents the average CSF with nonglare, steady glare, and transient glare in the central and peripheral visual fields (see Figure S1 and S2 in Supplemental Material for individual’s CSF). As shown in the figure, glare indeed decreased the CS. In addition, the observers seemed to have better CS under transient glare than steady glare conditions.
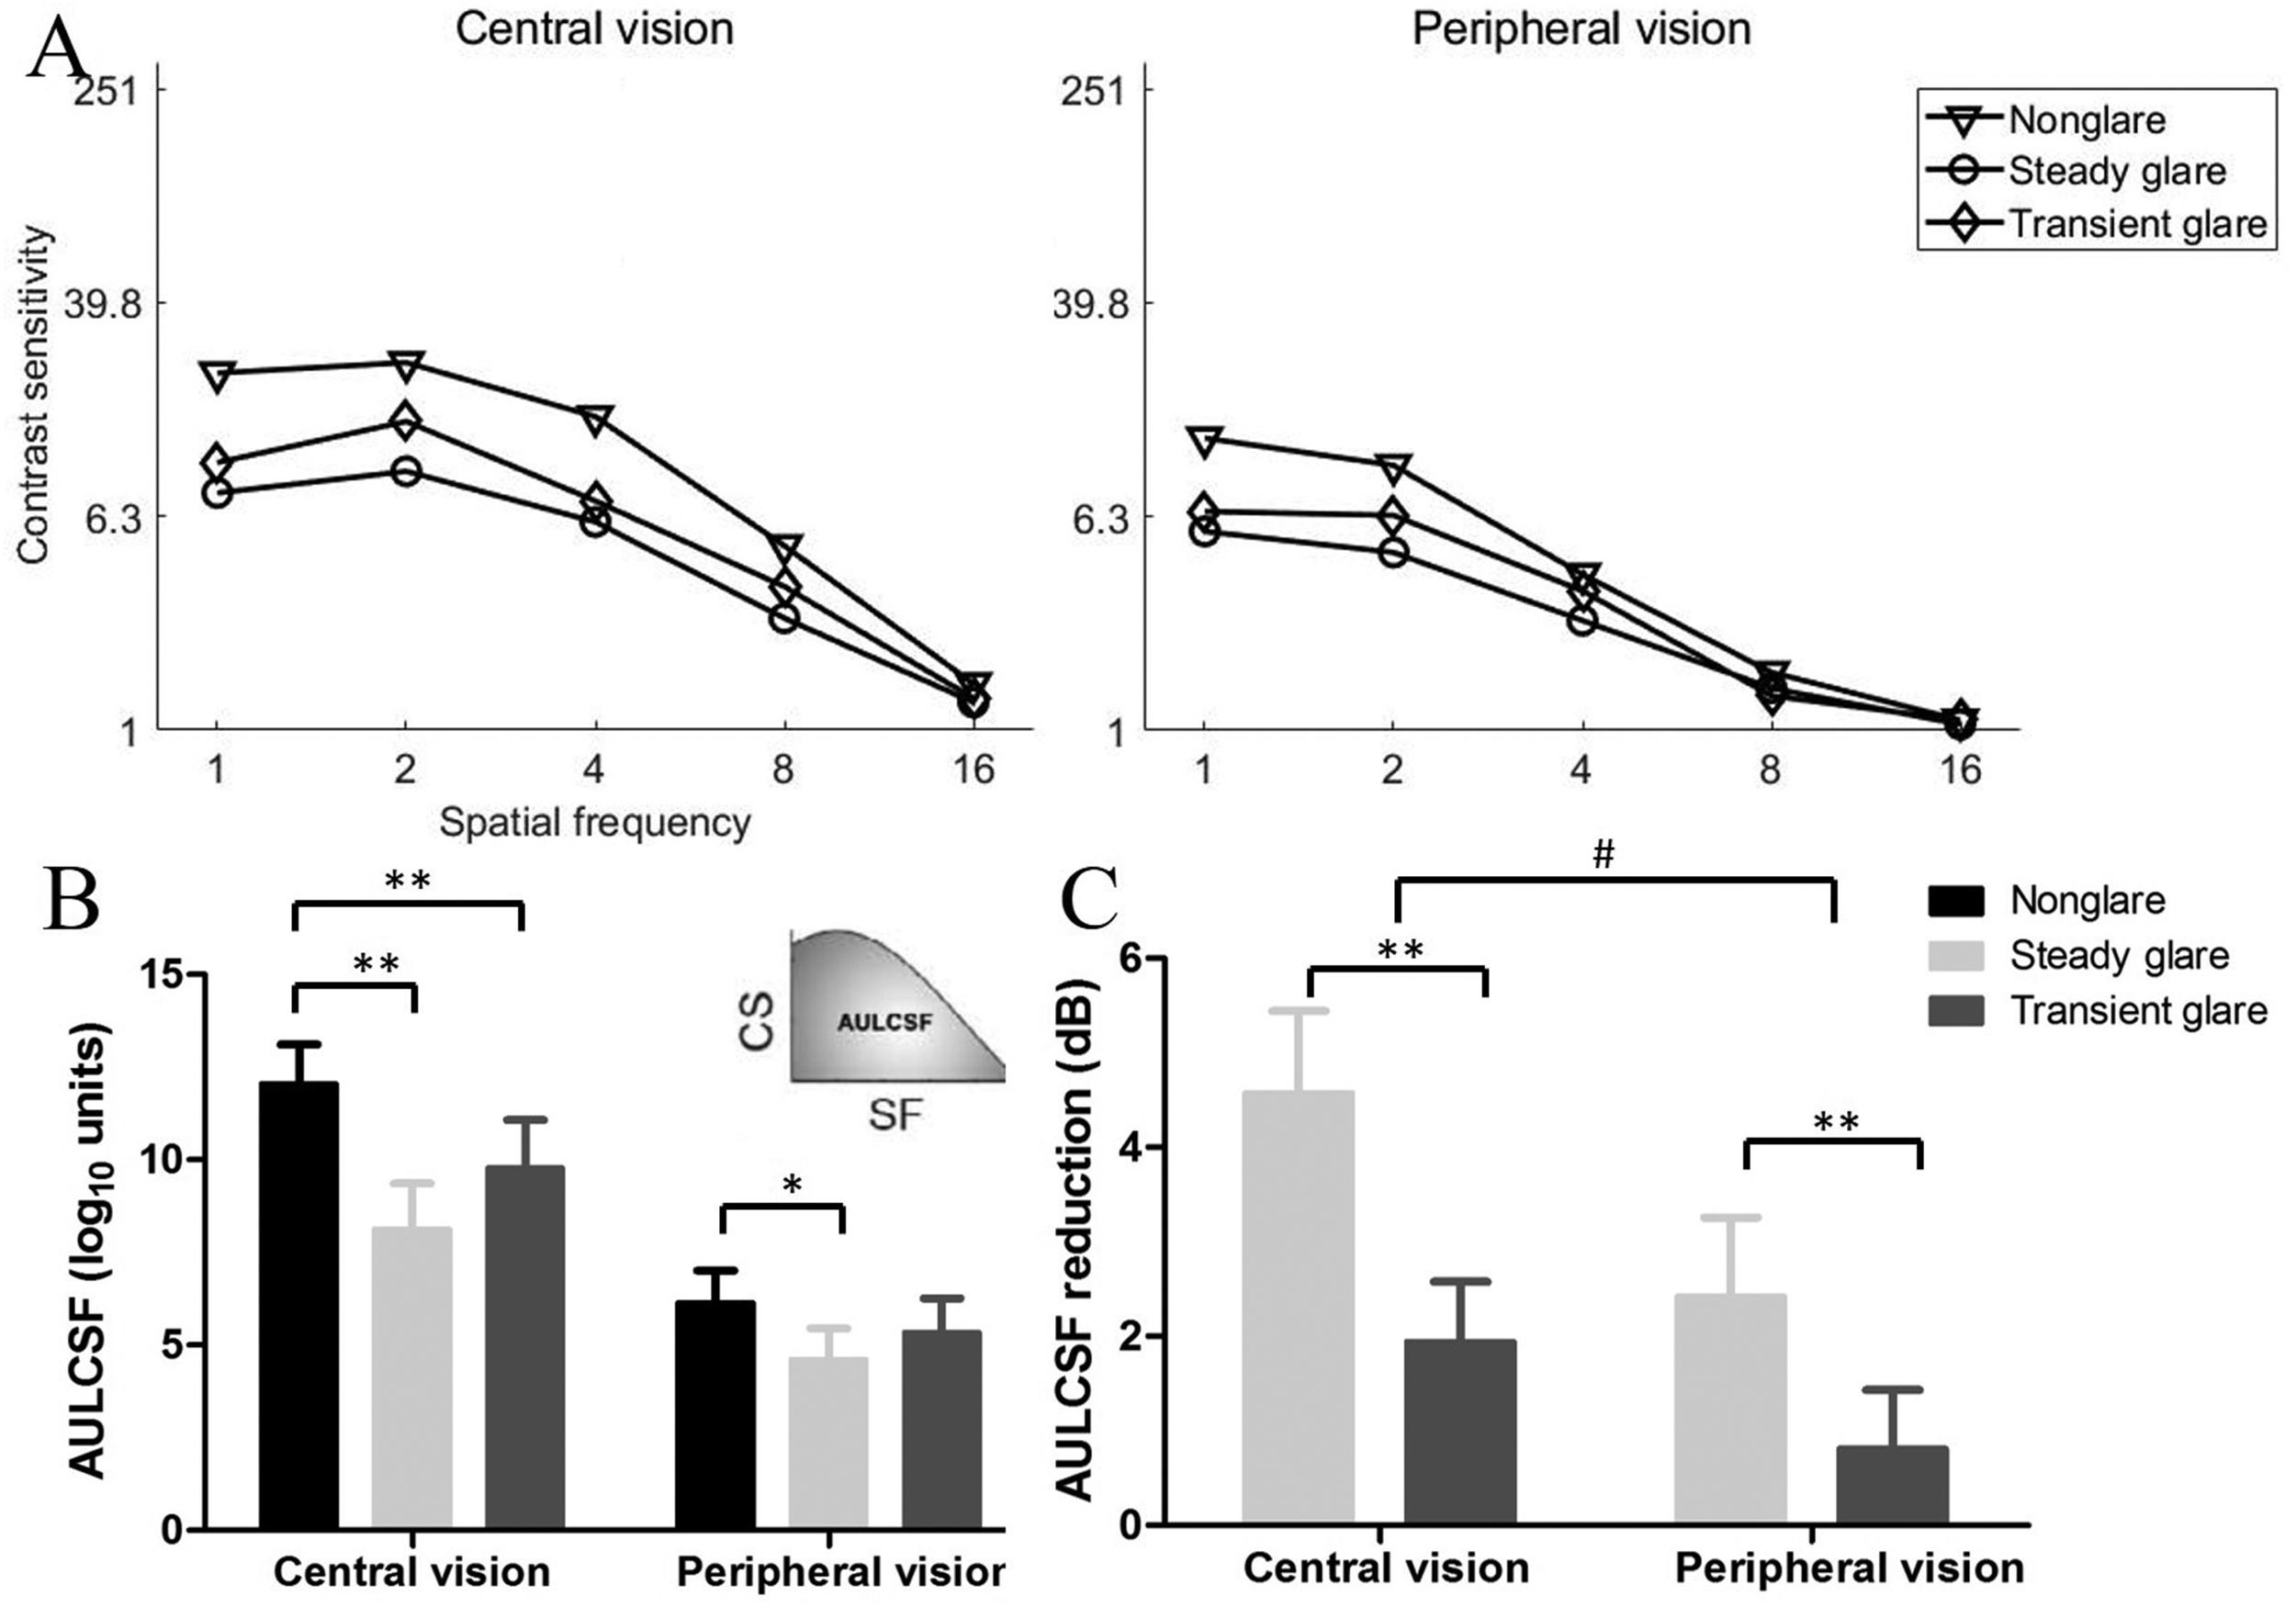
The effect of glare on contrast sensitivity function. (a) The average contrast sensitivity function in the central and peripheral visual fields. (b) Schematic diagram of the area under log contrast sensitivity function (AULCSF) and the AULCSF in nonglare, steady glare and transient glare. CS: contrast sensitivity; SF: spatial frequency. (c) The degree of reduced AULCSF. The red, blue and green bars and curves denote the nonglare, steady glare and transient glare conditions, respectively. Error bars are the standard error. **p < 0.01, *p < 0.05, #p < 0.1.
To further analyze the difference in visual performance across various conditions, the AULCSF was calculated and severed as the indicator of visual performance. A two-way analysis of variance (ANOVA) was performed on the AULCSF with 2 positions (central, peripheral) × 3 types of glare (non-, steady, and transient) as within-subject factors (Figure 3B). The main effects of stimulus position and glare were significant, F(1,8) = 63.42, p < .001 and F(2,16) = 9.95, p = .002, respectively. In addition, the interaction effect also reached significance, F(2,16) = 4.93, p = .022. For central vision, a significant main effect of type of glare was found, F(2,16) = 11.15, p = .001. Further analyses showed that the AULCSF was significantly greater in the nonglare condition than in the steady glare (p = .003) and transient glare (p = .006) conditions in the paired-samples t tests. The AULCSF was not significantly different between the steady glare and transient glare conditions (p = .111). For the peripheral vision, the main effect of type of glare was marginally significant, F(2,16) = 3.38, p = .060. The AULCSF in the nonglare condition was significantly greater than that in the steady glare condition (p = .046) but comparable to that in the transient glare condition (p = .236) in the paired-samples t tests. There was also no significant difference in the AULCSF between the steady glare and transient glare conditions (p = .166).
To better understand the degree of AULCSF decrease under the glare conditions compared with the nonglare condition, a two-way ANOVA was conducted on the degree of AULCSF reduction with 2 positions (central, peripheral) × 2 types of glare (steady, transient) as within-subject factors (Figure 3C). The main effect of position reached marginal significance, F(1,8) = 4.02, p = .080. In addition, a significant main effect of type of glare was found, F(1,8) = 18.31, p = .003. The interaction effect was not significant, F(1,8) = 1.05, p = .335. In particular, the AULCSF decreased by 4.58 ±0.86 dB (mean ±SE; the percentage of AULCSF decrease: 69.43%) in central vision with steady glare, 1.94 ±0.64 dB (25.03%) in central vision with transient glare, 2.42 ±0.84 dB (32.13%) in peripheral vision with steady glare, and 0.81 ±0.62 dB (9.77%) in peripheral vision with transient glare.
Effect of Glare on Cut-Off Spatial Frequency
Each individual observer’s cut-off spatial frequency was defined as the spatial frequency at which the contrast threshold of CSF was 0.50. We compared the changes in the cut-off spatial frequency observed across various conditions. A two-way ANOVA was conducted on the cut-off spatial frequency with 2 positions (central, peripheral) × 3 types of glare (non-, steady, and transient) as within-subject factors. There were significant main effects of position and glare, F(1,8) = 27.76, p = .001 and F(2,16) = 7.78, p = .004, respectively. However, the interaction effect was not significant, F(2,16) = 1.98, p = .171. For the central vision field, as shown in Figure 4A, the effect of glare on the cut-off frequency reached significance, F(2,16) = 8.17, p = .004. Further analyses showed that the cut-off frequency was greater in the nonglare condition than in the steady glare (p = .008) and transient glare (p = .008) conditions in the paired-samples t tests. No significant difference was found in the cut-off frequency between the steady glare and transient glare conditions (p = .245). Furthermore, there was marginal significant difference for the cut-off spatial frequency in the peripheral vision, F(2,16) = 2.91, p = .083. The cut-off frequency was marginally greater in the nonglare condition than in the steady glare (p = .059) and transient glare (p = .292) conditions. In addition, the difference between the steady glare and transient glare conditions was not significant (p = .185).

The effect of glare on cut-off spatial frequency. (a) The cut-off spatial frequency in nonglare, steady glare and transient glare. (b) The degree of reduced cut-off spatial frequency. **p < 0.01, *p < 0.05, #p < 0.1.
To compare the change in cut-off frequency, we calculated the extent of the cut-off frequency reduction. A two-way ANOVA was performed on the degree of cut-off spatial frequency reduction with 2 positions (central, peripheral) × 2 types of glare (steady, transient) as within-subject factors (Figure 4B). The main effects of position reached marginal significance, F(1,8) = 3.63, p = .093. In addition, there was a robust main effect of type of glare, F(1,8) = 7.37, p = .026. The interaction effect was not significant, F(1,8) = 0.014, p = .907. The degree of cut-off spatial frequency reduction was 2.94 ±0.43 dB (mean ±SE; the percentage of cut-off spatial frequency reduction: 26.53%) in central vision with steady glare, 1.43 ±0.47 dB (17.87%) in central vision with transient glare, 1.57 ±0.55 dB (19.81%) in peripheral vision with steady glare, and 0.58 ±0.67 dB (6.19%) in peripheral vision with transient glare.
Central Letter Identification
The normal distribution test showed that the percentage correct was not normal. The Friedman M test showed that the performance in the central letter identification task was not comparable between the three groups (nonglare, steady glare, and transient glare: 86.92%, 76.31%, and 80.61%, respectively), χ2 = 0.667, p = .717.
Subjective Discomfort Feeling
After finishing all the tests, the observers reported their subjective discomfort in the presence of steady and transient glare. The subjective glare score was not normal; therefore, the Wilcoxon signed-rank test was used. The results showed a significant difference in level of discomfort, Z = 2.373, p = .018. Specifically, eight of the nine observers felt more discomfort under transient glare than under steady glare conditions.
Discussion
The object of the current study was to investigate the effect of steady and transient glare conditions on CSF in the central and peripheral visual fields. There were three main results. (a) Consistent with previous studies, both steady and transient glare reduced visual performance, including AULCSF and cut-off frequencies. (b) AULCSF and cut-off frequencies were more sensitive to glare in central than in peripheral vision. (c) The degree of AULCSF and reductions in cut-off frequency were greater under steady glare than under transient glare conditions; in contrast, the observers felt greater discomfort under transient glare than under steady glare conditions.
Visual performance is known to be dramatically reduced when a bright light is presented within the visual field. The scattering of light within the eye causes a veiling luminance that is superimposed on the retinal image (Bargary & Barbur, 2012; Gray & Regan, 2007). This stray light will have a contrast-lowering effect on the apparent image of the visual scene and will thereby decrease visual ability (van der Mooren et al., 2016). The results of this study further support the above statement in that we found that in both central and peripheral vision, both steady and transient glare conditions obviously reduced visual performance (i.e., AULCSF and cut-off spatial frequencies).
With the increasing use of various expanded displays, peripheral vision has become increasingly important in modern society. People tend to obtain most visual information through central vision; for example, drivers focus on the road ahead. Drivers receive the majority of visual information from the central visual field. For example, central vision lets you know whether cars in front of you are slowing down or not. However, much information often appears in the peripheral visual field, such as pedestrians, animals, advertisements, and road markings, which also increase the potential driving hazards. As reduced visual performance in central vision, AULCSF and cut-off spatial frequency also decreased in peripheral vision under glare conditions. Nevertheless, the degree of reduced visual performance seems to be lower in peripheral vision than in central vision, although the cut-off spatial frequency was marginally significant. The results of the current study indicate that visual performance is more sensitive to glare in central vision than in peripheral vision.
It is worth noting that the eccentricity of 5° is still parafoveal, which is nearly peripheral vision. According to the results of this study, the glare sensitivity may further reduce in the vision in larger angles. In addition, observers identified letters briefly presented at fovea to guarantee fixation in the peripheral vision tests, but this dual task with letter report may bring an additional difficulty compared to the central vision tests. The additional difficulty may reduce the visual performance in the peripheral visual field. However, it has no influence on the effect of glare on the peripheral vision.
Interestingly, compared with visual performance in the nonglare condition, visual performance seemed to decrease less in the transient glare condition than in the steady glare condition. After each test, the observers were required to report their subjective feelings during testing. All observers answered that they found it difficult to clearly see the stimuli under glare; however, they could identify some stimuli through the intervals of transient glare. This result indicates that people can quickly adapt to the mesopic luminance of transient glare. During nighttime driving, drivers must suffer from transient glare, such as the sudden brightness change of oncoming headlight. Although transient bright light sharply reduces visual ability, drivers are able to quickly adapt to the mesopic interval and use the interval to see the objects. Importantly, the glare source was not synced to the stimuli. This type of transient glare set-up may cause that the glares occurred during the off-periods of stimuli in some trails. It is possible that more severely decreased performance is observed when the glare always appears during the periods of the stimulus. The effect of synchronization between stimulus and glare on the visual performance is interesting and worthy of further work.
Although steady glare decreased visual performance more than transient glare, observers felt more severe discomfort in the transient glare condition. Gray and Regan (2007) suggested that a glare source that causes discomfort may not directly affect visual performance but may generate a sensory adaptation to reduce the discomfort. That is, a bright glare results in a feeling of great discomfort, but the eyes can adapt to photopic luminance over time. Once the adaptive process is disrupted (such as in transient glare), observers feel more subjective discomfort than in a steady glare condition.
Previous studies separately calculated the reductions in CS at different spatial frequencies. For example, researchers found that CS was lower over a wide range of spatial frequencies in the presence of glare; in addition, the largest reduction occurred at approximately 3 c/° (Finlay & Wilkinson, 1984). Paulsson and Sjostrand (1980) showed that the most distinct decrease in CS occurred at low and medium frequencies in the present of glare, and that decreases were less significant at higher frequencies. Such a calculation method ignored the effect of different levels of initial vision. Specifically, for observers with better initial vision, the most obvious reduction may exist at high frequency; for observers with poorer vision, in contrast, the reduction may be the greatest at medium or low frequencies. To avoid this effect, the AULCSF and cut-off spatial frequency served as indicators of visual reduction, which itself reflected the overall visual performance (Zhang et al., 2018).
To the best of our knowledge, the current study is the first to include central versus peripheral vision and steady versus transient glare in one experimental condition. Thus, the effects of glare on vision performance regarding retina position and glare type were systematically studied in a laboratory environment, which enriched the studies in terms of glare and vision. In addition, the present study has important implications. Most of the early research focused on how steady glare decreases the central visual ability. However, visual performance in peripheral vision is also important in daily driving. In addition, drivers often encounter brightness changes in lighting. Thus, the results of this study contribute to increasing our understanding of the effect of glare on visual performance in actual driving conditions.
There are at least two caveats that could be improved in future research. First, the sample size was relatively small, which may be the main reason for the marginally significant results in this study. Even so, these results were accountable and met expectations. Second, the observers in this study were young college students with normal VA. Given increases in both life expectancy and mobility in the aged population, more and more elderly people are driving at night. Compared with young groups, older age groups are more sensitive to glare (Koch, 1989). Thus, the future research should examine glare sensitivity in the elderly population.
In summary, we show that both steady and transient glare can reduce visual performance (i.e., AULCSF and cut-off spatial frequency) in both the central and peripheral visual fields. In addition, our results demonstrate that a steady glare reduces vision more and produces less subjective discomfort than was found for transient glare. Our findings have implications for our understanding of glare sensitivity in central and peripheral vision.
Supplemental Material
sj-pdf-1-pec-10.1177_0301006620967641 - Supplemental material for Reduced contrast sensitivity function in central and peripheral vision by disability glare
Supplemental material, sj-pdf-1-pec-10.1177_0301006620967641 for Reduced contrast sensitivity function in central and peripheral vision by disability glare by Di Wu, Na Liu, Pengbo Xu, Kewei Sun, Wei Xiao and Chenxi Li in Perception
Footnotes
Declaration of Conflicting Interests
The author(s) declared no potential conflicts of interest with respect to the research, authorship, and/or publication of this article.
Funding
The author(s) disclosed receipt of the following financial support for the research, authorship, and/or publication of this article: This research was supported by the Youth Program of Humanities and Social Sciences, Ministry of Education (19YJC190001, GC).

Supplemental Material
Supplemental material for this article is available online.
References
Supplementary Material
Please find the following supplemental material available below.
For Open Access articles published under a Creative Commons License, all supplemental material carries the same license as the article it is associated with.
For non-Open Access articles published, all supplemental material carries a non-exclusive license, and permission requests for re-use of supplemental material or any part of supplemental material shall be sent directly to the copyright owner as specified in the copyright notice associated with the article.
