



Abstract
Wet fabric clinging to human skin may cause stickiness perception and facilitate wearing discomfort. This study aims to investigate the stickiness perception of wet fabrics via two contact modes (friction and adhesion-separation) as well as the influences of fabric properties and contact features on stickiness perception. A set of dynamic contact devices was developed to drive the samples to move horizontally or vertically on volar forearms. According to the magnitude estimation approach, 12 subjects were asked to assess the stickiness perceptions caused by 64 types of contact stimuli. The results showed that the water absorption capacity had a significant and negative correlation with stickiness perception under the two contact modes. However, the surface roughness was neither related to stickiness perception under the friction mode nor to stickiness perception under the adhesion-separation mode. There was an interaction between contact pressure and sliding velocity. The sliding velocity at medium or high pressure had a significant effect on stickiness perception, but the separating velocity had no significant effect. Stickiness perception under the friction mode is higher than that under the adhesion-separation mode in most cases. Consequently, the friction mode was considered the main contact mode that evokes stickiness perception.
In hot and humid environments, some clothing materials may stick to human skin when they are wet due to the presence of sweat or external moisture (Adams et al., 2007; Gerhardt et al., 2008; Tomlinson et al., 2011), thus resulting in sensorial discomfort (Wang et al., 2013), which is often referred to as stickiness perception (Jiang & Wang, 2019; Lou et al., 2015). Different contact modes and their relevant contact conditions between the fabric and skin could generate different mechanical stimuli, such as friction or adhesion. These stimuli are converted into different neural signals by cutaneous receptors and sent to the brain, eventually forming the stickiness perception of different intensities. Understanding the influence of contact modes and relevant variables of stickiness perception is important in analyzing its mechanism of formation. Furthermore, the moisture between the fabric and skin may create a moist feeling (Wang et al., 2003; Wong et al., 2002), and the adhesion between clothing and the body may also restrict body movements (Lou et al., 2015), which would have negative impacts on wear comfort. Therefore, based on the mechanism of formation, finding an effective method that reduces the stickiness perception would be beneficial to guide clothing enterprises in improving wear comfort.
The mechanism responsible for stickiness perception by human skin has been studied by several researchers. It was reported that two modes of contact stimuli: friction (viscous object sliding horizontally on the skin surface; Birzieks et al., 2001; Srinivasan et al., 1990) and adhesion-separation (object adhering to the skin surface being separated vertically from it; Kim et al., 2017; Yeon et al., 2017) could evoke a stickiness perception, as shown in Figure 1. Because the magnitude and direction of the forces caused by the two contact modes are different, these stimuli act on different mechanoreceptors. On the basis of their receptive field size and their response to stimulation modes, the mechanoreceptors are classified into the following four categories (Abraira & Ginty, 2013; Mcglone & Reilly, 2010): RA I (rapidly adapting tape I), RA II (rapidly adapting tape II), SA I (slowly adapting tape I), and SA II (slowly adapting tape II) (Table 1). Friction could cause the skin to be stretched in a tangential direction causing it to vibrate, while adhesion-separation could cause the skin to be stretched in the normal direction. Some studies suggested that the SA II was very sensitive to tangential forces, while the SA I might code both normal and tangential forces (Dargahi & Najarian, 2004). The RA I was sensitive to the transient deformation and low-frequency vibration occurring during the variation of indentation (Abraira & Ginty, 2013; Fagiani et al., 2011; Mcglone & Reilly, 2010). Consequently, the stickiness perception under the two contact modes may be different.
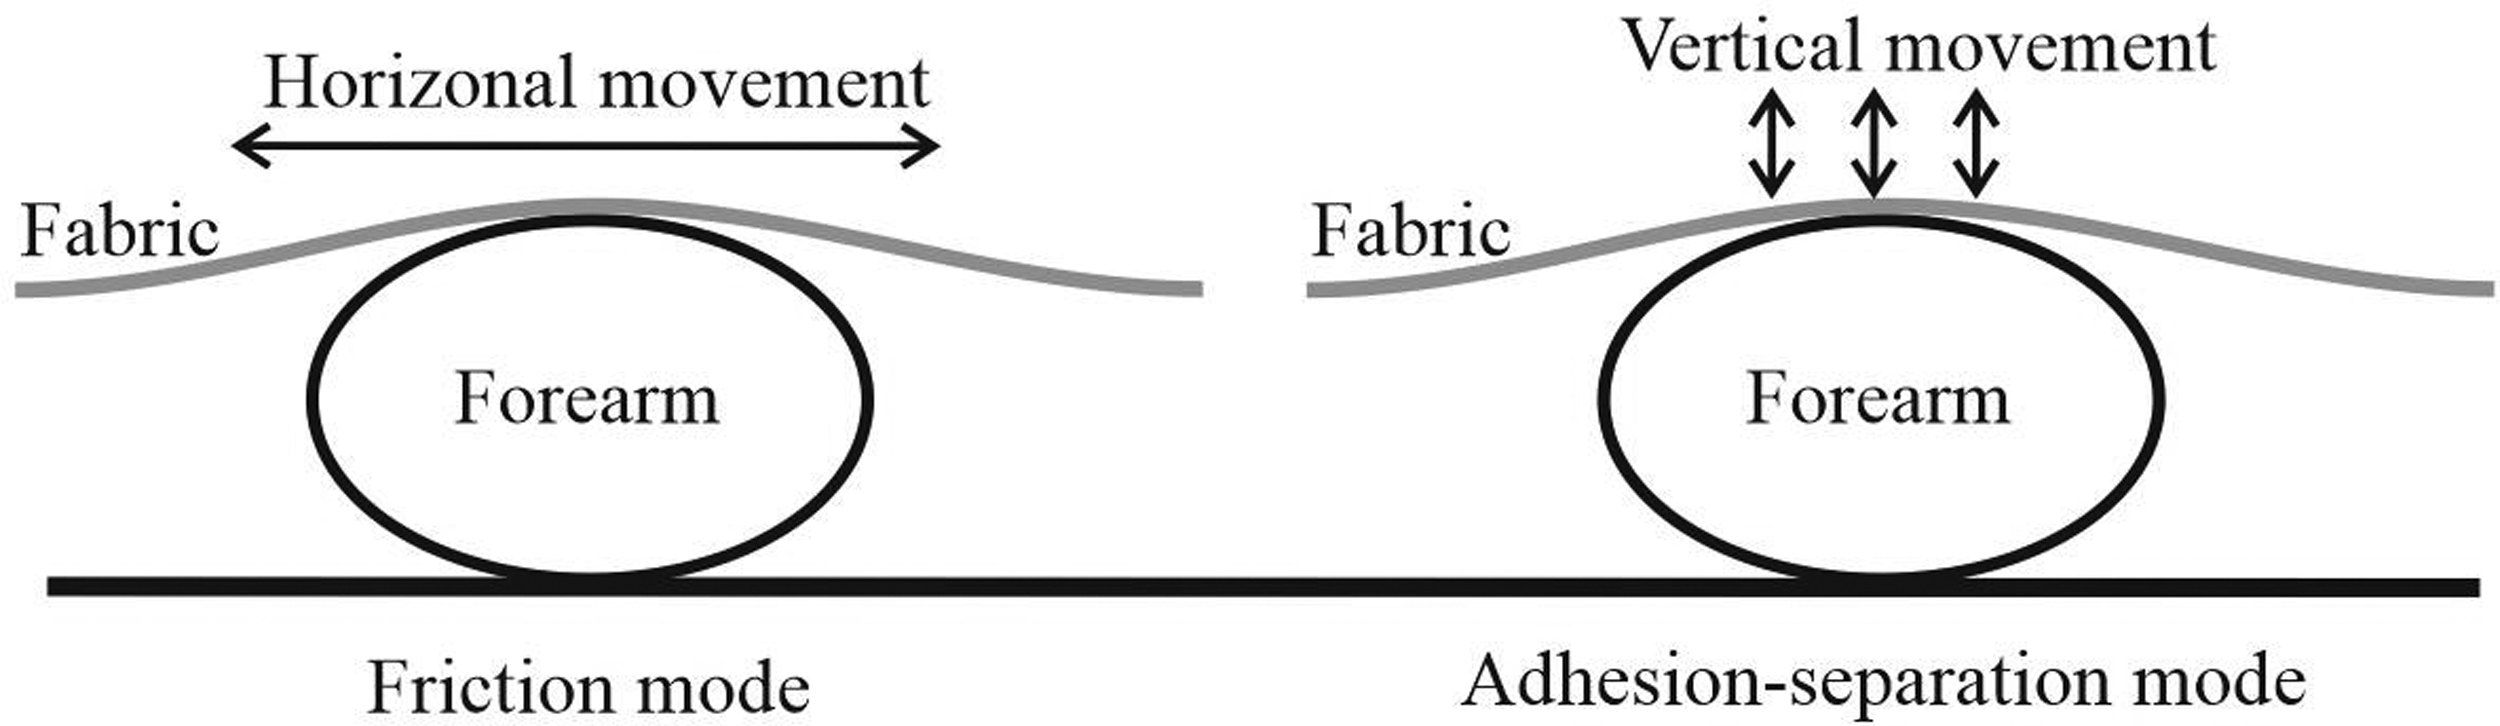
Two modes of contact stimuli between the fabric and skin.
Four Types of Cutaneous Mechanoreceptor.

RA I denotes the rapidly adapting tape I; RA II denotes the rapidly adapting tape II; SA I denotes the slowly adapting tape I; and SA II denotes the slowly adapting tape II. Optimal response stimulus is the optimal stimulus known to elicit the response properties depicted in the last column of this table.
To date, researchers mainly focused on the stickiness perception caused by friction. These factors related to the friction force, including the skin wetness (Gwosdow et al., 1986), water content of the fabric (Tang et al., 2018), water absorption parameters of the fabric (Raccuglia et al., 2018; Tang et al., 2015), and surface features of the fabric (Raccuglia et al., 2018; Tang, Chau, Kan, & Fan, 2018b) have been discussed.
The sweat or external water together with the water absorption parameters of fabric determine the amount of water at the fabric–skin interface, thus affecting the friction force. Gwosdow et al. (1986) discovered that a higher skin wetness resulted in the increase of the friction coefficient as well as in the roughness perception of human skin. A negative correlation between the water absorption capacity of hydrophilic fabric and the absolute threshold of stickiness perception was found by Tang et al. (2015). Raccuglia et al. (2018) and Tang, Chau, Kan, and Fan (2018) discovered that the water absorption capacity contributed to decreasing the stickiness perception. Tang et al. (2018) found a significant linear positive relation between the moisture level of fabric and the stickiness perception, and a model with which to predict stickiness perception was developed. In addition, the surface features of fabric affect the real contact area and the friction force between the fabric and skin. Tang et al. (2015) found that plant-structured knitted fabric that has less contact area showed weakened stickiness perception compared to conventional fabric. However, it was interesting that no relation was found between surface roughness (SMD) measured by a Kawabata Evaluation System for fabric (KES-FB) (Kawabata et al., 1994) and the stickiness perception (Raccuglia et al., 2018; Tang, Chau, Kan, & Fan, 2018b).
Moreover, the contact pressure may increase the friction force between the fabric and skin. The sliding velocity may be related not only to the friction coefficient (Pasumarty et al., 2011; Ramkumar et al., 2004; Tang et al., 2008) but also to the vibration sensation of human skin (Fagiani et al., 2011, 2012). These contact features could also affect the stickiness perception, but have not been discussed in detail. Identifying the relationship among them may help to better design clothing structure to relieve wear discomfort.
Research is lacking in the area of processes and mechanisms involved in the effect of adhesion-separation on stickiness perception. For example, the effect of water absorption capacity, surface features, and surface energy on the stickiness perception caused by adhesion-separation have not been discussed so far.
According to the research background, the stickiness perception caused by the two contact modes has not been systematically analyzed. Accordingly, a set of contact devices were developed to simulate friction and adhesion-separation. Using this device, a magnitude estimation method was adopted to evaluate the stickiness perception of wet fabric. The aims of this study were (a) to examine the effect of the contact pressure and sliding velocity on the stickiness perception under the friction mode, (b) to examine the effects of the fabric properties and separating velocity on the stickiness perception under the adhesion-separation mode, and (c) to compare the difference in stickiness perception between the two contact modes.
Methods
Specimens
Eight types of common apparel fabrics were selected for subjective evaluation. The specifications of the fabrics are summarized in Table 2. These fabrics had different water absorption abilities (1.60–63.47 mg/cm2) and whole surface roughness (WSMD) (0.441–11.314 mm), which can create different liquid bridges between the fabric and skin when in contact with water, and thus can cause different mechanical force (friction and adhesion). Since the mechanical stimulation of the fabric to skin is the important factor for stickiness perception, these fabrics were expected to bring different intensities of stickiness perception. This helps to discover the effect of fabric properties on stickiness perception.
Fabric Specifications.

Note: MIU-warp and MIU-weft denote the friction coefficient of fabric in warp and weft directions, respectively. SMD-warp and SMD-weft denote the surface roughness of fabric in warp and weft directions, respectively. WSMD denotes the geometric mean of the SMD in the warp and weft directions.
The water absorption capacity represents the amount of water absorbed by the fabric and was measured by the method of Tang et al. (2015). A sample was put into a water tank for 5 min and then taken out and hung on a rod vertically until no water dripped within a 30-s interval. The water gain of the fabric was measured as follows:

The top surface wetting time was measured by a moisture management tester (MMT, Sdl Atlas, UK) according to AATCC 195 (AATCC 195, 2010), which represented the surface energy of the fabric and affected the adhesion force at the fabric–water interface. The friction coefficient (MIU) and surface roughness (SMD) were measured by KES-FB. The MIU and SMD in the warp and weft directions were denoted as MIU-warp, MIU-weft, SMD-warp, and SMD-weft. The geometric means of the SMD in the warp and weft directions were used to characterize the overall surface features of the fabric and was denoted as WSMD.
The fabrics were cut into two different sizes. One size was 20 cm (warp) × 10 cm (weft) for the friction sample, and the other size was 12 cm (warp) × 10 cm (weft) used for the adhesion-separation sample. According to AATCC 135 (AATCC 135, 2014), the samples were laundered 3 times before the test.
Subjects
Twelve female college students were invited for the subjective evaluation. Female participants were preferred to male subjects because females generally have less hair on the volar forearm. Power analysis was used to verify that the number of participants is reliable based on a commercial software G power. Each subject was given full information about the purpose and procedure and signed an informed consent form prior the test. According to ISO 11056 (International Organization for Standardization, 1999), the subjects were asked to perform 15 assessments regarding the surface areas of geometric shapes to learn more about the magnitude estimation method. Afterwards, the students were asked to assess the stickiness perceptions of 9 samples (3 Fabrics × 3 Repeats) by the magnitude estimation method. A two-way repeated-measure analysis of variance (ANOVA) test was performed with stickiness perception as the dependent variable and fabric and repeat as the independent variables. Because the dependent variable satisfied the sphericity hypothesis (p > .05) according to Mauchly’s test of sphericity, a sphericity hypothesis test was used to examine the interaction between fabric and repeat. The result showed no significant interaction—sphericity assumed F(4,44) = 1.756, p > .05. Therefore, the main effect could be directly analyzed. The result showed that repeat has no significant impact on the stickiness perception—sphericity assumed F(2,22) = 0.357, p > .05. To further examine the reliability of each assessor, a one-way repeated-measure ANOVA test was used. The null hypothesis was that the stickiness perceptions from three replicates exhibit no difference. The results showed that the p values of the 12 assessors were larger than 0.05, suggesting that the 12 subjects could be regarded as reliable. Kendall’s coefficient was adopted to examine the between-judge consistency in terms of the stickiness perception rankings of nine samples, ranging from 0 to 1 (no agreement to complete agreement). The result showed that Kendall’s coefficient of nine samples was 0.796, which implying that the subjects agreed with each other to a reasonably high extent. In summary, 12 subjects (age: 23.73 ± 1.27 years, height: 1.65 ± 0.01 m, mass: 51.92 ± 2.39 kg, body mass index: 19.07 ± 0.79, forearm girth: 19.96 ± 1.06 cm) were used as reliable assessors.
Experimental Setups
A set of dynamic contact devices was developed to evaluate the stickiness perception under the two contact modes (friction and adhesion-separation), as shown in Figures 2 and 3. Figure 2(a) was the friction device. The sample (10) was clamped by clips (5). One clip was connected to the driving rod (1) which could drag the sample horizontally at a velocity from 0 to 100 mm/s, and the other one was connected to the counterweight of 50 g (6) which could ensure full tension in each sample. The positions of the volar forearms were fixed by grippers (4). The support leg (3) was responsible for adjusting the height of the sample to try to make sure the fabric moved across horizontally against the skin. The speed changer (2) adjusted the ratio of the sliding velocity between the reference sample and the test sample. Figure 2(b) was the adhesion-separation device. The sample (10) was clamped by a clamp plate (9). The elevator (8) on the support fame (7) was connected to the clamp plate (9), which ensured that the sample moved vertically up and down. The other parts of the adhesion-separation device were the same as those of the friction device. Figure 3 was the physical picture of the dynamic contact device.

A set of dynamic contact devices for contact between the fabric and skin. (a) Friction device. (b) Adhesion-separation device. Note: 1 = driving rod; 2 = speed changer; 3 = support leg; 4 = gripper; 5 = clip; 6 = counterweight (50 g); 7 = support frame; 8 = elevator; 9 = clamp plate; and 10 = sample.
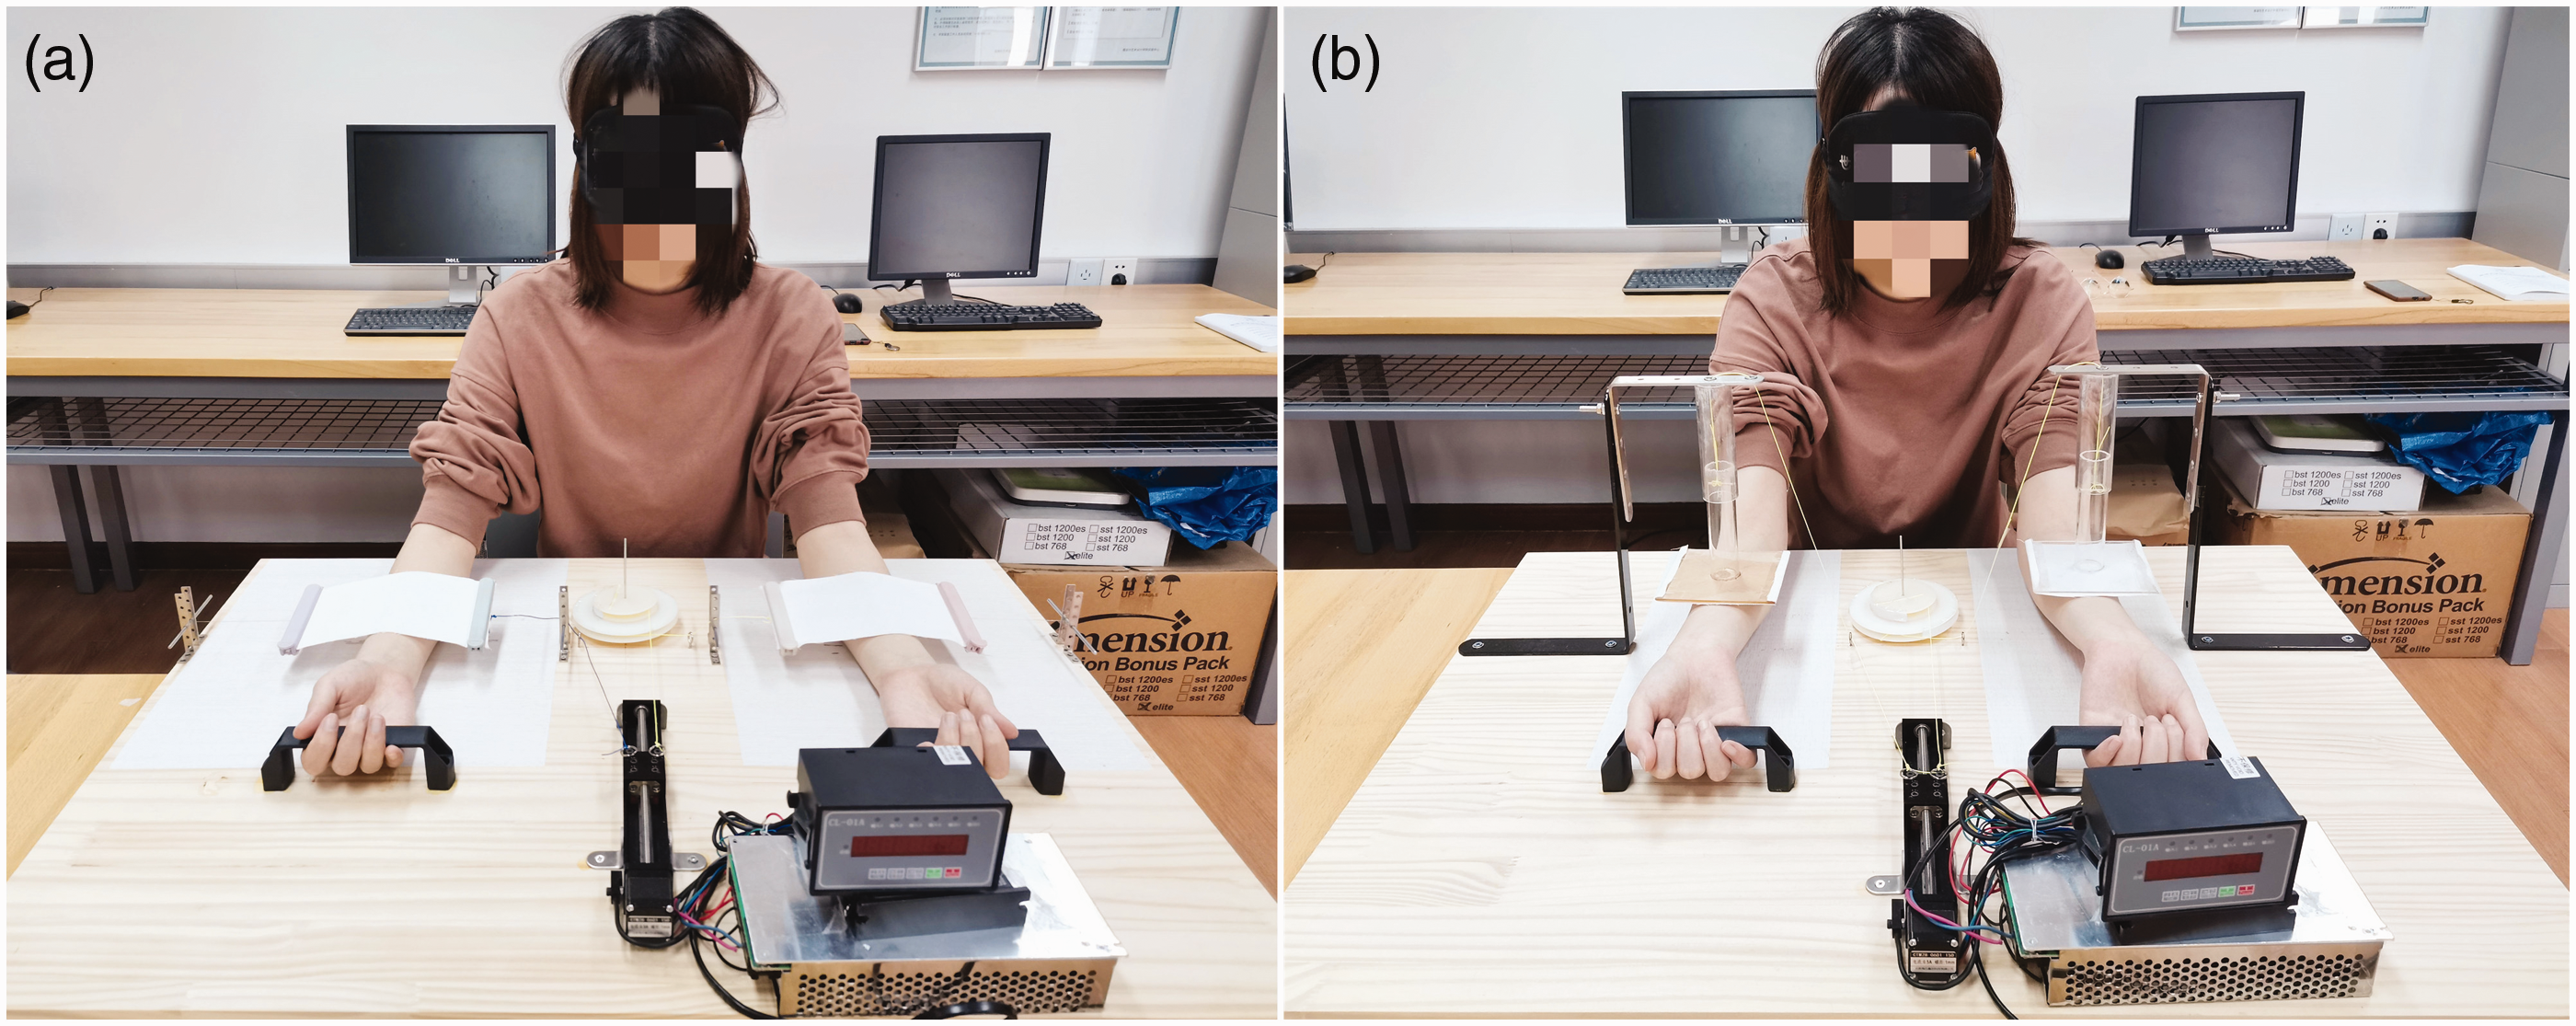
A photo showing the dynamic contact devices. (a) A friction device. (b) An adhesion-separation device.
Experimental Conditions
The subject evaluation experiments were performed in a climatic chamber where the air temperature was 20 ± 1 °C, the relative humidity was 65 ± 5% and the air speed was less than 0.3 mm/s. Contact features, including three contact pressures and two sliding velocities under the friction mode and two separating velocities under the adhesion-separation mode, were set for this experiment. The contact pressures were produced by covering the sample surface with different weights (0 g, 50 g, and 100 g) of silicone. The silicone was soft and had the same shape (20 cm × 10 cm) as the sample. The contact pressure was measured by a pneumatic type pressure testing device (AMI3037-10) with a precision of 0.01 kPa (Yamada & Matsuo, 2009). The contact pressure of each sample was measured 3 times, and its mean and standard deviation are presented in Table 3. The average pressure without the weight was 246 Pa, the average pressure with the weight of 50 g was 406 Pa, and the average pressure with the weight of 100 g was 528 Pa. The contact pressures of the samples ranged from 221 Pa to 573 Pa, which corresponded to a normal range of clothing pressures. According to the dynamic contact of a finger on the fabric surface (the stroke was 15 ± 2 mm, and the frequency was 0.9 ± 0.2 Hz) in Bertaux’s research (Bertaux et al., 2007), the sliding velocity under the friction mode and the separation velocity under the adhesion-separation mode were set as 10 mm/s and 20 mm/s, respectively. As a result, the test included eight contact conditions in this experiment, which were six friction conditions and two adhesion-separation conditions. Each contact condition was coded according to the contact mode (F=friction; AS=adhesion-separation), contact pressure (LP = low pressure of 246 ± 21 Pa; MP = medium pressure of 406 ± 23 Pa; HP = high pressure of 528 ± 23 Pa), and sliding or separating velocity (LV = low velocity of 10 mm/s; HV = high velocity of 20 mm/s). For example, FLPLV stands for the friction mode with a low pressure and a low sliding velocity.
The Contact Pressures of Different Samples.

A water addition of 20 mg/cm2 was designed, which approximated sweat from the whole body when outdoor workers engaged in moderate physical labor for 20 min in summer (Tang et al., 2015). The wetting of the sample was referenced to the method of Raccuglia et al. (2017). The sample was laid flat in a plastic bag. Water was added by a graduated micropipette (the minimum scale was 0.1 ml) positioned at a distance of about 2 cm perpendicular to the center of each sample. When the water spread out uniformly across the sample (about 1 min), the plastic bag was sealed and conditioned for at least 24 h in the test environment to prevent water evaporation and allow the sample to moisten evenly. The sample wetting procedure was the same for all conditions.
The water absorption capacity of Fabric 1 or 2 was less than the water addition. If all the water addition (20 mg/cm2) was added to the sample (Fabric 1 or 2) according to the method of Raccuglia, when the sample was removed from the sealed bag, the unabsorbed water of the sample (20 mg/cm2–3.6 mg/cm2 or 11.9 mg/cm2) would be retained in the sealed bag. To prevent this from occurring, in addition to some of the water (the product of the water absorption capacity of the fabric and sample area) being added to the sample according to the method of Raccuglia, the excess water needed to be sprayed evenly on the volar forearm before the test. The contact area between the fabric and skin was assumed to be 50 cm2 (10 cm × 5 cm). The amount of excess water was calculated as follows:

Experimental Protocol
To prevent any effect from irrelevant variables, a single-blind test was performed by wearing a blindfold. According to ISO 11056, first, the reference stimuli of two contact modes were set. Fabric 5 with a moderate water absorption capacity was selected as the reference sample. The friction between Fabric 5 and the skin with a sliding velocity of 10 mm/s and an average contact pressure of 406 Pa was set as the friction reference stimulus, and the adhesion-separation between Fabric 5 and the skin with a separation velocity of 10 mm/s was set as the adhesion-separation reference stimulus. Then, the experiment set the moduli of the reference stimuli. The 12 subjects were asked to perceive and assess the ratio of stickiness magnitudes between the two reference stimuli. The results showed that the stickiness perception caused by friction was 0.39 times greater than that caused by adhesion-separation. The modulus of friction reference stimulus was assumed to be 100, and then the modulus of adhesion-separation reference stimulus was calculated as 39. Finally, the stickiness perceptions of the two reference stimuli were semantically expressed. A visual analog scale was used to evaluate the semantics of stickiness perception of the two reference stimuli, as shown in Figure 4 (Raccuglia et al., 2018). Meanwhile, the investigator verbally described the perceptions of two extreme points to the subjects. The perception of dry fabric contact with the skin was used as not sticky and the perception of adhesive sticker contact with the skin was used as extremely sticky. The results showed that the stickiness perceptions of the friction reference stimulus and adhesion-separation reference stimulus were slightly sticky and located in the 2/3 position between not sticky and slightly sticky, respectively. It should be emphasized that this scale (Figure 4) was not applied to the subsequent assessment of stickiness perception, and stickiness perceptions were evaluated by the magnitude estimation method (ISO 11056).

A visual analog scale of stickiness perception.
After determining the two reference stimuli and their corresponding moduli and semantic expressions, each subject was required to complete 64 assessments, including 48 types of friction (8 Fabrics × 2 Sliding Velocities × 3 Contact Pressures) and 16 types of adhesion-separation (8 Fabrics × 2 Separating Velocities). None of the samples were reused to prevent contaminants such as body grease from affecting the testing accuracy. The detailed experimental procedures are described as follows:
Subjects entered the climate chamber dressed in long shirts and pants and sat on an adjustable chair for 30 min. The test sample and the reference sample were moved horizontally in a cycle on the volar forearm for 10 s at the same time. Subsequently, the subjects were asked to verbally report the score of the stickiness perception over 10 s. According to the magnitude estimation method, the assessors rated the test stimulus in relation to the reference and its score. If the stickiness perception seemed twice as strong for the test sample compared to the reference sample, then the test sample should have received a value twice that assigned to the reference sample (i.e., 2 × 100). If the perception for the test sample was half as strong, then it should have been rated as 50. In particular, the water absorption capacities of Fabrics 1 and 2 were less than the water addition, and excess water was sprayed evenly on the skin surface for testing before the test. Then, the test sample was placed and the test started after standing for 5 s. The excess water on the skin surface might have slipped down slightly when the sample was sliding, changing the friction force between fabric and skin and interfering with the evaluation results. Therefore, for Fabrics 1 and 2, the subjects were asked to evaluate the stickiness perception at the initial moment of sliding. Finally, the subjects were asked to rest for at least 50 s to avoid sensory fatigue before the next test. When all the assessments of friction were over, the subjects were asked to evaluate the stickiness perception under the adhesion-separation condition in the same way. The previous studies have found that a continuous assessment with less than 1 h did not cause sensory fatigue normally and the assessment values were valid (Raccuglia et al., 2018; Tang et al., 2018). Therefore, to prevent physical and mental fatigue, subjects rested 5 min after completing eight evaluations of stickiness perception (about 20 min). During the rest periods, the experimenter repeatedly asked the subjects if they felt fatigued, and if they did, the rest period was extended. The duration of the whole experiment was approximately 4 h, including adapting period (0.5 h), evaluation period (2–2.5 h) and rest period (1 h).
Data Rescaling and Statistical Analysis
Since each assessor has a different numerical scale of stickiness perception, all the evaluation data needed to be processed and recalled. First, the natural logarithms of the data were calculated. Second, we looked for outliers in the evaluation data and deleted them. Third, as the total number of measurements was less than the product of the number of evaluated treatments and the number of assessors, the natural logarithm data after processing were rescaled by the total rescaling method.
After data rescaling, according to the ratio nature of the measurements, the geometric mean of the scores of the 12 assessors was used as the stickiness perception rating score and marked as SP. The SPs of the reference stimuli of friction and adhesion-separation were approximately 4.6 [ln(100)] and 3.7 [ln(39)], respectively. The with-judge reliability was tested by two-way repeated measures ANOVA and one-way repeated-measures ANOVA. The between-judge consistency was tested by Kendall’s coefficient of concordance. The normality of the distribution of SP data was tested by Shapiro–Wilk test. The interaction between the contact pressure and sliding velocity was analyzed by two-way repeated-measures ANOVA, with the contact pressure (three levels) and sliding velocity (two levels) as the repeated measures variables. The SP data were tested for sphericity, and if the assumption of sphericity was violated, the Greenhouse–Geisser correction was undertaken to adjust the degrees of freedom for the averaged tests of significance. If there was a significant interaction, the simple effects at different variable levels needed to be analyzed, and if there was no significant interaction, the main effects should be analyzed. The SP data under the adhesion-separation mode were analyzed by one-way repeated measures ANOVA, with the separating velocity as the repeated-measures variable. Significant differences of the SP for any two sliding or separating velocities of each fabric were analyzed by a paired sample t test. Linear regression analysis and Pearson’s correlation analysis were used to examine the relationships between fabric parameters (water absorption capacity and surface roughness), contact pressure and SPs under the two contact modes. All the data were analyzed by the commercial software SPSS 22.0. In all analyses, p < .05 was used to establish significant differences.
Results and Discussion
Stickiness Perception Under Friction Mode
The SPs of fabrics with different friction conditions were illustrated using box-and-whisker plots, as shown in Figure 5. The SPs were marked with different patterns according to the friction conditions. The plot clearly illustrates the central tendency and variation of the data for the SP. The mean of the data is represented by a square. The band inside the box is the median, and the bottom and top of the box represent its first and third quartiles, respectively. The ends of the whiskers represent one standard deviation from the mean, while the corresponding maximum and minimum values are marked with asterisks. Under six friction conditions, in most cases, the SP of Fabric 8 was the highest, followed by that of Fabric 2, and next by those of Fabrics 1 and 3. The SPs of Fabrics 4 to 7 were relatively low. Furthermore, the SPs of Fabrics 1, 2, and 8 were greater than 4.6 (slightly sticky) regardless of the friction conditions. Fabric 3 showed a weaker stickiness perception than the perception of slightly sticky at a sliding velocity of 20 mm/s and a contact pressure of 246 Pa, while its SP was stronger than the perception of slightly sticky under the other friction conditions. The SPs of Fabrics 4 to 7 rose and fell around the perception of slightly sticky depending on the different friction conditions.
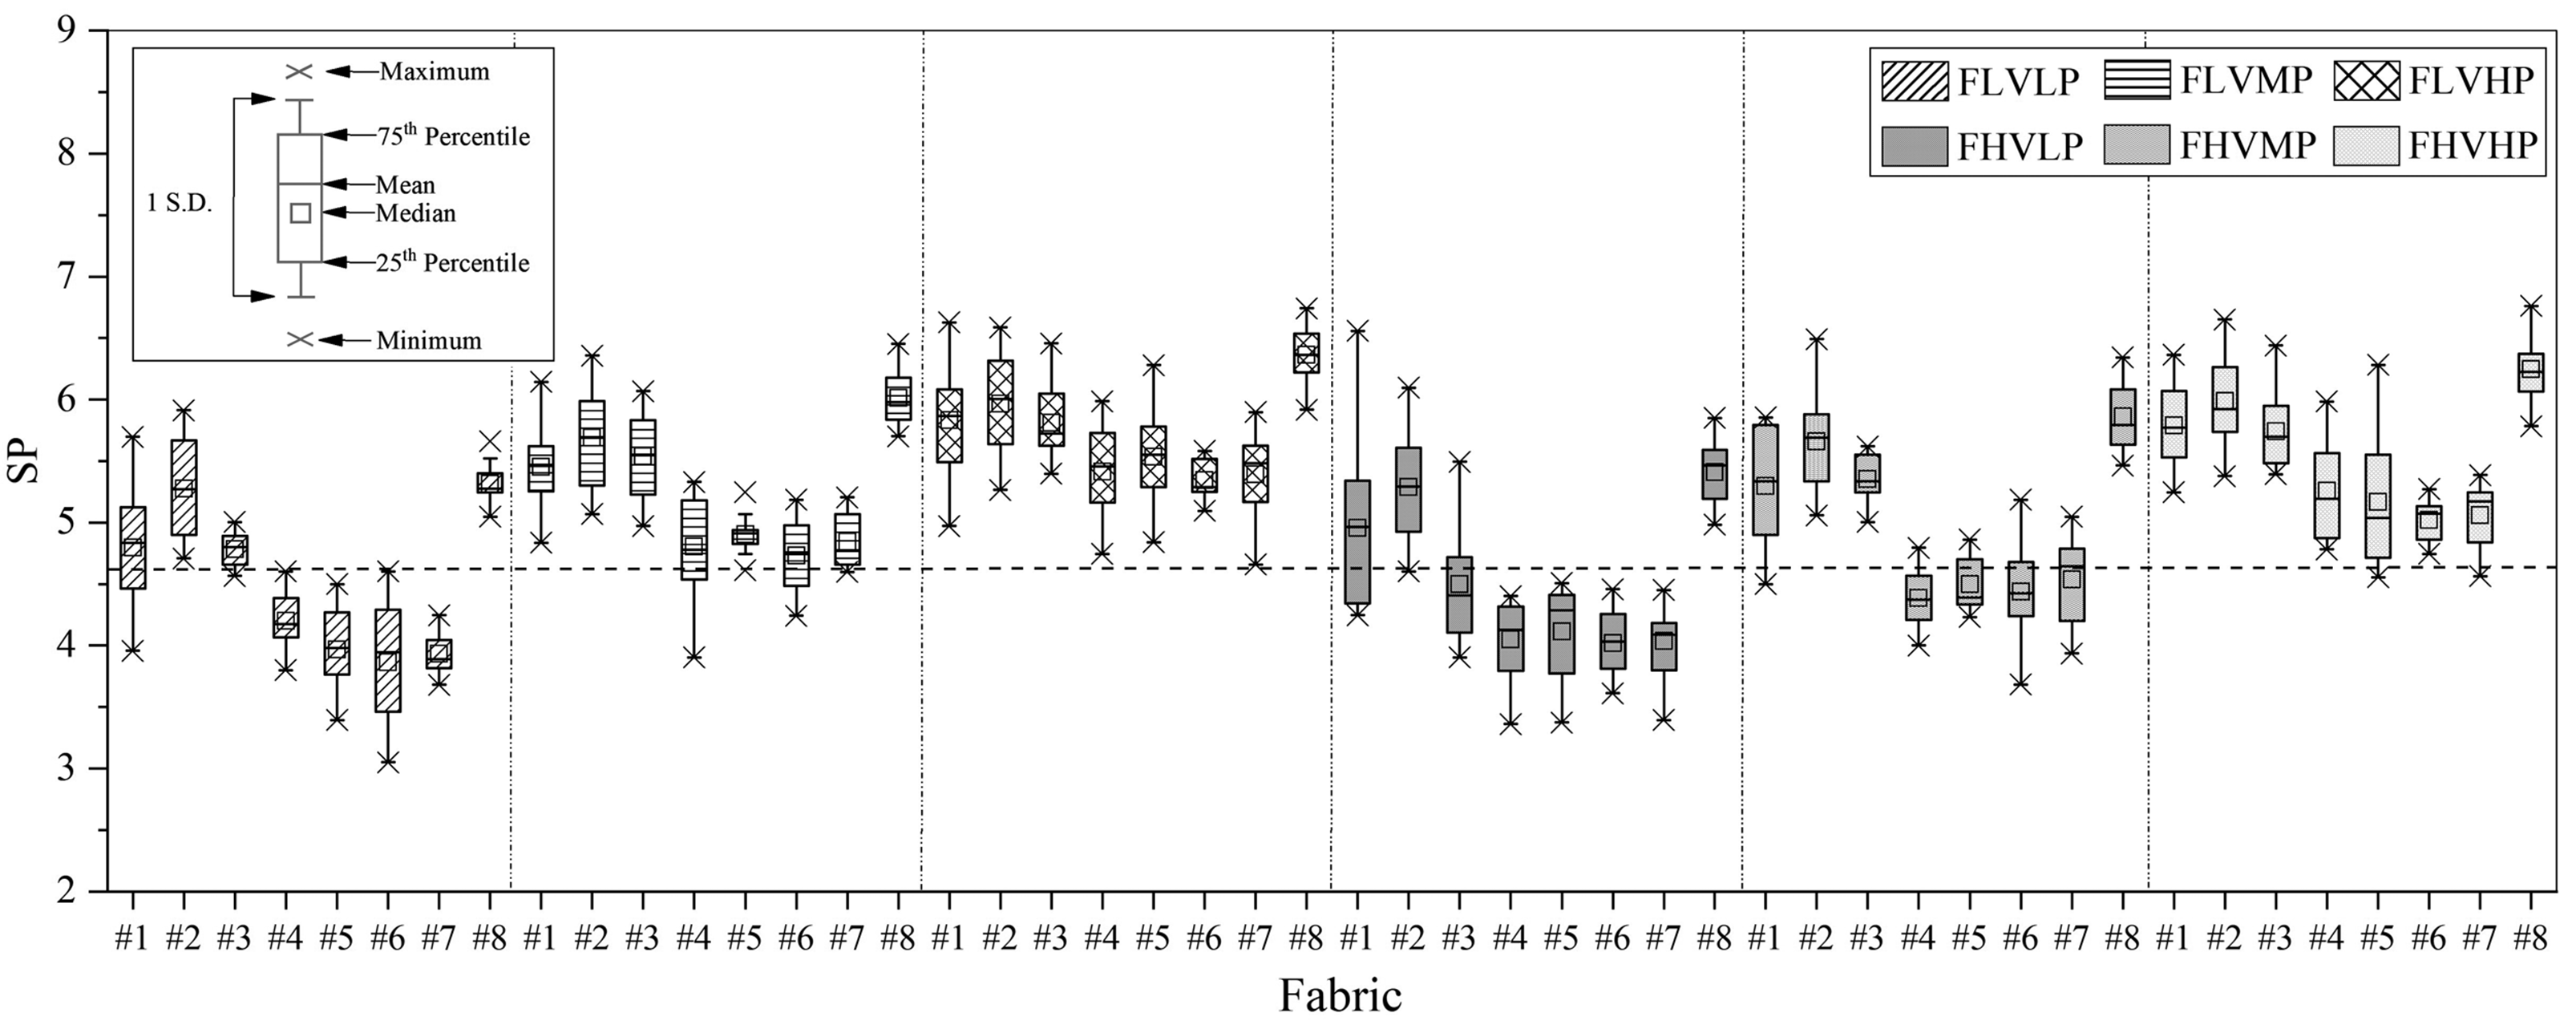
The SPs of fabrics under different friction conditions.
Effects of the Fabric Properties
Water Absorption Capacity
Figure 6 shows that water absorption capacity has a significant relationship (second-order polynomial fit) with the SP under different friction conditions (FLVLP: r2 = .665, p < .05; FLVMP: r2 = .595, p < .05; FLVHP: r2 = .525, p < .05; FHVLP: r2 = 0.589, p < .05; FHVMP: r2 = .581, p < .05; and FHVHP: r2 = .650, p < .05). Moreover, as the water absorption capacity increases, the SP initially deceases slowly, and then its decline is enlarged. Figure 6(c) and (f) shows that under the high-pressure condition, the SPs of the fabrics are larger than 5, regardless of water absorption capacity.
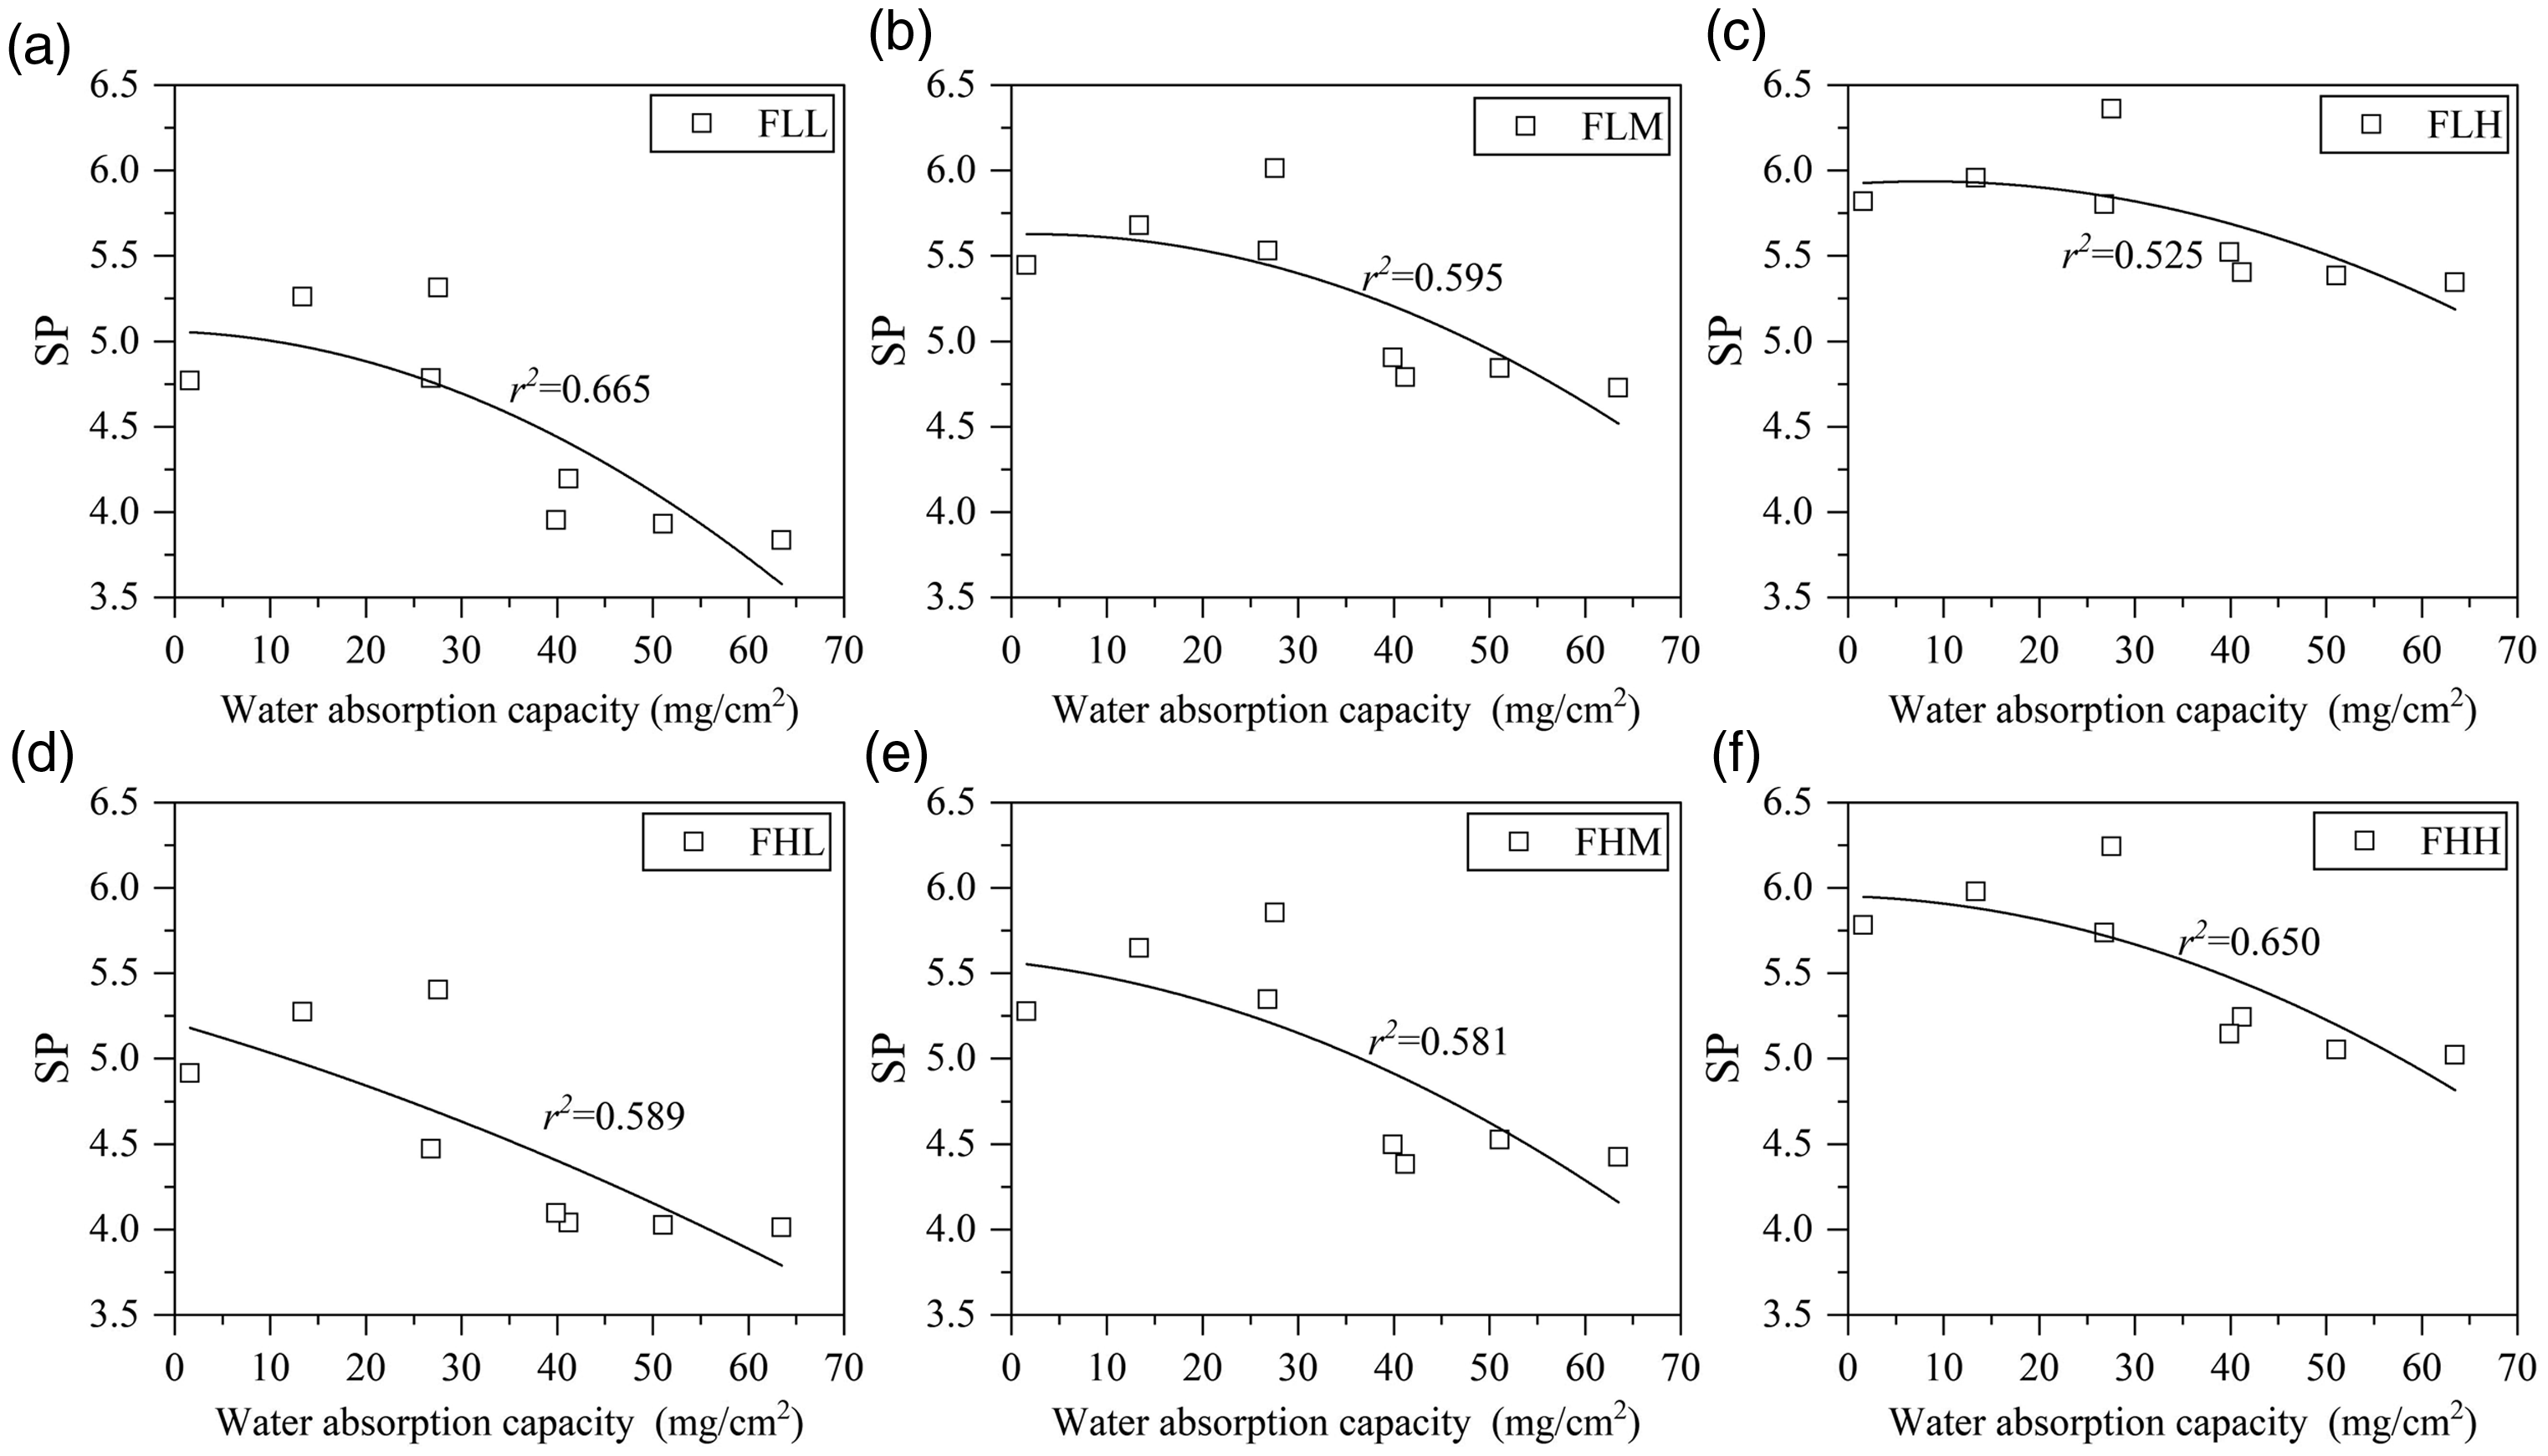
Relationship between the water absorption capacity and SP under different friction conditions. (a) FLVLP, (b) FLVMP, (c) FLVHP, (d) FHVLP, (e) FHVMP, and (f) FHVHP. Note: SP denotes the stickiness perception rating score. FLVLP, FLVMP, FLVHP, FHVLP, FHVMP, and FHVHP denote the friction condition with low velocity and low pressure, low velocity and medium pressure, low velocity and high pressure, high velocity and low pressure, high velocity and medium pressure as well as high velocity and high pressure, respectively.
These findings are consistent with previous reports (Raccuglia et al., 2018; Tang, Chau, Kan, & Fan, 2018b). When a person sweats moderately, a higher water absorption capacity can decrease the amount of water remaining on the fabric surface, thereby weakening the friction force between the fabric and skin together with stickiness perception. However, an interesting phenomenon is that the water absorption capacity of Fabric 1 is the smallest, while it shows a smaller SP than that of Fabric 2 (Figure 5). This may be because the water addition of Fabric 1 was much greater than its water absorption capacity (20 mg/cm2>1.6 mg/cm2), causing the formation of a thicker water bridge that acted as a lubricant between the fabric and skin. Consequently, its friction force and stickiness perception were weakened to some extent.
Surface Roughness
Pearson correlation analysis shows that the SP has no correlation with the SMD-warp under six friction conditions (FLVLP: r = −.324, p > .05; FLVMP: r = −.491, p > .05; FLVHP: r = −.469, p > .05; FHVLP: r = −.464, p > .05; FHVMP: r = −.509, p > .05; and FHVHP: r = −.376, p > .05). This finding seems aligned with those reported by Raccuglia et al. (2018) and Tang, Chau, Kan, and Fan (2018b). It can be concluded that surface feature measured by KES-FB has little impact on the stickiness perception under friction. Kenins (1994) discovered that moisture between the fabric and skin resulted in a large increase of the friction coefficient regardless of the degree of hairiness of the fabric, but large changes in the surface hairiness had little effect on the friction coefficient between the fabric and skin. In this study of stickiness perception, the variation range of the surface roughness of the specimens was relatively small (about 10 µm). For example, the SMD-warp ranged from 1.9 µm to 15.3 µm in Raccuglia et al.’s (2018) study and from 1.68 µm to 12.13 µm in Tang’s study (Tang, Chau, Kan, & Fan, 2018b). Compared to the moisture, this change in the SMD-warp has less effect on the friction force. Therefore, the impact of the SMD-warp is not significant.
Effect of Contact Features
Figure 7 presents the SPs under six friction conditions after the SP data were collapsed over the samples. The Shapiro–Wilk test found that all the p values of the standardized residuals under different friction conditions are greater than .05. This indicates that the SPs obey a normal distribution. A two-way repeated measures ANOVA was performed with SP as the dependent variable and contact pressure and sliding velocity as the independent variables. Because the dependent variable did not satisfy the sphericity hypothesis (p < .05) by a Mauchly’s test of sphericity, a Greenhouse–Geisser test was used to examine the interaction between the contact pressure and sliding velocity. The result showed a significant interaction—Greenhouse–Geisser F(1.122, 7.856) = 6.974, p < .05. Therefore, it is of little significance to analyze the main effect alone, and the simple effects of each factor (contact pressure and sliding velocity) should be analyzed individually.
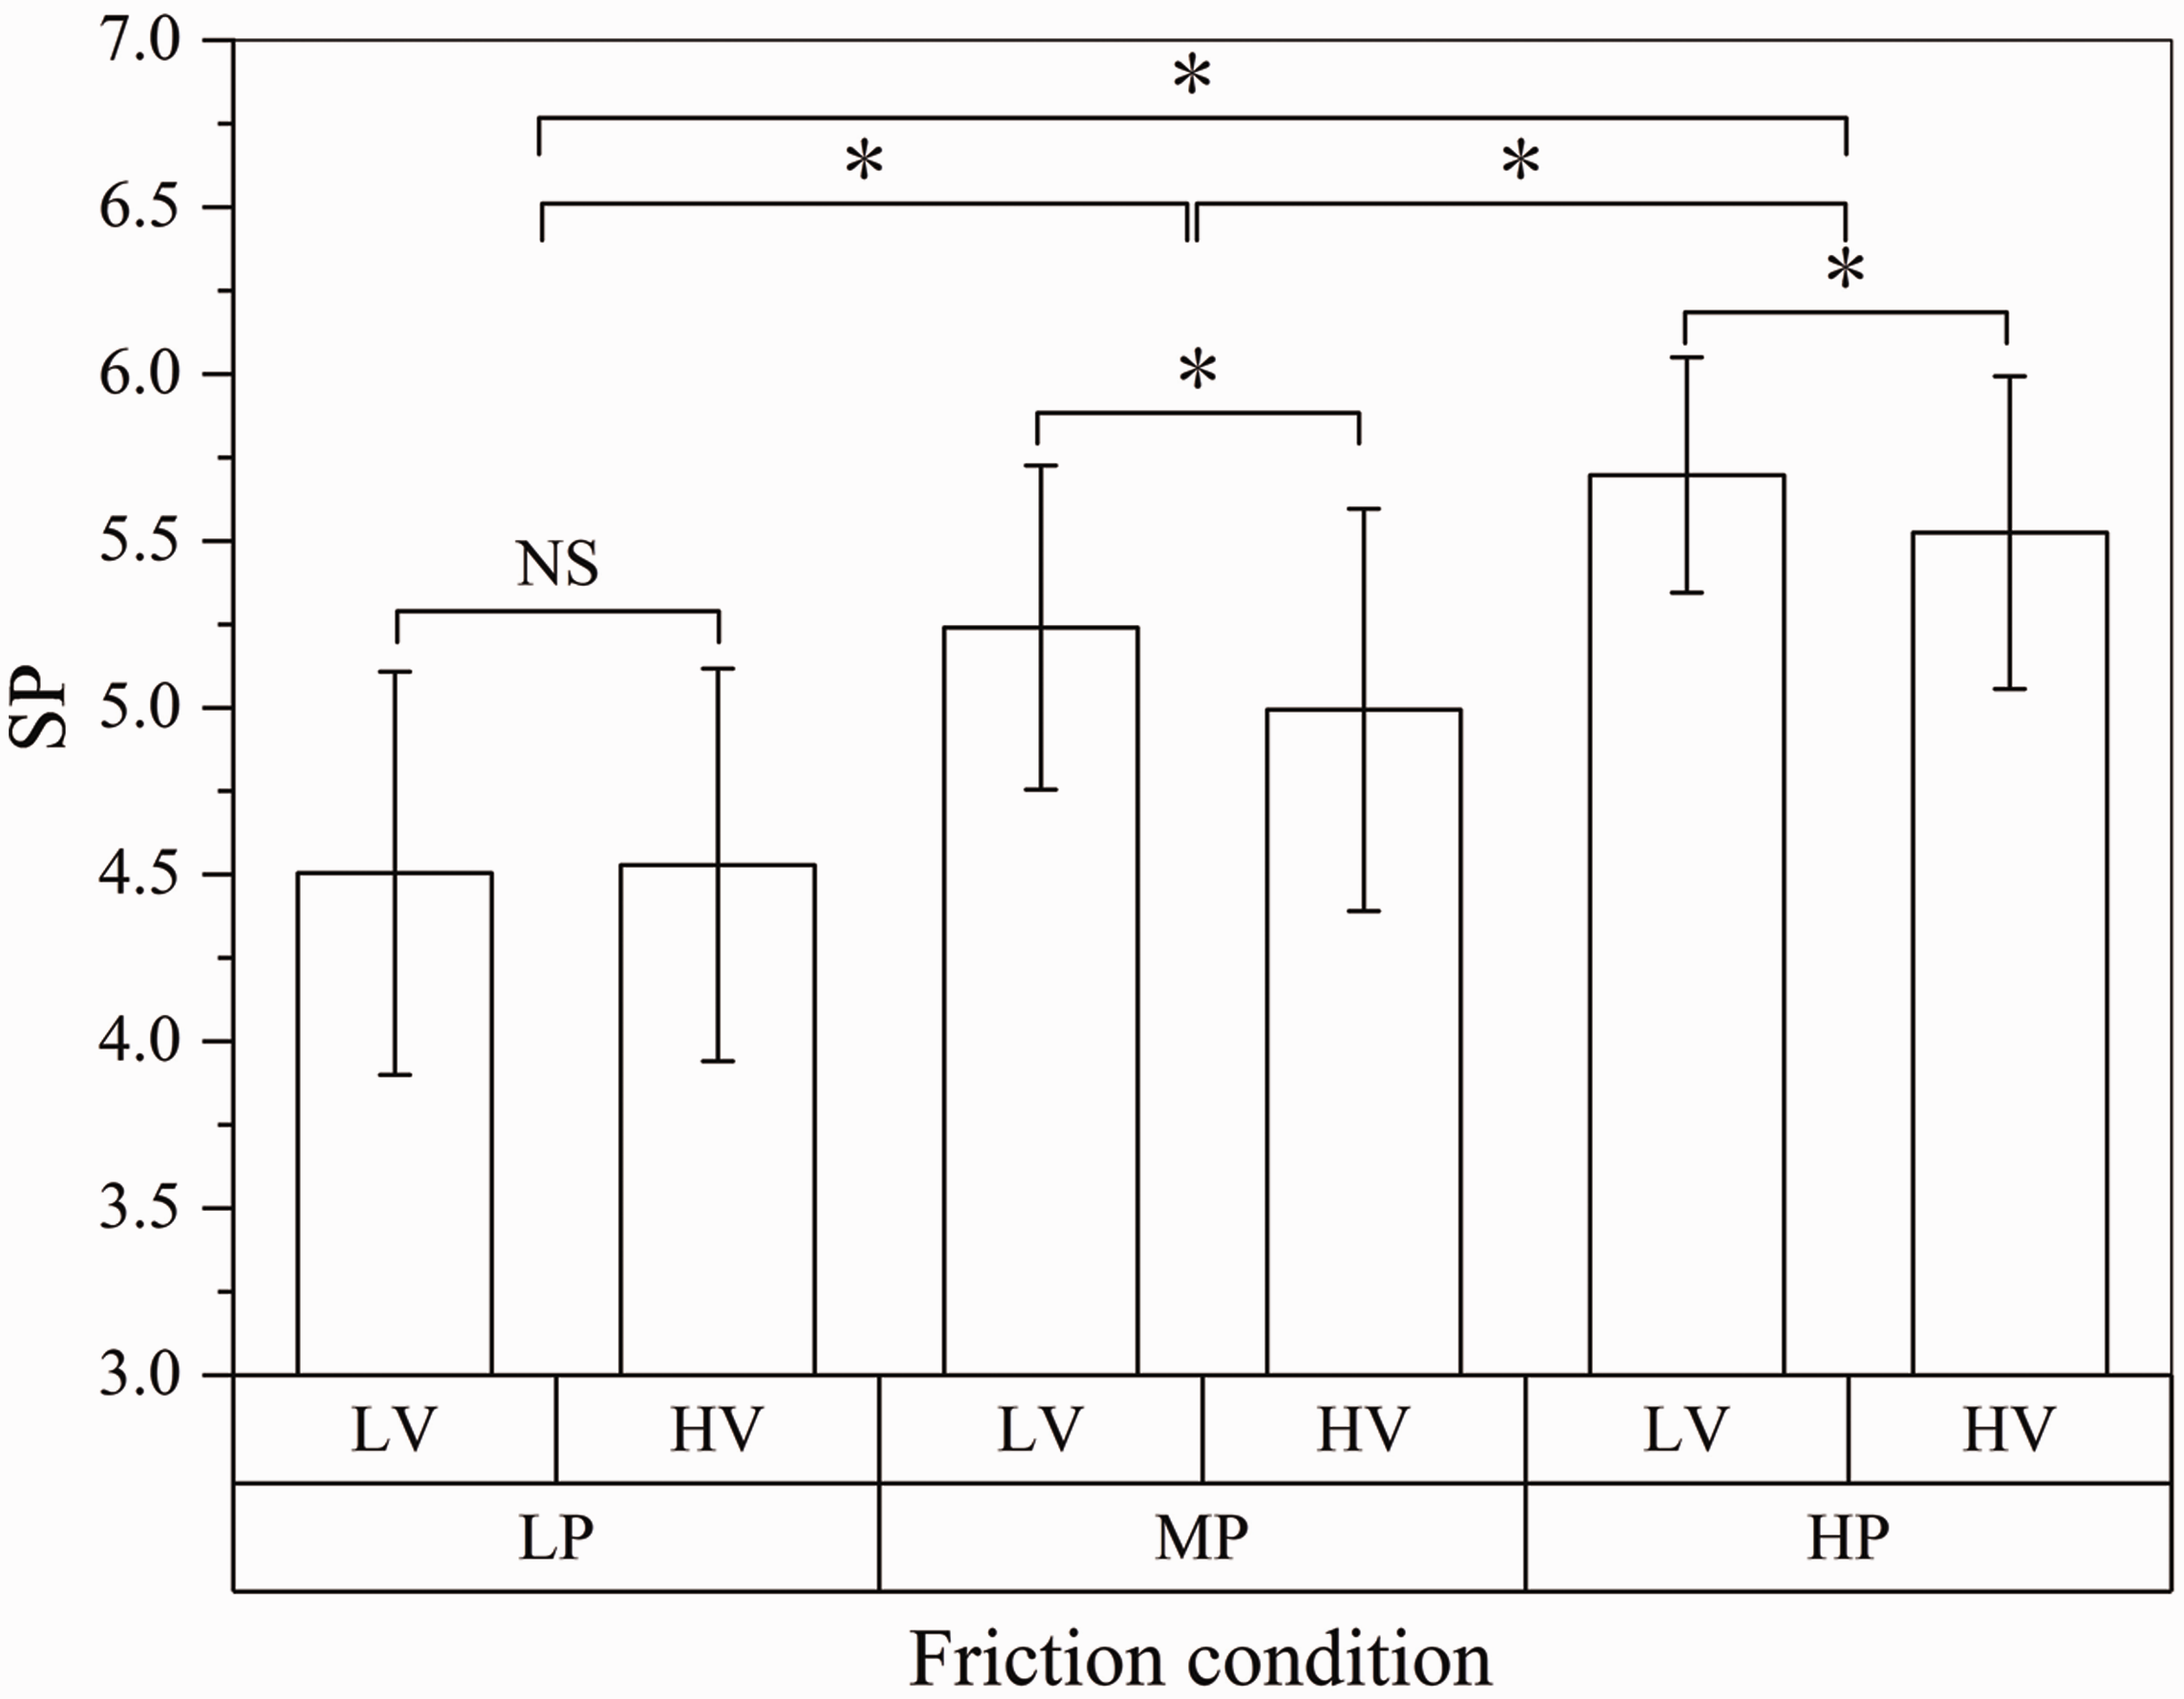
The SPs under six friction conditions after the data were collapsed over the samples. Note: SP denotes the stickiness perception rating score. LV and HV denote the low velocity and high velocity, respectively. LP, MP, and HP denote the low pressure, medium pressure, and high pressure, respectively. The asterisk denotes a significant difference (p < .05) and the NS denotes no significant difference (p > .05).
Contact Pressure
A significant difference is found among the three mean contact pressures at a low velocity—Sphericity assumed F(2, 14) = 2.904, p < .05—and high velocity—Sphericity assumed F(2, 14) = 1.983, p < .05) (Figure 7). Furthermore, the contact pressure has a significant and positive correlation with the SP caused by friction at different sliding velocities—low velocity: r2 = .500, p < .05 and high velocity: r2 = .379, p < .05 (Figure 8). These findings suggest that contact pressure plays an important role in stickiness perception. According to Amonton’s law, the friction force is proportional to the normal load. Contact pressure can increase the friction force between the fabric and skin, which increases the skin deformation during sliding and thus sends more mechanical stimulation signals to the brain; hence, the stickiness perception is higher.
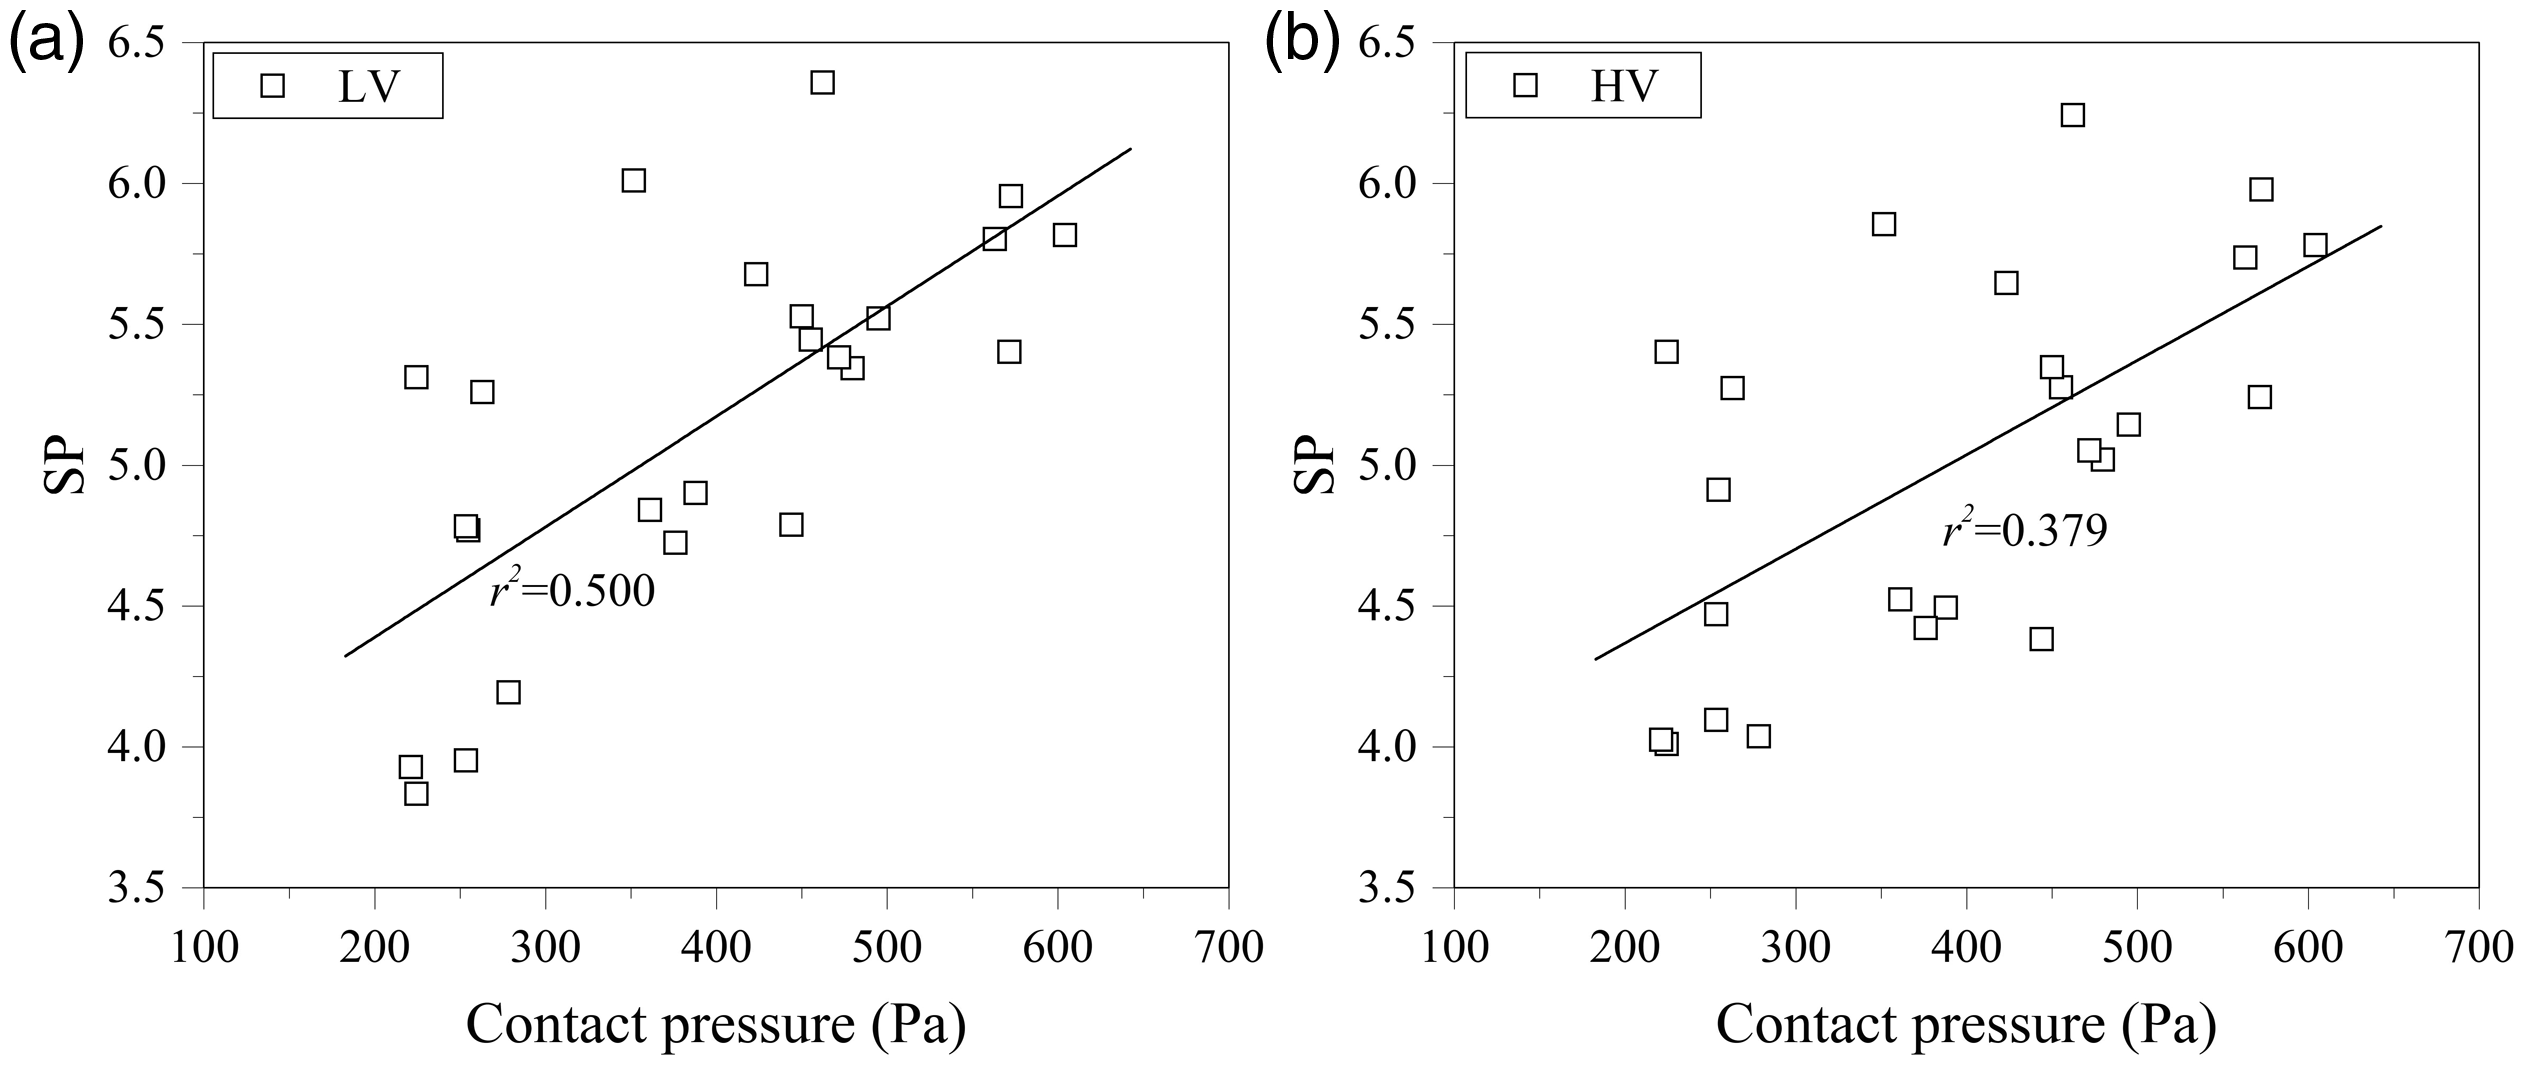
Relationship between the contact pressure and SP caused by friction at different sliding velocities. (a) LV and (b) HV.
Sliding Velocity
A significant difference is found between the two sliding velocities at medium pressure—Sphericity assumed F(1, 7) = 26.520, p < .05—and high pressure—Sphericity assumed F(1, 7) = 229.666, p < .05; however, no significant difference is found between the two sliding velocities at low pressure—Sphericity assumed F(1, 7) = 0.188, p > .05) (Figure 7). Moreover, a more detailed analysis can be performed using a paired sample t test, which displays the significant differences between the two sliding velocities for each fabric with the same pressure (Figure 9). The values for Fabrics 4 to 7 with medium pressure and Fabrics 6 and 7 with high pressure are significantly increased at low velocity compared to high velocity, while the SPs of other fabrics do not exhibit differences between the two sliding velocities.

Comparison of SPs between the two sliding velocities under different pressure conditions. (a) LP, (b) MP, and (c) HP. Note: SP denotes the stickiness perception rating score. LP, MP, and HP denote the low pressure, medium pressure, and high pressure, respectively. The asterisk denotes a significant difference between the two sliding velocities (p < .05).
There are two explanations for the findings. First, the sliding velocity affects the friction coefficient between the fabric and skin. Several studies found the friction coefficient slightly decreased when the sliding velocity was 10 mm/s to 100 mm/s (Fagiani et al., 2011; Pasumarty et al., 2011). This is because skin and fabric are characterized by nonlinear, viscoelastic material properties; Amonton’s law does not hold for the friction between the fabric and skin (Derler & Gerhardt, 2012). According to the theoretical concept for the friction of elastomers, the friction is composed of interfacial component (Fint) and deformation component (Fdef) (Adams et al., 2007), and this friction is primarily determined by the interfacial component (Wolfram, 1983). The interfacial component is expressed as follows:


Stickiness Perception Under Adhesion-Separation Mode
Figure 10 shows that under different adhesion-separation conditions, Fabric 1 presents the highest SP compared to the other fabrics, followed by Fabrics 2 and 8 and then by Fabric 3, and the SPs of Fabrics 4 to 7 are relatively low. In addition, the mean SPs of Fabrics 1, 2, and 8 are greater than 4.6 (slightly sticky), while the other fabrics cannot arouse the perception of slightly sticky.
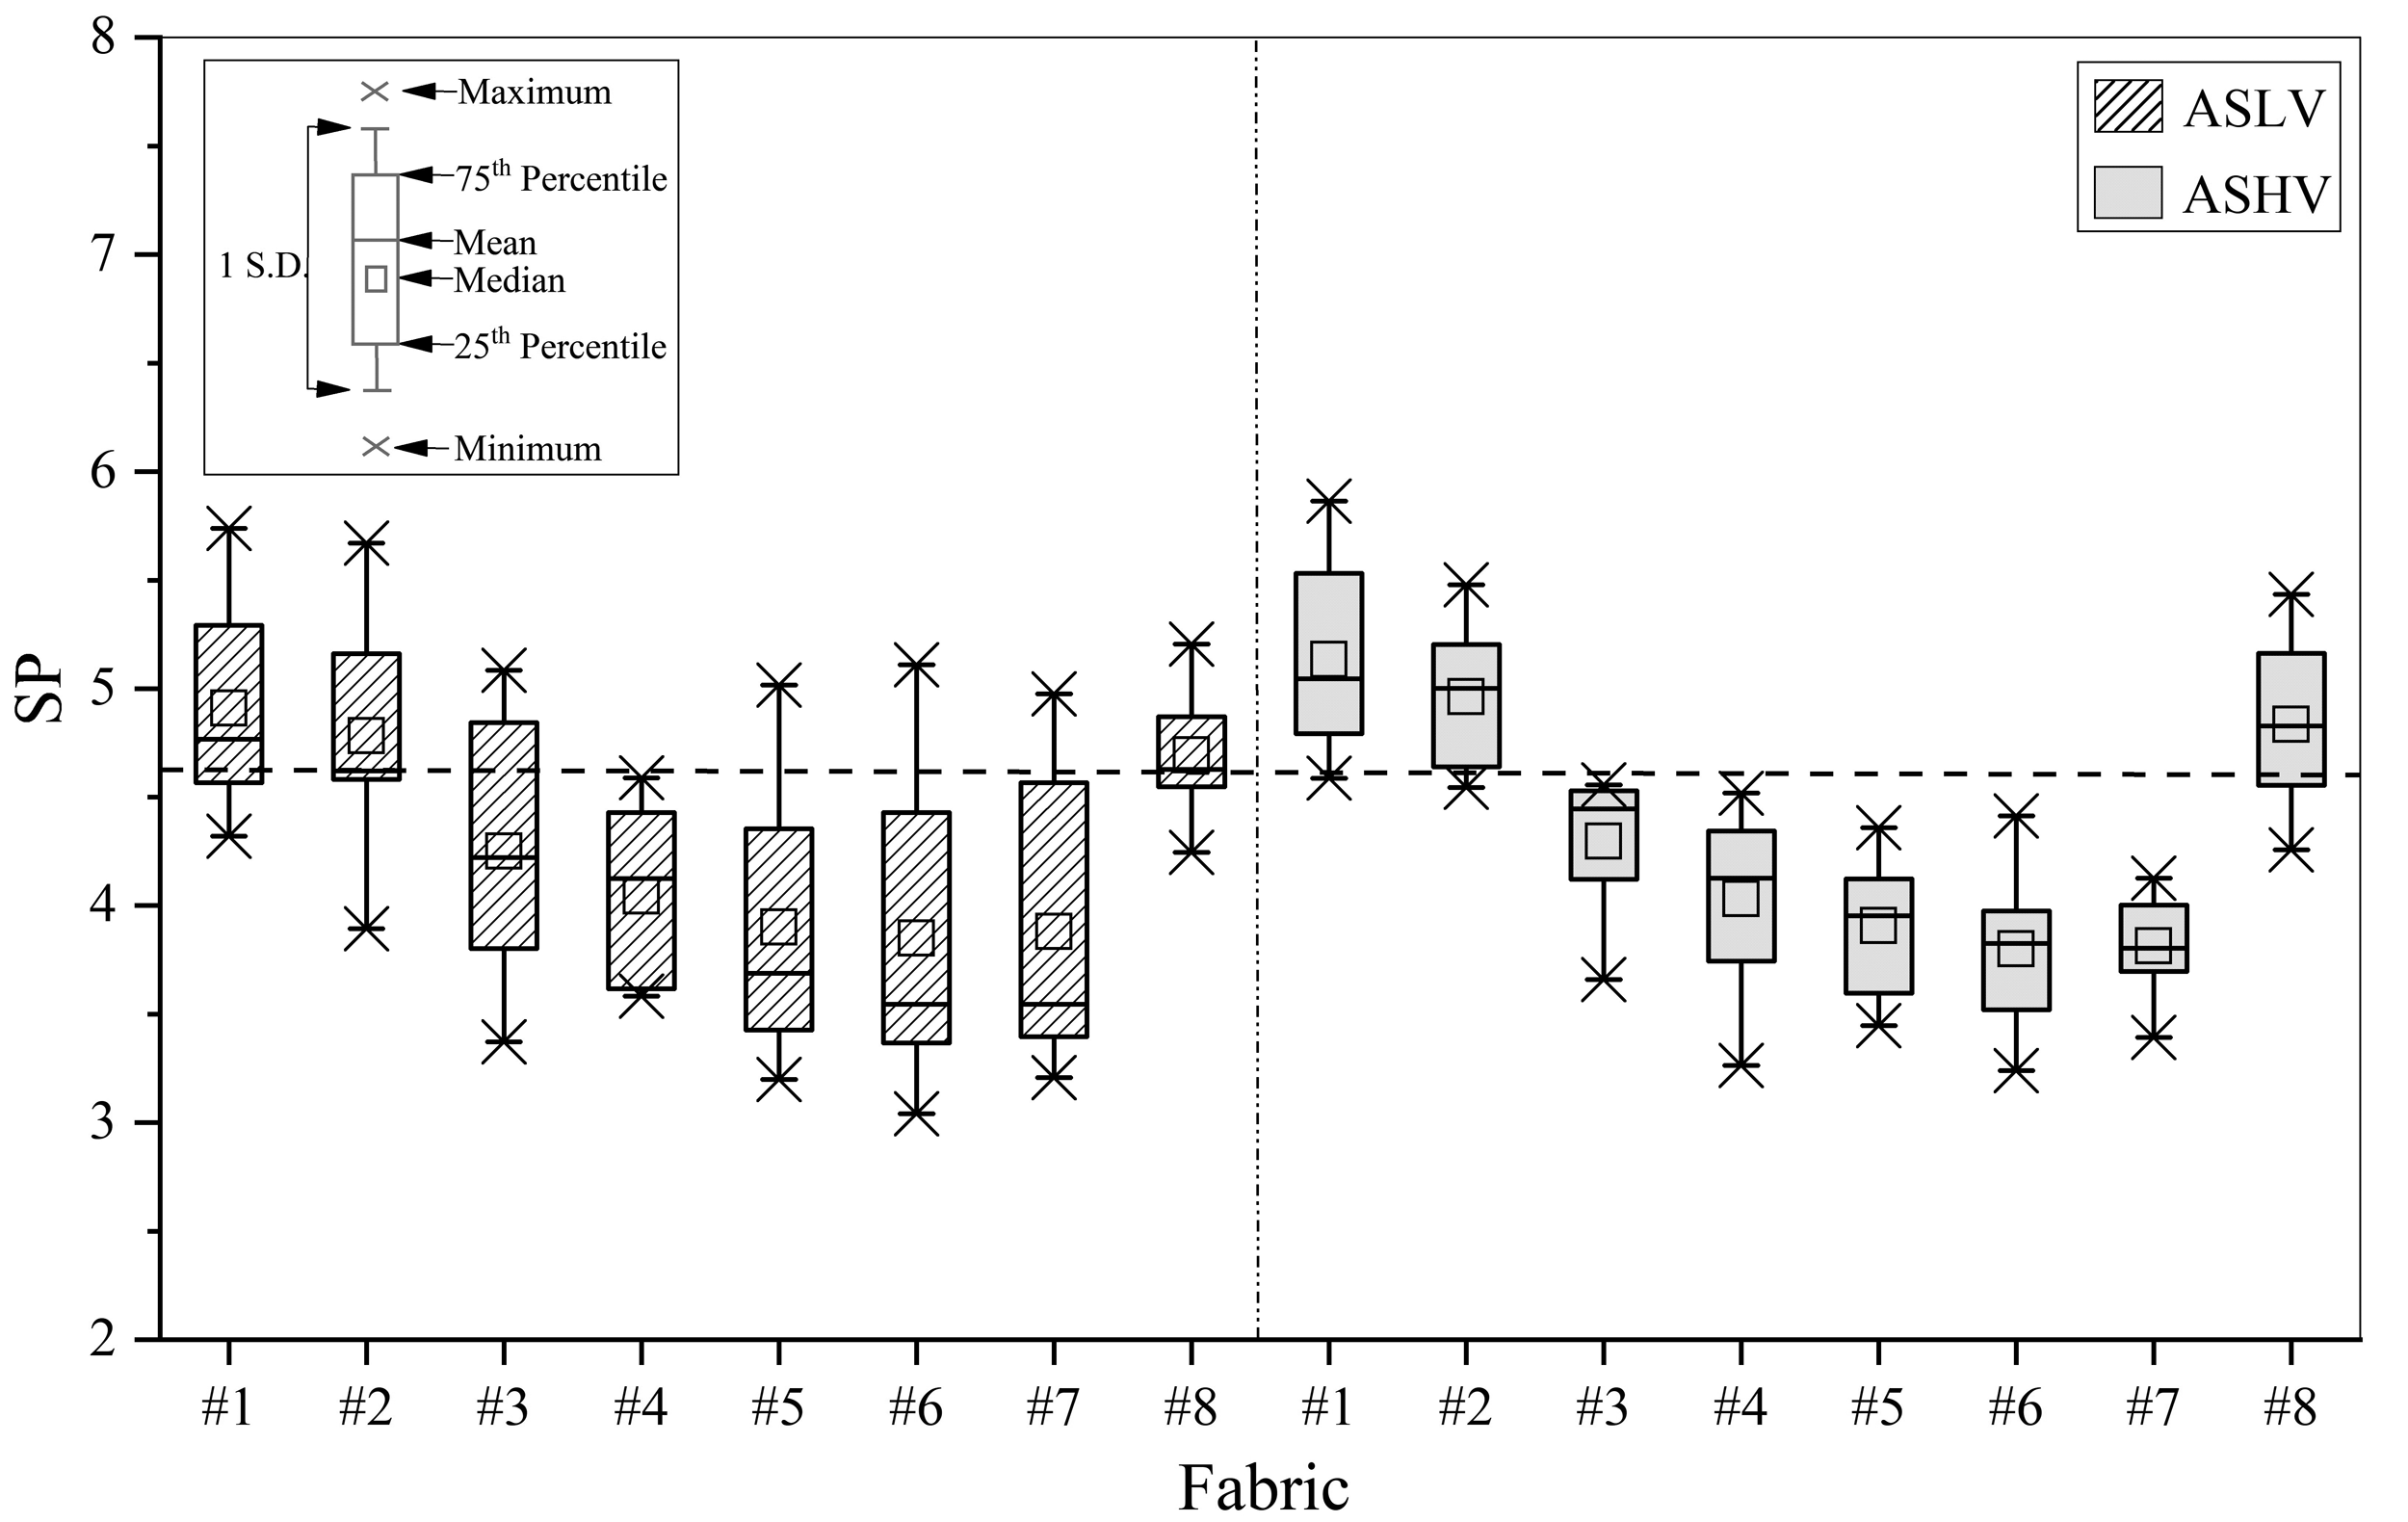
The SPs of fabrics under different adhesion-separation conditions. Note: SP denotes the stickiness perception rating score. ASLV and ASHV denote the adhesion-separation condition with low velocity and high velocity, respectively.
Effect of Fabric Properties
Water Absorption Capacity
Figure 11 shows that the water absorption capacity has a significant relationship (second-order polynomial fit) with the SP under two adhesion-separation conditions (ASLV: r2=.847, p < .05; and ASHV: r2=.866, p < .05) Moreover, as the water absorption capacity increases, the SP decreases almost linearly. These findings suggest that a higher water absorption capacity may also reduce the stickiness perception under the adhesion-separation modes. Increasing the water absorption capacity may reduce the area of the liquid bridge on the fabric surface, which reduces the adhesive force between the fabric and skin. Therefore, the stickiness perception is weakened.
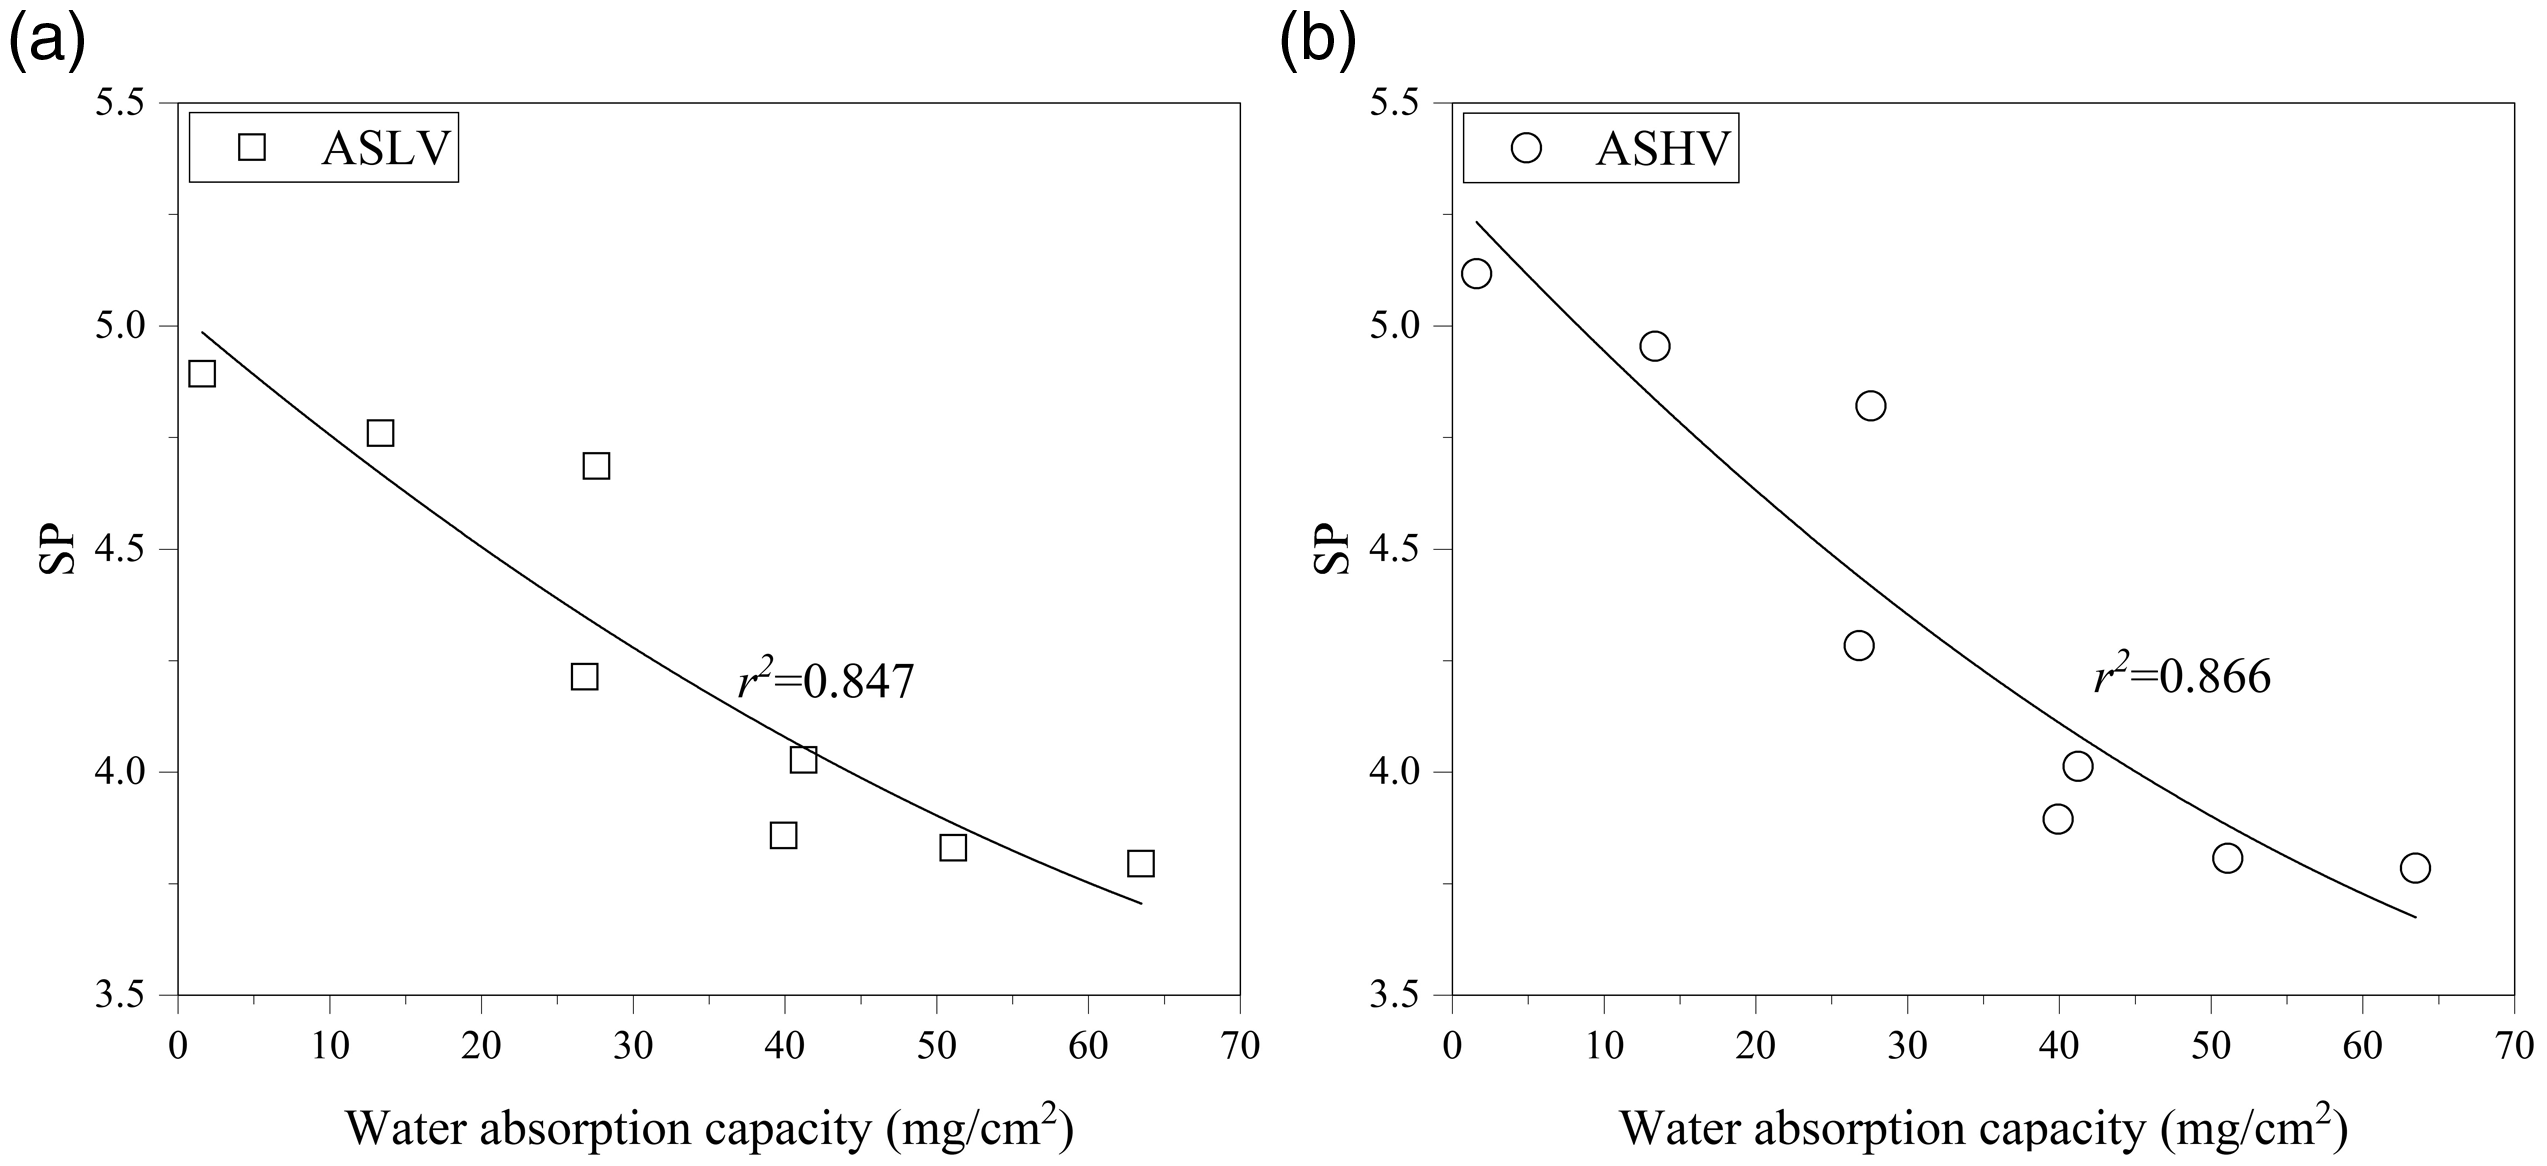
Relationship between the water absorption capacity and SP under different adhesion-separation conditions. (a) ASLV. (b) ASHV. Note: SP denotes the stickiness perception rating score. ASLV and ASHV denote the adhesion-separation condition with low velocity and high velocity, respectively.
Surface Roughness
Similarly, no significant correlation was observed between the WSMD and the SP caused by adhesion-separation (ASLV: r = −.590, p < .05; and ASHV: r = −.618, p < .05). Although we have not found significant correlations under the adhesion-separation conditions, their correlations were higher than those under the friction conditions. This finding implies that surface roughness might have more influence on stickiness perception caused by friction versus adhesion-separation. In other words, a higher WSMD might cause a lower SP. Lou et al. (2017) found that a smooth surface could be conducive to the formation of a liquid bridge and, in turn, increase the adhesion force between fabric and skin. Therefore, a smooth surface can produce a strong SP under adhesion-separation.
Top Surface Wetting Time
No significant correlation is found between the top surface wetting time and SP under two adhesion-separation conditions (ASLV: r = −.047, p > .05; ASHV: r = −.074, p > .05). Lou et al. (2018) suggested that a longer wetting time with a lower surface energy gave a smaller adhesion force at the fabric–water interface. However, this change was not found, which may have been due to the different amounts of water remaining on the fabric surface in the study. The samples were completely wetted in Lou’s study; thus, the area and thickness of the liquid bridges of different fabrics were similar. Nevertheless, in this study, samples with the same water addition resulted in different areas and thicknesses of the liquid bridges due to the differing water absorption capacities, which could have interfered with the impact of the wettability of the fabric on the stickiness perception.
Effect of the Separating Velocity
Figure 12 presents the SPs under two adhesion-separation conditions after the SP data were collapsed over the samples. The Shapiro–Wilk test found that all the p values of the standardized residuals were greater than .05 under two adhesion-separation conditions. This indicates that the SPs obey a normal distribution. A one-way repeated measures ANOVA was performed to compare the difference in the SP between the two separating velocities. The result showed no significant difference between them—Sphericity Assumed F(1,7)=4.950, p > .05. Moreover, Fabrics 1, 2, and 8 show a slightly higher SP at a high velocity than at a low velocity, regardless of the lack of significant difference (Figure 13). The separating velocity may change the rate of the adhesion force together with the rate of skin deformation, thus causing the RA I to release more neural signals to the brain (Abraira & Ginty, 2013; Mcglone & Reilly, 2010). Consequently, the separating velocity is expected to change the stickiness perception. However, in this study, the separating velocity has no significant effect on the stickiness perception. On one hand, the RA I might not be involved in the expression of stickiness perception; therefore, there would not be significant difference. On the other hand, there might be an interaction between the separating velocity and the adhesion force. Fabrics 4 to 7 show higher water absorption capacities, so that almost no water remains on their surface, leading to difficulty in forming liquid bridges. Consequently, their adhesion forces are very small or even 0. It is difficult for these fabrics to stretch skin due to their small adhesion forces, regardless of the separating velocity. As a result, the SPs of Fabrics 4 to 7 showed no significant difference between the two separating velocities. Instead, Fabrics 1, 2, and 8 show a greater adhesion force. With the increase of the sliding velocity, the greater adhesion force is associated with the greater change rate. This might be the reason that they show a higher SP at a high sliding velocity.
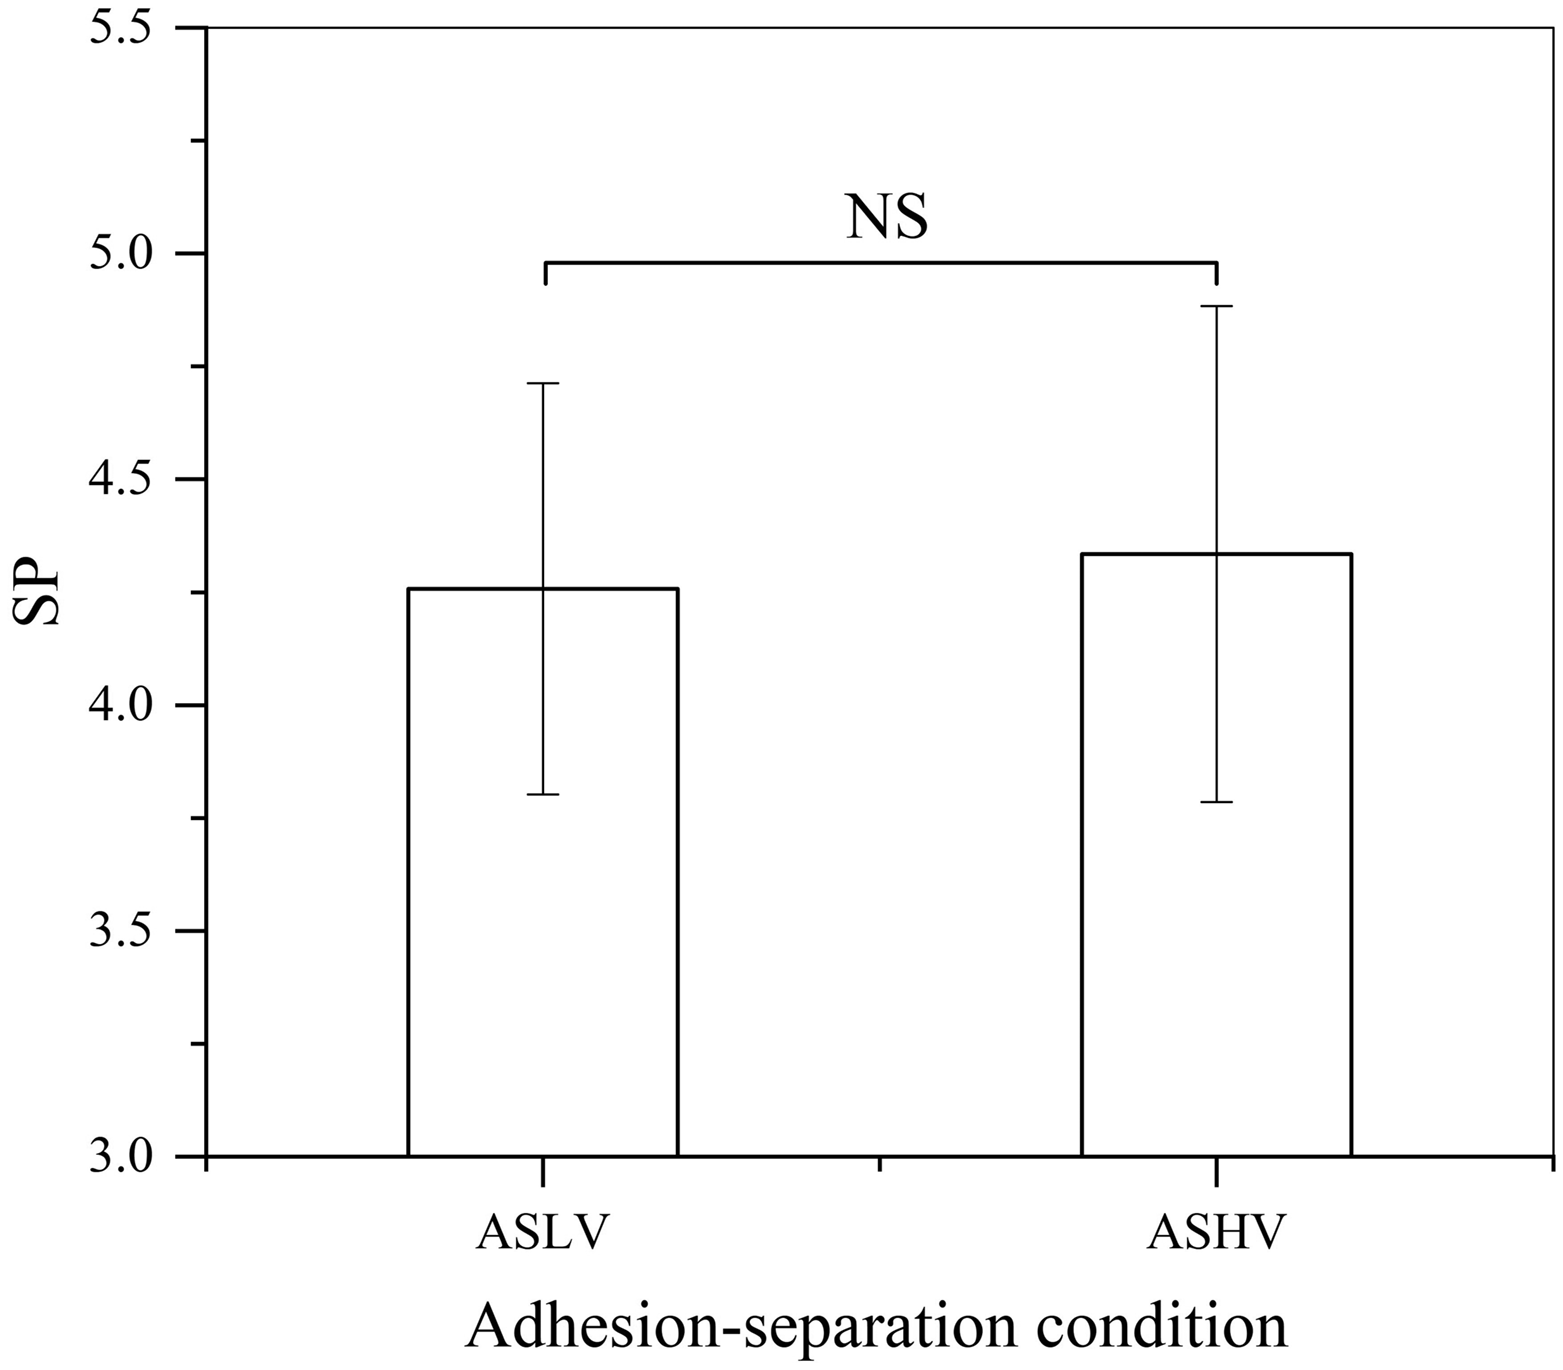
The SPs under two adhesion-separation conditions after the data were collapsed over the samples. Note: SP denotes the stickiness perception rating score. ASLV and ASHV denote the adhesion-separation condition with low velocity and high velocity, respectively. The NS denotes no significant difference (p > .05).
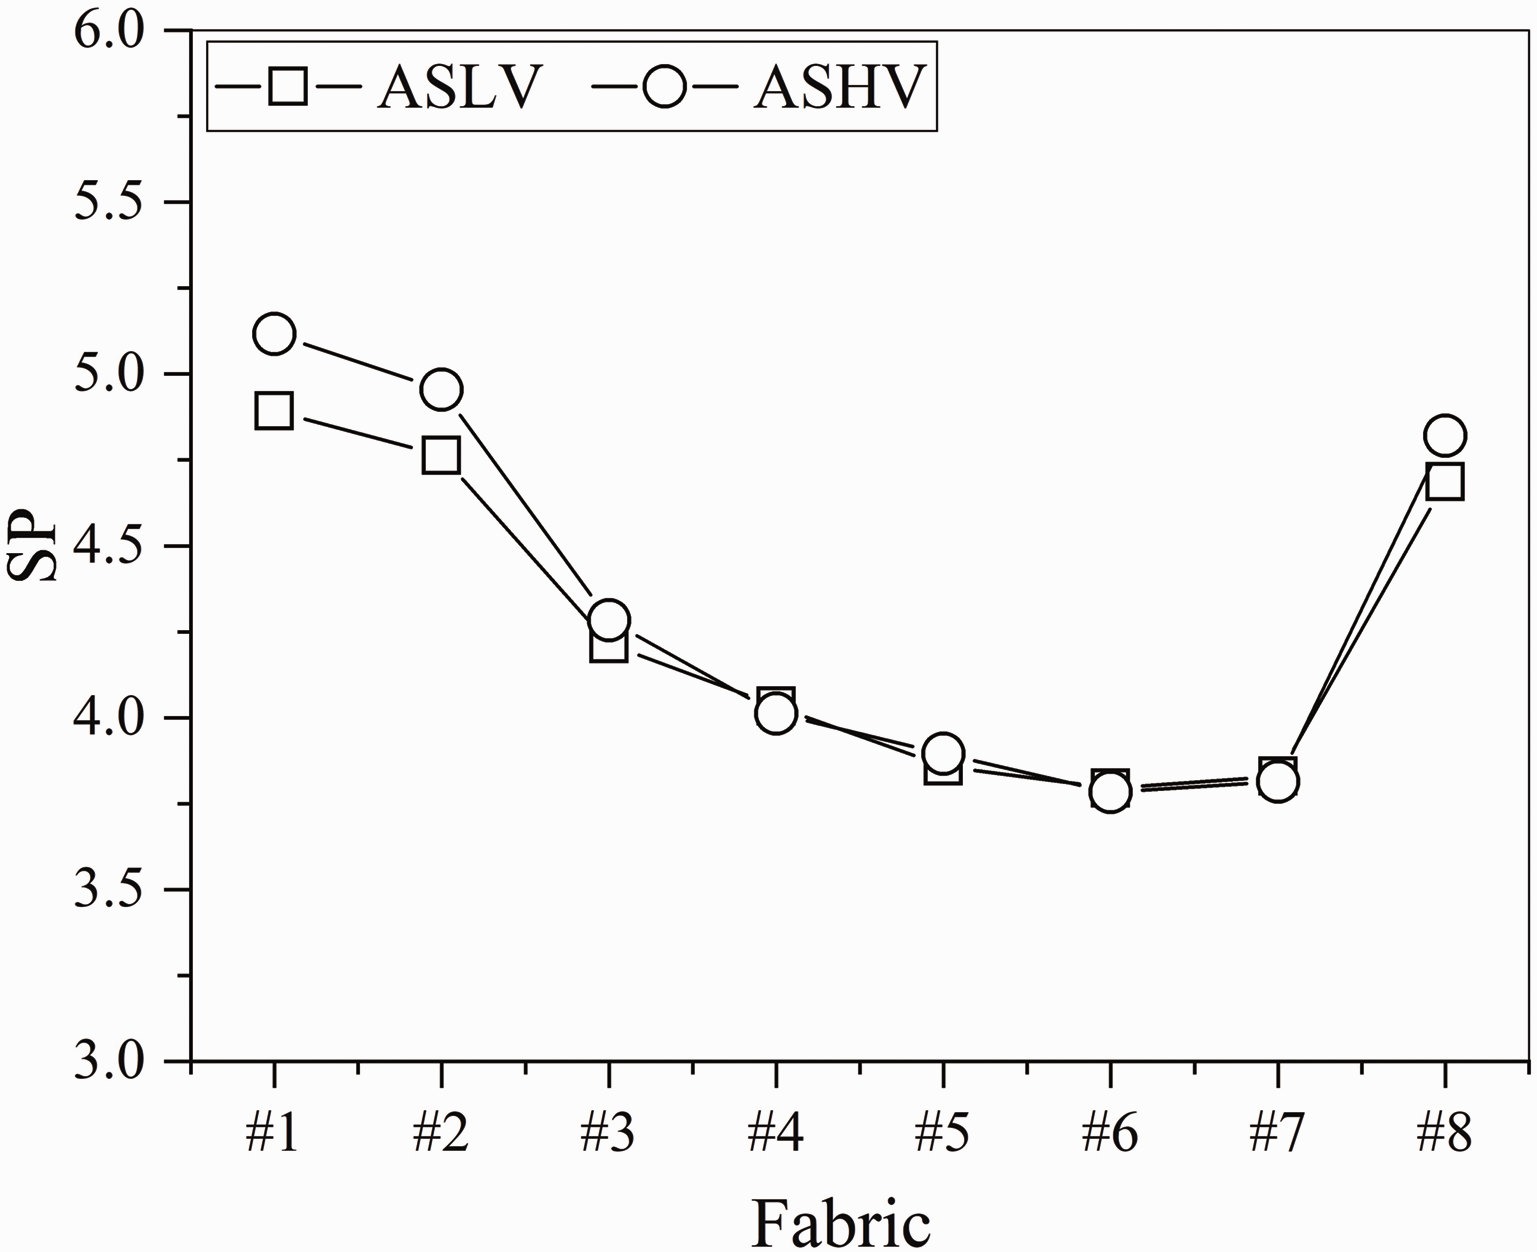
Comparison of SPs between the two separating velocities. Note: SP denotes the stickiness perception rating score. ASLV and ASHV denote the adhesion-separation condition with low velocity and high velocity, respectively.
Friction Versus Adhesion-Separation
Figure 14 shows the changes of the stickiness perception under the two contact modes. The result shows that the SPs of fabrics under the friction mode are higher than those under the adhesion-separation mode except for Fabric 1. This finding might be explained in two ways. On one hand, the friction force between the skin and wet fabric with no cover weight was commonly larger than the adhesion force. The adhesion force between the skin and completely soaked samples (120 mm × 120 mm) ranged from 0.06 N to 0.2 N (Lou et al., 2015, 2017, 2018), while the friction force between the skin and wet samples (120 mm × 60 mm) with no cover weight ranged from 0.5 N to 2 N (Tang, Chau, Kan, & Fan, 2018a). This indicates that the friction mode causes a greater skin deformation due to the larger force. On the other hand, the SA II and RA I might be more sensitive to the tangential force than the normal force, and thus it easily forms a stronger stickiness perception in the brain. As a result, it can be concluded that the friction between the fabric and skin is the main contact mode that evokes stickiness perception. For labor suits used in summer or sportswear, an effective way to relieve wear discomfort due to stickiness perception is by increasing the ease of the clothes in the joints, such as elbows and knees, to reduce the dynamic friction between the clothing and the body.

Range of the SPs of fabrics under the two contact modes. Note: SP denotes the stickiness perception rating score.
Moreover, the influencing mechanisms of two contact modes are different. For the friction mode, the stickiness perception mainly depends on the water absorption capacity of the fabric and the contact pressure between the fabric and skin, but the surface roughness has little influence. Therefore, in addition to increasing the water absorption capacity of fabric, reducing the clothing pressure is also an effective measure by which to relieve stickiness perception. For the adhesion-separating mode, the stickiness perception mainly depends on the water absorption capacity of the fabric and the surface roughness of the fabric. Compared to the friction mode, the influence of surface roughness on the stickiness perception under the adhesion-separation mode is more important. Therefore, it is beneficial to reduce the stickiness perception by increasing the surface roughness of the fabric in high-contact areas between the clothing and body, such as the chest or back.
Conclusions
In this study, the subjects were asked to perceive and evaluate 64 types of contact stimuli by the magnitude estimation method combined with a set of dynamic contact devices, including 48 types of friction (8 Fabrics × 3 Contact Pressures × 2 Sliding Velocities) and 16 types of adhesion-separation (8 Fabrics × 2 Separating Velocities). This research evaluated the effect of fabric properties (water absorption capacity and surface roughness) and contact features (contact pressure and sliding velocity) on stickiness perception under the friction mode, the effects of fabric properties (water absorption capacity, surface roughness and surface wettability) and separating velocities on stickiness perception under the adhesion-separation mode and the differences in stickiness perception between the two contact modes. The key findings were as follows:
Under the friction mode, the water absorption capacity has a significant and negative correlation with the stickiness perception, but does not have a correlation with the surface roughness. An interaction between the contact pressure and sliding velocity was observed. The contact pressure has a significant and positive correlation with the stickiness perception, while the sliding velocity has a significant effect on stickiness perception at a medium or high contact pressure. Under the adhesion-separation mode, stickiness perception has a significant and negative correlation with water absorption capacity, but does not have a correlation with the surface wettability or surface roughness. Moreover, the separating velocity has no significant influence on stickiness perception. The stickiness perception under the friction mode is higher than that under the adhesion-separation mode in most cases. Therefore, the friction mode is considered the main contact mode that evokes the stickiness perception by the human body.
In this study, only women were selected as subjects, so possible differences between genders were not discussed. Furthermore, as the experiment only considered one kind of water addition to fabric to simulate moderate sweating, in the future, it is necessary to design a variety of water additions to analyze the influence of moisture on the stickiness perception under friction and adhesion-separation modes to better understand the formation mechanism of stickiness perception.
Footnotes
Acknowledgements
The authors thank the members of the Key Laboratory of Clothing Design & Technology, Donghua University, and all volunteers who participated in the subjective assessments for their support.
Declaration of Conflicting Interests
The author(s) declared no potential conflicts of interest with respect to the research, authorship, and/or publication of this article.
Funding
The author(s) received no financial support for the research, authorship, and/or publication of this article.
