



Abstract
Decades of research in cognitive psychology have largely relied on simple key or button presses to quantify human behavior. While many valuable discoveries have been made, a richer response modality may reveal more information regarding the different processes that underlie complex human behavior. This study provides a proof of concept for using a touch-and-swipe response method to separate response time into two components to extract more meaningful behavioral insights. Across several analyses, the two components were consistently shown to be separable, independent measurements of behavior. Furthermore, evaluating these isolated response time components improved inferential power and clarity of behavioral patterns. The touch-and-swipe response method is simple and easy-to-use, and it shows promise for more accurately targeting mechanisms of interest.
Introduction
Throughout the history of cognitive psychology, millions of individuals have contributed to research efforts through one simple act: pressing a button. Since the introduction of the personal computer as a tool for data collection, innumerable cognitive psychology studies have assessed psychological processes by determining how long it takes participants to press a key in response to some stimulus (and of course plenty of relevant work came from before the advent of the personal computer, including research efforts from Wundt, Tichner, Donders, and many others). The keypress has been a highly successful tool, allowing researchers to glean meaningful insights from a simple, singular response time measurement. However, much more information can be obtained about underlying behavioral processes than what the simple keypress reveals.
Response time measures are intended to index the speed of mental processes (i.e., mental chronometry; Shepard & Metzler, 1971). However, as previous researchers have noted, typical response time measurements only provide insight to a single point in the processing stream, despite multiple underlying operations taking place (e.g., Balota & Abrams, 1995). While there have been attempts over the years to use behavioral methods to obtain more fidelity into the underlying processes than what is available from a single keypress, these efforts have largely failed to gain widespread traction. For example, various mathematical models have provided explanations of the underlying processes captured by response time measurements, including motor and decision components (e.g., Hohle, 1965; Ratcliff & Rouder, 1998; Rieger & Miller, 2020; Schwarz, 2001). However, few researchers regularly leverage such models when analyzing collected data. Similarly, it has been shown that having participants respond by moving a computer mouse, rather than pressing a key, can provide richer insights into cognitive processes (e.g., Spivey et al., 2005). A series of studies (e.g., Dale et al., 2007; McKinstry et al., 2008) reported that assessing subtle changes in the mouse movement trajectory is more fidelitous than a keypress response; nevertheless, the vast majority of cognitive studies still have participants press a key.
The question then becomes, why do most psychological researchers (the authors included) stick with response measures that might not be the most informative? One possibility is that the research community is generally not aware of the alternatives. Another possibility is that researchers may be aware of the alternatives, but feel the added fidelity is not sufficiently useful to warrant the added complexity. Perhaps many underestimate the potential benefits of the alternative methods.
Regardless of the reason(s) for sticking with a keypress response, researchers are likely missing out on crucial mechanistic insights by working with a blunt response measure when more fine-grained alternatives are available. With advances in technology—specifically the introduction of trackpads and touch screens—there is an opportunity for a renewed attempt to gain meaningful information about dynamic behavior that is simple and user-friendly. The goal of this project was to show that even a simple breakdown of a singular response time into two components is sufficient to reveal meaningful and significant insights to behavior, without adding deterring complexities.
This study provides a proof of concept for a touch-and-swipe response method that simply decomposes a single response into two components. Instead of having only one measurement of response time to hit a button or key, the touch-and-swipe method yields a first response time to touch the screen, and then a second response time to swipe to indicate the response choice. Across several analyses, the two response times are shown to approximate different processes; they do not correlate with each other and have differential explanatory power when compared with standard measures. Importantly, by separating response time into these two differentially predictive components, it may be possible to more effectively focus response measures on specific mechanisms of interest. While there are some indications that link each of these components to a specific behavioral mechanism (e.g., time to touch = motor initiation and time to swipe = decision processes), it is premature at this point to assert one-to-one links; rather, the goal here is to demonstrate that by simply dividing response time into two components it is possible to gain added insights and even improve the clarity of measurement in psychological studies.
Methods
Source of Data/Participants
Data were collected anonymously from users playing the mobile application, Airport Scanner (Kedlin Co., www.airportscannergame.com/airportscanner), as outlined in the game’s Terms and Conditions and approved by the George Washington University Institutional Review Board. Data from this application have been previously used for academic purposes (e.g., Mitroff et al., 2015). In the game, Airport Scanner, players act as an airport security screener, performing a visual search task and an object-sorting task. The object-sorting task instantiated a touch-and-swipe response method and is the focus of the current project. The term “player” refers to each unique device ID as assigned when the application was downloaded. The anonymous nature of the data did not allow for confirmation that exactly one person contributed to exactly one device ID, but analysis of self-reported playing behavior from a subset of Airport Scanner players (25,500) suggested that less than 7% have had more than one individual play on the same device.
Airport Scanner Object-Sorting Task
Data were assessed for the object-sorting task between 2016 and 2018, wherein 54,138 players attempted at least one session of the object-sorting task (range: 1–308 sessions, mean: 3.87, standard deviation: 7.67). In the task, players had 20 seconds to sort up to 22 items as prohibited or allowed through airport security. Both speed and accuracy were reinforced through awarded points (100 points for each correctly classified item in 20 seconds). All 22 items were drawn (with replacement) from a set of prohibited and allowed items that had been introduced prior to the task through related visual search gameplay (and were also reviewable in a logbook). In the level analyzed, this set of possible items consisted of 22 prohibited items and 105 allowed items. Each item appeared in the center of the screen, and players were to touch and swipe the item to the top of the screen to identify it as prohibited or to the bottom of the screen to identify it as allowed, before proceeding to the next item. Visual feedback was provided at every trial, as was auditory feedback if the volume on the players’ device was turned on. No information was provided to the players about the possible proportions of prohibited and allowed items, but 0% to 100% of trials could have contained a prohibited item.
Touch-and-Swipe Response
Notably, the task involved a touch-and-swipe response method (Figure 1). Timestamps were recorded when an item first appeared in the center of the screen, when players first touched the screen, when players released the screen after swiping an item toward the top or bottom of the screen, and when an item eventually reached the end zone (a calculation of velocity of swipe and distance from end zone when released). The two response times of interest for the current purposes were (a) the time from when the item visually appeared in the middle of the screen until the player first touched the screen (i.e., time to touch) and (b) the time from when the player first touched the screen until the player released the screen after swiping up or down to identify it as prohibited or allowed (i.e., time to swipe).

Depiction of the touch-and-swipe response method. The time from appearance of the item to the first contact with the screen is recorded as time to touch, and the time from first contact with screen to the release after swiping up or down is recorded as time to swipe.Note. Images reproduced with permission from Kedlin Co.
Data Analysis and Results
Part 1: Establishing Separable Response Time Components; Time to Touch ≠ Time to Swipe
Planned Analyses
Average time to touch, time to swipe, and total time (sum of time to touch, and time to swipe) were calculated by participant for the 38,189 players who completed a minimum of six trials in their first session (a minimum accuracy of 60% was required for inclusion in analyses). Data were limited to the prohibited trials (i.e., when a prohibited item was presented) to avoid differences in response time between prohibited and allowed items (prohibited trials were selected based on their alignment with the overall game task of finding threatening items; however, performance on allowed trials showed the same general patterns). First, a correlation between a player’s time to touch and time to swipe was conducted to determine whether the two components were related. Second, a series of paired t tests were conducted to explore the relationship of each of the response time components with accuracy and test the hypothesis that time to swipe would be more strongly reflective of decision time while time to touch would not be. Specifically, a reflection of decision time was operationally defined as the response time component having sensitivity to accuracy, such that there was a difference in response time for correct and incorrect trials (with the expectation that incorrect trials would have slower response times). Only players who had accuracy below 100% (yielding both correct and incorrect trials) were included (n = 15,652).
Finally, after the initial effect was established, bootstrapping with smaller sample sizes was conducted to exemplify that the same sensitivity to accuracy can be expected in more typically attainable sample sizes. Given the low number of trials, the number of participants had to be kept high to maintain stability (which is akin to the growing popularity of Amazon Mechanical Turk where a large number of workers complete a small number of trials; e.g., Paolacci et al., 2010). As such, the bootstrapping consisted of 10,000 replications of 400 randomly selected players (with replacement). The percentage of replications in which there was a significant difference between correct and incorrect trials was reported for each of the response times.
Results
The distributions of total time, time to touch, and time to swipe are displayed in Figure 2A. The distribution of total time (time to touch + time to swipe) was slightly positively skewed (1.04). The distribution of time to touch was less skewed (0.91), while the distribution of time to swipe was most positively skewed (1.78). The positive skews were consistent with various mathematical models of response time (e.g., Ex-Wald, Ex-Gaussian), describing a more normally distributed motor response time and more positively skewed decision time (e.g., Hohle, 1965; Schwarz, 2001).
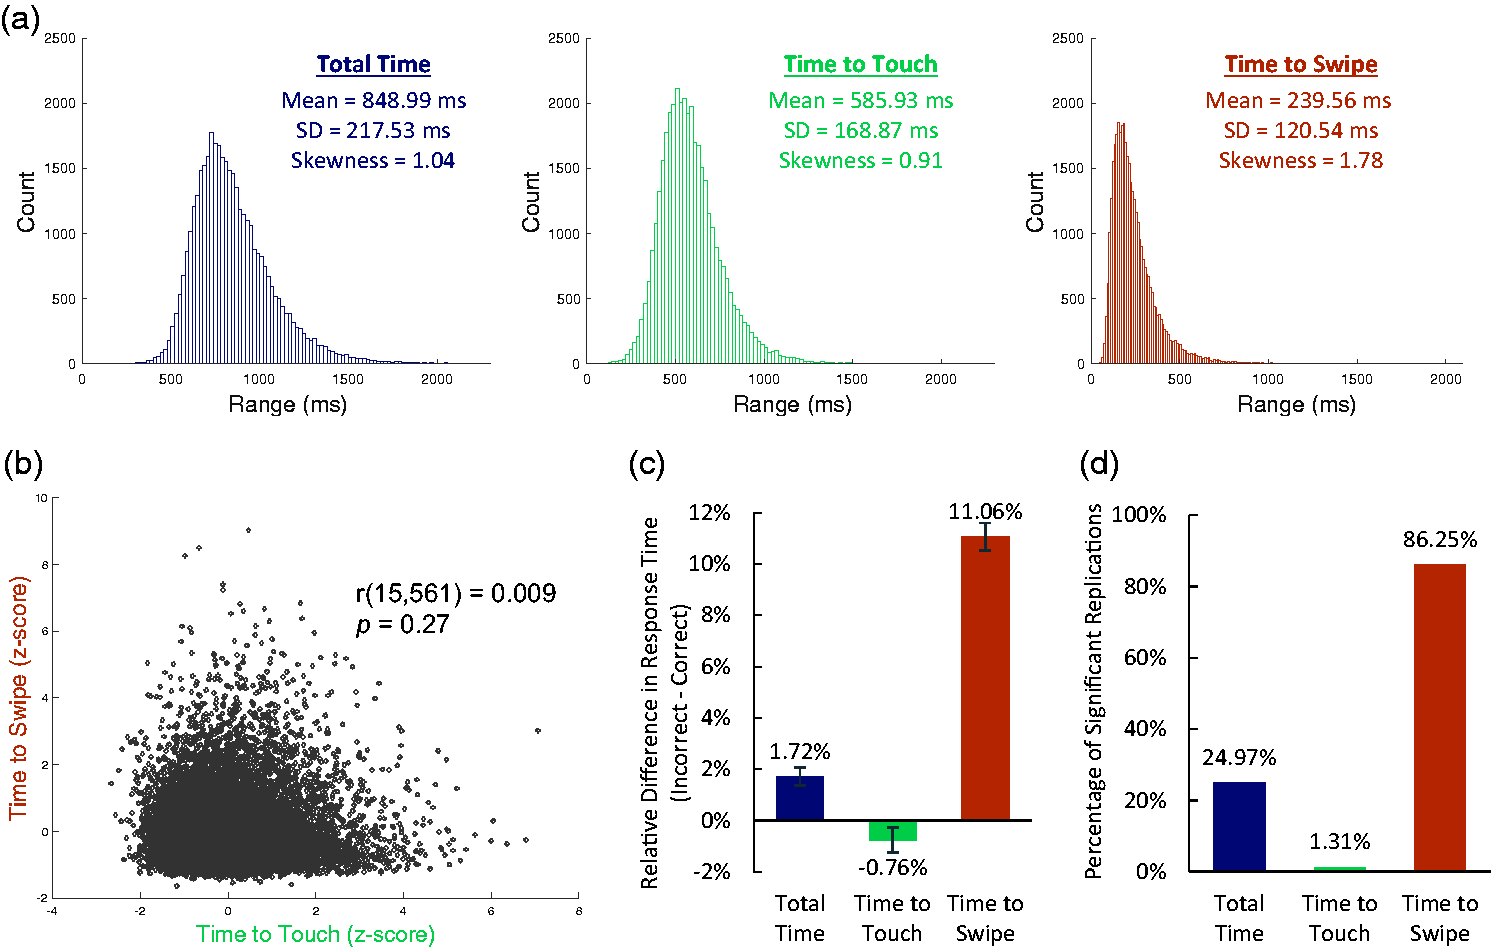
A: Distributions of response time measures: total time, time to touch, and time to swipe (from left to right). B: Time to swipe and time to touch in correct trials are not correlated. C: The relative difference in response time between correct and incorrect trials becomes greater when only considering time to swipe. Error bars indicate within subjects standard error, and all values are significantly different from 0. D: Percentage of bootstrapping simulations for each response time measure that yielded a significant difference between correct and incorrect responses in the expected direction (incorrect slower than correct).Note. Please refer to the online version of the article to view the figure in colour.
The correlation analysis between time to touch and time to swipe in correct trials revealed that the two components were not correlated with each other, r(15,561) = .009, p = .27 (Figure 2B). Furthermore, there was only a very weak correlation in incorrect trials, r(15,561) = .068, p = 12.35 × 10⁻¹⁷. Any correlation coefficient under.1 is considered to be a low effect size, and each of these correlations were well below that value (despite the relationship in incorrect trials still yielding statistical significance due to the high number of degrees of freedom).
Next, the relationship of each response time measure with accuracy was explored. As expected, total time was significantly slower in incorrect trials than correct trials, mean: 17.80 milliseconds, t(15,561) = 6.33, p = 2.58 × 10⁻¹⁰, Cohen’s d = .05. Time to swipe was also significantly slower in incorrect trials than correct trials, mean: 27.24 milliseconds, t(15,561) = 16.35, p = 1.23 × 10−59, Cohen’s d = .13. However, time to touch was actually slightly faster in incorrect trials than correct trials, mean: −5.73 milliseconds, t(15,561) = 2.72, p = .006, Cohen’s d = .02. Figure 2C depicts the relative difference between incorrect and correct trials for each measure, showing the time to swipe had the greatest relative difference in the predicted direction; the time to swipe measure revealed a significantly greater difference than total time, t(15,561)=12.56, p = 5.48 × 10−36, Cohen’s d = .14, and time to touch, t(15,561)=4.39, p = 1.15 × 10⁻⁵, Cohen’s d = .03.
The bootstrapping simulation of smaller samples further reinforced this finding (Figure 2D). Of the 10,000 replications, 24.97% of them yielded a significant difference (p < .05) in total time between incorrect and correct trials. However, when response time was evaluated as individual components, this rose to 86.25% of replications for time to swipe. Also consistent with expectations, only 1.31% of replications for time to touch yielded a significant difference in the expected direction. In contrast, 12.35% of replications for time to touch yielded a significant difference in the opposite-going direction (incorrect faster than correct), whereas this almost never happened for time to swipe (0.01%) nor total time (0.45%).
From these findings, it could be inferred that time to touch and time to swipe were separate components likely to measure different underlying cognitive processes, namely, time to swipe, which was closely related to accuracy, potentially reflecting the speed of decision processes, while time to touch, which had a very minimal (and slightly opposite-going) relationship with accuracy, potentially approximating the speed of motor initiation processes.
Part 2: Example of Higher Fidelity: Characterizing the Impact of Trial History
Planned Analyses
The next set of analyses provided an example of how the decomposition of response time could be used to gain more fidelity in behavioral measures. Specifically, the hypothesis was that when the primary interest of a particular study is to assess cognitive, and not necessarily motor, performance then focusing analyses on the time to swipe component can provide a purer measure of the behavioral effect of interest.
In a previous study (Kramer et al., 2020; osf.io/pj64e), performance on each trial of the object-sorting task was shown to be strongly and linearly related to the statistical evidence aggregated across prior trials (i.e., a combined measure of the proportion and number of prior trials matching the current trial condition), such that players were more accurate and faster when there was strong prior evidence in favor of the current condition. When assessing the impact of prior trial evidence on current trial performance, response time could be measured as total time, or broken down into time to touch and time to swipe. The current analysis considered the benefit of evaluating the impact of trial history on time to touch and time to swipe independently, instead of only considering total time.
Players who completed at least 10 trials in their first object-sorting task session (n = 50,819) were included (no minimum accuracy threshold). Performance was evaluated across the first 10 trials of the first session as a function of the players’ prior exposure to prohibited trials, and whether the current trial was prohibited or allowed (see Kramer et al., 2020, for more details). Prior exposure to prohibited trials was calculated as a z score, incorporating the proportion of prior trials that contained a prohibited item (compared with the predicted value of 50%) and the number of prior trials. Z score was calculated as
Results
Response time was evaluated on trials containing a prohibited item, as a function of a player’s prior exposure to prohibited trials (response time for trials containing an allowed item also showed the same patterns). Consistent with the linear relationship found between current accuracy and prior aggregated evidence in favor of the current trial condition (Kramer et al., 2020), there was a significant linear relationship between the z score for prior exposure to prohibited items and subsequent total time to correctly identify an item. The greater the evidence in favor of prohibited items, the faster players were to correctly identify a subsequent prohibited item (R2 = .603, p = 2.70 × 10⁻⁸). While the linear relationship was significant, visual examination of the plot (Figure 3) indicates that the relationship was actually curvilinear in nature (fit for quadratic regression: R2 = .852, p = 2.97 × 10⁻¹¹, which was significantly better than the linear fit, z = 2.33, p = .020).

While there is a significant linear relationship between prior exposure to prohibited items and total time to identify subsequent prohibited items, the quadratic fit was significantly stronger.
Further examination of each response time component (time to touch and time to swipe) revealed that there were two patterns with prior trial history that were underlying performance: a quadratic relationship in one component (time to touch) and linear relationship in the other component (time to swipe).
The relationship between prior exposure to prohibited items and time to touch is shown in Figure 4. The pattern was consistent with a parabolic relationship, wherein time to touch was speeded with repetition of any condition (prohibited or allowed). A quadratic equation was the best fit for the data for both correct (R2 = .783, p = 4.19 × 10⁻¹⁰) and incorrect responses (R2 = .670, p = 1.33 × 10⁻¹⁰). For correct trials, the quadratic fit was significantly better (z = 3.35, p = .0009) than a linear fit (R2=0.274, p = .001), while for incorrect trials, it was numerically better (z = 1.02, p = .15) than a linear fit (R2 = .511, p = 1.43 × 10⁻⁶). That is, the speed of time to touch was highly influenced by the repetition of information, regardless of content of the information (and whether or not it matched the current condition).

The relationship between prior events and time to touch is u-shaped (left panels) such that it is speeded with strong repetition of any condition (prohibited or allowed) for both correct (top) and incorrect (bottom) trials. The relationship between prior events and time to swipe (right panels) is linear, such that performance is biased toward the trial condition that was reinforced.Note. Please refer to the online version of the article to view the figure in colour.
The relationship between prior exposure to prohibited items and time to swipe is also shown in Figure 4. In this case, the pattern was consistent with a linear relationship. The stronger the prior exposure to prohibited items, the faster the time to swipe when correctly identifying subsequent prohibited items (R2 = .927, p = 6.85 × 10⁻²¹). The same linear relationship was found between prior exposure and time to swipe on incorrect trials, but in the opposite direction. When an item was incorrectly identified, players took longer to swipe to indicate their response when prior exposure was more consistent with the current item type (R2 = .408, p = 3.65 × 10⁻⁵).
Importantly, although the initial linear regression between prior exposure to prohibited items and subsequent total time was statistically significant, the linear fit was significantly improved when performance was isolated to just the time to swipe component (z = 3.84, p = .0001).
Discussion
This study provided a proof of concept for a novel touch-and-swipe response method to gain insights into the multiple processes underlying behavior. First, the touch-and-swipe response method was shown to yield two largely independent response time components, time to touch and time to swipe, that were not strongly correlated. Next, it was shown that the components differed in sensitivity with accuracy, suggesting that they captured different underlying processes; whereas time to swipe revealed the expected pattern of faster responses times on correct than incorrect trials, time to touch, revealed slightly faster performance on incorrect trials. The lack of sensitivity to accuracy suggests the time to touch component likely reflected the speed of motor initiation processes instead of more cognitively meaningful decision processes (with the slight speeding of time to touch in incorrect trials consistent with patterns of motor impulsivity). In contrast, time to swipe was highly sensitive to accuracy, suggesting it likely reflected the speed of decision processes.
These assignments to motor speed and decision speed are only approximations, as the current analyses did not permit definitive conclusions regarding the specific underlying processes. However, the two response time components were determined to be separable and differentially predictive of behavior, indicating the importance of considering the components individually. Furthermore, sensitivity of response time to accuracy was enhanced (relative to total time) when the speed of motor initiation processes could be removed and just the time to swipe could be evaluated in isolation.
The second set of analyses provided a specific example of how separating response time into these two components could yield a clearer picture of a behavioral phenomenon of interest. The analyses explored the relationship between prior trial history and subsequent response time, based on a prior finding (Kramer et al., 2020) that current performance strongly and linearly relates to information aggregated across prior trials in favor of the current trial condition. Total time did have a significant linear relationship with evidence aggregated across prior trials. However, visual inspection revealed that the pattern was noticeably curvilinear. Further exploration of response time components revealed that the underlying component of time to touch was quadratically related to prior evidence. Moreover, when time to touch was removed and only time to swipe was analyzed, there was a stronger linear relationship between current performance and trial history.
An open question is exactly what variability is being accounted for in the time to touch component. One possibility is that time to touch reflects a measure of motor impulsivity, as suggested by the slight speeding of time to touch in incorrect trials relative to correct trials. Another possibility is that this component reflects a measure of general cognitive speed. There is a practice in some aging studies (e.g., Costello et al., 2010; Woods et al., 2015) to administer a simple response time task in addition to the primary task of interest, and then use each individual’s response time as a covariate to account for effects of cognitive slowing when comparing older and younger populations. The touch-and-swipe response method may present a similar opportunity, without requiring the use of an additional task.
Overall, this study provides a proof of concept for the touch-and-swipe response method. By separating response time into two components, there were improvements in targeting the complexities underlying behavior, allowing more accurate measurement of the processes that researchers were interested in. The task evaluated here implemented the touch-and-swipe response on a touchscreen, but this method could be instantiated using a computer trackpad (internal or externally connected) that is configured to collect the necessary information.
One limitation of this study is that analyses only include data from a single mobile game. This limitation is largely due to practical reasons, as the touch-and-swipe was already instantiated in the task. The next logical step is to instantiate the touch-and-swipe response method in a laboratory setting to conduct a direct comparison of inferential power between the touch-and-swipe and standard keypress response methods. This in-laboratory setup is already in progress, but data collection was indefinitely put on hold due to COVID-19. A direct comparison on in-laboratory data will be done to bolster the current proof of concept when laboratory testing can resume. Furthermore, developing an in-laboratory version provides the opportunity to explore other, potentially rich, measures of behavior beyond those already discussed. For example, the trajectory of the swipe could be used to generate measures of velocity, which have been shown to relate to high levels of conflict (Wojnowicz et al., 2009).
The current results serve to remind researchers of the importance of considering the multiple underlying processes of behavior and convey the great promise of a touch-and-swipe response method to better target the behavioral processes of interest, with limited added complexity.
Footnotes
Acknowledgements
The authors thank Samoni Nag, Laura Schubel, Courtney Porfido, and the GW Visual Cognition Laboratory for helpful conversations and feedback.
Declaration of Conflicting Interests
The author(s) declared no potential conflicts of interest with respect to the research, authorship, and/or publication of this article.
Funding
The author(s) disclosed receipt of the following financial support for the research, authorship, and/or publication of this article: This work was supported by U.S. Army STIR Award #W911NF-20–1-0325 (P. H. C.), U.S. Army Research Office Award #W911NF-16–1-0274 (S. R. M.) and U.S. Army Research Laboratory Cooperative Agreement #W911NF-19–2-0260 (S. R. M., D. J. K., and A. B. Y,).
