



Abstract
Sound-induced flash illusion (SiFI) refers to the illusion that the number of visual flashes is equal to the number of auditory sounds when the visual flashes are accompanied by an unequal number of auditory sounds presented within 100 ms. The effect of repetition suppression (RS), an adaptive effect caused by stimulus repetition, upon the SiFI has not been investigated. Based on the classic SiFI paradigm, the present study investigated whether RS would affect the SiFI differently by adding preceding stimuli in visual and auditory modalities prior to the appearance of audiovisual stimuli. The results showed the auditory RS effect on the SiFI varied with the number of preceding auditory stimuli. The hit rate was higher with two preceding auditory stimuli than one preceding auditory stimulus in fission illusion, but it did not affect the size of the fusion illusion. However, the visual RS had no effect on the size of the fission and fusion illusions. The present study suggested that RS could affect the SiFI, indicating that the RS effect in different modalities would differentially affect the magnitude of the SiFI. In the process of multisensory integration, the visual and auditory modalities had asymmetrical RS effects.
Keywords
When we listen to an expert’s report in a lecture hall, we tend to believe that the sound comes from the expert’s mouth even though we know that it comes from the speakers. This phenomenon indicates that when we receive information, we process the information from some modalities preferentially according to the situation. In similar situations in our lives, our perception of something in the natural environment is usually multisensory. Multisensory information will lead to a multimodal interaction, and this multimodal interaction can be shown as information integration but also as information competition among modalities (Chen & Zhou, 2013; Driver & Noesselt, 2008; Koelewijn et al., 2010; Spence, 2011; Talsma et al., 2010). When humans process multisensory information, our brains don’t give all sensory information the same weight, some sensory information will be processed preferentially depending on paradigm, resulting in sensory dominance effect (Hirst et al., 2018; Welch & Warren, 1980; Zhou et al., 2010).
The sound-induced flash illusion (SiFI) is an auditory-dominant, multisensory integration phenomenon (Shams et al., 2000, 2002). When visual flashes are accompanied by an unequal number of auditory sounds presented sequentially or simultaneously within 100 ms, individuals perceive that the number of visual flashes is equal to the number of auditory sounds, which results in the fission illusion (one flash, accompanied by two beeps, is mistakenly perceived as two flashes) and the fusion illusion (two flashes, accompanied by one beep, are mistakenly perceived as one flash; Andersen et al., 2004). This phenomenon indicates that auditory information can take precedence over visual information in processing time-related tasks. That is, auditory information can dominate visual information (Kaposvari et al., 2014). Since Shams et al. (2000) discovered the SiFI phenomenon, many researchers have explored factors that influence the SiFI (Kamke et al., 2012; Mishra et al., 2007, 2010; Wang et al., 2019). Moreover, Keil (2020) has summarized a large number of top-down and bottom-up factors shown to influence the illusion in the past 20 years. For example, increasing the complexity of visual stimuli (Takeshima & Gyoba, 2013) and reducing the volume of auditory stimuli (Andersen et al., 2004) all reduce the SiFI effect. Keil (2020) also summarized the neural mechanisms underlying the illusion. Hirst et al. (2020) also published a review covering 20 years of literature, and the review not only summarized the theoretical models that explained the SiFI but also summarized the findings of electroencephalography and functional magnetic resonance imaging. Furthermore, the authors also summarized the observed individual differences with the SiFI among different participants. McCormick and Mamassian found through signal detection analysis that SiFI is the product of changes in observer criteria and visual perceptual sensitivity. Therefore, observer criteria and perceptual sensitivity may be used as measures of the SiFI (Kumpik et al., 2014; McCormick & Mamassian, 2008). McGovern et al. (2014) found striking differences between the fission and fusion illusions in older adults, indicating that the sensitivity and response bias associated with the SiFI were different in aging populations. Sun et al. (2020) also found, by comparing differences in the SiFI effect between older and younger adults, that the reason for the increase in fission illusion sensitivity caused by age was the decreased perceptual sensitivity among older adults.
Repetition suppression (RS) is an adaptation effect caused by stimulus repetition that can change individuals’ perceptual sensitivity (Kohn, 2007; Sun et al., 2020). That is, when exactly the same stimulus is repeated, the stimulus presented later will be affected by the stimulus presented first, thus causing neural activation induced by it to decline. Such RS of neural activity was also known as the adaptation effect (Grill-Spector & Malach, 2001; Sobotka & Ringo, 1994). Studies have shown that the RS effect is a stable phenomenon that is ubiquitous in multiple modalities, ranging from milliseconds (Sobotka & Ringo, 1996) to minutes (Henson et al., 2000) and even days (Van Turennout et al., 2000). In addition, the duration of the RS effect is different in different brain regions (Barron et al., 2016). Relevant studies on RS have found that when the same stimuli are repeated, at the behavioral level, participants respond faster to the stimuli and make fewer errors (Henson, 2003; James et al., 2000). At the neural level, the amplitude of neural activity in the cerebral cortex induced by the stimuli decreased significantly after the stimuli were repeated (Grill-Spector et al., 1998; Malach et al., 1995). Previous studies have shown that repeated stimuli improve the visual system’s ability to process information, and the sensitivity of retinal or visual cortex neurons decreases after adaptation, suggesting that repeated stimuli can alter perceptual sensitivity (Kohn, 2007; Sun et al., 2020).
Studies on RS in different modalities have found that RS before the presentation of targets will affect the processing of targets in a single modality. When the same visual stimuli were repeated, the participants’ response time decreased, the error rate decreased, and the adaptive effect increased (Henson, 2003; James et al., 2000). The amplitude of neural activity in the visual cortex induced by the stimuli decreased significantly after repeated stimuli (Grill-Spector et al., 1998, 1999, 2006; Malach et al., 1995). However, Lanting et al. (2013) adopted a pure tone as the auditory stimulus and studied the influence of adaptive stimuli on human auditory-evoked potentials by manipulating the number of adaptive stimuli (Lanting et al., 2013). The results showed that the larger the number of adaptive stimuli presented simultaneously, the slower the adaptive effect was weakened. These results suggest that visual and auditory RS affect perceptual sensitivity. Sun et al. (2020) used repeated auditory stimuli to explore the SiFI and found that in young people, the hit rate with two preceding auditory stimuli was higher than that with one preceding auditory stimulus. This finding indicates that the RS effect also has an effect on information competition in audiovisual integration (Sun et al., 2020). However, it is still uncertain whether the RS effect in different modalities has different effects on audiovisual integration.
Therefore, RS can influence both single sensory processing and multisensory integration. In view of the different performance of RS in visual and auditory modalities, the present study manipulated the RS effect in different modalities based on the classical SiFI paradigm (Experiment 1) to investigate whether SiFI due to modality stimulation competition in audiovisual integration would be affected by RS from different modalities. Previous studies have shown that there are differences in the processing of visual and auditory stimuli (Chi et al., 2014; Wang et al., 2020). They found that identity-based repetition inhibition had a slower response time to auditory targets than visual targets and that the identity-based repetition inhibitions were larger in recognition of repeated auditory targets than visual targets (Wang et al., 2020). Moreover, larger cross-modal nonspatial repetition inhibition was caused by faster responses to auditory targets than to visual targets (Chi et al., 2014). Therefore, in the present study, we added repeated visual stimuli (Experiment 2) and repeated auditory stimuli (Experiment 3) prior to the presentation of audiovisual stimuli. In view of the fact that SiFI was a stable phenomenon, we selected different groups of participants to conduct experiments separately to eliminate the errors caused by fatigue of participants. We hypothesized that RS could affect the SiFI and that RS from different modalities would affect the magnitude of the SiFI differently. Auditory RS would be significantly greater than visual RS.
Experiment 1: The Classic SiFI Paradigm
Participants
In Experiment 1, 24 participants were recruited, but one was excluded due to long response time (see the Statistical Analysis section); the participants were 23 college students (8 males and 15 females) aged 18–26 years old; all participants had normal vision or corrected vision and had never participated in similar experiments before. All participants gave written informed consent following the standards of the Declaration of Helsinki. The study was approved by the ethics committee of the Department of Psychology at Soochow University.
To evaluate the statistical power of the present study, we used G*Power 3.1.9.2 to run a sensitivity analysis for a two-tailed paired sample t test (Faul et al., 2007, 2009). The input parameters were as follows: α err prob = 0.05, power (1–β err prob) = 0.80, and total sample size = 23. The output was Cohen’s d = 0.61, which indicated sufficient power to detect moderate-sized effects.
Stimuli and Apparatus
All stimuli appeared on the View Sonic P220f VS10284 display, the screen resolution was 1,024 × 768 pixels, and the refresh rate was 60 Hz. In this experiment, all visual stimuli presented on a black background were programmed by Presentation software (Neurobehavioral Systems Inc.), in which the visual flash stimulus was white disks (with a radius of 2°) presented at a visual angle of 5° below the central fixation point for a duration of 17 ms. The reason that the visual flash stimuli were presented 5° below the central fixation point was that visual flash stimuli have the greatest illusory effect when they are located in the peripheral field of vision accompanied by auditory and acoustic stimuli (Shams et al., 2002), as shown in Figure 1. The auditory beep stimuli in the experiment were presented to participants who were wearing an iron triangle headset (ATH-WS99). Auditory beep stimuli had a loudness of 75 dB, a frequency of 3.5 kHz, and a rendering time of 7 ms.
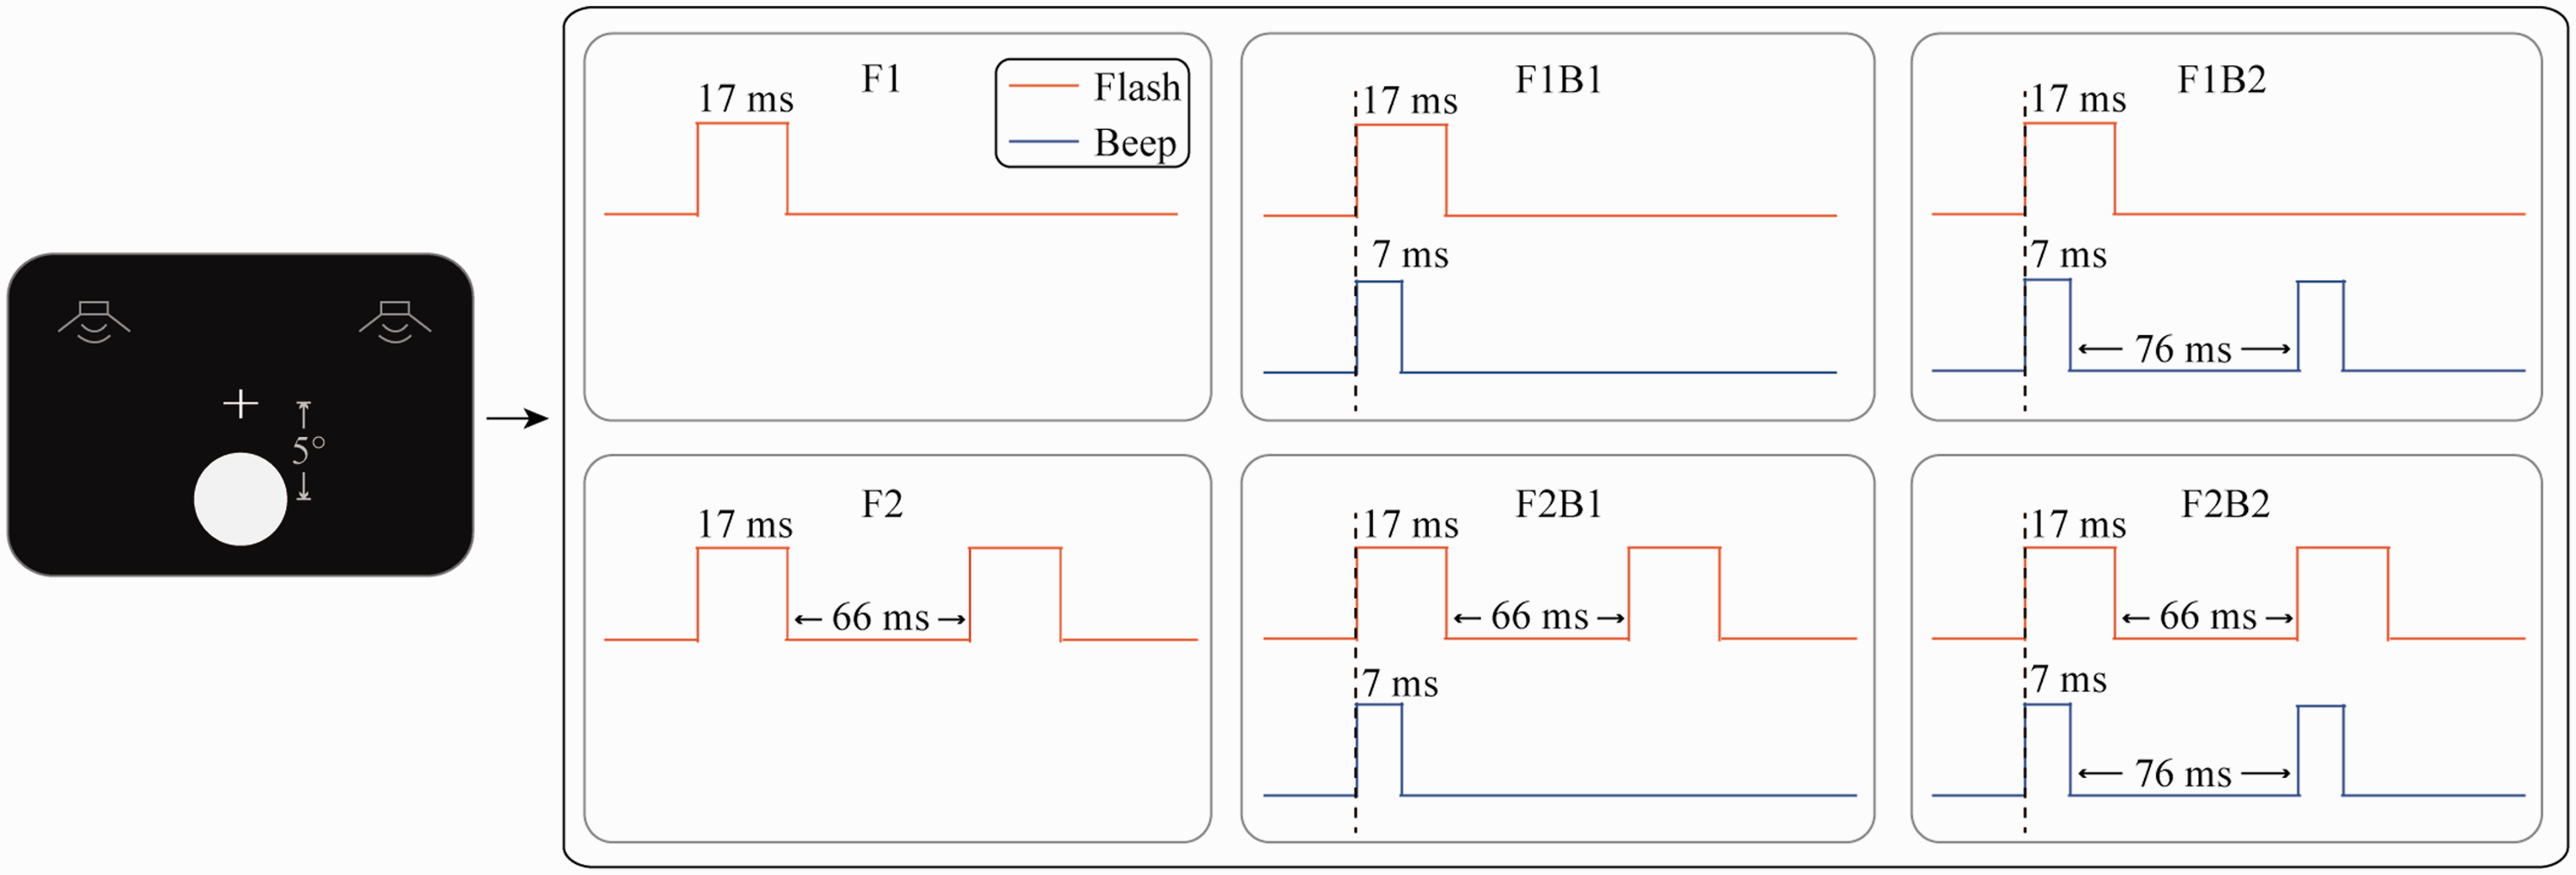
Experiment 1 stimuli schematic diagram. F1 refers to one flash and F2 refers to two flashes, F1B1 refers to one flash with one beep, F2B2 refers to two flashes with two beeps, F1B2 refers to one flash with two beeps, and F2B1 refers to two flashes with one beep.
Experimental Design and Procedure
All visual flash stimuli and auditory beep stimuli in the experiment were grouped into six experimental conditions: F1, F1B1, F1B2, F2, F2B1, and F2B2 (as shown in Figure 1). For the convenience of discussion, these trial-order types adopted the unified representation mentioned earlier. For example, F1B2 means a trial with one visual flash and two auditory beeps, whereas F2 means a trial with only two visual flashes and no auditory beep. The first auditory beep and the first visual flash were presented simultaneously. The time interval between the two visual flashes was 66 ms, whereas the time interval between the two auditory beeps was 76 ms. After the stimulus was presented, the participants responded within 1,500 ms. F1B2 and F2B1 were the conditions under which the flash illusion could occur in the six experimental conditions. That is, the participants could produce the illusion or not produce the illusion for the same physical stimuli. Participants were asked to keep their eyes on the central fixation point throughout the experiment to determine whether they perceived one or two visual flashes and did not have to respond to the auditory beeps. To control the balance of buttons between participants, half of the participants were randomly selected to press the left mouse button when perceiving one flash, the right mouse button when perceiving two flashes, and the remaining participants to press the opposite. Each participant was required to complete 600 trials with 100 trials for each experimental condition, and the time interval between the trials was randomized from 400 ms to 700 ms with a step size of 100 ms. The trials in each block were presented in a pseudorandom manner. If the accuracies in F1B1 and F2B2 were less than 65%, it was thought that the number of visual flashes could not be clearly identified, and the data from those participants were eliminated.
Statistical Analysis
The participants’ response time and the hit rate were recorded, but only the hit rate was statistically analyzed. Participants with response time of more than three standard deviations were excluded. Therefore, the hit rate was regarded as the dependent variable of experimental treatment. The hit rate referred to the fact that the participants can press the button correctly on the number of flashes. The opposite of hit was error rate, also known as SiFI illusion rate. Paired sample t test was carried out for F1B1 and F1B2 conditions to verify whether fission illusion was produced. Paired sample t test was carried out for F2B1 and F2B2 conditions to verify whether fusion illusion was produced. To further demonstrate the validity of the statistics, we report the effect size of the statistical analysis, Cohen’s d. In addition, we also conducted Bayesian tests (Wetzels & Wagenmakers, 2012) on JASP 0.13.0.1.
Results
In the no-auditory-beep conditions, the mean hit rate of the participants in the F1 condition was 90% (SD = 0.08), and the hit rate of the participants in the F2 condition was 89% (SD = 0.06), indicating that the participants had the ability to correctly judge visual flashes. To verify whether the participants perceived the fission illusion and fusion illusion, we conducted paired sample t tests on the relevant experimental conditions. The hit rate of F1B1 (M = 94%, SD = 0.08) was significantly higher than that of F1B2 (M = 34%, SD = 0.24), t(22) = 12.05, p < .001, Cohen’s d = 2.51, BF10 = 2.440e + 8, which showed the fission illusion; the hit rate of F2B2 (M = 92%, SD = 0.09) was significantly higher than that of F2B1 (M = 62%, SD = 0.21), t(22) = 7.73, p < .001, Cohen’s d = 1.61, BF10 = 143,661, which showed the fusion illusion. Thus, in the conditions in which visual flashes and auditory beeps did not match (F1B2 and F2B1 conditions), auditory-dominant effects appeared to influence the hit rate. That is, the number of auditory beeps affected the judgment of the number of visual flashes. In addition, the hit rates of F1B2 and F2B1 were also compared, t(22) = 4.00, p < .001, Cohen’s d = 0.83, BF10 = 54.80, which indicated that the fission illusion had a greater amplitude than the fusion illusion.
Experiment 2: Effect of Visual RS on the SiFI
Participants
Thirty-two individuals participated in this experiment. If the accuracies in F1B1 and F2B2 were less than 65%, it was thought that the number of visual flashes could not be clearly identified, and the data from those participants were eliminated. According to this standard, the data from 6 participants were excluded, resulting in data from 26 participants. Therefore, the participants were 26 college students (8 males and 18 females) aged 18–26 years old; all participants had normal vision or corrected vision and had never participated in similar experiments before. All participants gave written informed consent following the standards of the Declaration of Helsinki. The study was approved by the ethics committee of Department of Psychology at Soochow University.
To evaluate the statistical power of the present study, we used G*Power 3.1.9.2 to run a sensitivity analysis for a two-tailed paired sample t test (Faul et al., 2007, 2009). The input parameters were as follows: α err prob = 0.05, power (1–β err prob) = 0.80, and total sample size = 26. The output was Cohen’s d = 0.57, which indicated sufficient power to detect moderate-sized effects.
Stimuli and Apparatus
Experiment 2 was the same as in Experiment 1 with the following exception: All visual flashes and auditory beeps were grouped into four experimental conditions: F1B1, F1B2, F2B1, and F2B2.
Experimental Design and Procedure
The experimental design consisted of two parts: a 2 (number of preceding visual flashes: 1 vs. 2) × 2 (condition: F1B1 vs. F1B2) within-subjects design to explore the extent of the fission illusion and a 2 (number of preceding visual flashes: 1 vs. 2) × 2 (condition: F2B1 vs. F2B2) within-subjects design to explore the extent of the fusion illusion. Eight experimental conditions were created (V1_F1B1, V1_F1B2, V1_F2B1, V1_F2B2, V2_F1B1, V2_F1B2, V2_F2B1, and V2_F2B2). For example, for V1_F1B1, V1 means there was one preceding visual flash, and F1B1 refers to one visual flash accompanied by an auditory beep.
The experimental process is shown in Figure 2. In each trial in the experiment, the participants were presented with a single visual flash or a double-flash (preceding visual stimuli). Each visual flash presented 17 ms, and the time interval between two visual flashes in a double-flash was 66 ms. After a short interval of 500 ms, the same stimuli appeared again in the same way. After 500 ms, the visual flashes as the target stimuli appeared with the auditory beeps, similar to Experiment 1. The program after preceding stimuli is shown on the right of Figure 2. The conditions with an illusion included V1_F1B2, V1_F2B1, V2_F1B2, and V2_F2B1. Therefore, according to the responses of the participants, the aforementioned two conditions could be divided into V1_F1B2 (one preceding visual stimulus) versus V2_F1B2 (two preceding visual stimuli) and V1_F2B1 (one preceding visual stimulus) versus V2_F2B1 (two preceding visual stimuli). To control the balance of buttons between participants, half of the participants were randomly selected to press the left mouse button when perceiving one flash, the right mouse button when perceiving two flashes, and the remaining participants to press the opposite. Each participant was required to complete 800 trials (80 trials per block, a total of 10 blocks), of which 100 trials were performed under each experimental condition, and the time interval between the trials ranged from 400 ms to 700 ms randomly with a step size of 100 ms.
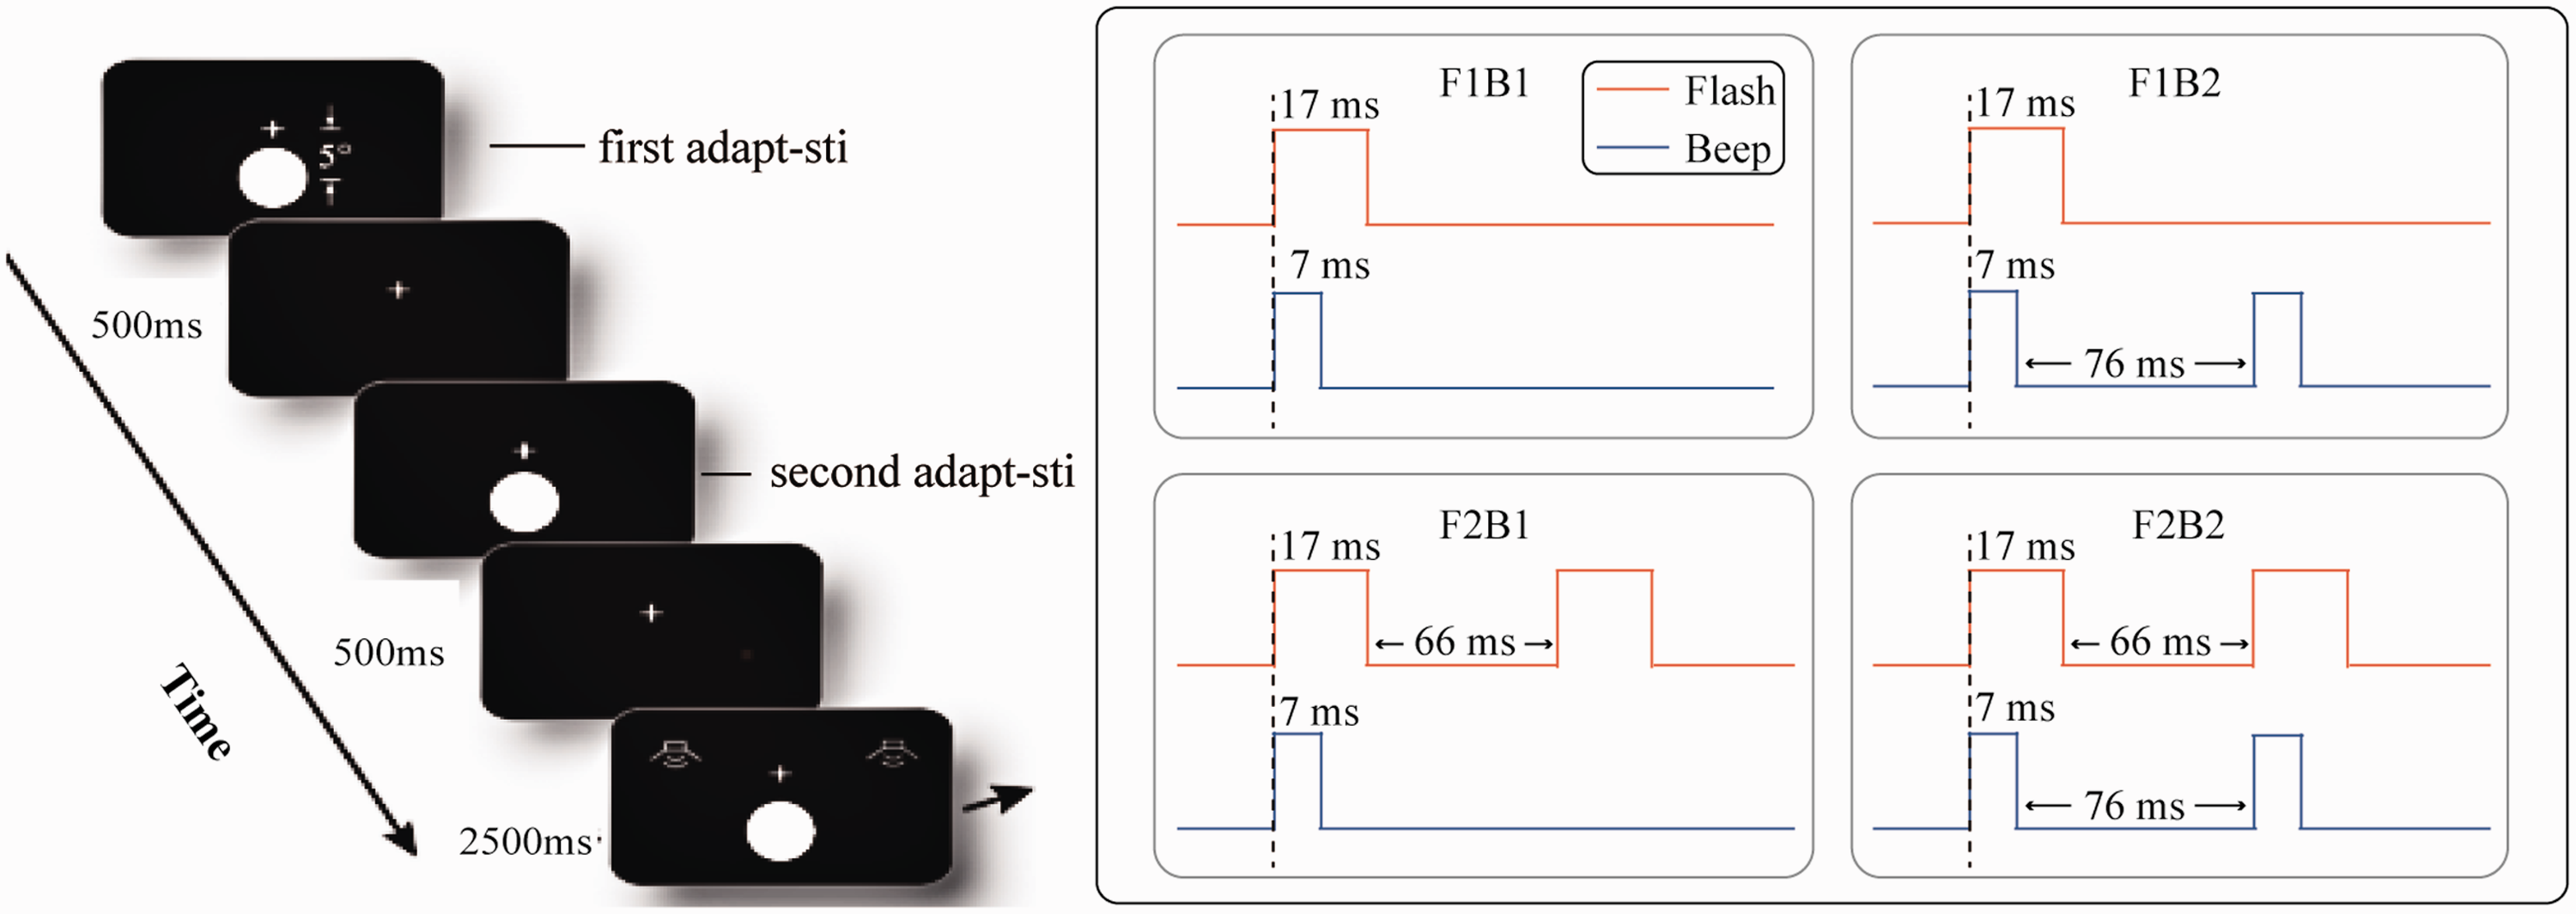
Procedure of events in a trial in Experiment 2. F1B1 refers to one flash with one beep, F2B2 refers to two flashes with two beeps, F1B2 refers to one flash with two beeps, and F2B1 refers to two flashes with one beep.
Statistical Analysis
To explore SiFI effects when there was a visual RS effect, for the fission illusion condition, we performed a 2 (number of preceding visual flashes: 1 vs. 2) × 2 (condition: F1B1 vs. F1B2) repeated measures analysis of variance (ANOVA); for the fusion illusion conditions, we performed a 2 (number of preceding visual flashes: 1 vs. 2) × 2 (condition: F2B1 vs. F2B2) repeated measures ANOVA. To further demonstrate the validity of the statistics, we report the effect size of the statistical analysis, namely, η2 for ANOVAs. In addition, we also conducted Bayesian tests on JASP 0.13.0.1.
Results
To determine whether the fission illusion still existed after the occurrence of preceding visual flashes, we performed a 2 (number of preceding visual flashes: 1 vs. 2) × 2 (condition: F1B1 vs. F1B2) repeated measures ANOVA in the fission illusion conditions. The results showed that the main effect of the number of preceding visual flashes was significant, F(1, 25) = 7.88, p = .01, η2 = 0.007, BF10 = 0.37, and the hit rate with one preceding visual flash (M = 75%, SD = 0.28) was significantly higher than that with two preceding visual flashes (M = 71%, SD = 0.32). However, the effect size was very small, and according to the results of Bayesian test, the degree of support for H1 was relatively conservative. Therefore, this main effect of the number of preceding visual flashes should be viewed with caution. The main effect of condition was significant, F(1, 25) = 59.84, p < .001, η2 = 0.67, BF10 = 2.145e + 14, and the hit rate with F1B1 (M = 94%, SD = 0.07) was significantly higher than that with F1B2 (M = 52%, SD = 0.29), which indicated a fission illusion. The interaction between the number of preceding visual flashes and condition was not significant, F(1, 25) = 1.30, p = .27, η2 = 7.184e–4, BF10 = 0.344. This indicated that the number of preceding visual flashes did not affect the size of the fission illusion (as shown in Figure 3A).
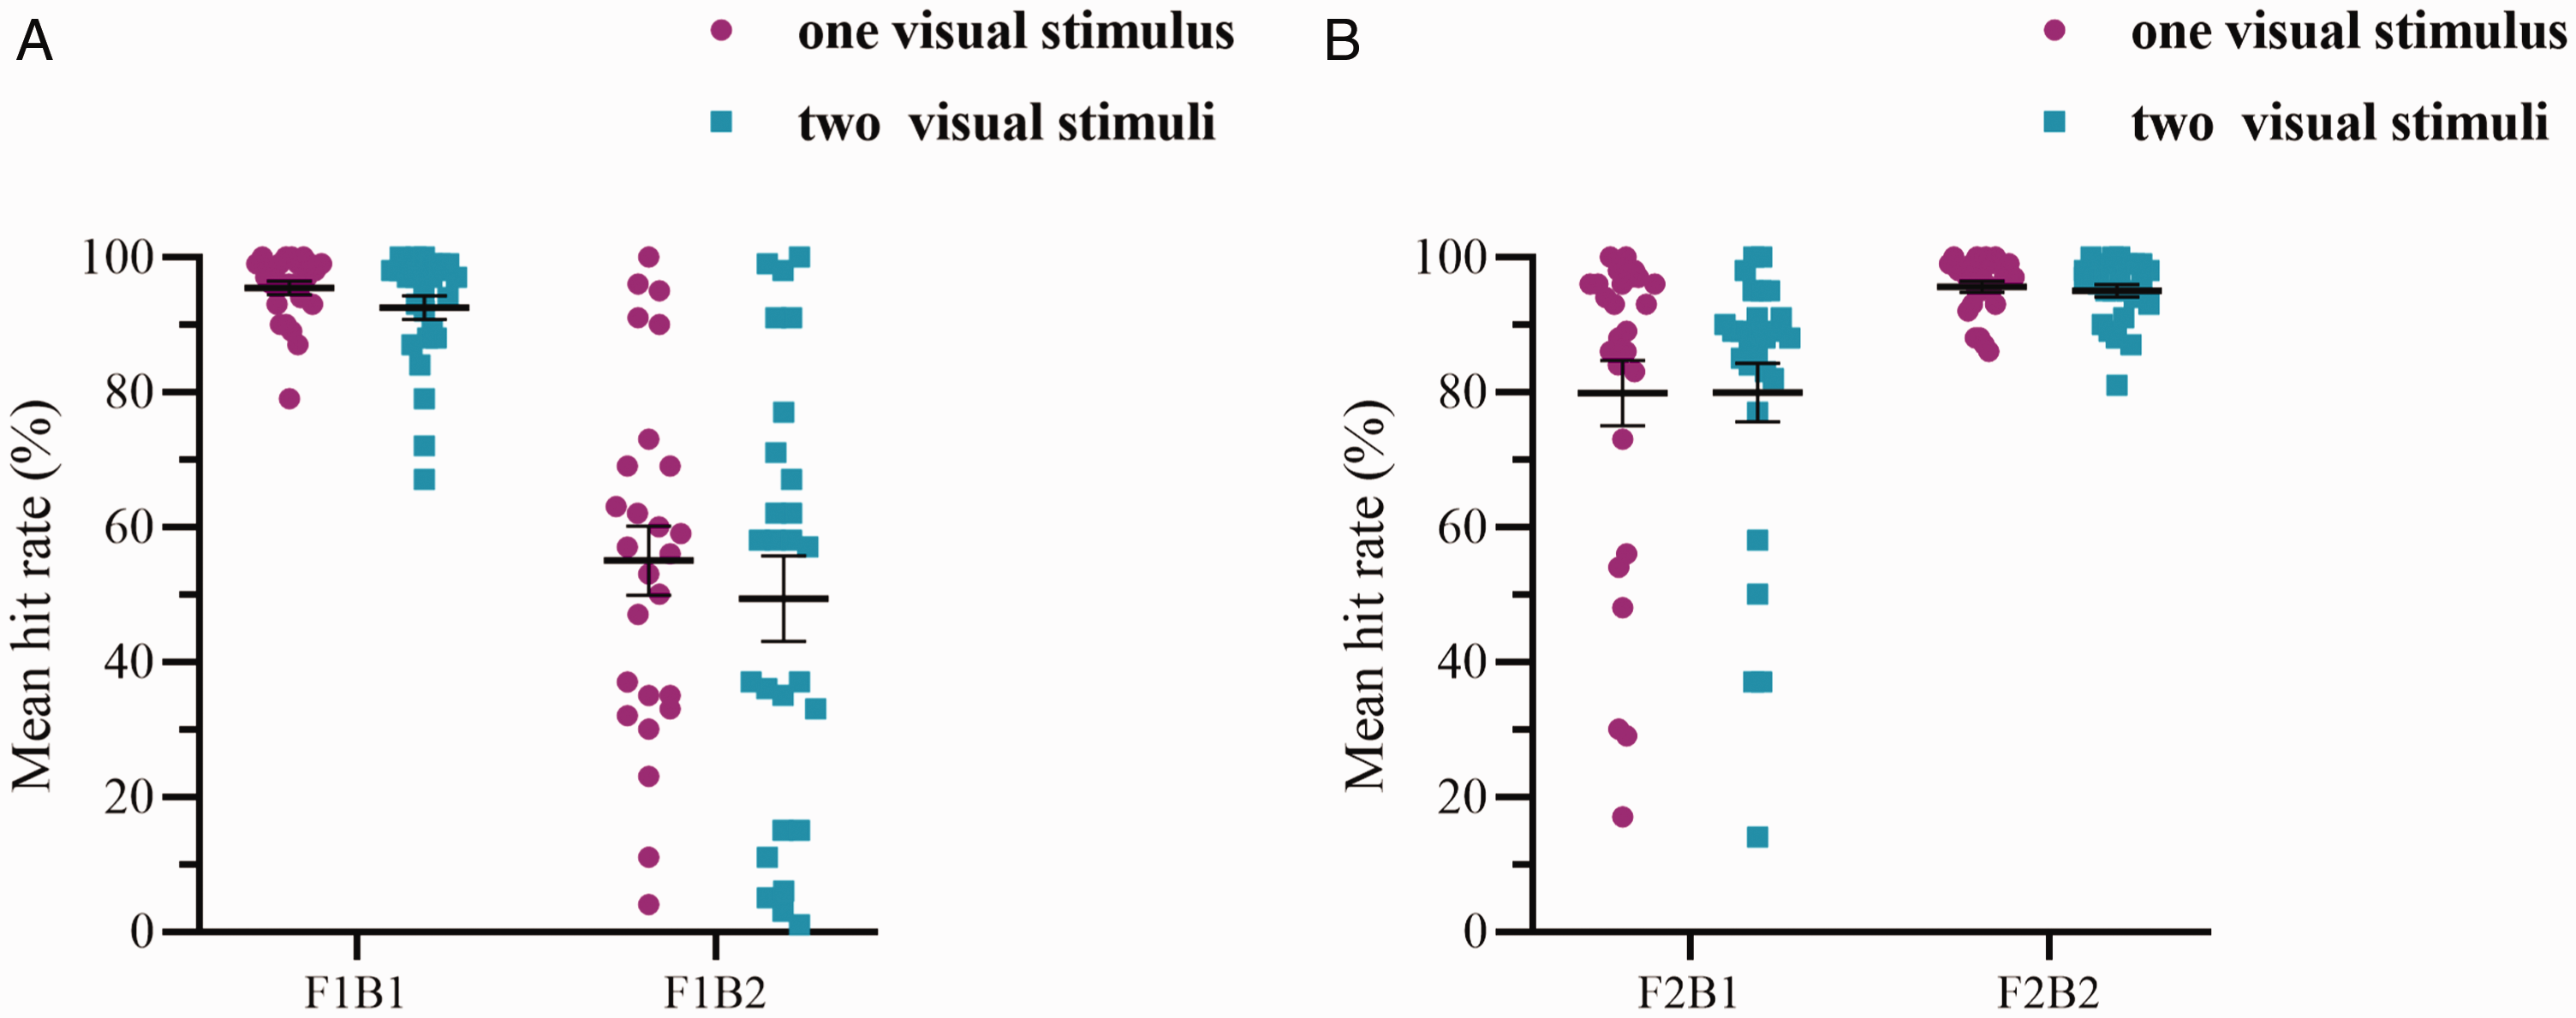
A: Mean hit rate (%) of the fission illusion condition. V1_F1B1 (M = 96%, SD = 0.05), V2_F1B1 (M = 93%, SD = 0.09), V1_F1B2 (M = 55%, SD = 0.26), V2_F1B2 (M = 49%, SD = 0.32). One visual stimulus means visual preceding flash was one, which appears as a purple pie; two visual stimuli means visual preceding flashes were two, which appears as a green rectangle. The mean hit rate of F1B2 condition was significantly lower than that of F1B1, indicating fission illusion was generated. B: Mean hit rate (%) of the fusion illusion condition. V1_F2B1 (M = 80%, SD = 0.25), V2_F2B1 (M = 80%, SD = 0.22), V1_F2B2 (M = 96%, SD = 0.04), V2_F2B2 (M = 95%, SD = 0.05). One visual stimulus means visual preceding flash was one, which appears as a purple pie; two visual stimuli means visual preceding flashes were two, which appears as a green rectangle. The mean hit rate of F2B1 condition was significantly lower than that of F2B2, indicating that fusion illusion was generated. (The error bars indicate SEs.)
To determine whether the fusion illusion still existed after the occurrence of preceding visual flashes, we performed a 2 (number of preceding visual flashes: 1 vs. 2) × 2 (condition: F2B1 vs. F2B2) repeated measures ANOVA in the fusion illusion conditions. The results showed that the main effect of the number of preceding visual flashes was not significant, F(1, 25) = 0.03, p = .86, η2 = 8.765e–5, BF10 = 0.173. The main effect of condition was significant, F(1, 25) = 11.82, p = .002, η2 = 0.29, BF10 = 38,226, and the hit rate with F2B2 (M = 95%, SD = 0.05) was significantly higher than that with F2B1 (M = 80%, SD = 0.23), which indicated a fusion illusion (as shown in Figure 3B). The interaction between the number of preceding visual flashes and condition was not significant, F(1, 25) = 0.09, p = .76, η2 = 1.449e–4, BF10 = 0.183. This indicated that the number of preceding visual flashes did not affect the size of the fusion illusion. This finding indicated that for the condition in which visual flashes and auditory beeps did not match (F1B2 condition and F2B1 condition), an auditory-dominant effect appeared from the perspective of hit rate. That is, the number of auditory beeps affected the judgment of the number of visual flashes. Moreover, the number of preceding visual flashes did not affect either the fission illusion or the fusion illusion.
Experiment 3: Effect of Auditory RS on the SiFI
Participants
If the accuracies in F1B1 and F2B2 were less than 65%, it was thought that the number of visual flashes could not be clearly identified, and the data from those participants were eliminated. Based on this criterion, all the participants’ data were valid. The participants were 26 college students (7 males and 19 females) aged 18–26 years old; all participants had normal vision or corrected vision and had never participated in similar experiments before. All participants gave written informed consent following the standards of the Declaration of Helsinki. The study was approved by the ethics committee of Department of Psychology at Soochow University.
To evaluate the statistical power of the present study, we used G*Power 3.1.9.2 to run a sensitivity analysis for a two-tailed paired sample t test (Faul et al., 2007, 2009). The input parameters were as follows: α err prob = 0.05, power (1–β err prob) = 0.80, and total sample size = 26. The output was Cohen’s d = 0.57, which indicated sufficient power to detect moderate-sized effects.
Stimuli and Apparatus
The experimental stimuli and apparatus were the same as in Experiment 2.
Experimental Design and Procedure
The experimental design consisted of two parts: a 2 (number of preceding auditory beeps: 1 vs. 2) × 2 (condition: F1B1 vs. F1B2) within-subjects design to explore the extent of the fission illusion and a 2 (number of preceding auditory beeps: 1 vs. 2) × 2 (condition: F2B1 vs. F2B2) within-subjects design to explore the extent of the fusion illusion. Eight experimental conditions were created (A1_F1B1, A1_F1B2, A1_F2B1, A1_F2B2, A2_F1B1, A2_F1B2, A2_F2B1, and A2_F2B2). For example, for A1_F2B1, A1 means there was one preceding auditory beep, and F1B1 refers to a visual flash accompanied by an auditory beep.
The experimental process is shown in Figure 4. In each trial in the experiment, the participants were presented with a single auditory beep or a double-beep (preceding auditory stimuli). Each auditory beep presented 7 ms, and the time interval between two auditory beeps in a double-beep was 76 ms. After a short interval of 500 ms, the same stimuli appeared again in the same way. After 500 ms, the visual flashes as the target stimulus appeared with the auditory beeps, similar to Experiment 1. The program after preceding stimuli is shown on the right of Figure 4. The conditions with the illusion included A1_F1B2, A1_F2B1, A2_F1B2, and A2_F2B1. Therefore, according to the participant responses, the aforementioned two conditions could be divided into A1_F1B2 versus A2_F1B2 and A1_F2B1 versus A2_F2B1. The rest of the conditions are the same as in Experiment 2.
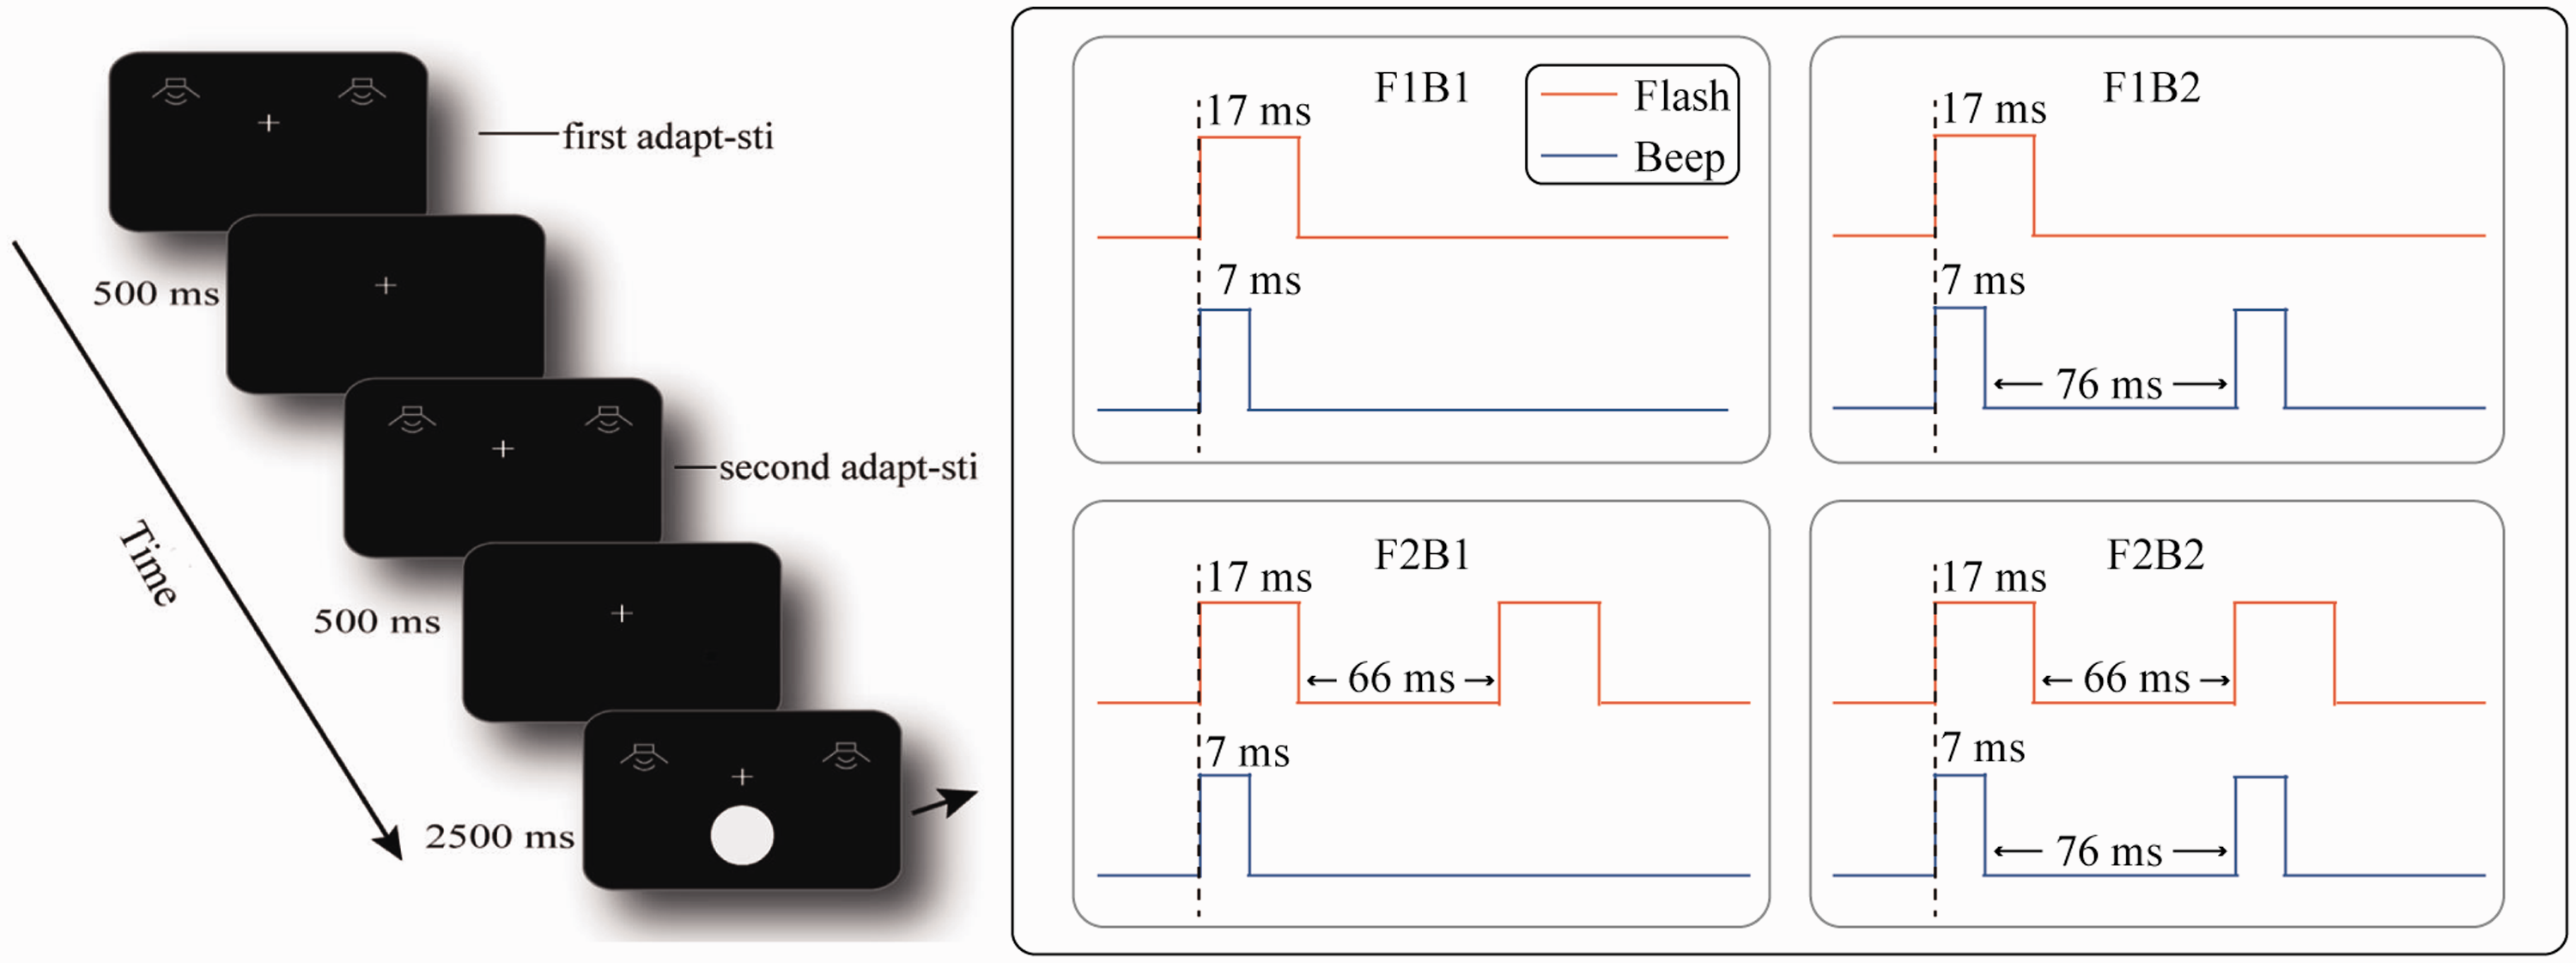
Procedure of events in a trial in Experiment 3. F1B1 refers to one flash with one beep, F2B2 refers to two flashes with two beeps, F1B2 refers to one flash with two beeps, and F2B1 refers to two flashes with one beep.
Statistical Analysis
To explore SiFI effects when there was an auditory RS effect, for the fission illusion condition, we performed a 2 (number of preceding auditory beeps: 1 vs. 2) × 2 (condition: F1B1 vs. F1B2) repeated measures ANOVA. For the fusion illusion conditions, we performed a 2 (number of preceding auditory beeps: 1 vs. 2) × 2 (condition: F2B1 vs. F2B2) repeated measures ANOVA. To further explore the influence of the number of preceding auditory beeps on the size of the illusion, we reported Bonferroni-adjusted p values for post hoc pairwise comparisons to correct for multiple comparisons.
In addition, to better explore whether differing numbers of preceding visual and auditory stimuli had differential effects on the size of the illusions compared with baseline level, we used mixed ANOVAs to conduct comprehensive analysis among the three experiments. In comprehensive analysis, we renamed the two variables, and we took the stimulation as one independent variable. The stimulation had three levels: Experiment 1 as No stimulation condition, Experiment 2 as the Visual stimulation condition, and Experiment 3 as the Auditory stimulation condition. And another independent variable was the number of preceding stimuli. For fission illusion analysis, we took the hit rate of F1B2 as dependent variable, we performed a 3 (stimulation: No stimulation vs. Visual stimulation vs. Auditory stimulation) × 2 (number of preceding stimuli: 1 vs. 2) ANOVA, and for fusion illusion, we took the hit rate of F2B1 as dependent variable, we performed a 3 (stimulation: No stimulation vs. Visual stimulation vs. Auditory stimulation) × 2 (number of preceding stimuli: 1 vs. 2) ANOVA. Post hoc t tests and independent sample t tests with Bonferroni corrections were also performed. To further demonstrate the validity of the statistics, we report the effect size of the statistical analysis, namely, η2 for ANOVAs and Cohen’s d for t tests. In addition, we also conducted Bayesian tests on JASP 0.13.0.1.
Results
To determine whether the fission illusion still existed after the occurrence of preceding auditory beeps, we performed a 2 (number of preceding auditory beeps: 1 vs. 2) × 2 (condition: F1B1 vs. F1B2) repeated measures ANOVA in the fission illusion conditions. The results showed that the main effect of the number of preceding auditory beeps was significant, F(1, 25) = 34.13, p < .001, η2 = 0.034, BF10 = 10.54, and the hit rate with two preceding auditory beeps (M = 89%, SD = 0.15) was significantly higher than that with one preceding auditory beep (M = 84%, SD = 0.21). The main effect of condition was significant, F(1, 25) = 27.80, p < .001, η2 = 0.45, BF10 = 6.826e + 9, and the hit rate with F1B1 (M = 96%, SD = 0.06) was significantly higher than that with F1B2 (M = 77%, SD = 0.22), which indicated a fission illusion. The interaction between the number of preceding auditory beeps and condition was significant, F(1, 25) = 44.62, p < .001, η2 = 0.05, BF10 = 19.48. To further analyze the interaction, we performed a series of paired samples t tests based on the Bonferroni comparisons, for the A1_F1B1 (M = 97%, SD = 0.05) and A2_F1B1 (M = 96%, SD = 0.08) conditions, t(25) = 0.87, p = 1.0, Cohen’s d = 0.35, BF10 = 0.80. For the A1_F1B2 (M = 71%, SD = 0.24) and A2_F1B2 (M = 83%, SD = 0.18) conditions, t(25) = 8.87, p < .001, Cohen’s d = 1.31, BF10 = 32,815, and the results showed that the hit rate with A2_F1B2 was significantly higher than that with A1_F1B2. This indicated that the number of preceding auditory beeps affected the size of the fission illusion. The hit rate of the judgment was higher when two preceding auditory beeps were presented than when one preceding auditory beep was presented (as shown in Figure 5A).
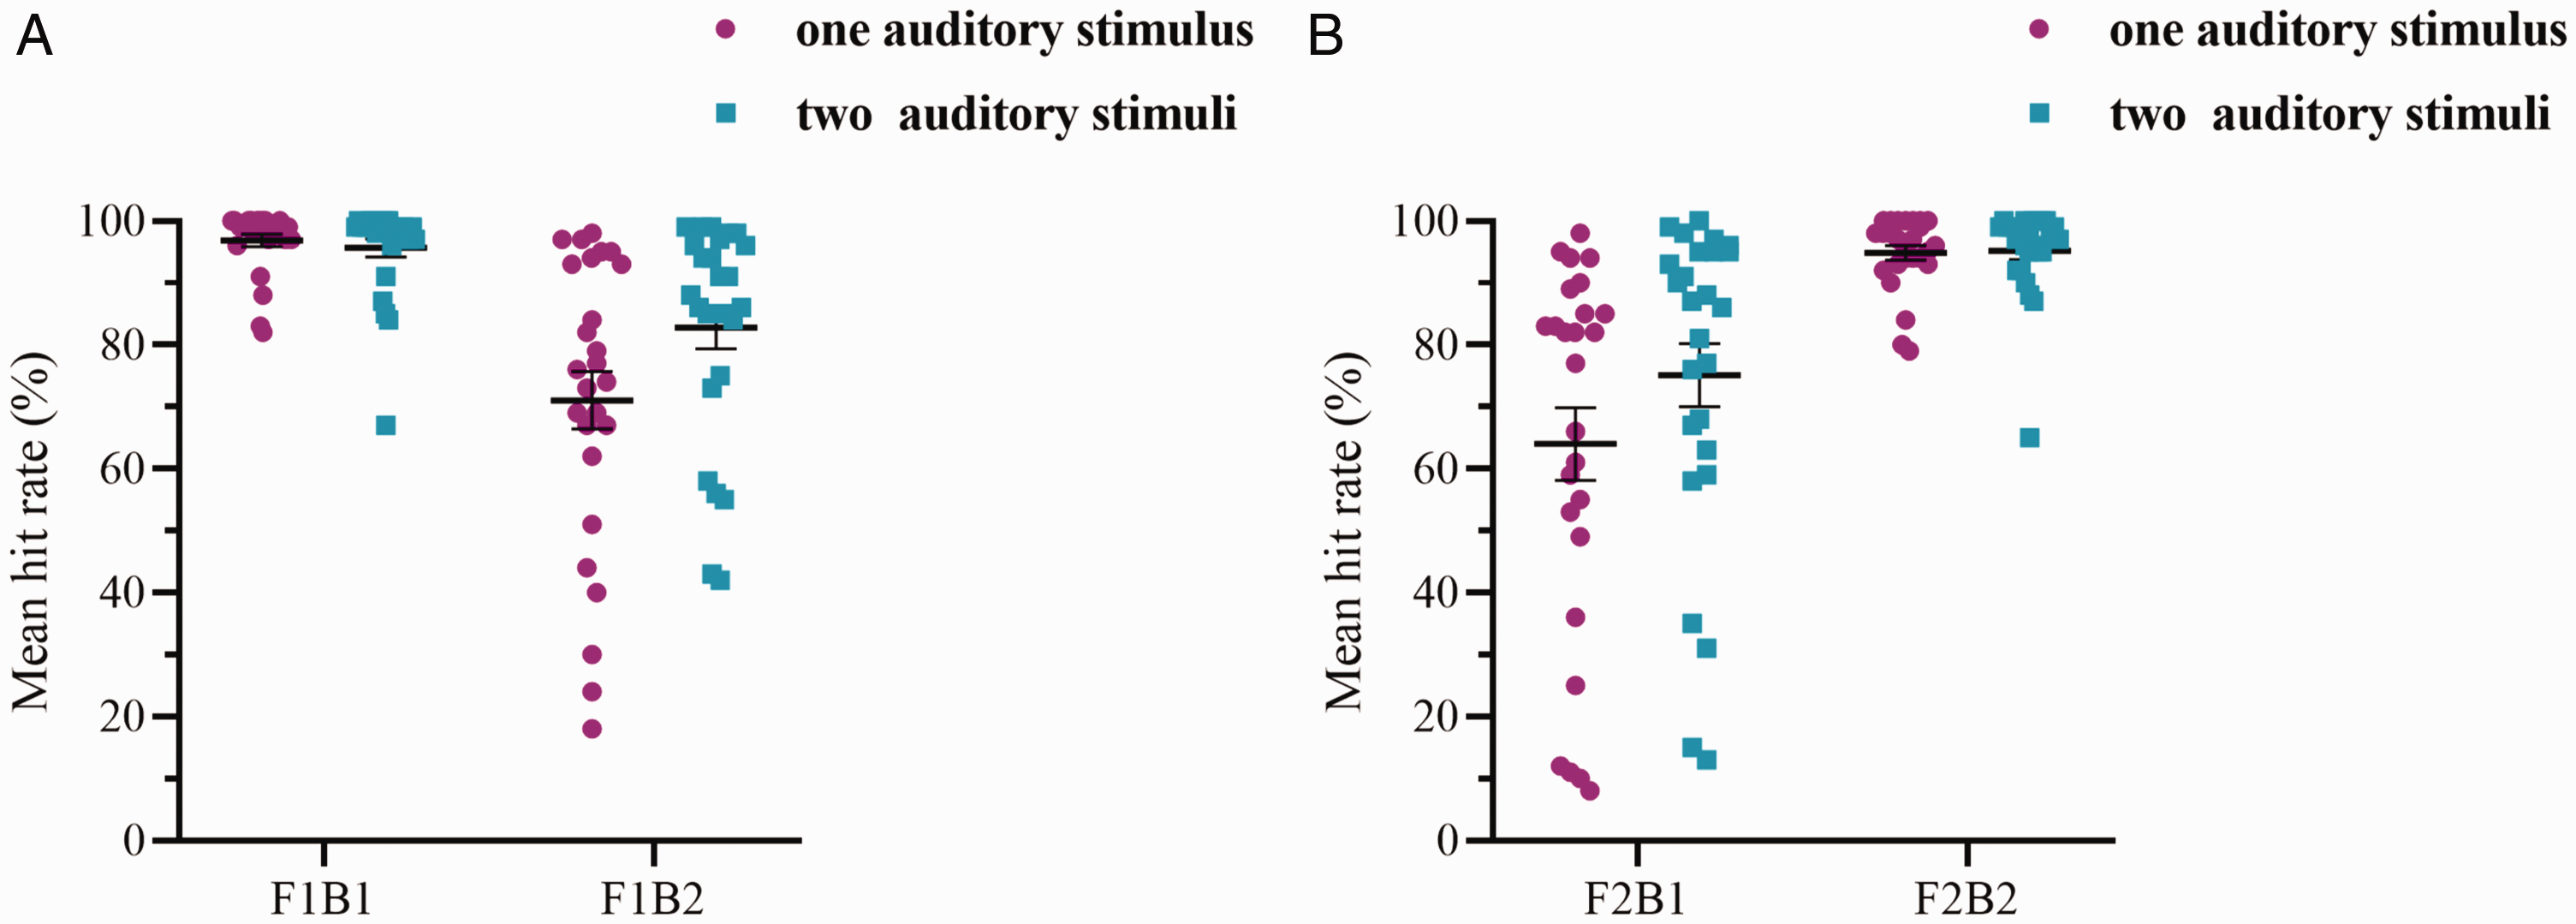
A: Mean hit rate (%) of the fission illusion condition. A1_F1B1 (M = 97%, SD = 0.05), A2_F1B1 (M = 96%, SD = 0.08), A1_F1B2 (M = 71%, SD = 0.24, A2_F1B2 (M = 83%, SD = 0.18). One auditory stimulus means auditory preceding beep was one, which appears as a purple pie; two auditory stimuli means auditory preceding beeps were two, which appears as a green rectangle. The mean hit rate of F1B2 condition was significantly lower than that of F1B1, indicating fission illusion was generated. B: Mean hit rate (%) of the fusion illusion condition. A1_F2B1 (M = 64%, SD = 0.30), A2_F2B1 (M = 75%, SD = 0.26), A1_F2B2 (M = 95%, SD = 0.06), A2_F2B2 (M = 95%, SD = 0.07). One auditory stimulus means auditory preceding beep was one, which appears as a purple pie; two auditory stimuli means auditory preceding beeps were two, which appears as a green rectangle. The mean hit rate of F2B1 condition was significantly lower than that of F2B2, indicating that fusion illusion was generated. (The error bars indicate SEs.)
To determine whether the fusion illusion still existed after the occurrence of preceding auditory beeps, we performed a 2 (number of preceding auditory beeps: 1 vs. 2) × 2 (condition: F2B1 vs. F2B2) repeated measures ANOVA in the fusion illusion conditions. The results showed that the main effect of the number of preceding auditory beeps was significant, F(1, 25) = 9.68, p = .005, η2 = 0.024, BF10 = 1.33, and the hit rate with one preceding auditory beep (M = 85%, SD = 0.21) was significantly higher than that with two preceding auditory beeps (M = 79%, SD = 0.26). The main effect of condition was significant, F(1, 25) = 31.04, p < .001, η2 = 0.48, BF10 = 6.364e + 9, and the hit rate with F2B2 (M = 95%, SD = 0.07) was significantly higher than that with F2B1 (M = 70%, SD = 0.28), which indicated a fusion illusion. The interaction between the number of preceding auditory beeps and condition was significant, F(1, 25) = 17.46, p < .001, η2 = 0.021, BF10 = 2.08. To further analyze the interaction, we performed a series of paired samples t tests based on the Bonferroni comparisons For the A1_F2B1 (M = 64%, SD = 0.30) and A2_F2B1 (M = 75%, SD = 0.26) conditions, t(25) = 4.94, p < .001, Cohen’s d = 0.73, BF10 = 33.86, and the results showed that the hit rate with A2_F2B1 was significantly higher than that with A1_F2B1. For the A1_F2B2 (M = 95%, SD = 0.06) and A2_F2B2 (M = 95%, SD = 0.07) conditions, t(25) = 0.15, p = 1, Cohen’s d = 0.06, BF10 = 0.22. This finding indicated that for the conditions in which visual flashes and auditory beeps did not match (F1B2 condition and F2B1 condition), an auditory-dominant effect appeared from the perspective of hit rate (as shown in Figure 5B). Moreover, the number of preceding auditory beeps can affect the size of the fission illusion and fusion illusion. The hit rate with two preceding auditory beeps was improved compared with the hit rate with one preceding auditory beep.
Comprehensive Results
To further investigate whether differing numbers of preceding visual and auditory stimuli have differential effects on the size of illusions, a 3 (stimulation: No stimulation vs. Visual stimulation vs. Auditory stimulation) × 2 (number of preceding stimuli: 1 vs. 2) ANOVA was conducted for the fission illusion and fusion illusion.
Fission Illusion
The main effect of stimulation was significant, F(2, 72) = 18.84, p < .001, η2 = 0.33, BF10 = 4.855e + 9. The main effect of the number of preceding stimuli was not significant, F(1, 72) = 3.56, p = .063, η2 = 0.001, BF10 = 250,537. Although the p value >.05, the Bayesian test strongly supported the H1 hypothesis, therefore, we believed that the main effect of the number of preceding stimuli reached significance to a large extent. More important, the interaction was significant, F(2, 72) = 23.66, p < .001, η2 = 0.015, BF10 = 1.013e + 6. The results after Bonferroni correction showed that there was a significant difference between No stimulation (M = 34%, SD = 0.24) and Visual stimulation (M = 52%, SD = 0.29), t(47) = 2.58, p = .036, Cohen’s d = 0.75, BF10 = 25.96, that there was a significant difference between No stimulation and Auditory stimulation (M = 77%, SD = 0.22), t(47) = 6.09, p < .001, Cohen’s d = 1.78, BF10 = 1.504e + 12, and that there was a significant difference between Visual stimulation and Auditory stimulation, t(50) = 3.63, p = .002, Cohen’s d = 1.03, BF10 = 4,631.
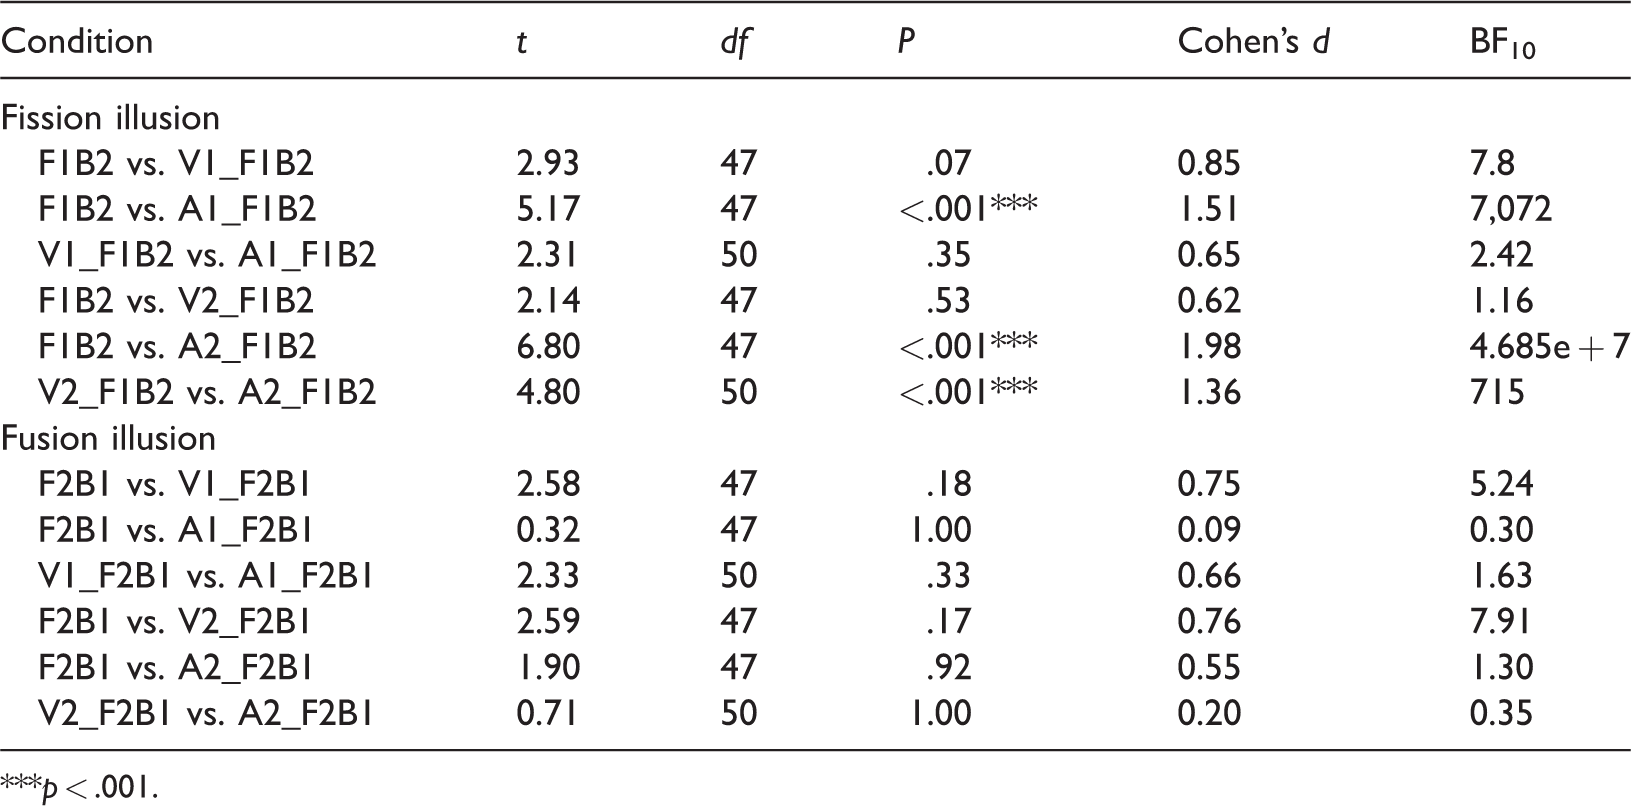
To analyze the results of the interactions, we performed a series of independent sample t tests with multiple comparison corrections. The results showed that the hit rate in F1B2 was lower than that in A1_F1B2, the hit rate in F1B2 was lower than that in A2_F1B2, and the hit rate in V2_F1B2 was lower than that in A2_F1B2. Other results were not significant (see Table 1). This indicated that visual RS and auditory RS had differential effects on the size of the fission illusion. There was no significant difference in the illusion size with the visual RS and the baseline level, and the illusion size with the auditory RS was smaller than baseline regardless of whether the preceding stimuli was one or two.
Multiple comparison results of Fission illusion and Fusion illusion.
***p < .001.
Fusion Illusion
The main effect of stimulation was significant, F(2, 72) = 3.58, p = .033, η2 = 0.084, BF10 = 37. The main effect of the number of preceding stimuli was significant, F(1, 72) = 7.80, p = .007, η2 = 0.005, BF10 = 65. The interaction was significant, F(2, 72) = 7.81, p = .001, η2 = 0.011, BF10 = 71. The results after Bonferroni correction showed that there was a significant difference between No stimulation (M = 62%, SD = 0.21) and Visual stimulation (M = 80%, SD = 0.23), t(47) = 2.66, p = .029, Cohen’s d = 0.78, BF10 = 196, that there was no significant difference between No stimulation and Auditory stimulation (M = 70%, SD = 0.28), t(47) = 1.14, p = .78, Cohen’s d =0.33, BF10 = 0.59, and that there was no significant difference between Visual stimulation and Auditory stimulation, t(50) = 1.57, p = .37, Cohen’s d =0.44, BF10 = 1.31. To analyze the results of the interactions, we performed a series of independent sample t tests with multiple comparison corrections. All results were not significant (see Table 1). These results indicated that there was no difference in the size of the illusion with the visual RS and auditory RS compared to the baseline level, and this was independent of the number of preceding stimuli.
General Discussion
The purpose of Experiment 1 was both to verify the classic SiFI effect and to serve as a baseline experiment for comparison to the SiFI effect with RS. The classic SiFI paradigm (Shams et al., 2000, 2002) was used in the present study by manipulating the RS effect in different modalities to investigate whether SiFI and the RS effect in different modalities affected the magnitude of the SiFI differently. The present study showed that for the fission illusion, the hit rate with the auditory RS was higher than that in the classic SiFI. However, the hit rate with the visual RS was not significantly different from that in the classic SiFI. When the number of preceding stimulus was one, there was no significant difference between the hit rate with visual RS and with auditory RS. When the number of preceding stimuli was two, the hit rate in the auditory RS was significantly higher than that of the visual RS; these findings might indicate that auditory adaptation affected the amount of auditory dominance more than visual adaptation. Regarding the fusion illusion, the size of the illusion under the visual and auditory RS was similar to that in the classic SiFI, and there was no significant difference between the hit rate with visual RS and with auditory RS. We suspected that the reason the fusion illusion was unaffected was that RS had a less obvious or more complex effect on the fusion illusion. These results indicated that the auditory RS effect was a stable phenomenon and could affect fission illusion, which was consistent with previous research (Sun et al., 2020). Specifically, the present study also found that RS effects from different sensory modalities had different effects on the magnitude of the SiFI.
Visual RS Effect in Fission and Fusion Illusions
In Experiment 2, the classical SiFI occurred when the number of visual target stimuli and auditory beep stimuli did not match. That is, the hit rate in F1B2 was significantly lower than those of F1B1 (Shams et al., 2000; Wozny et al., 2008). However, there were no significant differences in visual RS from baseline with either the fission or fusion illusion. These results indicated that the classic SiFI paradigm adopted in this experiment (Shams et al., 2000) had a stable auditory-dominant effect, and on the surface, visual RS had no effect on the SiFI. However, the RS effect was a stable phenomenon that existed in multiple sensory modalities. In the visual RS condition, when the same visual stimulus was repeated, the participants responded to the stimulus faster, and the error rate was lower (Henson, 2003). In the present study, the reason that the hit rate of the participants remained unchanged may have been that the effect of the visual RS was suppressed by a sufficiently strong SiFI effect. The SiFI is a multisensory integration phenomenon dominated by auditory information, which shows that auditory information processing takes precedence over visual information processing, leading to poor processing of visual information input. As a result, the visual RS effect was not apparent based on the hit rate.
The Influence of the Number of Preceding Visual Stimuli on Fission and Fusion Illusions
The results of Experiment 2 showed that no effect of the number of preceding visual stimuli on the illusion was found. This seemed to be a departure from previous results (Grill-Spector & Malach, 2001; Li et al., 1993; Xiang & Brown, 1998). The fission illusion might be affected by the RS effect because of the relationship between the repetitive stimuli and the probing stimuli and because the RS effect reduced neural activity in the cerebral cortex, which was responsible for processing of visual stimuli (Grill-Spector & Malach, 2001). Some studies using single-cell recordings found that for processing visual information, the discharge rate tended to decrease gradually with an increase in the number of preceding stimuli presented, and the maximum reduction in the discharge rate occurred after the first preceding stimulus was presented (Li et al., 1993; Xiang & Brown, 1998). Shams et al.(2005) used magnetoencephalography and found that modulation of activity in occipital and parietal scalp locations in illusion trials (Shams et al., 2005). A functional magnetic resonance imaging study by Grill-Spector and Malach (2001) found that the signal intensity in the lateral occipital cortex of the visual system decreased with an increase in the number of preceding stimuli and decreased the fastest with the first three to four preceding stimuli (Grill-Spector & Malach, 2001). Previous studies have shown that the RS effect was influenced by the relationship between repetitive and probing stimuli (Grill-Spector et al., 1998; Winston et al., 2004). When the physical properties and number of repetitive stimuli and detection stimuli were the same, participant hit rate was higher. However, the present results showed that the number of preceding visual stimuli did not affect the size of the illusion. There were two possible reasons. On one hand, the SiFI was an auditory-dominant phenomenon, and the preceding visual stimuli did not affect the size of the illusion. On the other hand, it may also be that the visual RS effect was smaller than the SiFI effect, and the number of preceding visual stimuli was not enough to affect the size of the illusion. Future studies could increase the number of preceding visual stimuli for further examination. However, this study showed that the number of preceding visual stimuli had no significant effect on fusion illusion, which might be caused by the instability of the fusion illusion (Abadi & Murphy, 2014).
Auditory RS Effect in Fission and Fusion Illusions
This study also found the auditory-dominant effect of the SiFI in Experiment 3, which is a finding that is similar to previous studies. The hit rate in F1B2 was significantly lower than those of F1B1, and the hit rate in F2B1 was significantly lower than those of F2B2 (Shams et al., 2000; Wozny et al., 2008). No matter whether the number of preceding auditory stimuli was one or two, the hit rate with the auditory RS was higher than that of the classical SiFI in F1B2, whereas for the F2B1 condition, the hit rate with the auditory RS was not significantly different from that of classical SiFI.
Based on the results of this experiment, it was found that the fission illusion was greatly affected by the auditory RS, and the fusion illusion showed relatively stable characteristics. That is, the hit rate of F2B1 was almost the same as the baseline experimental results. Therefore, it can be concluded that the auditory RS on the dominant effect of the SiFI was relatively stable. Based on previous studies, when preceding auditory stimuli occurred in exactly the same way, it could affect the subsequent processing of auditory stimuli and weakened the neural activity induced by the beep stimuli in the SiFI (Lanting et al., 2013). The phenomenon of auditory RS, namely, the adaptive effect, weakened the auditory-dominant effect, thus promoting the processing of visual information and reducing the possibility of an illusion.
The Influence of the Number of Preceding Auditory Stimuli in Fission and Fusion Illusions
The findings from this experiment were quite different from those of Experiment 2. That is, under the conditions of F1B2 and F2B1, compared with one preceding auditory stimulus, two preceding auditory stimuli significantly improved the hit rate of the participants’ judgment and weakened the fission illusion. When participants only need to judge the number of visual flashes, while ignoring auditory information, an increase in auditory noise may weaken participants’ sensitivity to auditory stimuli. The sensitivity of individuals to the attended modality was relatively high, thus weakening the processing of the nonattended modality information and reducing the generation of an illusion. Thus, in the auditory RS condition, when there were two preceding auditory stimuli, the fission illusion was weakened and promoted response to the target stimuli compared to one preceding auditory stimulus. This finding indicated that the auditory RS effect steadily weakened the auditory-dominant effect in the SiFI, thus promoting the processing of visual stimuli.
Studies on auditory information processing have also shown that when auditory stimuli were presented precedingly, the amplitude of the N1 component induced by the first sound stimulus was the largest, and the N1 induced by the subsequent sound stimulus was significantly reduced (Budd et al., 1998; Okamoto & Kakigi, 2014). In the present study, we found the effect of RS on the SiFI. That is, the preceding occurrence of the same stimulus affected the response of the participants to the target stimuli (Henson, 2003; James et al., 2000). To some extent, it can be suggested that the appearance of preceding stimuli caused corresponding changes in neural activity in the visual system and auditory system, resulting in an influence on the magnitude of the illusion of the SiFI. The results of this study were consistent with previous studies on prestimulus neural activity influencing perception of the SiFI (Kaiser et al., 2019; Keil, 2020; Keil et al., 2014; Keil & Senkowski, 2017), and other multisensory effects (Keil & Senkowski, 2018). For example, increased beta-band connections between the superior temporal gyrus and the primary auditory cortex were associated with illusory perception (Keil et al., 2014).
Conclusion
In summary, the present study suggested that the SiFI effect was modulated by the sensory modality RS effect. Visual RS and auditory RS had different effects on the SiFI. For the fission illusion, visual RS did not affect the size of the illusion; however, auditory RS reduced the size of the illusion, and two preceding stimuli reduced the size of the illusion more than one preceding stimulus. However, for the fusion illusion, neither visual RS nor auditory RS had any effect on the size of the illusion. Therefore, regarding the process of multisensory integration, the visual modality and the auditory modality had asymmetrical RS effects. The present study provided a new entry point to explore changes in neural activity in the sensory system prior to multisensory integration.
Footnotes
Acknowledgements
We would like to thank Bo Dong and Ai-Rui Chen of Suzhou University of Science and Technology for helpful suggestions on topics related to this work. In addition, our deepest gratitude goes to the anonymous reviewers and editor for their careful work and thoughtful suggestions that have helped improve this article substantially.
Declaration of Conflicting Interests
The author(s) declared no potential conflicts of interest with respect to the research, authorship, and/or publication of this article.
Funding
The author(s) disclosed receipt of the following financial support for the research, authorship, and/or publication of this article: This research was supported by the National Natural Science Foundation of China (31700939, 31871092, and 31800907). A. W. was also supported by the Natural Science Foundation of Jiangsu Province (BK20170333), MOE Project of Humanities and Social Sciences (17YJC190024) and Youth Science and technology talent promotion project of Suzhou Association for science and technology (2021).
