



Abstract
Perceptions of an individual can change dramatically across different images of their face. Questions remain as to whether some traits are more sensitive to image variability than others. To investigate this issue, we constructed a database of 340 naturalistic images consisting of 20 photos of 17 individuals. In this preregistered study, 95 participants rated all 340 images on one of three traits: trustworthiness, dominance, or attractiveness. Across images, participants’ trustworthiness ratings tended to vary more than dominance, which in turn varied more than attractiveness; however, the relative differences between traits depended on the identity in question. Importantly, despite the variability in ratings within identities, there were substantial differences between individuals, suggesting that these trait judgements are based to some degree on relatively invariant facial characteristics. We found greater between-identity variability for attractiveness judgements compared to trustworthiness and dominance. Future research should further investigate the extent to which each trait dimension is tied to the identity of the faces.
We glean a wealth of social information from an individual’s face. Within 100 ms, perceivers automatically form impressions of a person’s character based solely on the appearance of their face (Willis & Todorov, 2006). The nature of these impressions can have consequences in prison sentencing (e.g., Wilson & Rule, 2015), political elections (e.g., Todorov et al., 2005), and dating preferences (e.g., Langlois et al., 2000). When evaluating faces, people generally focus on dimensions of trustworthiness, dominance, and attractiveness (Oosterhof & Todorov, 2008; Sutherland et al., 2013).
In a seminal study, Oosterhof and Todorov (2008) identified 13 social traits that perceivers spontaneously judge from faces with neutral expressions and a direct gaze. A principal components analysis on these 13 traits uncovered two dimensions of trustworthiness/valence and dominance. Trustworthiness captures the perceived approachability of a face and is thought to relate to the target’s intentions to help or harm the observer. Dominance is predominantly characterised by physical strength and signals the target’s ability to help or harm the observer. Sutherland et al. (2013) tested Oosterhof and Todorov’s two-dimensional model using ambient (i.e., unconstrained naturalistic) images and revealed an additional dimension of attractiveness/youthfulness. The attractiveness dimension may reflect sexual selection motivations or social judgements of age and health (Sutherland et al., 2013). Researchers have extensively explored differences in impressions between individuals (e.g., Jones et al., 2021); however, impressions across images of the same individual (i.e., within-person variability) has received relatively little attention (Todorov & Porter, 2014).
Within-Person Variability
Images of the same face can change in appearance because they can vary in terms of characteristics of the face and properties of the image (Burton, 2013). Images of the same person captured even moments apart can vary in expression, head rotation, and lighting (Burton, 2013). A mere few degrees of head rotation can be enough to substantially reduce recognition accuracy (Bruce, 1982; Favelle et al., 2011). Over longer periods, changes in health, age, adiposity, and hairstyle can dramatically alter the appearance of a face (Burton, 2013). The magnitude of variation in facial appearance is exacerbated further by characteristics of the camera (e.g., focal length, shutter, lens settings, perspective) and overall quality of the image (Burton, 2013). The interplay between these sources of variation assures that no two images of an individual will be the same. Visual differences between photos of the same face will likely lead to changes in subsequent impressions.
Different images of the same individual can produce large differences in subsequent trait judgements. Todorov and Porter (2014) examined how various trait judgements (attractive, competent, creative, cunning, extroverted, mean, trustworthy, and smart) differed across images of the same face. For every trait except attractiveness, within-identity variance in trait judgements was comparable to or greater than the variability between individuals. That is, impressions varied as much or more across images of the same face than between different identities. This is a particularly powerful finding as it suggests that single images of a person do not give us a reliable basis for inferring whether the person is more or less trustworthy, mean, or competent than another. An implication of this for research, according to Todorov and Porter, is that any attempt to assess the accuracy of trait judgements using single images of each individual is doomed because image selection is often biased. For example, if one compares a profile picture of a college student to a mug shot of a criminal, one is likely to rate the college student as more trustworthy. However, unbiased images of the same individuals would be equally likely to be rated as more trustworthy.
Other studies have also investigated how impressions differ across images of a face. Jenkins et al. (2011) examined ratings of attractiveness across images that varied along multiple characteristics. In contrast to Todorov and Porter (2014), Jenkins et al. found that judgements of attractiveness varied more across images of the same identity than between different identities. To shed further light on impression variability across images, Sutherland et al. (2017) investigated the influence of emotional expression and viewpoint on the variability of trustworthiness, dominance, and attractiveness ratings. They found that judgements of trustworthiness varied more across images than dominance, which in turn varied more than attractiveness. In addition, each of these three traits varied more across images of the same person than between identities for both male and female faces. However, Sutherland et al. systematically manipulated their images in terms of emotional expression and viewpoint, which might have artificially inflated the degree of variability in some traits compared to others.
The aforementioned studies demonstrated the importance of considering within-person variability in trait impressions. Trait judgements might vary more within identities than between (although this is less clear for attractiveness), suggesting that some trait impressions might rely on transient facial cues more than others. The findings from Sutherland et al. (2017) and Todorov and Porter (2014) confirm that some traits do vary more than others; however, the nature of their stimuli might have distorted the natural variation in impressions. More variability in judgements of images might offer some insight into the type of facial cues that are tied to different traits.
Stable and Transient Facial Cues
The variability of a given trait is thought to depend partly on its relative association with stable and transient facial cues (Hehman et al., 2015). Stable cues refer to characteristics that do not change much from moment to moment and are often derived from underlying bone structure (e.g., distance between eyes, prominence of cheekbones). In contrast, transient or changeable features relate to cues that are dynamic and malleable and generally arise from facial musculature (e.g., mouth; Hehman et al., 2015). Therefore, stable cues vary less across images of an identity than transient cues as they do not change substantially from image to image (Hehman et al., 2015). As such, traits that rely more upon stable cues are thought to vary less across images of a face than traits associated with transient cues.
There is evidence that some trait dimensions are derived more from stable cues, whereas others rely more on changeable features (Hehman et al., 2015; Sutherland et al., 2017; Vernon et al., 2014). Specifically, Vernon et al. (2014) revealed that evaluations of trustworthiness are predominantly derived from changeable cues (e.g., mouth). In contrast, judgements of attractiveness are generally considered to be associated with stable cues (e.g., facial symmetry, sexual dimorphism, averageness; Langlois et al., 2000). Although there is less consensus regarding the cues that signal dominance, this dimension is generally thought to depend on stable cues such as eyes-to-eyebrow distance and gender (Oosterhof & Todorov, 2008; Vernon et al., 2014). The importance of gender, especially in dominance judgements, likely derives from cues to masculinity and femininity, which are also linked to more stable features (Sutherland et al., 2014). Of course, as Todorov and Porter (2014) point out, even these so-called stable cues can vary from image to image, but they probably vary less than those that are linked to facial musculature. Consistent with this, Sutherland et al. (2017) found trustworthiness judgements vary the most, followed by dominance and attractiveness, and Todorov and Porter also found attractiveness to be most stable across images. Thus, there is some theoretical and empirical evidence to suggest not all traits vary equally across images of a given individual.
Issues With Stimuli Used in Research
The question of how variable trait ratings are across images of a given identity, and whether they vary as much or more as they do between identities, obviously depends, to some extent, on how variable the images within a set are, both within identities and between them. As mentioned earlier, the image sets used in the aforementioned studies may not reflect natural variation because the actors were directed to pose with different expressions or head angles. A second issue is that researchers in this area rely on available face databases that contain a limited number of images per identity. For instance, several influential studies (e.g., Hehman et al., 2015; Todorov & Porter, 2014) used a popular database, Face Recognition Technology (FERET; Phillips et al., 1998), comprising only five images of each identity. Five images are unlikely to fully capture the extent to which a face can change across photos. Gipson (2019) manipulated the number of ambient images that the participants were exposed to (5, 15, or 45 photos) before completing a face sorting task—where multiple images of different identities (usually two) are sorted into piles of the same identity (see Jenkins et al., 2011). Although sorting performance was enhanced for participants who saw 15 images as compared to 5, there was little to no additional benefit to performance when participants saw 45 images. Similarly, Jenkins and Burton (2011) used a computer program to combine different images into a composite average. This averaging process accentuates features that are consistent (i.e., identity relevant) across images and averages out inconsistent features (i.e., not identity relevant; Tiddeman et al., 2001). The resulting averaged image is thought to capture the visual essence of a face (Jenkins & Burton, 2008). As such, the number of images needed to form a stable average should reflect the number of images needed to represent an identity. Jenkins and Burton (2011) found that averaged images remained stable after approximately 12 images. This evidence might suggest that researchers would require at least 12–15 images of an identity to capture the full range of variation of a face. Thus, a limitation of previous research is that many studies relied on databases with fewer than 10 images per identity.
In addition, images used in face perception research generally do not vary freely or naturally (Sutherland et al., 2013). That is, images are selected to either vary systematically on characteristics (e.g., expression, viewpoint) or are standardised to minimise variation (e.g., neutral expression, blank background, forward facing). Although manipulated and standardised images are essential for answering many important research questions, they have limited external validity. Faces encountered in everyday life are unconstrained and, as such, might qualitatively differ to systematically manipulated or standardised images.
Many studies that moved beyond manipulated and standardised images by using ambient (i.e., naturalistic) images with numerous photos per identity have their own limitation—the stimulus sets consist of celebrities (e.g., Jenkins et al., 2011; Mileva et al., 2019). Images of celebrities from other countries are an excellent resource because numerous ambient images are readily available through a Google Image search; however, even if participants are not familiar with the celebrities, these images might differ to photos of the general public. For instance, the photos are often taken by professional photographers, and they often capture celebrities smiling with professional makeup at exclusive events. Therefore, impressions formed from such images would likely differ to images of the general public, especially in terms of perceived attractiveness.
An additional methodological issue that might influence trait ratings is that studies often use photos presented in greyscale with a blank background (e.g., Todorov & Porter, 2014) as a further attempt to standardise images. Presenting images in greyscale might reduce the availability of important cues that contribute to impression formation. For example, the presence of skin blemishes can signal poor health or disease (Zebrowitz & Rhodes, 2004), which can negatively influence judgements of attractiveness (Jaeger et al., 2018). The emotional valence of the background context of an image can influence positive and negative judgements of faces (Koji & Fernandes, 2010), which would likely have implications for traits such as trustworthiness, dominance, and attractiveness.
Thus, many of the aforementioned studies do not fully capture the numerous sources of image variability (for a review, see Burton, 2013) and, as such, may not reflect the way impressions are formed in daily life. We constructed a database to address these concerns with the aim of furthering our understanding of the extent to which different traits vary between and within identities. Details of the database are outlined in the Methods section.
The Current Study
Previous research (e.g., Todorov & Porter, 2014) demonstrated that perceptions of an individual can change substantially across different images of their face. As such, the primary aim of this study was to explore how perceived social traits vary across different images of the same individual and assess whether some traits are more tied to identity than others. Researchers have proposed that some traits (e.g., trustworthiness) are predominantly derived from changeable cues, whereas others (e.g., attractiveness) are more reliant on stable cues (e.g., Hehman et al., 2015; Vernon et al., 2014). Changeable cues would be expected to vary across images, whereas stable cues would be relatively consistent across photos of a person. In line with this reasoning, we preregistered two hypotheses. First, we predicted that trustworthiness would display greater within-identity variability than dominance, which would in turn vary more than attractiveness. Second, based on the findings of Sutherland et al. (2017), we hypothesised that within-identity variability in trait ratings would exceed between-identity variability.
Methods
Disclosure Statement and Deviations From Preregistration
In our study, we report how we determined our sample size, all data exclusions, all manipulations, and all measures (Simmons et al., 2012). This study was approved by the Swinburne University Human Research Ethics Committee (approval number: 2018/370), and all participants provided informed consent. We preregistered our study, and all materials, data, and code are available on the Open Science Framework (https://osf.io/g3euq/). Prior to viewing the data, we made a number of deviations from our preregistration (see details in Table S1 in the supplemental material).
Design
This study used a 3 (trait) × 17 (identity) × 20 (images) mixed-factorial design. Trait was manipulated between subjects, whereas identity and image were manipulated within subjects. Participants were randomly allocated to one of the three trait conditions and rated all face images on a given trait. Specifically, participants were assigned to rate the 340 images on either trustworthiness (n = 32), dominance (n = 34), or attractiveness (n = 29) to avoid carryover effects between different traits (Rhodes, 2006). After rating the complete set, participants rated images of five identities (100 images) a second time on the same trait to allow us to assess consistency in judgements of the same image (Kramer et al., 2018). The presentation order of the images within the test and the retest trials was completely randomised for each participant.
Participants
We based our sample size calculations on Jones et al.’s (2021) computer simulations, which determined that in order to have at least 95% power, we would need at least 25–30 valid raters for each trait (see https://osf.io/x7fus/ for their code and data). We recruited 118 students enrolled in a first-year psychology class at a large Australian University through the Research Experience Program. Participants received course credit for their participation.
Following our preregistered data exclusion criteria, we removed data from 23 participants. Specifically, we excluded three participants who reported familiarity with at least one of the identities. We removed an additional nine participants who gave the same rating for at least 75% of their responses and excluded an additional six participants who did not complete the experiment. We removed a further five participants who displayed zero or negative test–retest correlations. The final sample of 95 participants consisted of 71 females and 23 males (1 participant chose not to specify their gender) between the ages of 18 and 61 years (M = 28.84, SD = 10.12).
Materials
Our face database contained 17 identities (8 males, 9 females; all Caucasian; between 20 to 25 years of age, approximately) with 20 different full-colour photos for each identity, for a total of 340 images. 1 The face images were collected from friends and associates of the first author. These individuals were asked to select photos randomly and were informed that the images could vary in characteristics such as hair length, expression, age, and setting. All individuals gave informed consent for their images to be used in this study and future research.
We screened the compiled images to ensure that the faces were clearly discernible and unobstructed. We removed some images from the database that showed facial paraphernalia (e.g., piercings, glasses, facial hair), which could have signalled a common identity. For instance, if an individual wore the same glasses in each image, participants would likely realise that the images belong to the same identity, which may in turn bias judgements. We cropped the images such that the face was centred with some of the background setting visible and then resized each image to 300 × 300 pixels (to view all images, see https://osf.io/g3euq/; other researchers are welcome to use these images [CC BY 4.0]). We minimised the risk of experimenter bias by asking the participants to select and provide the photos themselves with minimal direction from the experimenter.
Procedure
The rating task was conducted online using Qualtrics (Provo, UT). Following consent, participants provided basic demographic information: age (in years), gender, and ethnicity. Participants were presented with a single face image in the centre of the screen with a 9-point rating scale presented beneath the image, and participants were asked “How trustworthy/dominant/attractive [depending on condition] is this person?” They were encouraged to rely on their gut feelings and respond without thinking too deeply. Following Todorov and Porter (2014), participants rated each of the 340 images on a given trait, with ratings ranging from 1 (not at all) to 9 (very). After a short break, participants rated a subset of 5 identities (100 images, randomly presented) a second time to provide an indication of test–retest reliability; participants were not informed that they were rating previously seen images. Finally, participants were asked to indicate whether they were familiar with any of the identities and, if so, to provide a name and/or how they knew them. Participants took approximately 20 minutes to complete the experiment.
Measures
We computed variability scores to provide an indication of the spread of rating scores for different identities across each trait. 2 We calculated these scores separately for each participant and each trait. To create these scores, we calculated a mean score for each of the 17 identities by averaging the relevant ratings (i.e., trustworthiness, attractiveness, or dominance) across the 20 images. Then, we subtracted the rating scores of each image from the mean score of the corresponding identity. We used the absolute value of the variability scores to reflect the degree rather than direction of the difference. As such, each image had a score that reflects the degree that it differs from the mean rating of the identity for each participant. For example, if a participant gave a rating of 5 for an image and the participant’s mean score for the identity was 7, then the image would have a variability score of 2.
In other words, for each participant, we calculated the variability score for the ith image of the jth identity, which is the absolute value of each rating for that image and identity subtracted from the mean rating for that identity.
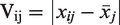
V = variability score
i = image
j = identity
Results
Analytic Approach
We primarily analysed the data using R (R Core Team, 2019; version 3.6.2). We computed descriptive statistics using the {psych} package (Revelle, 2018; version 1.9.12.31) and created plots with the {ggplot2} package (Wickham, 2016; version 3.3.0). We conducted generalised linear mixed effects models using the {lme4} package (Bates et al., 2015; version 1.1–21). The following results are presented in accordance with Meteyard and Davies’ (2020) proposed guidelines for linear mixed effects models.
We tested our hypotheses through two analyses. We used generalised linear mixed effects models to test the first hypothesis that trustworthiness judgements would vary more than dominance, which would vary more than attractiveness. That is, the mixed models investigated whether there were differences in variability of image ratings across the different traits and identities. We used mixed models to account for the nested structure of the data and to allow us to incorporate all participant responses rather than aggregating data, which can inflate false positives (see Debruine, 2019). This analysis is discussed in the Variability Across Trait Dimensions section.
To test the second hypothesis, at the request of a reviewer, we followed the approach of Todorov and Porter (2014) to assess whether within-identity variability would exceed between-identity variability. Specifically, we calculated the statistical variance in ratings within identities and between identities. We then compared the mean difference in variance scores with a t test. This analysis is presented in detail in the Within- Versus Between-Identity Differences section. Our original planned analyses are included in the supplemental materials (S3). 3
Reliability of Image Ratings
To assess test–retest reliability, we calculated Pearson correlations between each participant’s initial ratings of 100 images (5 identities) and their later ratings of the same images. Table 1 presents the Pearson’s r values (averaged across participants). 4 The test–retest correlations show adequate reliability for all three traits, with moderate, positive correlations across ratings (all ps < .001). See Appendix for the distribution of participants’ test–retest correlations for the three traits. The consistency of participants’ ratings within each trait condition lends confidence to the reliability of the image ratings.
Descriptive statistics for ratings and variability scores and test–retest correlations.
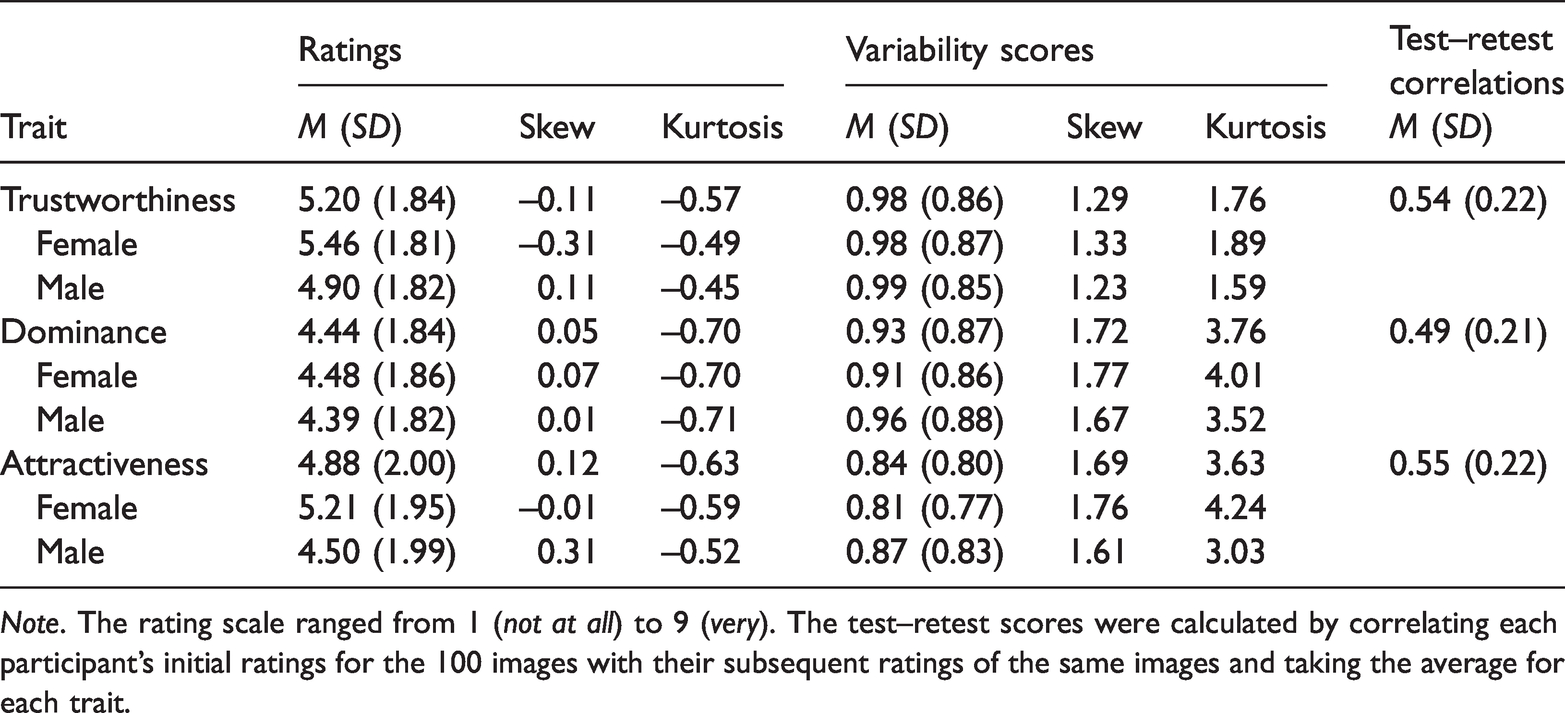
Note. The rating scale ranged from 1 (not at all) to 9 (very). The test–retest scores were calculated by correlating each participant’s initial ratings for the 100 images with their subsequent ratings of the same images and taking the average for each trait.
Variability Across Trait Dimensions
As shown in Table 1, the mean ratings for each trait were situated close to the middle of the rating scale, suggesting that there were no floor or ceiling effects. The mean variability scores for each trait were in the expected direction with trustworthiness varying more than dominance which in turn varied more than attractiveness. Overall, male faces varied more than female faces. There were minimal gender differences for trustworthiness, yet male faces varied noticeably more than female faces for dominance and attractiveness judgements.
Figure 1 presents the mean variability scores across the 17 identities for each of the three traits. Each identity is labelled with two letters; the first letter specifies the gender of the identity (M = male, F = female), and the second term denotes the specific identity (e.g., FA refers to female Identity 1, FB is female Identity 2, etc.). There are observable differences in variability between the identities and between the three traits. Although the majority of the identities vary most on trustworthiness, this is not true for some identities (ME and MF varied most on dominance; MB varied most on attractiveness).
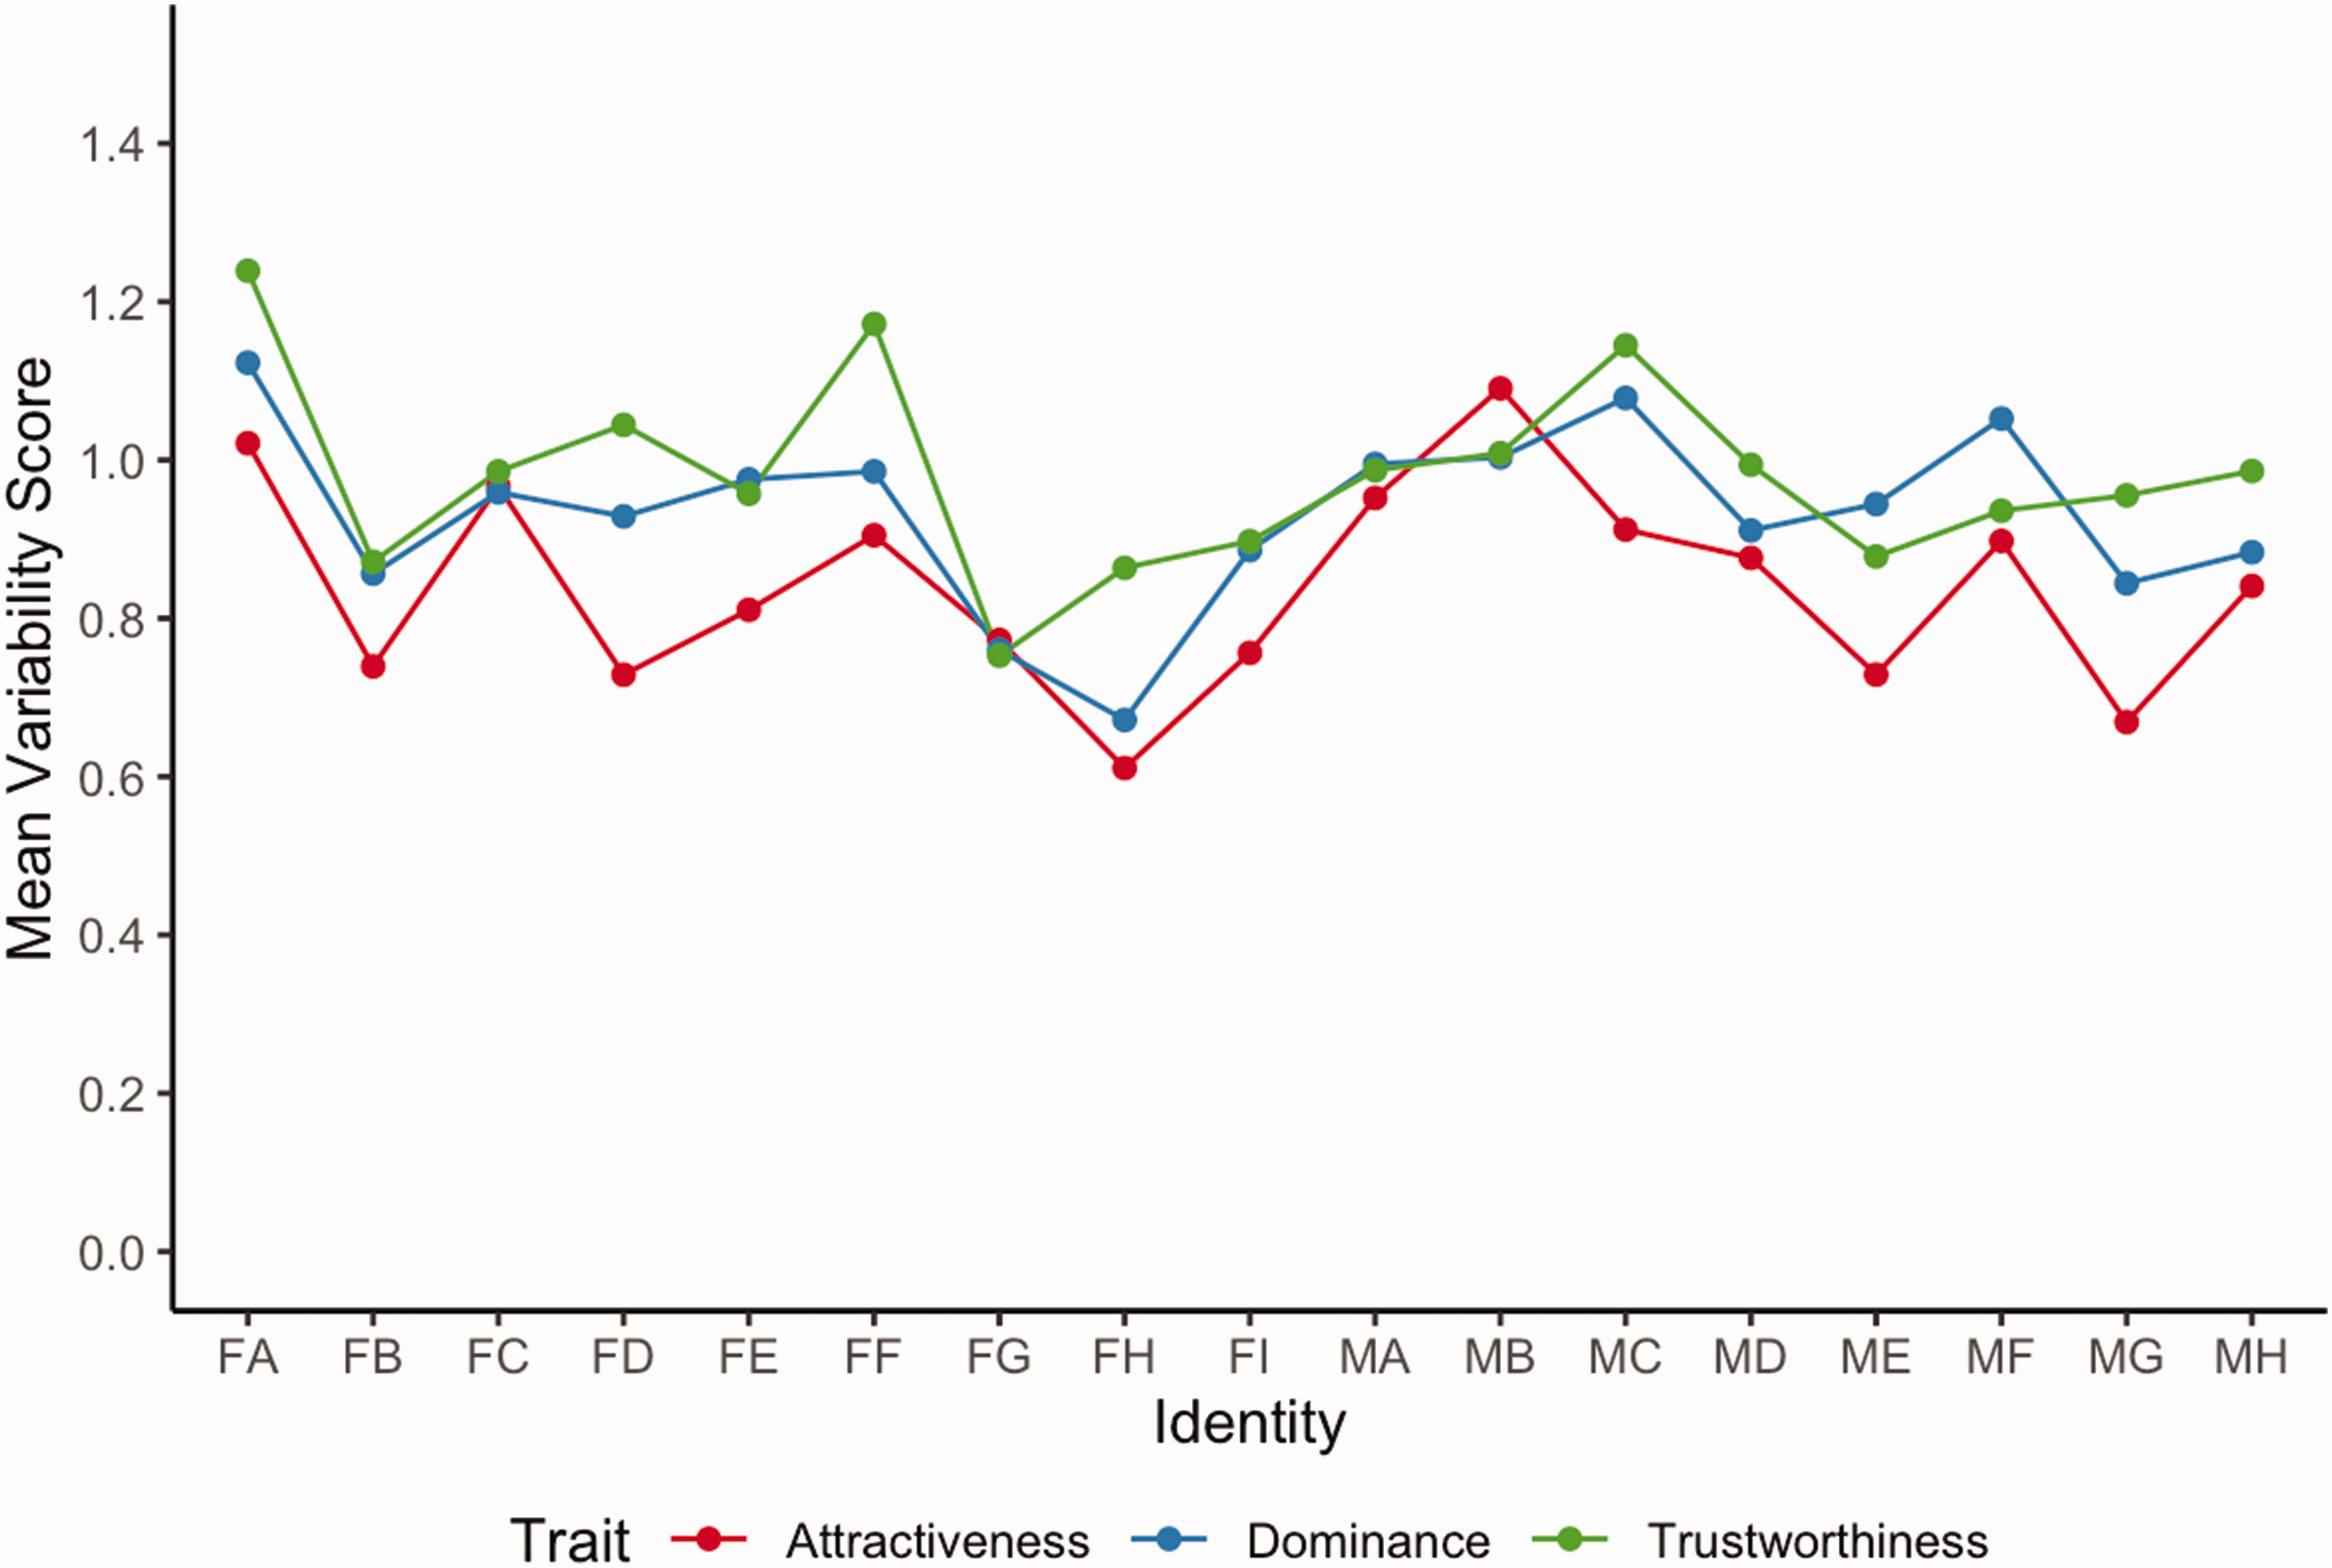
Mean variability scores across different identities as a function of trait type.Note. Please refer to the online version of the article to view the figure in colour.
The following analysis examined the first hypothesis, that trustworthiness judgements would vary more within different identities than dominance, which would in turn vary more than attractiveness. Specifically, we performed generalised linear mixed effects models to investigate the influence of the type of trait and the identity of the images on the variability of rating scores. Our data consist of two levels: participants and images at Level 1, and traits, target gender, and identities at Level 2. Participants were nested within traits as they were randomly allocated to rate all images on only one trait. In addition, images were nested within identities because each set of 20 images belonged to a single identity.
We entered the three traits (trustworthiness, dominance, and attractiveness); target gender (male or female); and the identities (1–17) into the analysis as fixed effects (independently and with the interaction terms), as they were thought to have a systematic effect on the data (Winter, 2013). Note that we entered identity as a fixed effect to test whether variation in trait judgements was the same for different identities (i.e., an interaction between trait condition and identity). This is important from a theoretical standpoint as Burton et al. (2016) demonstrated that faces vary idiosyncratically—the way in which one identity varies across images is not the same as another. As such, it is important to assess whether the relative variability of each trait depends on the identity of the images. For instance, one identity might vary substantially in perceived dominance across images, whereas another identity might vary most in terms of attractiveness.
As random effects, we entered participants and images with random intercepts. Participants were selected as a random effect to satisfy the independence assumption, and images were selected as a random effect to allow our findings to generalise beyond the stimuli used in this study (Judd et al., 2012). The dependent variable was the computed variability scores.
Model Equations
Following Meteyard and Davies’s (2020) recommendations, the equations for each of the models are written in R as follows.
For each model, the dependent variable is shown on the left-hand side of each equation (before the tilde). The terms that follow the tilde presented without parentheses are the fixed effects. The terms within the parentheses are the random effect terms added to each model. Random intercepts were specified for both participants and image in all of the models. M1 was the null model that included only the random effects. M2 builds on M1 by incorporating the gender of the faces into the model. M3 included only trait type as a main effect, M4 contained trait and face gender as main effects, and M5 included the interaction of trait and face gender. M6 included identity as a main effect; M7 was built on this by including both identity and trait as main effects. The final model (M8) added the two-way interaction of trait and identity. We did not include face gender in the last three models because the identities were nested within each gender; as such, it would not make conceptual sense to create models that include both face gender and identity.
We used generalised linear mixed effects models instead of linear mixed effects models to address the non-normal distribution of the variability scores (Lo & Andrews, 2015). As the variability scores were positively skewed continuous data, the models were fit with a gamma distribution with an inverse link function (Ng & Cribbie, 2017). We added a value of 1 to each variability score value to overcome the non-positive data (i.e., the data set included some variability scores of zero); however, throughout the article, we report the actual variability scores. We found no outliers, both random effects were normally distributed, and the data were linear. However, there was some evidence of heteroscedasticity.
We performed a likelihood ratio test using analysis of variance to assess how well each model fit the data compared to the null model. That is, each of the eight models were compared to the null model one at a time; models that significantly differed (i.e., p < .05) and demonstrated a lower Akaike information criterion (AIC) value than the null was considered a better fit to the data. We used AIC values instead of Bayesian information criterion because the latter criterion heavily penalises complex models (Wagenmakers & Farrell, 2004).
Table 2 shows the fit statistics for each of the models. The face gender model (M2) demonstrated a significantly better fit to the data than the null model (M1) and suggested that male faces (M = 0.94, SD = 0.85) tended to vary more than female faces (M = 0.90, SD = 0.84) overall. However, the trait model (M3) did not show a better fit to the data compared to the null model. The models that included trait and face gender as main effects (M4) and as an interaction (M5) fit the data significantly better than the null model, suggesting that variability differences between each gender depended on the trait. Specifically, there were minimal differences in variability between male and female faces for trustworthiness, yet males tended to vary more than females for dominance and attractiveness judgements. The model that accounted for identity (M5) demonstrated a significantly better fit and lower AIC value than the null model, suggesting that there were overall differences in variability across the identities. Finally, the models that included trait and identity as main effects (M7) and as an interaction (M8) also showed a significantly better fit to the data than the null. The final model (M8) demonstrated the best fit to the data overall, as indicated by the lowest AIC value and largest χ2 value. This suggests that the relative differences in variability across identities differed as a function of trait type. For instance, some identities varied substantially in trustworthiness ratings but showed little variation in attractiveness, or vice versa. The random effects of participants (variance < 0.01, SD = 0.05) and image number (variance < 0.01, SD = 0.01) for the final model accounted for only negligible variation in variability scores. We do not discuss the intercepts for the levels of the fixed effects in the final model because there are too many levels (51 in total) to be meaningfully interpreted (for further information, see Table S4 in supplemental material).
Model specifications and fit statistics for the generalised linear mixed effects models.
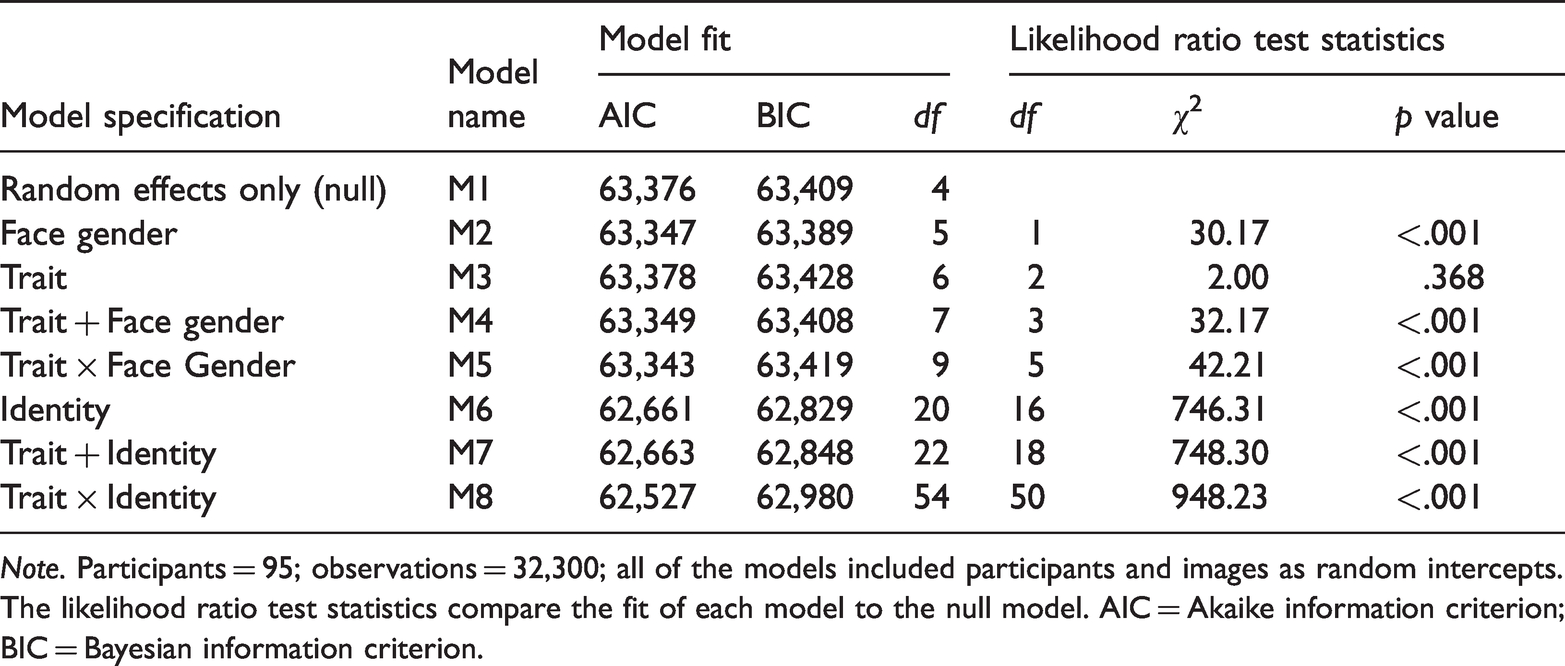
Note. Participants = 95; observations = 32,300; all of the models included participants and images as random intercepts. The likelihood ratio test statistics compare the fit of each model to the null model. AIC = Akaike information criterion; BIC = Bayesian information criterion.
Within- Versus Between-Identity Differences
Figure 2 displays the average rating for each image (the coloured dots) for each identity. The mean rating (black dots) for each identity is rank ordered from lowest to highest, separately for each trait. Despite the variability within identities, there are still noticeable differences between identities. The following analyses tested the second hypothesis, that within-person variability in trait judgements would exceed differences between identities.
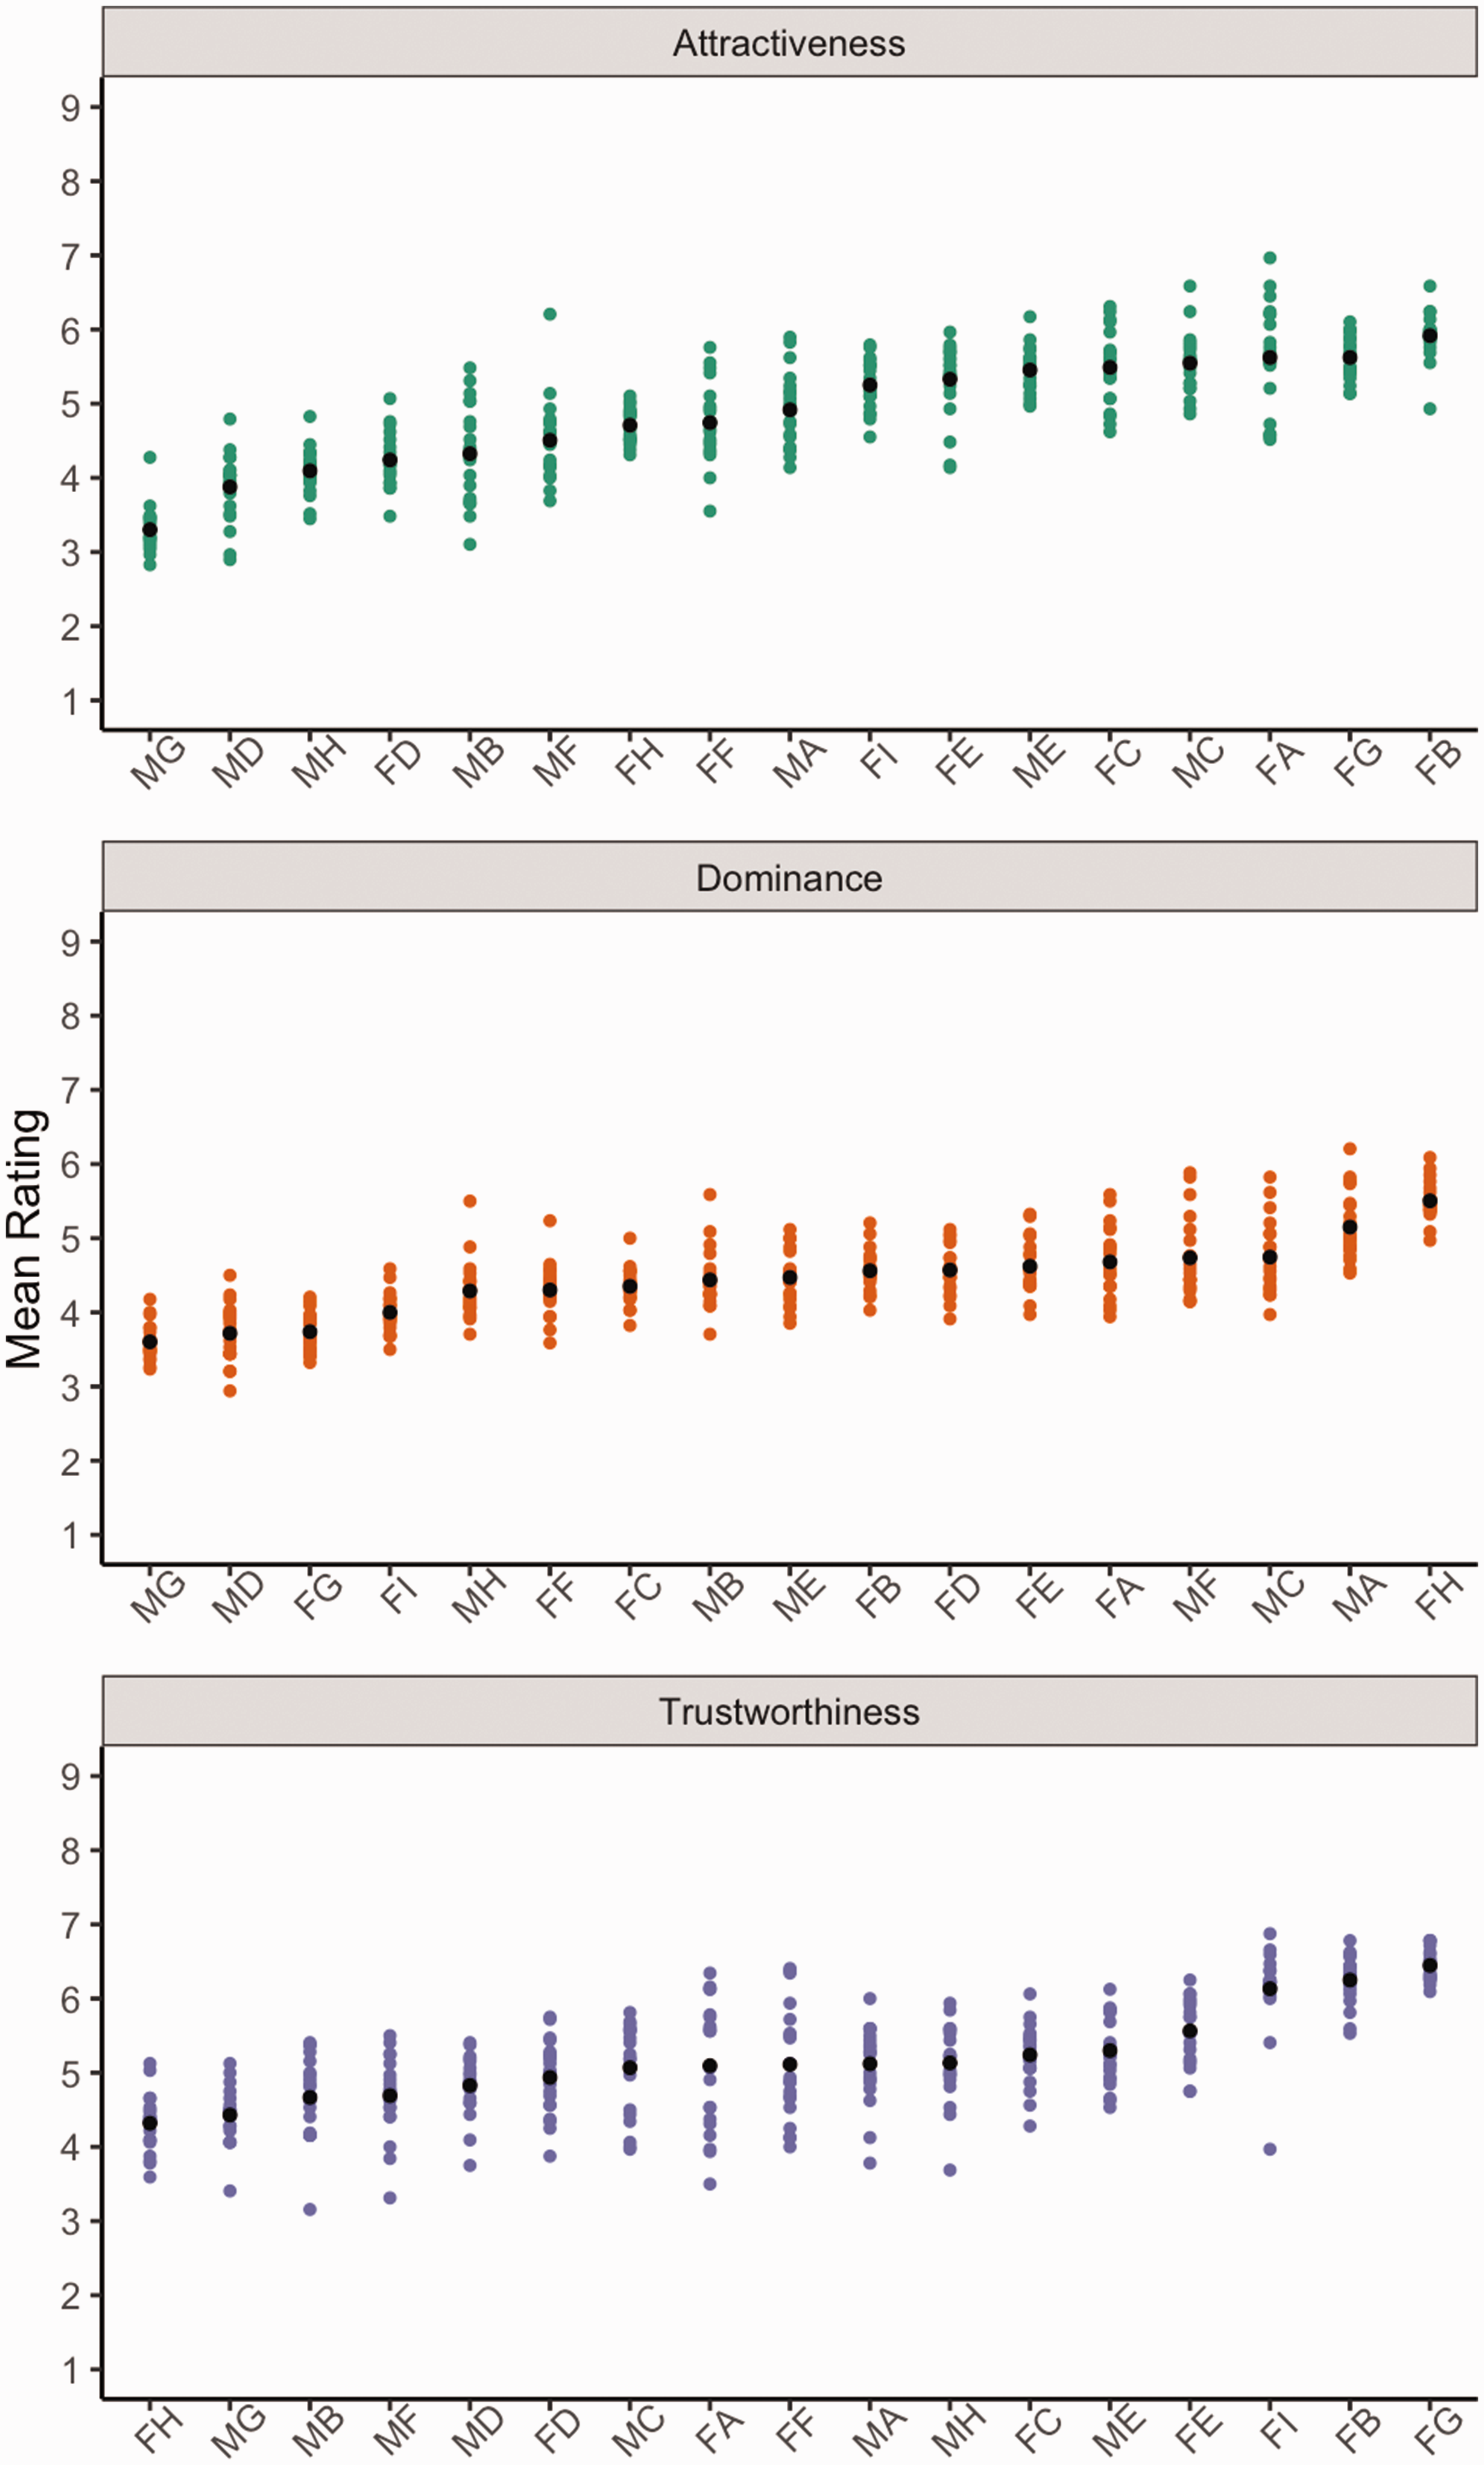
Mean rating scores within each identity for trustworthiness, dominance, and attractiveness. Identities are rank ordered from lowest to highest within each trait using the mean scores of each identity.Note. Please refer to the online version of the article to view the figure in colour.
Following the approach of Todorov and Porter (2014), we compared statistical variance in trait judgements within and between identities. Specifically, we aggregated participants’ original rating responses so that each image had a mean rating for each trait. We then calculated within-identity and between-identity variance for each social trait. Within-identity variance was the mean squared deviations of each image from the mean of each identity. Between-identity variance was the average squared difference between the grand mean of all identities and the mean rating of each identity.
Table 3 shows the mean variance of ratings of the same identity and variance of judgements between different identities across each trait and gender. As seen in Table 3, between-identity variance exceeded within-identity variance in every instance with the exception of trustworthiness judgements for male faces. Attractiveness demonstrated more between-identity variance than trustworthiness or dominance, which were comparable. Trustworthiness judgements showed the most within-identity variance, followed by attractiveness and then dominance.
Mean variance scores within and between identities as a function of trait and gender.

Note. Variance scores were calculated separately for male and female faces (as the mean values used in the variance calculations differ for each gender). We averaged the male and female scores to obtain the total variance. Only the “total variance” cells contained standard deviations, as only single averaged scores were calculated at the specific trait and gender level.
Overall, we found that between-identity variance (M = 0.33, SD = 0.18) was greater on average than within-identity variance (M = 0.21, SD = 0.07). Although this difference represents a moderately large effect size, it was not statistically significant—t(4) = 1.63, p = .178, d = .76, 95% confidence interval (CI) [–.09, .32]. The non-significant difference may be attributable to the lack of statistical power; we assessed only three traits, whereas Todorov and Porter (2014) tested eight traits. Our results contrast Todorov and Porter’s findings that within-identity variance (M = 0.57, SD = 0.35) was significantly higher than between-identity variance (M = 0.35, SD = 0.12).
Discussion
The aim of this study was to explore the extent to which judgements of different images of the same person vary across different social traits and to assess whether some traits are more sensitive to image variability than others.
Variability in Ratings Across the Traits
We found partial support for our hypothesis that trustworthiness would display greater variability in ratings than dominance, which would vary more than attractiveness. Although the overall differences in mean variability scores were in the expected directions, the trait model alone did not provide a significant fit to the data. However, the model containing the interaction between type of trait and identity of the images provided the best fit to the data. This indicates that image variability affected trait judgements differently depending on the identity. For most identities (14 out of 17), images varied more in trustworthiness than dominance, but for some (ME and MF), images varied more in dominance than in trustworthiness. Notably, only one identity (MB) varied more in attractiveness than either dominance or trustworthiness. Thus, the overall pattern suggests that image variability affects judgements of trustworthiness most and attractiveness least, though this depends to some degree on the unique way in which images of a particular identity vary.
In accordance with previous research (e.g., Sutherland et al., 2014), the gender of the target identities played an important role in trait judgements. Specifically, impressions tended to vary more across images of male than female faces. There were minimal gender differences in variability of trustworthiness judgements, yet male faces varied more than females for both dominance and attractiveness judgements.
Our results are largely concordant with the patterns shown in previous research (e.g., Sutherland et al., 2017; Todorov & Porter, 2014), which also found more variability in trustworthiness judgements than dominance and attractiveness judgements. However, the previous studies tended to find more pronounced differences in overall variability across different traits than we did. One possible explanation for why we found less pronounced differences in variability between the three traits might be due to the unintentional consistency of emotional expressions in our database. Although the images were largely unconstrained, the majority of the faces that participants provided were smiling (likely due to the social convention of smiling when having a photo taken). Specifically, of the 340 images, 72% of the faces were smiling, and 62% of the images had an open mouth smile. Smiling is well known to signal trustworthiness (Sutherland et al., 2013; Vernon et al., 2014); the fact that most of the faces were smiling would have predominantly constrained the variation in trustworthiness ratings rather than dominance or attractiveness. Another possible explanation is that the large between-identity differences found in the current study might have overshadowed the effects of trait type. Other studies, such as Todorov and Porter (2014), found minimal differences in variability between identities (aside from attractiveness judgements), which might have amplified differences between traits.
Within- Versus Between-Person Variability
We did not find support for our second hypothesis that variability in trait scores would be greater within identities compared to between identities. All three traits demonstrated substantial variability across identities, with a comparatively narrow spread of ratings within identities. Attractiveness displayed greater between-person variation than both dominance and trustworthiness; between-identity variation for trustworthiness and dominance were comparable. Our findings that trustworthiness and dominance varied more between than within identities were inconsistent with Todorov and Porter (2014) and Sutherland et al. (2017), yet our data for dominance aligned with Vernon et al. (2014). Similar to Todorov and Porter, our Figure 2 suggested that within-person ratings of trustworthiness varied such that the rankings of any pair of identities could be reversed depending on the images selected; despite this, we still found meaningful differences between identities. Our finding that attractiveness varied considerably between identities was consistent with Todorov and Porter, but incongruent with Jenkins et al. (2011). The findings from the current study are particularly surprising given that we used unconstrained ambient images.
A potential explanation for the inconsistencies with previous literature might be due to the nature of the stimuli and design used. As discussed in the Introduction section, Sutherland et al. (2017) used stimuli that systematically varied on expression and viewpoint. The conflict between our findings and Todorov and Porter’s (2014) is likely attributable to differences in study design. Todorov and Porter had each participant rate only one image of each identity on a single trait in order to avoid carryover effects. This between-subjects approach likely inflated within-identity variability because the differences in mean judgements across images of an identity would not only account for differences in the identity’s appearance but also differences in participants’ preferences. However, it is unclear why our findings differed to Jenkins et al. (2011) as they used naturalistic images and a within-subjects design similar to ours.
Within-participant consistency in trait judgements is an important source of variance that has largely been ignored in the literature. A lack of consistency in judgements of the same faces made by the same participant would make it difficult to draw strong conclusions about the extent to which traits vary. We correlated participants’ initial ratings of 100 images and subsequent ratings of the same images and found good consistency in participant judgements. However, our test–retest correlations were weaker than those of other recent studies (e.g., Kramer et al., 2018; Sutherland et al., 2020); it is not clear why this was the case. Researchers should strive to include test–retest reliability measures in their studies to shed light on factors that influence within-participant consistency in trait judgements.
Given our findings, we cannot, at this stage, support the claim that trait judgements of dominance, trustworthiness, and attractiveness vary more within than between identities. As variability in trait judgements is contingent on numerous factors (e.g., the specific images used, observer preferences, characteristics of the identity) and the interactions between these factors, it is difficult to say in general whether trait impressions vary more within identities than between them. However, it is clear from our study that the identity of the images might be more important than previous research suggested. That is, there were still meaningful differences in perceptions between identities after accounting for within-identity differences.
Limitations
Some potential limitations of the current study should be noted. First, as discussed earlier, although the images were unconstrained and free to vary along many dimensions, most faces in our database displayed a happy expression. To avoid experimenter bias, we allowed the volunteers to select their own images. However, given that the volunteers were aware that the images would be explicitly judged by others, they may have selected images that they thought cast themselves in a favourable light and omitted photos that did not. Smiling or displaying positive emotional expressions strongly relates to many social inferences, particularly trustworthiness and, to a lesser extent, attractiveness (Vernon et al., 2014). Minimal variation in emotional expression would constrain variability of trait ratings to the extent that the specific trait is derived from these expressions (i.e., trustworthiness would be affected more by smiling than dominance). The common approach of selecting the top responses from a Google Image search (e.g., Jenkins et al., 2011) is not practical for non-celebrity faces. A Google Image search of someone who is not a celebrity will rarely yield 20 valid images. Arguably, any image selection procedure would invite biases; as such, using an alternate image selection approach would simply be trading one set of biases for another. Nonetheless, the images in our database reflect numerous sources of variance that are not included in many other studies.
Second, there might have been systematic differences across the identities in terms of general image properties. For instance, images from some identities consisted of generally high-quality photos, whereas others tended to be of lower quality. Similarly, the background context of the images also tended to be consistent for images of the same person. For example, some people provided selfies that they took in their bedroom, whereas others provided photos taken at parties or outdoors. Consistencies in photo properties within an individual’s image set may have constrained variation across images of the same person and accentuated differences between identities.
Finally, although our images varied substantially along many dimensions, all individuals in the database were in their early- to mid-20s (approximately). This is a limitation of our database because age is a relevant cue for social perception, particularly for attractiveness (Sutherland et al., 2013). Nonetheless, incorporating more age variability would have likely exacerbated between-identity variability and in turn strengthened our conclusions.
Implications
Limitations notwithstanding, this study has some key implications. First, the findings of this experiment shed light on the extent to which each trait is tied to identity. Facial recognition researchers generally agree that faces are recognised across different exemplars through orienting perceptions towards stable facial cues (e.g., eyes) instead of transient cues (e.g., mouth; Haxby et al., 2000; Robins et al., 2018). It can be reasoned that traits that displayed less variability across images of an identity would be more dependent on stable cues than traits that varied more extensively. As attractiveness displayed substantial variability between identities relative to within identities, the facial cues used to form these impressions might overlap with cues denoting identity. Therefore, if some traits are predominately derived from stable cues (e.g., attractiveness), and if stable cues are used to recognise an identity, then trait impressions might share common underlying processes with facial recognition. Researchers may wish to extend upon Sutherland et al.’s (2020) work by investigating the relationship between trait judgements and recognition performance across multiple images of the same face. Future research should also explore how trustworthiness, dominance, and attractiveness relate to processes underlying facial recognition.
A second implication has to do with the question of whether images of a given individual vary more than images of different individuals in terms of trait judgements. Clearly, the amount of variance in trait judgements depends both on the degree of variance in the chosen images, as well as the degree to which different identities vary. Indeed, it would be possible to select identities and images so as to minimise within-person variability and maximise between-person variability or vice versa. If there is any utility in this question, it is about how images and identities tend to vary. We tried to capture some of this natural variability, and we found meaningful differences between identities despite variation within them. Therefore, while trait impressions based on single images are likely to be unreliable, both in terms of reflecting stable impressions of the person and in terms of any potential accuracy of those impressions, they are perhaps not completely random.
Relatedly, the discrepancy in findings between the current study and others may be due to fundamental differences between celebrities and non-celebrities. Contrary to our expectations and past research, we found that trait judgements varied more between different people than across photos of the same person. One point of difference between the current study and most previous studies is the use of celebrity images (e.g., Jenkins et al., 2011). As discussed earlier in this article, celebrities generally wear expensive clothes, have professional makeup, attend exclusive events, and have their photos taken by professional photographers. As such, we can reason that photos of celebrities might be more diverse and vary more extensively than images of the general public. An important question for future studies is to determine whether images of celebrities differ to non-celebrities in terms of the extent to which judgements vary between and within individuals. Future research should compare judgements of celebrities and non-celebrities to shed further light on this issue.
Conclusion
In conclusion, we developed a large database of 340 ambient images rated on trait dimensions of trustworthiness, dominance, and attractiveness and explored within- and between-person variability across traits. There was some evidence that perceptions of trustworthiness varied more than dominance, which varied more than attractiveness. However, the relative variability between different traits depended on the specific identity in question. Contrary to expectations, there was greater variation in judgements between different identities compared to within images of the same identity. This study demonstrated that even when using unconstrained naturalistic stimuli, there are still meaningful differences in impressions between identities despite variability within identities.
Supplemental Material
sj-pdf-1-pec-10.1177_03010066211019727 - Supplemental material for Within-Person Variability in First Impressions From Faces
Supplemental material, sj-pdf-1-pec-10.1177_03010066211019727 for Within-Person Variability in First Impressions From Faces by Taylor Gogan Jennifer Beaudry Julian Oldmeadow in Perception
Footnotes
Author Contributions
T. G.: conceptualisation, data curation, formal analysis, investigation, methodology, project admin, resources, visualisation, and writing—original draft; J. B.: conceptualisation, methodology, supervising, validation, and writing—review and editing; J. O.: conceptualisation, methodology, supervising, and writing—review and editing.
Data Availability Statement

Declaration of Conflicting Interests
The author(s) declared no potential conflicts of interest with respect to the research, authorship, and/or publication of this article.
Funding
The author(s) disclosed receipt of the following financial support for the research, authorship, and/or publication of this article: This research was supported by an Australian Government Research Training Program Scholarship to the first author.
Supplemental Material
Notes
References
Supplementary Material
Please find the following supplemental material available below.
For Open Access articles published under a Creative Commons License, all supplemental material carries the same license as the article it is associated with.
For non-Open Access articles published, all supplemental material carries a non-exclusive license, and permission requests for re-use of supplemental material or any part of supplemental material shall be sent directly to the copyright owner as specified in the copyright notice associated with the article.
