
Abstract
The study of lithic technology can provide information on human cultural evolution. This article aims to analyse visual behaviour associated with the exploration of ancient stone artefacts and how this relates to perceptual mechanisms in humans. In Experiment 1, we used eye tracking to record patterns of eye fixations while participants viewed images of stone tools, including examples of worked pebbles and handaxes. The results showed that the focus of gaze was directed more towards the upper regions of worked pebbles and on the basal areas for handaxes. Knapped surfaces also attracted more fixation than natural cortex for both tool types. Fixation distribution was different to that predicted by models that calculate visual salience. Experiment 2 was an online study using a mouse-click attention tracking technique and included images of unworked pebbles and ‘mixed’ images combining the handaxe's outline with the pebble's unworked texture. The pattern of clicks corresponded to that revealed using eye tracking and there were differences between tools and other images. Overall, the findings suggest that visual exploration is directed towards functional aspects of tools. Studies of visual attention and exploration can supply useful information to inform understanding of human cognitive evolution and tool use.
Introduction
Stone tools are one of the main sources of information about early humans’ behaviour (Nowell & Davidson, 2010). The technological development of tools has traditionally been interpreted as reflecting the evolution of the human cognitive system. For example, recent work has examined the production process involved in manufacturing different stone tool technologies (Muller et al., 2017). The findings showed a pattern of increasing complexity through time, implying a concomitant increase in cognitive capacities of the individuals who originally produced and used the tools. Therefore, a co-evolution between tools and cognitive mechanisms is expected, including changes in attention processes.
Vision constitutes the dominant source of sensory information in humans (Atkinson, 2008; Kassuba et al., 2013; Stone & Gonzalez, 2014) and the primary input channel to the brain influencing our interaction with objects including tools (Brouwer et al., 2009; Findlay & Gilchrist, 2003). Vision itself is an active process involving coordination of fast, exploratory eye movements called saccades, which ensure the central fovea of the retina is focussed on objects and regions of interest (Findlay & Gilchrist, 2003; Kowler, 2011). Fixations and saccades can also be seen as a proxy for visual attention (Carrasco, 2011; Kowler, 2011), by providing information about what is being fixated. However, fixation patterns only index overt attention when the eyes move to some point in space and information can also be extracted from peripheral vision via covert attention (Rosenholtz, 2016; Wolfe & Whitney, 2015). Hereafter the term attention will be used to refer to overt attention, defined as the act of selectively attending to an object or location over others by moving the eyes to point in that direction (Posner, 1980).
A number of factors can influence how attention and fixation are directed towards visual objects. Attention may be influenced by ‘bottom-up’ factors such as the visual features of an image which clearly stand out from the visual background due to their sensory properties (e.g. local discontinuities in colour, brightness, texture, or orientation of the visual elements). A highly influential perspective in recent years has been the development of computational models of visual salience which can quantify the extent to which parts of an image are conspicuous and the distribution of gaze within an image has been shown to be closely correlated with salience ‘maps’ generated by these models (Itti & Koch, 2001). However, attention can also be directed towards objects dependent upon ‘top down’ factors such as the importance of an object or feature to current task goals (Connor & Egeth, 2004). Eye movements also appear to be very important in the forward planning of action sequences in cognitively demanding tasks (Hodgson et al., 2019; Land, 2006).
Contemporary cognitive neuroscience has provided important insights into tool use and brain activity. Brain imaging studies have demonstrated that viewing tools activate regions involved in action execution even during passive viewing when there is no task instruction (e.g. Ambrosini & Costantini, 2016; Johnson-Frey, 2004; Makris et al., 2011; Natraj et al., 2015; Tipper et al., 2006) and viewing objects leads to automatic activation of motor programmes in the brain (Craighero et al., 1997; van der Linden et al., 2015). It is possible therefore that the intentions associated with an object might also influence the pattern of visual scanning in addition to its purely sensory properties. Such behavioural affordances (Ambrosini & Costantini, 2016; Gibson, 1979) may be considered as the behavioural possibilities of an object (Turvey & Carello, 2011), or the properties of an object that indicate how to interact with it (Borghi, 2007; for a review see Osiurak et al., 2017). This is also consistent with the properties of mirror neurons in the parietal and premotor cortex, which respond directly to the observation, planning and execution of actions (Thill et al., 2013). In the case of tools, such affordances might be expected to automatically drive the eyes and visuospatial attention towards the parts of the tool most relevant to its action, such as the most comfortable grip position or the striking surface of the tool (Myachykov et al., 2013; Roberts & Humphreys, 2011).
From an archaeological perspective, eye tracking has recently been applied to understand the cognitive representation of prehistoric pottery (Criado-Boado et al., 2019). Interestingly, variations in eye scanning patterns do not appear to relate to the saliency or overall physical characteristics of pottery (Criado-Boado et al., 2019). Regarding stone tools, we have also examined how Oldowan and Acheulean technologies differently influence haptic responses in the absence of vision (Bruner et al., 2018; Fedato et al., 2020a, 2020b; Silva-Gago et al., 2021).
In the current study, we aim to test whether and to what extent stone tools influence the pattern of visual exploration. We used eye tracking to monitor how people direct gaze and attention when viewing images of replicas of early stone tools. The main objective is to explore whether differences in eye movement patterns to stone tools could be related to cognitive processes and action affordances. To disentangle the influence of visual characteristics of the tool images from cognitive and functional influences, we applied a computational algorithm to determine which regions in each image were most visually salient and therefore might attract attention and eye movements irrespective of the functional significance of the feature (Itti & Koch, 2001). The physical dimensions and shape of the tools were also quantified so they could be related to eye tracking measures. As an additional control, we also compared two distinct types of Palaeolithic tools. Half the images were of handaxes characteristic of Acheulean technology, whilst the other set were of the more primitive worked pebble type, characteristic of the earlier Oldowan technology. These two types are assumed to differ in terms of their cognitive complexity (Toth & Schick, 2018; Wynn & Gowlett, 2018). We hypothesized that (i) attention would not just be directed to the salient visual features of the tool images and (ii) patterns of exploration would be influenced by functionally relevant features and cognitive complexity of the tools, indicating that object-action affordance and tool complexity influence patterns of visual attention.
Experiment 1 (Eye Tracking)
Material and Methods
Participants
An opportunistic sample of 21 participants (13 females and 8 males) recruited from a psychology department took part in the experiment. All subjects had a normal or corrected-to-normal vision, they were right-handed and aged between 22 and 71 years old (39 ± 15 years). The participants were naïve with respect to expert knowledge of archaeology and stone tools to limit any functional reasoning and to ensure that expert knowledge about tool-making did not bias spontaneous visual exploration of the tools. Participants were instructed to ‘freely visually explore some pictures of replica ancient stone tools’ and all participants viewed the same set of images. All gave informed consent for their participation in the study, which was approved by the ethics committee of the University of Lincoln.
Stone Tools
We examined visual exploration of images of 20 experimental stone tools (10 worked pebbles and 10 handaxes). Worked pebbles belong to Mode 1 or Oldowan technology (Clark, 1969). This technology is dated about 2.6 million years ago (Braun, 2012; Semaw et al., 2003; Stout et al., 2010) and includes worked or shaped pebbles, chopper-cores, and flake, namely pebbles with flakes to create an edge. Oldowan tool-making requires visuomotor coordination and evaluation of the morphology of the core, as well as a selection of the physical–mechanical qualities of raw materials and control of the reduction strategies (Stout et al., 2015). Although worked pebbles have iconically represented the earliest stone tools for one century, there is no agreement concerning whether or not they can be considered real tools, or else secondary by-product of stone knapping. Nonetheless, some studies have shown use-wear evidence on these pebbles and, at present, they can be interpreted as both cores to produce flakes or pebble tools (Peretto et al., 1998). Handaxes represent one of the most characteristic tool types of Mode 2 or Acheulean technology, and their earliest record dates to around 1.7 million years ago (Diez-Martín et al., 2015; Lepre et al., 2011). These stone tools are large, flat, and symmetrical, and they are prepared with a more qualified selection of raw materials (Wynn, 2002). In contrast to worked pebbles, handaxe tool-making is associated with stronger activation of the prefrontal cortex and requires a more complex understanding of the fracture of the stone, involving planning and greater perceptive-motor coordination (Stout et al., 2015) as well as working memory load and auditory feedbacks (Putt et al., 2017).
Two right-handed expert knappers were asked to prepare a standard sample of worked pebbles and handaxes, with no previous information on the future target of the study (Figure 1a and b). The tools used in this study were knapped from quartzite from the Arlanzón River's middle-lower terraces (Burgos, Spain). The natural pebbles selected were large and irregular with an average length of 20 cm (Figure 1c). Worked pebbles had been knapped on between a quarter and a half of the perimeter, and approximately a third of the surface. Both morphotypes were selected because they represent two of the most iconic examples of Lower Paleolithic technologies, covering from 2.5 million to 200,000 years old.
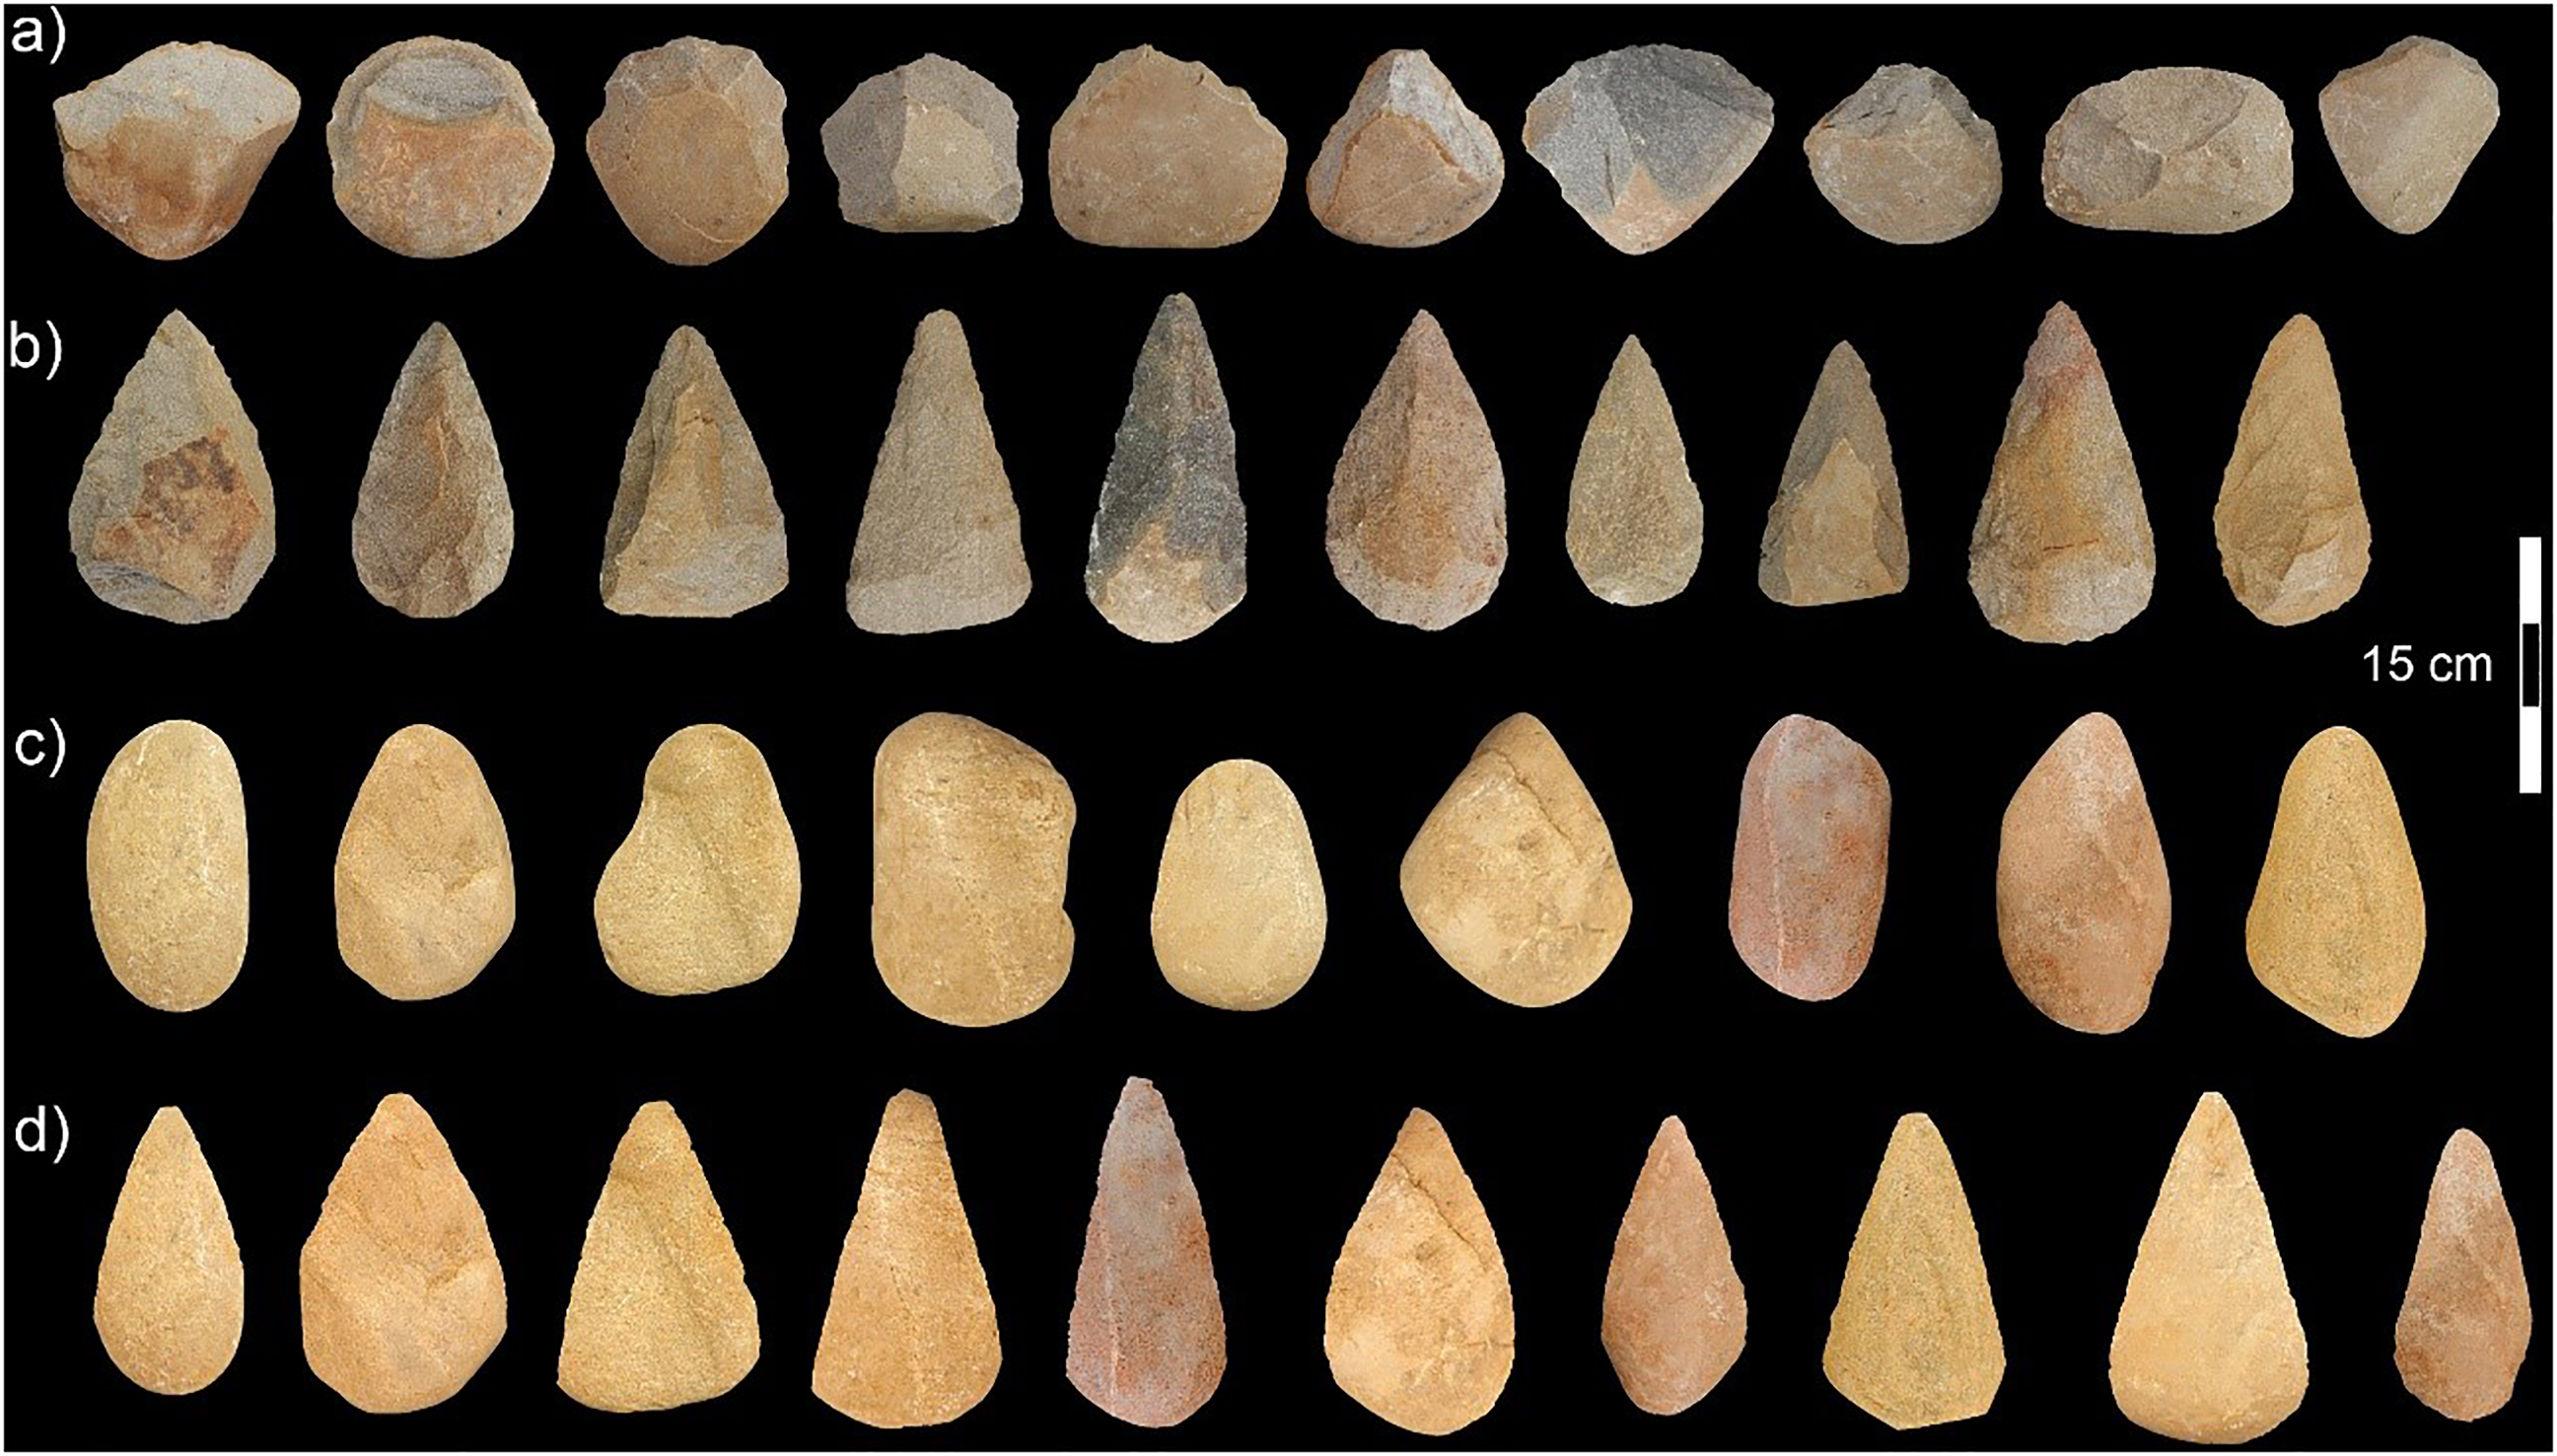
Sample used in the two experiments. (A) Worked pebbles, (b) handaxes, (c) natural pebbles, and (d) mixed images.
Stone tools were measured to quantify their general morphology (Table SI1). Measurements included the main diameters such as maximum length (ML), maximum width (MW), and maximum thickness (MTh), as measured by traditional calliper. Width and thickness were also measured at fixed fractions of the total length (25%, 50%, and 75%). These variables were also combined into ratios such as elongation (L/W), refinement (W/Th), tip-based (W25/W75), width-to-length (W/L) and thickness-to-length (Th/L) (Beyene et al., 2013; Bordes, 1961; García-Medrano et al., 2019; Grosman et al., 2008; Roe, 1968). As a general size index, tool module was computed averaging ML, width and thickness. We also measured the percentage of cortex on both sides and the knapped perimeter. Finally, we calculated the degree of tool asymmetry by using the F
Saliency Map Computation
Saliency maps were generated for each digitized tool image using the graph-based visual saliency (GBVS) computation algorithm using Matlab software (Harel et al., 2007: http://www.vision.caltech.edu/∼harel/share/gbvs.php). Put simply, the algorithm deconstructed the original image into different visual feature channels (colour, brightness, angle/orientation and so on), which operated in parallel over the entire visual scene and then calculated contrast values at each position in the image extracted for each of the feature channels. The individual feature maps were then combined into a unique saliency map, which could be viewed as a ‘heat map’ and overlaid over the original image to identify which areas had maximal salience based upon image properties.
Procedure
Twenty stone tool photographs were shown on a computer screen for 10 s each. Participants were asked to see the images through free visual exploration while resting their heads on a chinrest in front of the monitor. The screen viewing distance was 67 cm and the screen had a horizontal diameter of 52 cm, which equates to a total viewing angle of 42°. The stone tool images when displayed on the screen subtended between 12° and 16° degrees horizontally and vertically. Eye movements were recorded with a desk-mounted eye tracker (Eyelink 1000, SR Research, Canada) sampling participants’ pupil position at 1000 Hz (0.25°–0.5° average accuracy, 0.01° root mean square resolution – Figure 1). Stimulus presentation in both set-ups was controlled by a PC using the same software (Experiment Builder, SR Research). Eye position was calibrated by the fixation of nine predefined dots, sequentially presented on the monitor. After the participants performed half of the total amount of trials, they could rest and the calibration was repeated. The calibration was also repeated when a participant left the chin rest for any reason. Each trial started with a drift correction to ensure that calibration was valid. The drift correction fixation point was shown on the middle left of the screen, to ensure that participants fixated outside the stone tool before stimulus onset, avoiding fixations on the centre of the image before trial onset. All stone tool pictures were shown in the centre of the screen, taking the same place as well as the same size.
Data Analyses
Different areas of interest (AOIs) based on the main tool regions were defined, namely the upper, the middle region and the base, as well as the cortex and knapped surface. We computed the median duration of the fixation for different AOIs, as an indirect measure of the amount of visuospatial attention allocated by participants to distinct characteristics of the visual scene (Federico & Brandimonte, 2019). We measured the time of fixations for each stone tool (dwell time [DT], measured in milliseconds), as well as the number of fixations per tool (fixation count [FC]).
Fixation maps were generated by Eye Link Data Viewer, to summarize fixations across the stone tool. For visualization purposes, average saliency maps and fixation maps were generated by superimposing the tools according to 30 equally spaced landmarks along with the tool profile and a Procrustes registration, by using tpsDig 2.22 (Rohlf, 2009) and tpsSuper 2.05 (Rohlf, 2009). Non-parametric tests were employed, taking into account that variables were not normally distributed. Mann–Whitney test, Kruskal–Wallis test and Pearson's correlation were used to test stone tool differences and correlations. Results were considered significant at p < .05 for Mann–Whitney and Kruskal–Wallis tests and at p < .01 for correlations. Statistics were computed using R 3.5.1.
Results
Figure 2 shows the distribution for the two visual variables. DT and FC were more variable for handaxes than for worked pebbles and handaxes display lower figures for both variables (DT: U = 15, df = 1, p < .05; FC: U = 5, df = 1, p < .05). Namely, handaxes were associated with a more variable fixation time and triggered less visual exploration, when compared with worked pebbles.
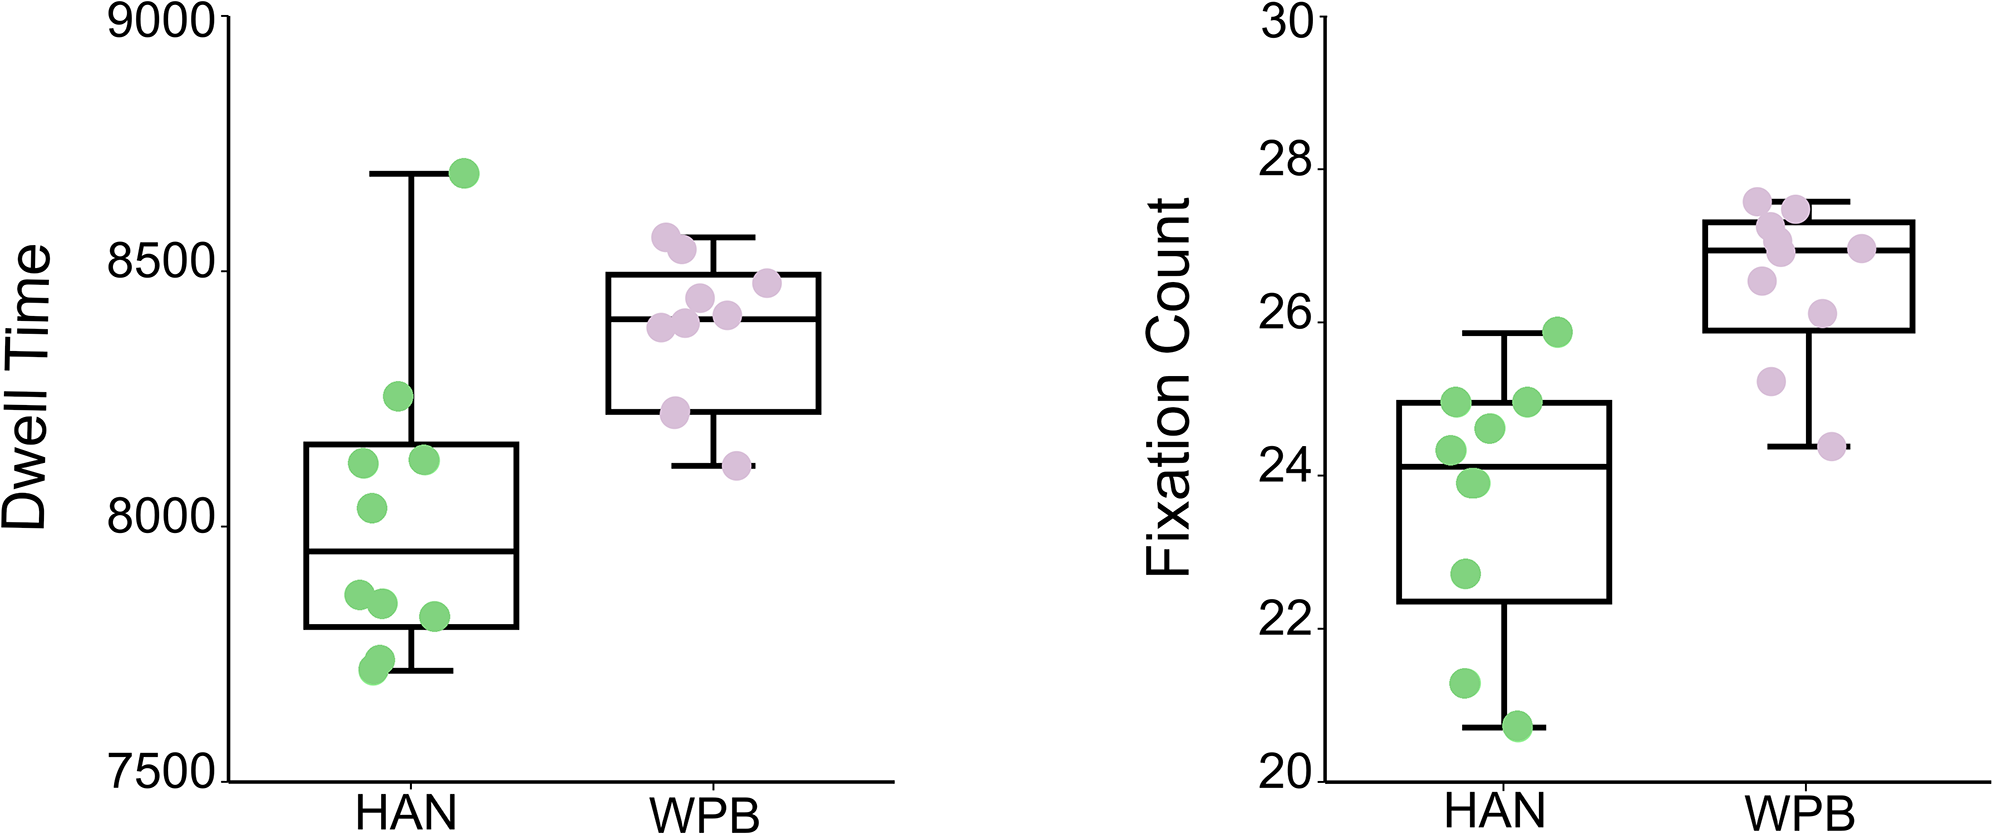
Jitter plot of DT (measured in milliseconds) and FC for the two stone tool types (HAN and WPB). Boxplots show the non-parametric distribution.
Correlations between stone tool morphological measurements and the two visual variables were computed for each lithic group independently, as to consider each tool according to its group-specific pattern and range of variability (Table 1 and Figure 3).

Correlations between visual variables and tool diameters (worked pebbles: purple; handaxes: green). p < .01.
Correlation coefficients between tool diameters and vision variables.
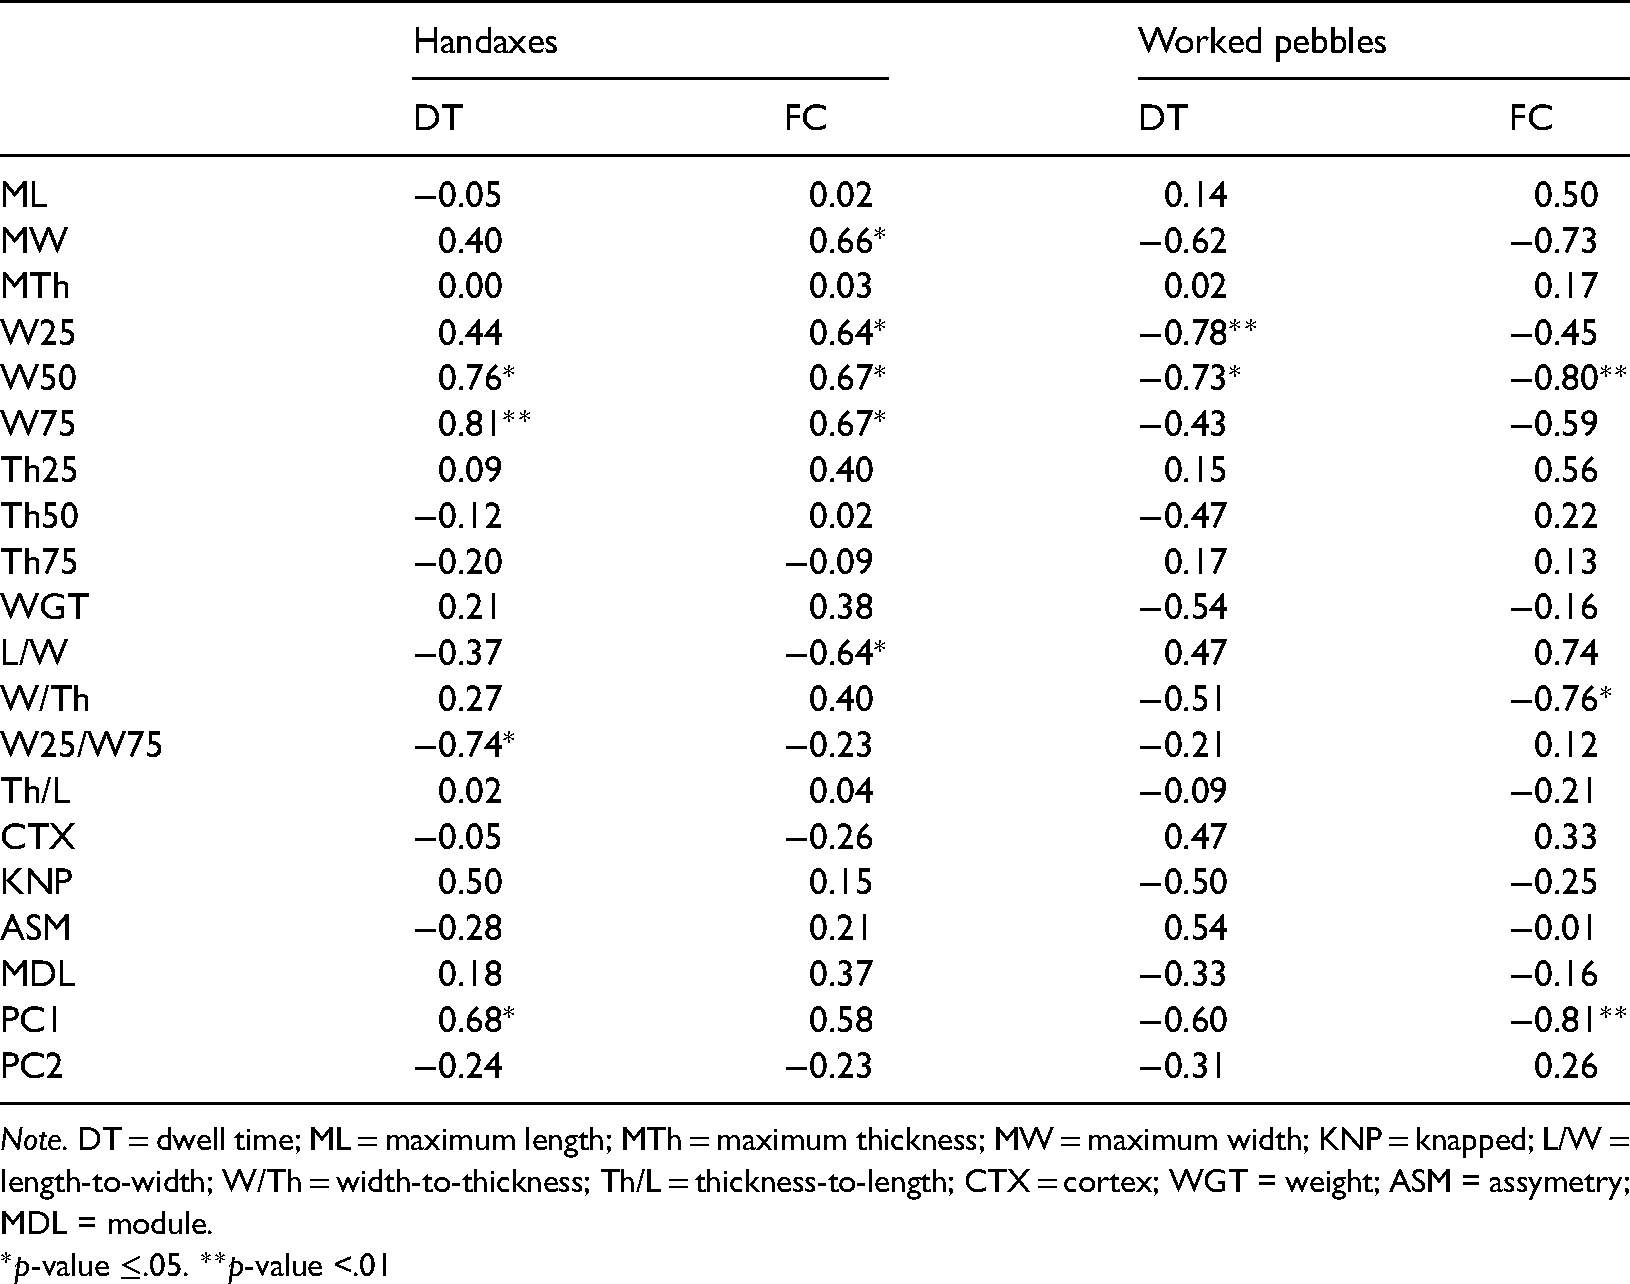
Note. DT = dwell time; ML = maximum length; MTh = maximum thickness; MW = maximum width; KNP = knapped; L/W = length-to-width; W/Th = width-to-thickness; Th/L = thickness-to-length; CTX = cortex; WGT = weight; ASM = assymetry; MDL = module.
*p-value ≤.05. **p-value <.01
In handaxes, DT was correlated with W75 while, in worked pebbles, DT was correlated with W25. In worked pebbles, FC was correlated with W50 and PC1 (namely the degree of elongation). Tool asymmetry, cortex percentage and knapped perimeter did not display any correlation with DT and FC. Figure 4 shows the distribution of the two visual variables for distinct tool regions, pooling the two tool types. Knapped areas elicited more attention than Cortex (DT: U = 21, df = 1, p < .0001; FC: U = 24, df = 1, p < .0001). The middle region triggered more attention than the upper region, followed by the tool base (DT: H = 41.5, df = 2, p < .0001; FC: H = 42.5, df = 2, p < .0001). Comparing worked pebbles with handaxes, DT was larger in the latter group for the tool base (more time spent screening the base in the handaxes; U = 10, df = 1, p = .003), while FC was larger for the Base in the handaxes (U = 9, df = 1, p = .002), and for the top in the worked pebbles (U = 20; df = 1, p = .02; Table 2).

Jitter plots and non-parametric boxplots of DT (measured in milliseconds) and FC for different tool regions (base, middle region, and upper region) and for CTX and KNP surfaces (worked pebbles: purple; handaxes: green).
Differences between stone tools groups (median values). Results are considered significant for p < .05.
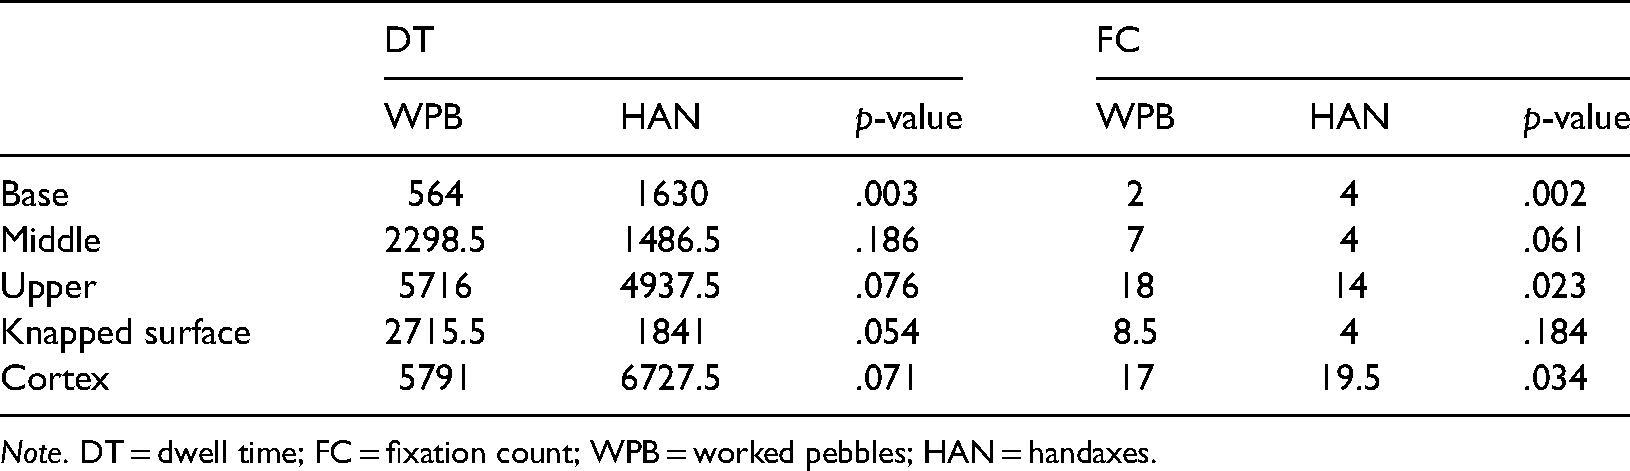
Note. DT = dwell time; FC = fixation count; WPB = worked pebbles; HAN = handaxes.
Figure 5 shows the image saliency maps and fixation DT ‘heat maps’ (averaged across participants) overlaid over the average tool shape. For fixation heat maps in both worked pebbles and handaxes, the central and upper half of the stone tool attracted more attention than the lower regions. In worked pebbles, the most viewed area was the centre of the upper half, coinciding with the knapped surface, while subjects spent less time exploring the tool base. In the case of the Handaxes, the most fixated regions corresponded to the tool midline, mostly towards the upper half (Figure SI1). In contrast, the GBVS algorithm (Harel et al., 2007) typically highlighted areas around the left and right sides of worked pebbles rather than the knapped surfaces. For handaxes, the GBVS computation identified edges and the base region as most being more salient than suggested by the fixation heat maps generated from the participants’ eye movement data (Figure SI2).

Image saliency map (averaged across tools) and fixation dwell time (DT) ‘heat map’ (averaged across participants) overlaid over the average stone tool shape.
The same AOIs used for the analysis of eye fixations were also applied to the image salience maps generated for each tool image and a mean saliency index value was calculated for each of the interest areas (i.e. base, cortex and knapped region). Pearson correlations were then carried out between mean AOI saliency indices and mean fixation DTs and the number of fixations across images. This showed no significant correlations between saliency indices and mean fixation DT (p = .8, R = −0.004) or mean number of fixations per interest area (p = .9, R = −0.02) for either tool type. No significant correlations were also found taking the stone tool type separately (DT – p = .9; R = 0.009; FC – p = .9, R = −0.001 for worked pebbles; DT – p = .9, R = −0.002; FC – p = .9, R = 0.001 for handaxes) (Figure SI3).
Discussion
The purpose of the study was to analyse the patterns of visual exploration of Lower Palaeolithic stone tools to compare two stone tool types (handaxes and worked pebbles), which differed in their assumed cognitive complexity. A key question was whether patterns of visual exploration can be explained by purely sensory features of the tool images (i.e. visual salience), or are related to object-action affordances (Gibson, 1979).
The main focus of visual attention was found to be located at the centre of the upper half of the worked pebbles, whereas in handaxes attention was distributed along the midline (Figure 5b). Observation of handaxes was characterized by more individual variability in terms of DT on particular AOIs, and a lower number of gaze fixations overall when compared with worked pebbles. From a cognitive point of view, longer or more frequent fixations suggest an increase in cognitive functional complexity and attention demands (Duchowski, 2017), and/or the difficulty associated with visual exploration, due to the need for more effort in processing and extracting information (Federico & Brandimonte, 2019). The larger variability in DT may be associated with the larger morphological variation in handaxes when compared with pebbles.
The total number of fixations and DT also showed correlations with some morphological features of tools. In particular, attention correlated with tool width and tool elongation. Elongated stone tools such as handaxes might require less exploration due to their inherent manipulability while pebbles may require less processing owing to the difficulty of understanding how they could be grasped. The tendency to look at the top or bottom of an object has also been related to mass and weight judgements (Samuel & Kerzel, 2011) and has been observed that the upper regions are often the subject of attention in novel objects (Juravle et al., 2015). Interestingly, elongation has been hypothesized to be a crucial aspect of objects requiring attention when performing grasping actions (Almeida et al., 2014; Krishna, 2006) and a proxy of cognitive complexity of stone tools (Gowlett, 2013). Symmetry is also a key feature in Acheulean handaxes (Hodgson, 2009, 2015; Lycett, 2008; Wynn & Gowlett, 2018) and can be a strong influence on patterns of visual exploration in perception (Apthorp & Bell, 2014; Norcia et al., 2005; Turvey et al., 1999). However, visual behaviour is not correlated to symmetry, at least for the variables used in this study.
The knapped surface of all tools was consistently shown to attract more attention than the cortex (unknapped surface). The middle region of tools was also a strong focus of gaze for both tool types. The former may relate to attention to the striking/cutting action relevant features of the tools, whilst the latter may reflect the observation that eye fixation and visual exploration are invariably strongly biased towards the central region of the visual field (a tendency called the ‘central gaze bias’ – Doran et al., 2009; Ioannidou et al., 2016; Le Meur & Liu, 2015; Tatler, 2007; Xiao et al., 2018). However, in addition to this central bias the current findings suggest that when a context is lacking (as in our case), gaze may also be more likely directed to the striking surfaces of the tool as well as manipulation area (Federico & Brandimonte, 2019).
The increased attention directed towards the middle AOI might be explained simply by an overall central bias in patterns of visual exploration within objects and across the visual field (Doran et al., 2009; Ioannidou et al., 2016; Le Meur & Liu, 2015; Tatler, 2007; Xiao et al., 2018). Similarly, attention towards the knapped AOI might be explained by these areas being more visually salient as they tended to lie along the edges of the tools, a region consistently highlighted by the GBVS saliency model (Figure 5). Many previous studies have shown that fixation patterns correlate well with calculated visual salience in natural scenes (e.g. Foulsham & Underwood, 2008; Tatler et al., 2011). In a sense, a specific region or part of an object can be said to be salient if it captures the subject's visual attention as defined in terms of frequency or duration of fixation (Ma et al., 2015).

A bar chart plot for click rate in each area of interest. *p < .005, **p < .0005, ***p<.0001.
The distribution of gaze within the tool images showed a low correspondence with regions highlighted by a computational model of visual salience based purely on visual properties of the image (Figure 5; Figures SI1 and SI2). Overall, the image salience maps generated for the tool images highlighted peripheral regions of the tool edge bilaterally, whereas the eye tracking data indicated that the middle-upper region was scanned the most, followed by the knapped surfaces, then the cortex. It is important to note that the GBVS algorithm used to generate the salience maps for the tool images (Experiment 1) represents a sophisticated computational approach that takes into account more than simply the relative brightness and luminance contrast of different parts of the image. Feature maps of intensity, colour and orientation contrast are created at various spatial resolutions and combined to form a ‘master map’ of image salience. The GBVS approach also then includes a ‘normalization’ stage, which accentuates regions that it calculates to be of particular interest or ‘surprising’ given the overall characteristics of the image. This stage also incorporates the central gaze bias described above (see above). Nevertheless, no significant positive correlations were found between calculated mean image salience coefficients and eye fixation variables across the different AOIs (upper, middle, lower, knapped, and cortex). This suggests that the visual image properties alone cannot explain the observed differences in the distribution of attention between different tool types and AOIs and action-related features may instead influence the distribution of attention within the tool images.
Although the results of Experiment 1 are consistent with an influence of action affordances on patterns of visual exploration of stone tools, a number of further questions are prompted by the study. To assess the functional and cognitive influences on visual attention, Experiment 1 compared examples of Acheulean technology (handaxes) with the more primitive Oldowan technology (worked pebbles) as a control. However, an alternative approach would have been to use completely unworked pebbles as a control. Another criticism of Experiment 1 is that the differences in visual exploration might arise due to the external features of an object (i.e. shape and symmetry), rather than internal features (i.e. texture). Therefore, it was not possible to determine whether differences in the distribution of gaze across the different AOIs were due to surface features (e.g. knapped edges) or the object shape. Finally, although none of our participants were experts in Palaeolithic technology, there were all aware that they were viewing images of ancient stone tools. As such the influence of participant knowledge on patterns of exploration could not be determined.
In Experiment 2, the same handaxe images were presented to participants along with 10 new images of unworked pebbles approximately matched in size and orientation with the handaxes. To disentangle the influence of shape and surface features on the distribution of attention, a new set of ‘mixed’ images was also created. These were composite images comprising the textured surface of an unworked pebble, masked with the outline shape of a handaxe. In addition, participants were randomly allocated to two different groups. One group was told that they were viewing images of ‘stone tools’, whereas the others were informed that they were to see ‘stone objects’. Otherwise, the instructions given to participants were identical. Due to the restrictions imposed by the Covid-19 pandemic, Experiment 2 was conducted online, using a mouse-click attention tracking (mcAT) technique. Previous work has shown that mcAT provides a useful index of visual attention and correlates closely with eye fixation data (Egner et al., 2018; Granka et al., 2004; Milisavljevic et al., 2021; Navalpakkam et al., 2013; Rheem et al., 2018; Scheier et al., 2003). Running the study online also had the advantage of permitting a larger participant sample to be tested as well as providing a test of the robustness of the general findings of Experiment 1 using an alternative technique to eye tracking.
Experiment 2 (Online Study)
Material and Methods
Participants
A sample of 73 participants recruited from social media completed the experiment. The participants were non-experts naïve with respect to expert knowledge of archaeology and stone tools to ensure that knowledge about tool-making did not bias spontaneous visual exploration of the tools. Participants were also randomly allocated to two instruction conditions. Forty-one participants were informed that they will see pictures of objects, while 32 were informed that they will observe pictures of tools. Otherwise, the instructions given to the two groups of participants were identical (see below). All gave informed consent for their participation in the study, which was approved by the ethics committee of the University of Lincoln.
Procedure
Participants were invited to participate via email and social media and followed a web link to a survey on the Qualtrics® platform (a web-based survey tool for research). The survey used the image ‘Heat Map’ Qualtrics feature, which allows analysis of mouse click/touch response coordinates within a displayed image. After reading the study information sheet and confirmation of participant consent, they were shown with a series of 30 pictures, displayed sequentially in the centre of the screen, each being displayed until the participant clicked on the ‘Next’ button (located in the bottom right corner of the screen). There were three image type conditions in Experiment 2, 10 handaxes, 10 natural unworked pebbles and 10 ‘mixed’ images. Mixed images were composite images created by overlaying the textured surface of one of the unknapped pebbles with the outline shape of one of the handaxe images (created using custom-written Matlab code). In this way, for each of the 10 handaxes, there was a matching mixed image with the same outline shape but with the texture of an unknapped natural pebble. The 10 original handaxe images were the same images used in Experiment 1.
The participants were instructed that for each image they were to ‘click/touch on up to 10 points in the picture which catch your attention’. If the ‘next’ button was not clicked following a period of 20 s the next image was displayed automatically. Images of handaxes, unworked pebbles and mixed images were displayed in a unique randomized order for each participant. Following the presentation of all 30 images, participants were shown a debrief screen providing additional information about the motivation of the study.
Data Analyses
The same AOIs used in the previous experiment were used to quantify participant responses, namely the upper, middle region and base, as well as the cortex and knapped surface. Knapped and cortex surface was only specified for handaxes and the corresponding mixed images. Although mixed images did not have a knapped surface (as they had an unworked stone texture), we applied the same AOIs for the corresponding handaxe to appraise the relative influence of surface texture and outline shape. A ‘click rate’ was computed for each AOI which indicated the mean probability of participants making at least one click/touch within the corresponding region. Graphical image ‘heatmaps’ were also generated automatically by Qualtrics to provide a visual summary of the distribution of points of interest across the images. Wilcoxon tests, Kruskal–Wallis tests and a three-way analysis of variance (ANOVA; 2 repeated measures: image type and AOI and 1 between-group factor: participant instruction group) were used to analyse differences in click rates to different AOI and image types. Results were considered significant at p < .05. Statistics were computed using SPSS 25 (IBM Inc.).
Results
Overall, the distribution of clicks/touches across AOIs and images corresponded very closely to that revealed using eye tracking (Experiment 1). Figure 6 shows the distribution of clicks across participants for each image represented graphically as a ‘Heatmap’ and Table 3 shows the descriptive statistics for each AOI and image type. As was found when analysing fixation variables in Experiment 1, the most clicked AOI for handaxe images was the middle, followed by the base and upper region. In contrast for the mixed images, the most clicked area was again the middle, but followed by the upper and base AOIs which showed equivalent values. For pebbles, the upper region also attracted more interest than the base AOI.

Heat maps for participant ‘clicks’ for each image used in the online study (Experiment 2). (a) Handaxes, (b) pebbles, and (c) mixed image. The mixed images used the same outline shape as the corresponding handaxe, but with the surface texture of an unworked pebble rather than the original knapped surface of the handaxe.
Descriptive statistics for the AOIs.
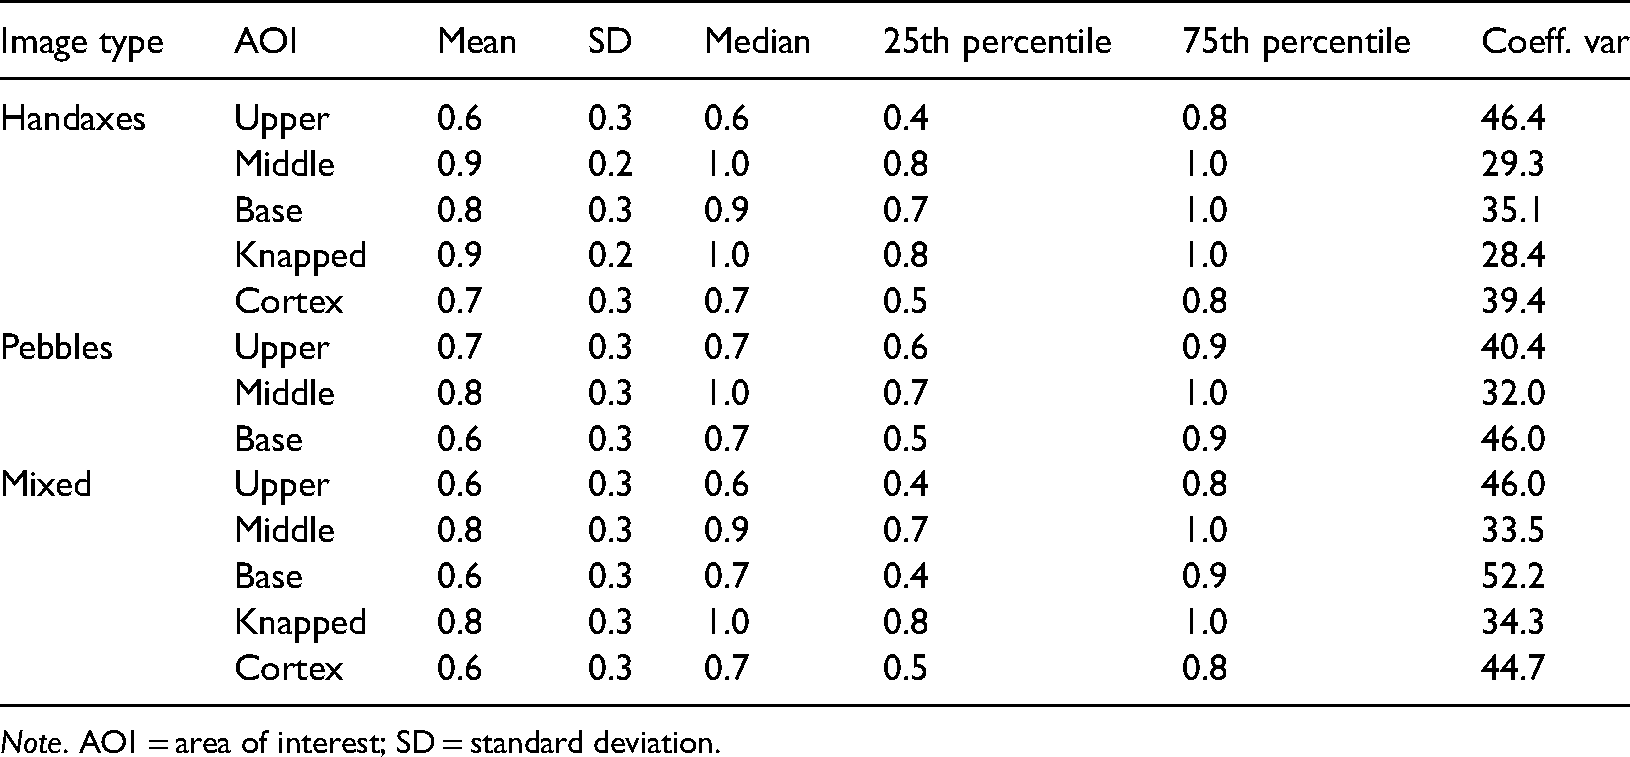
Note. AOI = area of interest; SD = standard deviation.
When examining AOIs which outlined worked features of the surface, both handaxes and mixed images showed more clicks on AOIs corresponding to the knapped surface of the handaxe, but click rates were lower within the cortex AOI for handaxes compared to mixed images. The base AOI was selected significantly more for handaxes compared to both mixed and pebble images. The upper AOIs were significantly more likely to be selected for pebbles compared to the other image conditions (Table 4 and Figure 7).
Differences between areas of interest (AOIs).
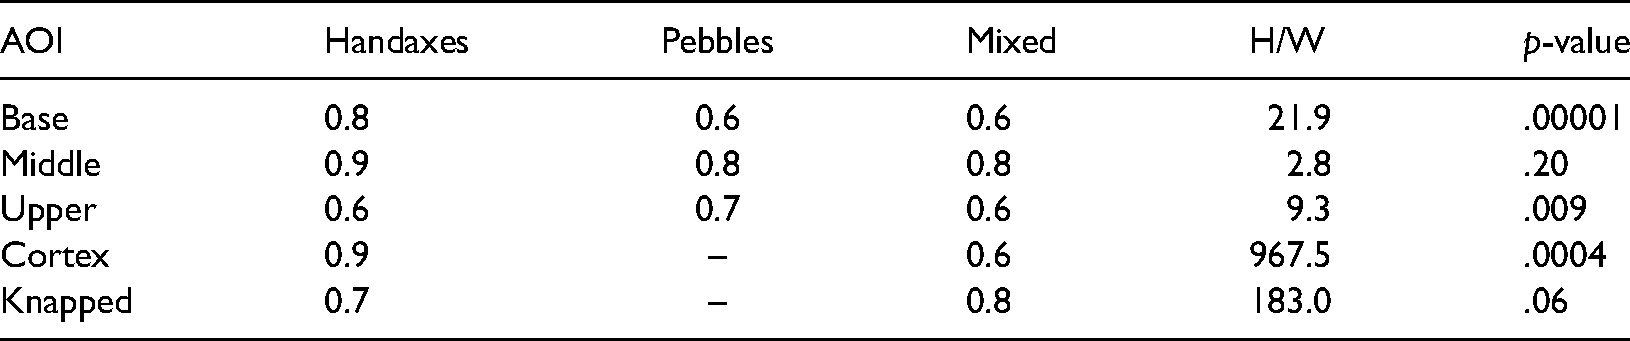
A 3-way ANOVA of click rates including participant group, image type and AOI as factors further showed that there was a significant main effect of image type overall (F(1,95) = 31.4, p < .0001), AOI (F(4,9) = 54.9, p < .0001) and a significant interaction between image type and AOI (F(4,18) = 12.2, p < .0001). However, there were no main or interaction effects involving the participant group.
General Discussion
The overall aim of this research was to analyse patterns of visual exploration of Lower Palaeolithic stone tools to draw implications with respect to the co-evolution of tools and cognitive processes in humans. Experiment 1 tested whether patterns of scanning eye movements could be explained by the visual saliency characteristics of images of stone tools or might be influenced by functionally relevant features in addition to purely visual properties. The findings revealed different patterns of fixation between AOIs for more advanced handaxe tools compared with more ancient worked pebbles. In particular, handaxes attracted more fixations and DT to the base AOI. A follow-up study replicated the general findings using a larger participant sample and an online mcAT technique rather than eye tracking (Egner et al., 2018). Experiment 2 also presented images of completely unworked stone pebbles rather than the roughly worked pebbles that were used as the control images in the first study. This produced a very similar pattern of differences in the distribution of visuospatial attention to that determined using eye tracking Experiment 1, with clear differences apparent between pebbles and handaxes within the base, upper and cortex AOIs.
Another aim of Experiment 2 was to disentangle the influence of shape versus internal features (e.g. knapped areas) on the textured stone surface of tools. Interestingly, increased participant ‘click rates’ were seen for the base and cortex AOIs for handaxes when compared to the mixed image condition (composite images using the outline shape of a handaxe overlaid with an unworked stone surface). This strongly suggests that the allocation of attention towards these regions is affected by the presence of worked features on the stone surface, as the outline shape of the objects was perfectly matched between conditions. Conversely, in the case of the upper AOI, both worked (Experiment 1) and unworked pebbles (Experiment 2) showed increased eye fixations/click rates compared to both the handaxe and mixed image conditions. This suggests that the outline shape of handaxes rather than internal features exerted a greater influence on the visual exploration of the upper part of the objects.
Across both experiments, attention tended to be distributed along the midline and base of handaxes (Figures 5b and 6a). Overall, this pattern can be seen as consistent with an assessment of the object with a view to handling (Federico et al., 2021; Myachykov et al., 2013). It is thought that handaxes would generally be grasped on their proximal end (García-Medrano et al., 2014; Gowlett, 2006; Herzlinger et al., 2017; Key et al., 2016; Weiss, 2020; Wynn, 2020; Wynn & Gowlett, 2018) and that the tool base is associated with a grasp affordance (Myachykov et al., 2013). The tendency to look at the bottom of an object has also been related to mass and weight judgements (Samuel & Kerzel, 2011) and it has been observed that the upper regions of objects are often the subject of attention (Juravle et al., 2015). The present findings showing differences between tool images dependent upon functionally relevant features also support the possibility that action-related features of objects attract visuospatial attention, and that visual exploration of stone tools activates object-action affordances (Ambrosini & Costantini, 2016; Gibson, 1979).
Cognitive factors such as verbal instructions and prior knowledge are known to influence the way viewers perceive objects and control visuospatial attention and eye movements (Land, 2006; Noorman et al., 2018; Yarbus, 1967). In Experiment 1, it was not possible to determine whether knowledge of the use of the objects as tools influenced the results, as although all the participants were non-experts in Palaeolithic technology, they were all told that the images were of ancient stone tools in the study information and instructions. In Experiment 2, participants were randomly allocated to two conditions in which the word ‘Tool’ was replaced by ‘Object’ in the task instructions. A comparison of the two groups did not reveal any significant differences. However, knowledge of object function is not considered a prerequisite for the recognition of affordances (Xu & Heike, 2017). The concept of object-action affordances is that they can directly cue actions towards an object without the need to invoke cognitive processing (Granka et al., 1979). That is, perception of affordance depends on the visual processing of the structural properties of an object which immediately identify it as a tool regardless of pre-existing instructions or knowledge (Makris et al., 2011; Proverbio et al., 2011; Rüther et al., 2014; Vingerhoets et al., 2009).
It has been hypothesized that the exploration of a tool begins with a functional perspective (the aim: what), followed by a practical approach (the grasp: how – Federico and Brandimonte, 2019). In this sense, the dissimilar fixation pattern shown in worked pebbles and handaxes suggest different affordances and differences in the associated behaviour. The former showed more attention allocated to the functional ‘striking’ surfaces (upper AOI), while in the latter the manipulative area (base) is the focus, perhaps reflecting more attention to the functional ‘what’ perspective in the case of worked pebbles and the practical ‘how’ perspective for handaxes. The results could also be interpreted from the perspective in cognitive science which suggests that technology should be considered an integral part of the cognitive system (e.g. Bruner et al., 2018; Clark & Chalmers, 1998; Malafouris, 2010; 2013; Maravita & Iriki, 2004; Miller et al., 2018).
A number of opportunities for further work are presented by the current research. Both studies used static two-dimensional images presented to participants on a computer monitor. This had the advantage that object characteristics such as size and orientation and other properties such as surface texture and shape could be carefully controlled and manipulated. It was also possible to apply computational analysis to the images and behavioural data within defined AOIs using this approach. However, tools are three-dimensional objects used in a dynamic visual environment. Currently, we are investigating how visual attention and manual responding interact during actual tool handling and manipulation using mobile eye tracking (Silva-Gago et al., 2021), which allows the point of gaze ‘in the real world’ to be captured during head and body movements (Ioannidou et al., 2016). Another ongoing study is aimed to consider the influence of expertise and knowledge on visual exploration by recording eye movements in expert archaeologists and knappers whilst viewing tools. Additionally, future studies could extend the analysis to a wider array of stone tool typologies (Mousterian and Aurignacian technologies) to chart the trajectory of cognitive and tool co-evolution. Another important area that could be explored using eye tracking is the cognitive demands imposed by the production of stone tools (Muller et al., 2017). Mobile eye tracking could be used to determine the influence of expert knowledge on tool exploration and whilst experienced knappers produce replica ancient stone tools. Inevitably, an implicit limitation in cognitive archaeology is the fact that all participants are modern humans. Extrapolations to extinct species, although reasonable because of the taxonomic affinity, are speculative, and they should be provided on the basis of multiple sources of anatomical and behavioural evidence.
Conclusion
In summary, the observed differences between the patterns of visual exploration across the two experiments between handaxes, worked pebbles, unworked natural pebbles and ‘mixed’ images support the idea that action-based representations influence attention when viewing stone tools. Several previous studies have similarly proposed that ocular fixation patterns are focused on action relevant parts of objects (Ambrosini & Costantini, 2016; Land, 2006; Natraj et al., 2015) and that people perceive tools according to their implicit affordances (Borghi, 2007; Osiurak et al., 2017), even when there is no intention to act with them (Makris et al., 2011; Tipper et al., 2006). We speculate that these divergencies might relate to changes in the perceptual relationships between cognition and tools in the early human species (Bruner, 2021; Bruner & Iriki, 2016; Bruner & Lozano, 2014; Burke, 2012; Neubauer et al., 2018).
Supplemental Material
sj-docx-1-pec-10.1177_03010066211069504 - Supplemental material for Visual Attention and Cognitive Archaeology: An Eye-Tracking Study of Palaeolithic Stone Tools
Supplemental material, sj-docx-1-pec-10.1177_03010066211069504 for Visual Attention and Cognitive Archaeology: An Eye-Tracking Study of Palaeolithic Stone Tools by María Silva-Gago, Flora Ioannidou, Annapaola Fedato, Timothy Hodgson and Emiliano Bruner in Perception
Footnotes
Acknowledgements
We would like to thank Marcos Terradillos-Bernal and Rodrigo Alonso-Alcalde for the stone tool-making and technical support, and Benjamin Wolfe for his helpful comments. We are extremely grateful to all the volunteers who participated in this survey.
Ethical Approval
All procedures performed in studies involving human participants were in accordance with the ethical standards of the institutional and/or national research committee and with the 1964 Helsinki declaration and its later amendments or comparable ethical standards
Informed Consent
Informed consent was obtained from all individual participants included in the study
Consent for Publication
Publication consent was obtained from all individual participants included in the study
Declaration of Conflicting interests
The authors declared no potential conflicts of interest with respect to the research, authorship and/or publication of this article.
Funding
The authors disclosed receipt of the following financial support for the research, authorship, and/or publication of this article: This study was supported by the Junta de Castilla y León and co-financed by European Social Funds (EDU/574/2018), and by the Spanish Government (Atapuerca Project; PGC2018-093925-B-C31). MSG was also funded by the University of Burgos, Spain.
Supplemental Material
Supplemental material for this article is available online.
References
Supplementary Material
Please find the following supplemental material available below.
For Open Access articles published under a Creative Commons License, all supplemental material carries the same license as the article it is associated with.
For non-Open Access articles published, all supplemental material carries a non-exclusive license, and permission requests for re-use of supplemental material or any part of supplemental material shall be sent directly to the copyright owner as specified in the copyright notice associated with the article.