
Abstract
A strong temporal correlation promotes integration of concurrent sensory signals, either within a single sensory modality, or from different modalities. Although the benefits of such integration are well known, far less attention has been given to possible costs incurred when concurrent sensory signals are uncorrelated. In two experiments, subjects categorized the rate at which a visual object modulated in size, while they also tried to ignore a concurrent task-irrelevant broadband sound. Overall, the experiments showed that (i) losses in accuracy from mismatched auditory and visual rates were larger than gains from matched rates and (ii) mismatched auditory and visual rates slowed responses more than they were sped up when rates matched. Experiment One showed that audiovisual interaction varied with the difference between the visual modulation rate and the modulation rate of a concurrent auditory stimulus. Experiment Two showed that audiovisual interaction depended upon the strength of the task-irrelevant auditory modulation. Although our stimuli involved abstract, low-dimensional stimuli, not speech, the effects we observed parallel key findings on interference in multi-speaker settings.
During speech, the visible movements of a speaker’s face closely parallel the acoustic signals produced by the speaker’s vocal apparatus (Chandrasekaran et al., 2009). This audiovisual temporal relationship boosts the intelligibility of face-to-face conversation (Sumby and Pollack, 1954), which is particularly helpful in noisy environments, such as crowded restaurants and parties (Golumbic et al., 2013), or when a listener is hearing-impaired (Dias et al., 2021). Just as temporal correlation can boost intelligibility in multi-talker settings, sounds that are uncorrelated with a speaker’s facial kinematics can reduce speech intelligibility (Golumbic et al., 2013; Li et al., 2018). Filtering out irrelevant sounds puts a premium on selective attention (Kerlin et al., 2010; Passow et al., 2012). To be clear, by that term we mean “the processes that allow an individual to select and focus on particular input for further processing while simultaneously suppressing irrelevant or distracting information” (Stevens and Bavelier, 2012).
Because the intelligibility of face-to-face speech depends upon interactions among high-dimensional sensory and cognitive variables (Schneider et al., 2002; Peelle and Sommers, 2015; Conway et al., 2001), studying audiovisual speech presents difficult challenges. These challenges have led some researchers to develop low-dimensional analogues to face-to-face speech. For example, to isolate critical features of a speaker’s facial kinematics, speech intelligibility has been studied with a size-modulating disc or other dynamic visual object standing in for a speaker’s face (Bernstein et al., 2004; Strand et al., 2020; Yuan et al., 2021).
Several groups have examined selective listening with simple dynamic visual and auditory stimuli whose temporal frequencies resemble those of normal speech (Maddox et al., 2015; Varghese et al., 2017). To study how task-relevant and task-irrelevant amplitude-modulated sound influences perception of a size-modulating visual stimulus, our laboratory has used simple, low-dimensional, temporally modulated visual and auditory stimuli embedded in a video game, Fish Police!! (Sun et al., 2017; Varghese et al., 2017; Zhou, 2019; Sun and Sekuler, 2021). Importantly, some conditions of the game demand selective attention in order to filter out distracting task-irrelevant signals. This feature allows the game to estimate not only audiovisual interactions that benefit performance, but also ones that degrade it.
Subjects play Fish Police!! by categorizing the rate at which the image of a fish modulates in size. Over trials, this temporal modulation randomly takes on either of two alternative rates, for example, 5 and 6 Hz. Subjects quickly learn to categorize the modulation rates as either “slower” or “faster”. The modulating visual object can be accompanied by a task-irrelevant sound whose rate of amplitude modulation either matches the visual modulation rate or not. When visual and auditory modulations are matched, signals from the two modalities are temporally correlated. However, when visual and auditory modulation rates are mismatched, the mismatch produces competition between the modalities. Specifically, the slower visual modulation might be paired with the faster auditory rate, or vice versa. In that way, auditory and visual stimuli are not merely uncorrelated or imperfectly correlated: they directly conflict with one another. Although different operations may be responsible, the conflict from mismatched audiovisual stimuli in Fish Police!! can be analogized to the conflict represented in Eriksen’s Flanker task or in the Stroop task (Lamers and Roelofs, 2011).
One result has been confirmed over and over: Visual modulation rate is more accurately categorized when the visual stimulus is accompanied by a concurrent, synchronized auditory modulation than when the two compete. The first study with Fish Police!! (Goldberg et al.) was limited to just two conditions: auditory-visual modulations that matched in rate and phase (hereafter, Congruent) and auditory-visual modulations that were mismatched (hereafter, Incongruent). Accuracy in categorizing size modulation rate differed substantially between the two conditions, with the Congruent condition producing more accurate categorization. This result was robust, reaching statistical reliability after as few as just 20-30 trials (Goldberg et al., 2015), but ambiguous. The absence of any neutral, control condition made it impossible to tell whether the difference was caused by a gain in accuracy with Congruent stimuli, by a loss in accuracy with Incongruent stimuli, or by some combination of the two. So it is not clear that the difference between Congruent and Incongruent conditions actually reflected an advantage from audiovisual binding of the stimuli. Resolving this ambiguity is needed before the task’s usefulness as a stand-in for audiovisual speech can be fairly evaluated.
Several follow-up experiments have tried to resolve the ambiguity. They included an additional, Control condition in which a task-irrelevant sound was either absent or present but unmodulated. Every follow-up experiment replicated the significant advantage of the Congruent over the Incongruent condition, but they diverged in how performance in the Incongruent condition related to the performance in Control condition. In some experiments, results from the latter two conditions were indistinguishable from one another (Sun et al., 2017; Zhou, 2019), while in others, accuracy in the Incongruent condition fell significantly below that of the Control condition (Varghese et al., 2017; Zhou, 2019; Sun and Sekuler, 2021). The first of these outcomes is surprising because it shows that performance in the Incongruent condition can be unimpaired relative to the Control condition.
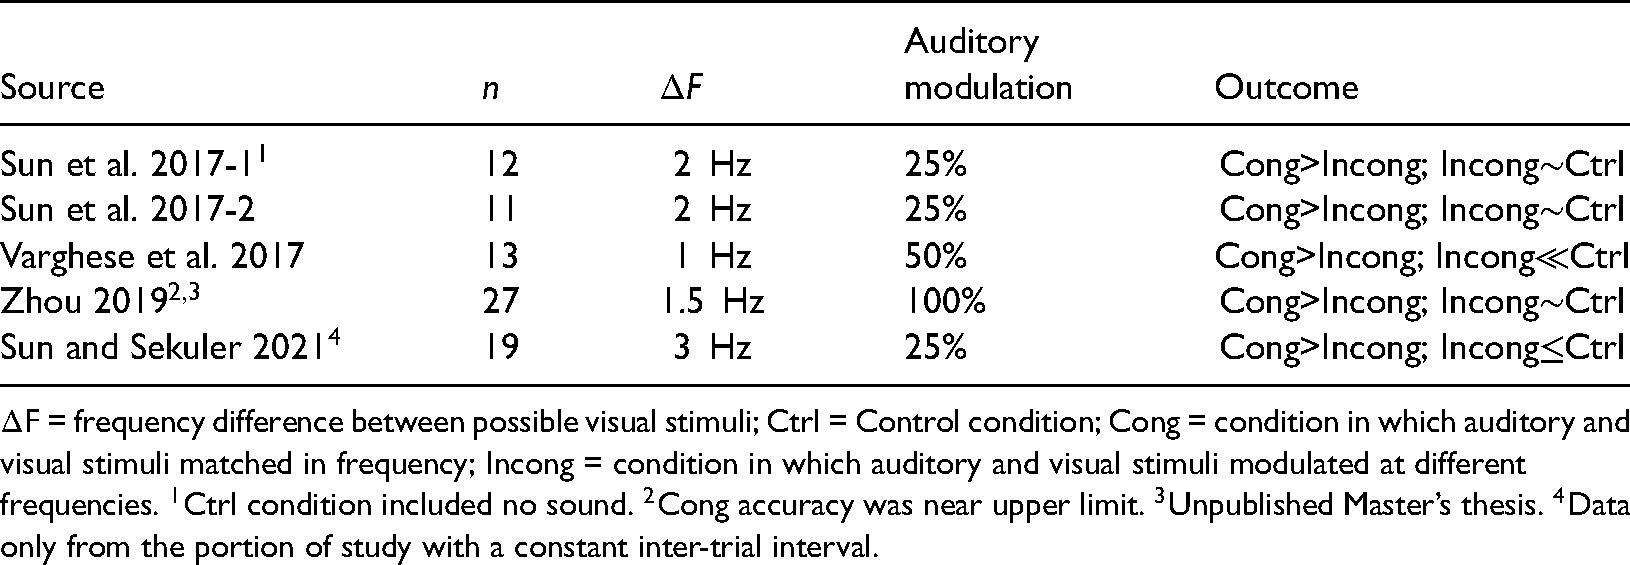
The divergent outcomes might have arisen from differences in the variables summarized in Table 1. The table shows that experiments differed in (i) the number of subjects tested (n), (ii) the difference between the low and high modulation frequencies (

Key Results and Conditions From Previous Experiments.
Experiment One
Experiment One used the Fish Police!! platform to examine how audiovisual interaction was affected by the difference between visual and auditory modulation frequencies. Multiple accounts of audiovisual interaction make a simple prediction for accuracy of categorization in the Incongruent condition: the closer the two conflicting frequencies are to one another, the poorer will be the accuracy in that condition.
Based on preliminary tests, three different frequency pairs were selected: 5 and 6 Hz, 5 and 7 Hz, and 5 and 8 Hz. Note that these values spanned the range used by previous studies with Fish Police!! (see Table 1). Throughout the experiment, 5 Hz was always the lower of the two possible frequencies; subjects were instructed to categorize a fish that oscillated at 5 Hz as a slow fish, making their response as rapidly as possible while trying to ignore the accompanying sound. The alternate frequency varied from one block of trials to another, taking values of 6, 7, and 8 Hz. Whatever that alternate frequency might be, though, fish modulating at that rate were to be categorized as faster.
Subjects
Subjects were 30 Brandeis undergraduate and graduate students, 19 to 24 years old. Twenty-six of them participated for course credit, the rest for pay; 23 of the 30 subjects were female. Visual acuity was measured prior to the experiment using the ETDRS vision chart at 60 cm viewing distance (Rosser et al., 2001). All subjects had normal or corrected-to-normal visual acuity (all subjects had < 0.1 on logMar acuity), and all self-reported normal hearing. Procedures were approved by Brandeis University’s Committee for the Protection of Human Subjects.
Stimuli
The visual stimulus was an image of a brightly colored clown fish (Amphiprion ocellaris), which swam steadily across a computer monitor at 25
Auditory stimuli were delivered through a computer speaker (BOKA 81000), at a mean level of 48 dB
Constitution of the three categories of audiovisual match (avMatch)

Schematic depiction of Experiment One’s stimulus conditions. On Congruent trials the size modulation frequency and starting sine phase matched the frequency and starting sine phase of the concurrent, synchronized sound modulation; those matched frequencies could be either both 5 Hz or 5 Hz +
Procedure
The experiment, programmed in Matlab R2015a, presented stimuli on a 21.5 inch iMac under OSX Yosemite (version 10.10.5). For subjects’ comfort, a lamp located behind the subject provided a constant, low level of illumination in the testing room. An adjustable chin rest, located 57 cm from the monitor, supported the subject’s head and chin.
Before each trial, a small black fixation cross was presented for 500 ms on a gray background. Then, after a random delay of 300–800 ms, the visual and auditory stimuli were presented, along with a background image depicting a sea floor. Subjects categorized the frequency at which the fish’s size modulated, while trying to disregard the accompanying sound. Responses were signaled by pressing either the P or Q key on the computer keyboard; the mapping of keys was counterbalanced across subjects. Both fish and background disappeared, and the sound stream ended when a response was made; otherwise they disappeared after two seconds. Brief distinctive high and low pitch tones provided immediate feedback about response correctness. The next trial began two seconds later. We chose that inter-trial interval expecting it would suffice to control time pressure and subject stress (Sun and Sekuler, 2021; Sussman et al., 2021).
Each block of trials comprised randomly interspersed, equal numbers of trials from three categories of audiovisual match (hereafter, avMatch) between the visual and auditory stimulus: Congruent (visual and auditory stimuli modulated in synchrony at the same frequency), Control (the size of fish oscillated but the accompanying sound amplitude was unmodulated), and Incongruent (visual and auditory stimuli modulated at different frequencies). Table 2 summarizes the conditions.
In every block of trials, the lower modulation frequency for either visual and auditory stimuli was 5 Hz ; the higher modulation frequency varied between blocks of trials, taking on values of 6, 7, or 8 Hz. We will use the term
Within each 90-trial block, there were 30 trials of Congruent, Control, and Incongruent stimuli, presented in random order. Ad lib breaks were allowed between blocks. Subjects completed two blocks of trials with each of the three frequency pairs. Within each set of three blocks, the order of blocks was randomized. Each subject received 540 trials, spread over six block-randomized sets of 90 trials each. As mentioned already,
The experiment consisted of one practice block and six experimental blocks per subject.The practice block comprised six trials, in which all three categories of avMatch were represented equally. The modulation frequencies in the practice block were 5 and 7 Hz, representing the central value of
For each subject, response accuracy was defined by the proportion of trials on which the visual stimulus was correctly categorized (as either “slower” or “faster”). One subject’s data were discarded for low mean accuracy, 0.66 proportion correct responses over all conditions. That value was 2.7 standard deviations below the mean, 0.85 correct, for all other subjects. After this subject was excluded, 29 subjects’ data were left for formal analysis. Running several analyses with and without that subject, confirmed that the exclusion had negligible effect. The 29 retained subjects failed to respond within the 2 s time limit just 27 times out of a total of 15,640 trials. Those trials were not included in accuracy calculations.
Analyses for both experiments used several R packages, most importantly Afex: Analysis of Factorial EXperiments (Singmann et al., 2016), emmeans (Lenth, 2021), and lme4 (Bates et al., 2015). Analysis of variance (ANOVAs) generated Type III sum of squares using subjects’ mean accuracy in each condition. lme4’s glmer() model was applied to individual trial-by-trial accuracy data; the analysis included a random intercept for subjects. This reduced some between-subject variance from our within-subject, repeated measures design in which responses from any one person were more similar than responses from other people. Because accuracy responses were binary (that is, correct or not correct), the regression used a logit link function.
Results: Response Accuracy
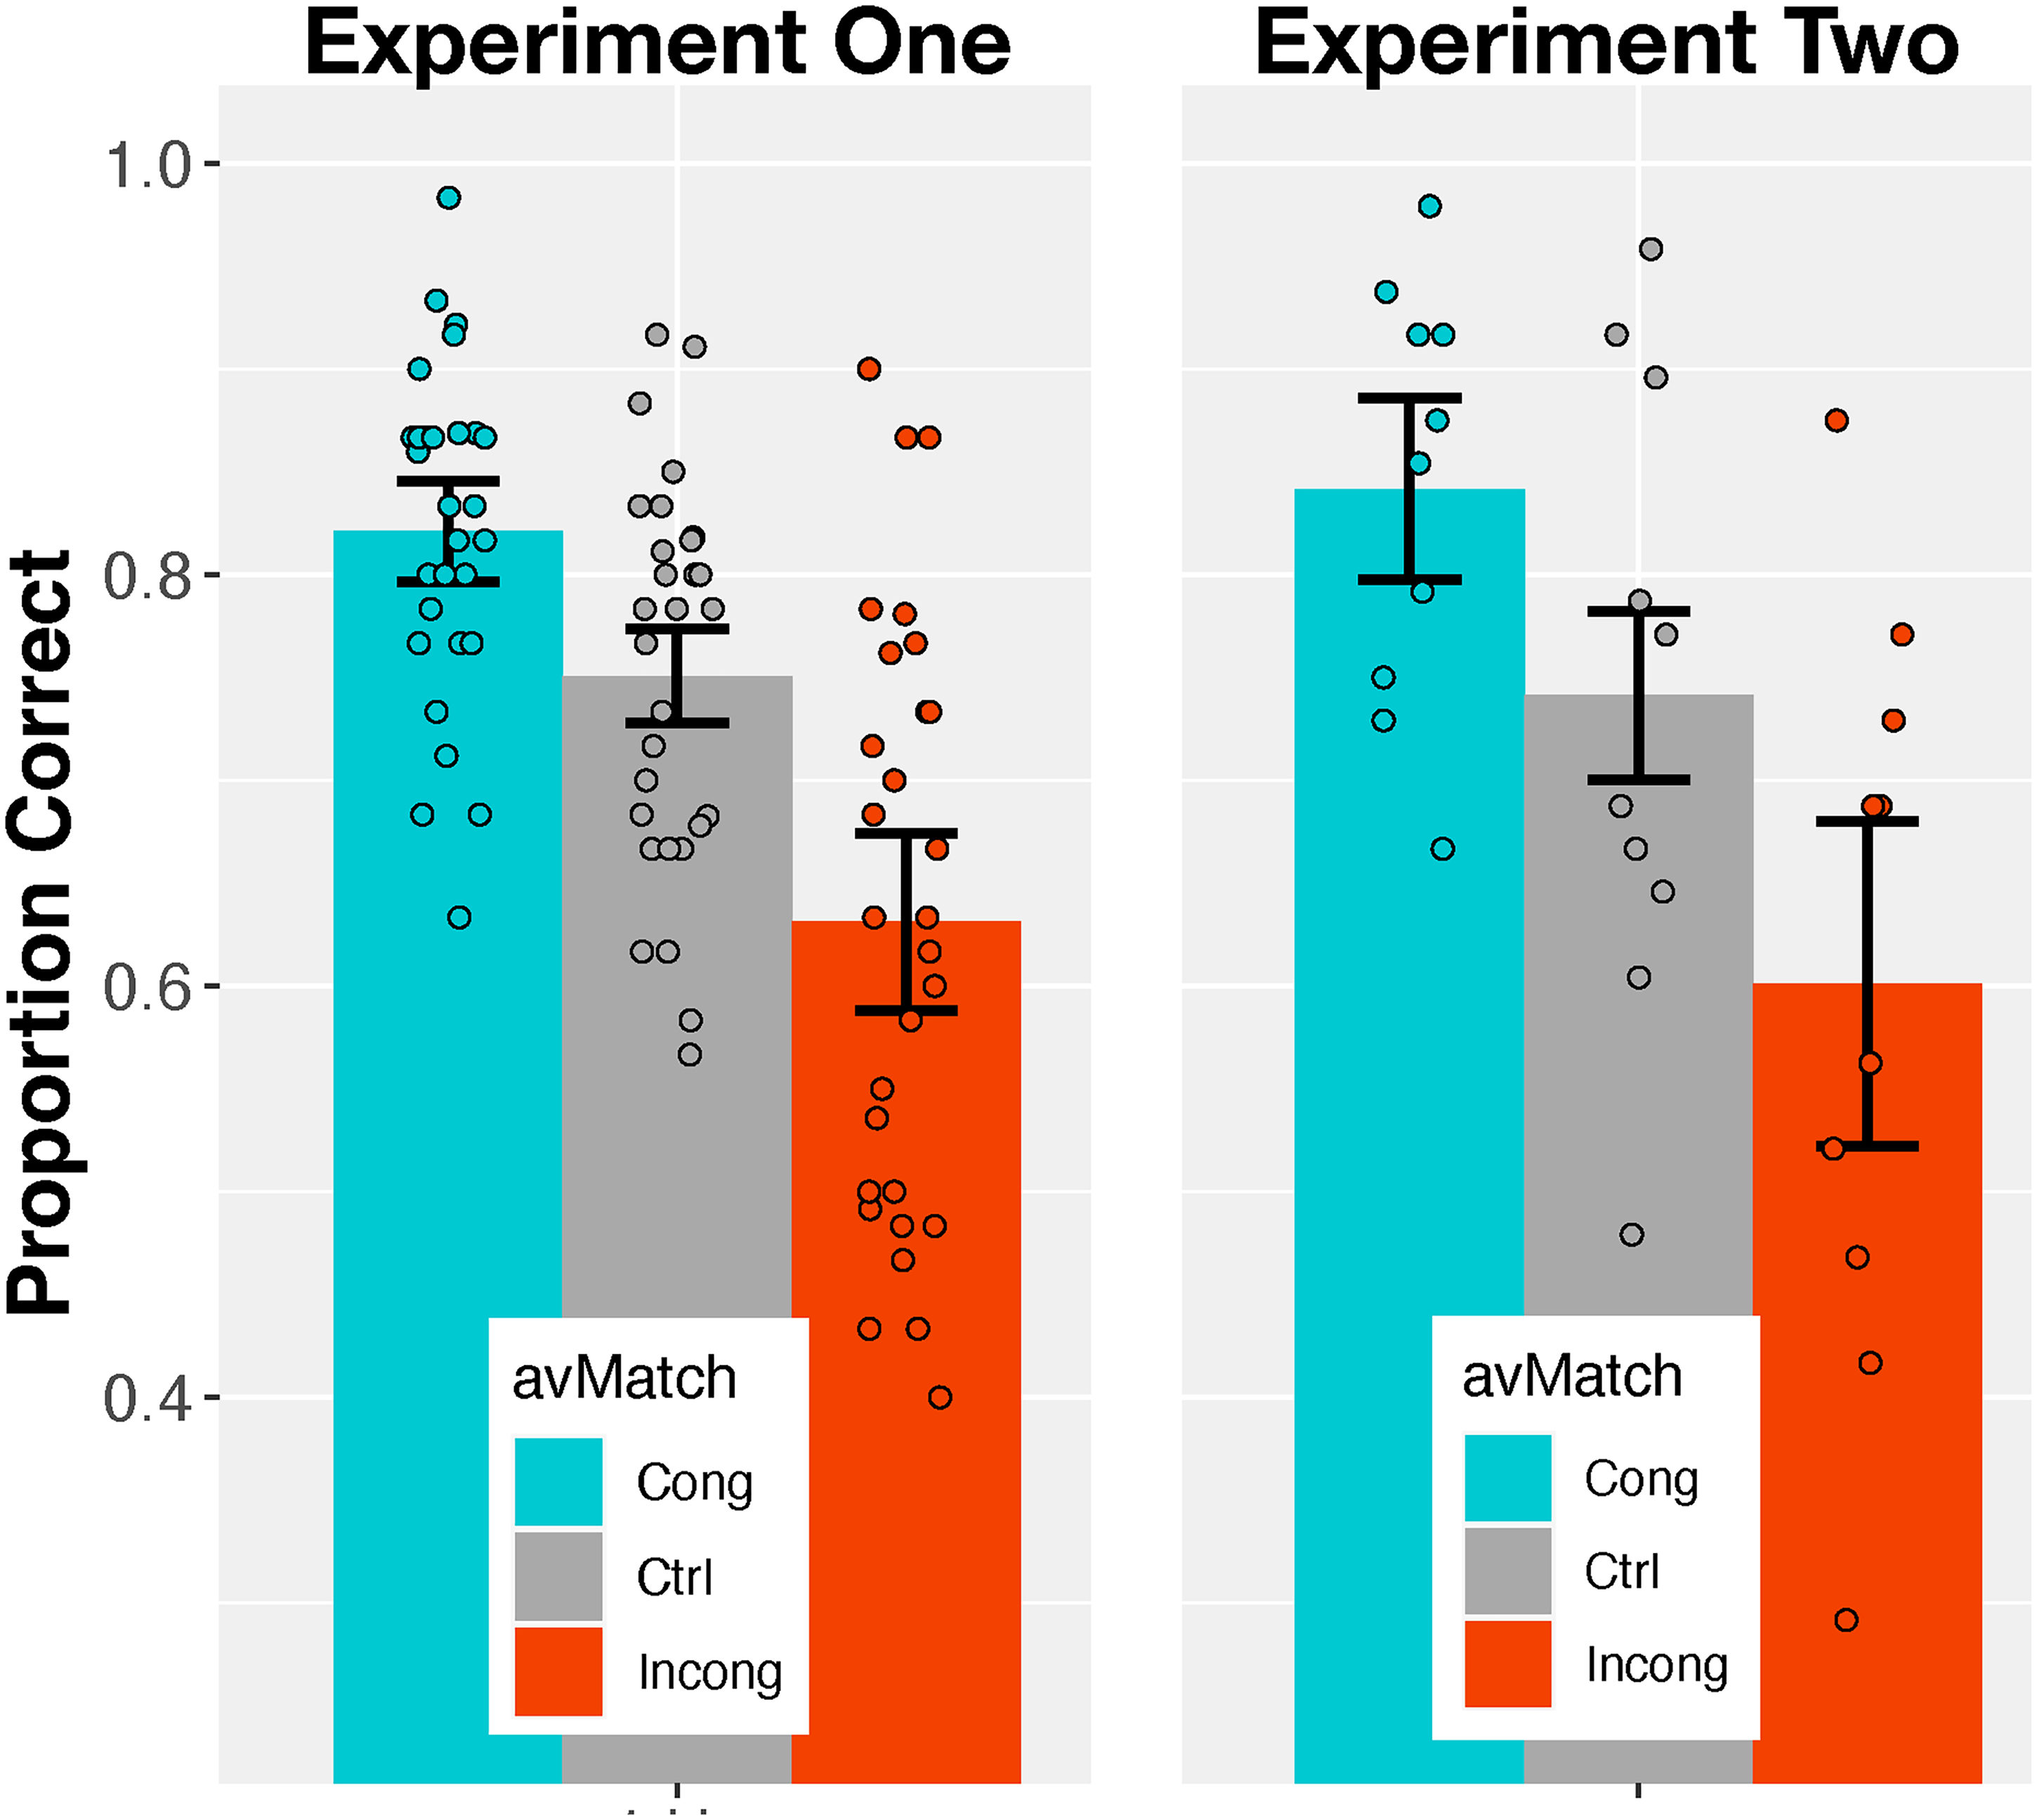
Figure 1 shows how accuracy of categorization varied with frequency difference,
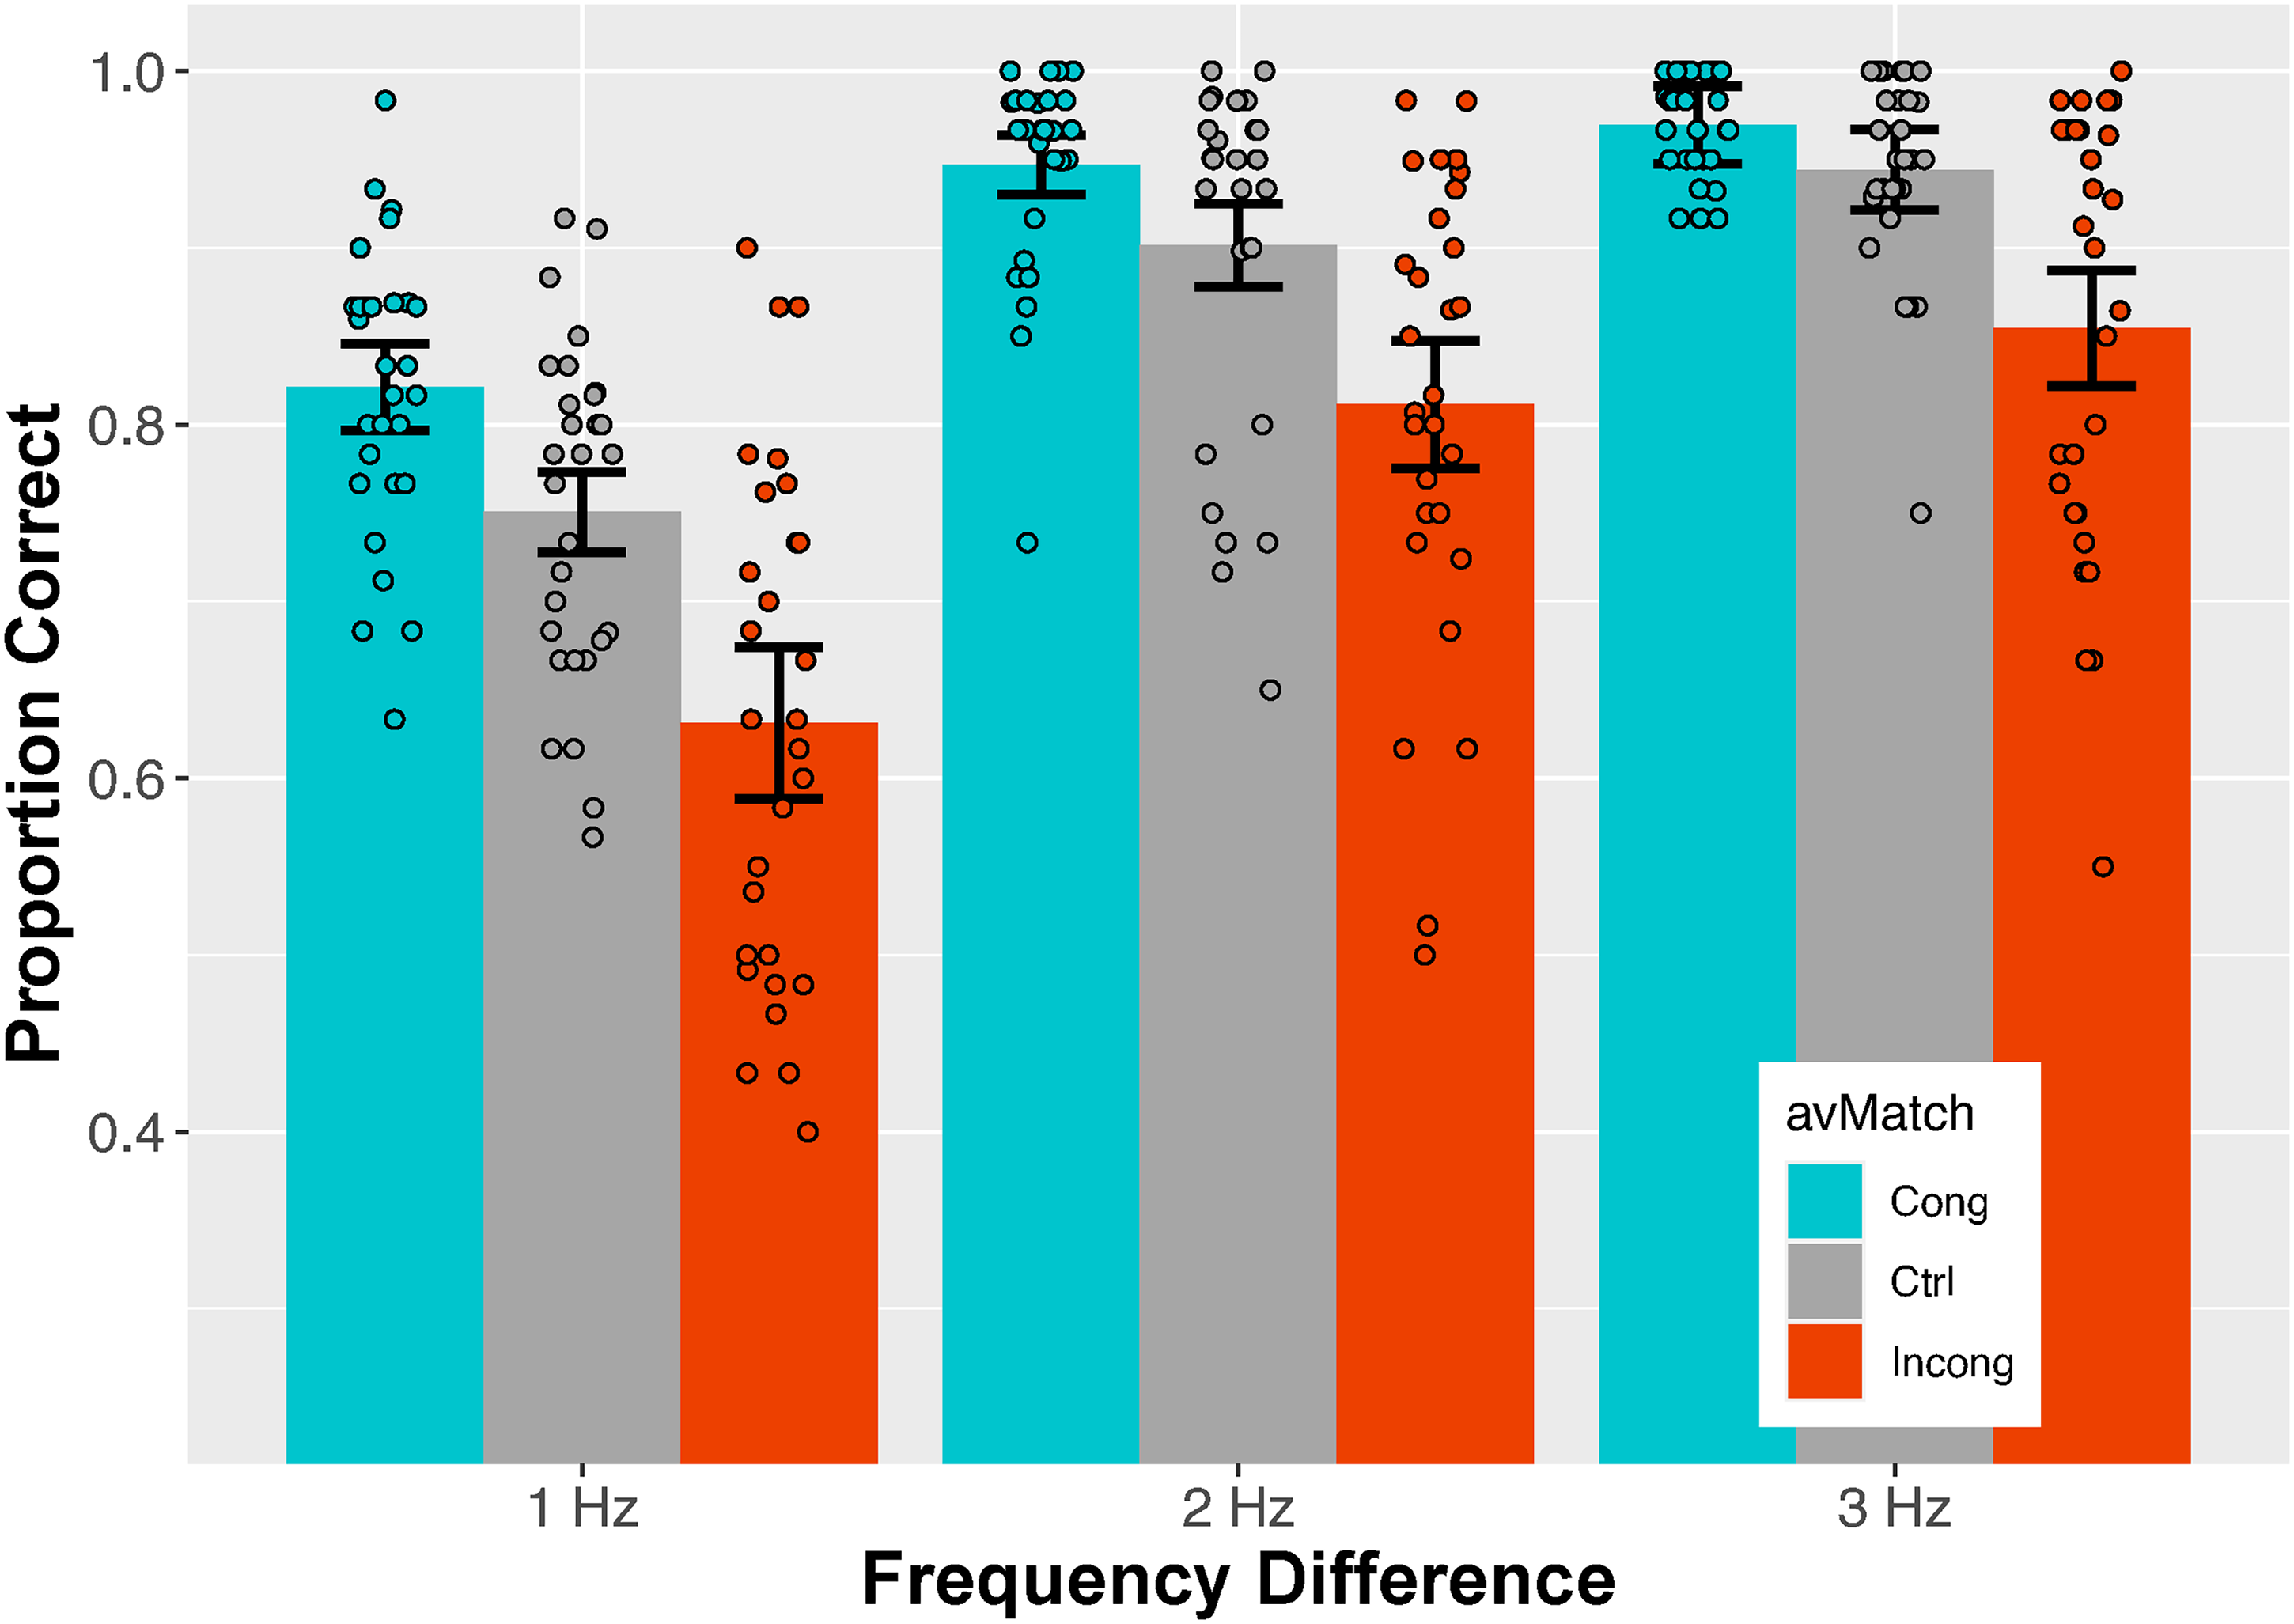
Categorization accuracy for various combinations of (i) difference between the high and low modulation frequencies, which also determines the difference between visual and auditory modulation frequencies on Incongruent trials, and (ii) three classes of audiovisual match. Each error bar spans the 95% confidence interval. Data points represent individual subjects.
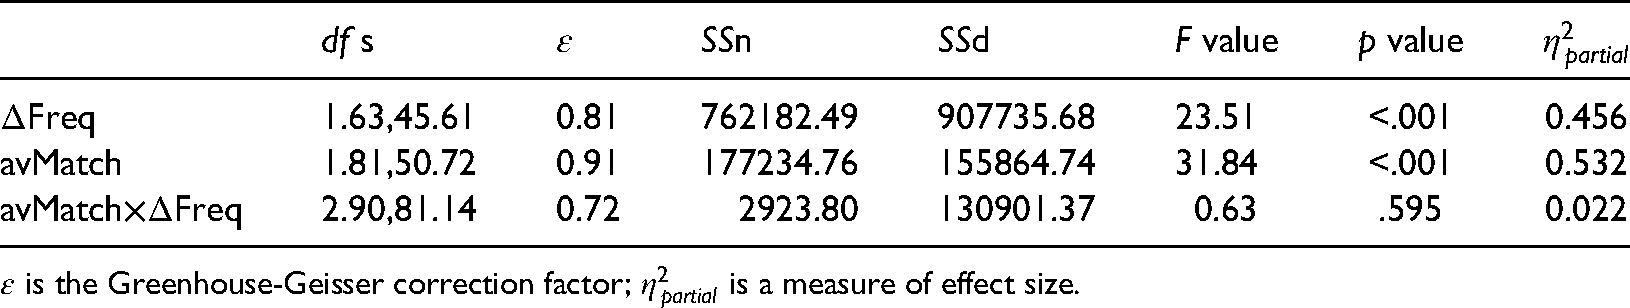
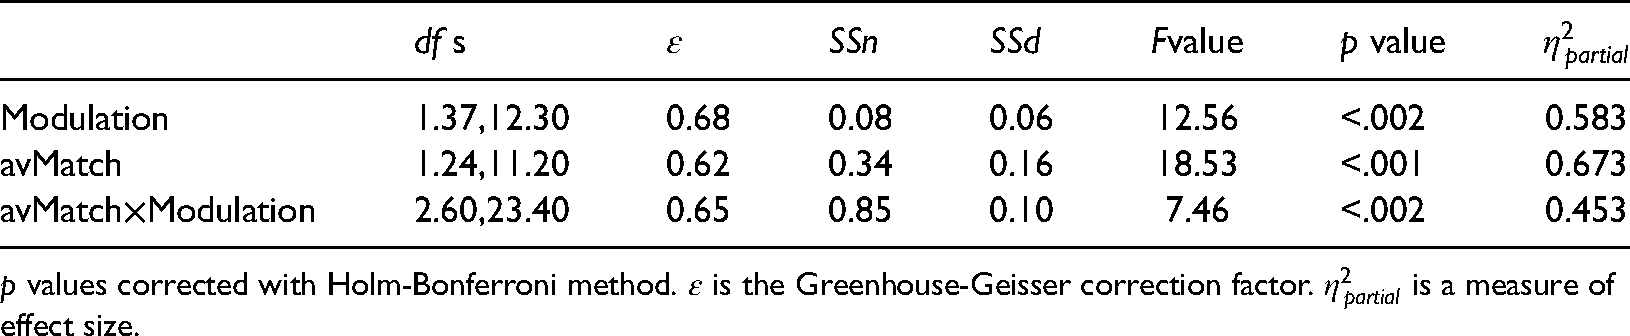
Analysis of Variance (ANOVA) on Accuracy in Experiment One

As the Introduction explained, we were interested in resolving discrepancies among previous experiments. This interest lent special importance to the interaction between avMatch and
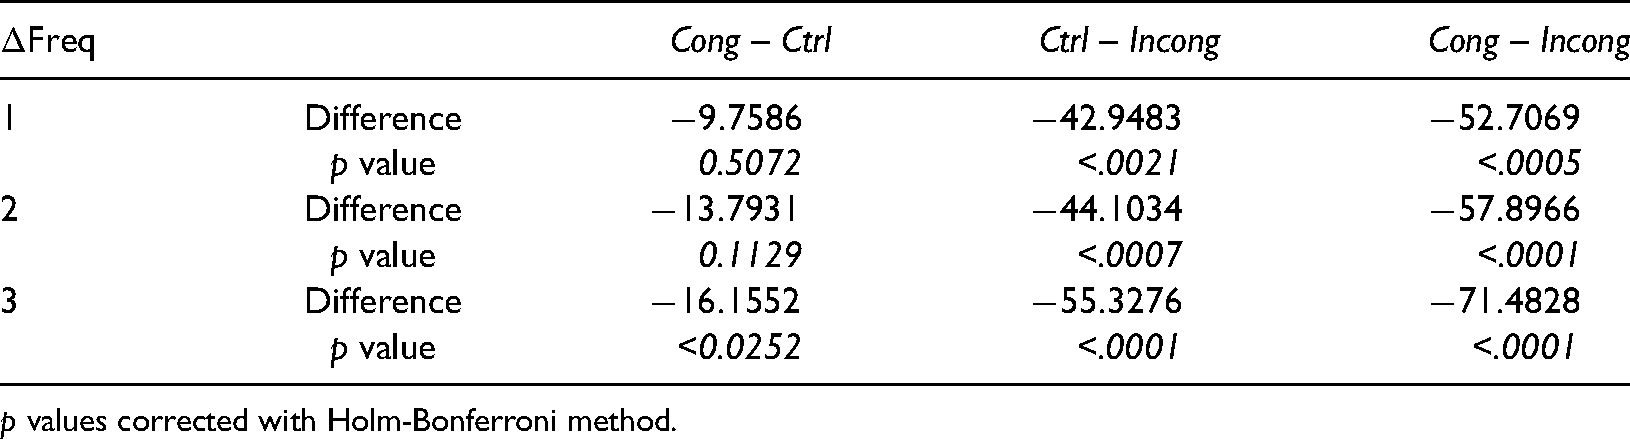
Table 4 shows the resulting pairwise comparisons within each level of
Because categorization was so accurate for many subjects, particularly at
Select Pairwise Differences From Experiment One: Accuracy Results
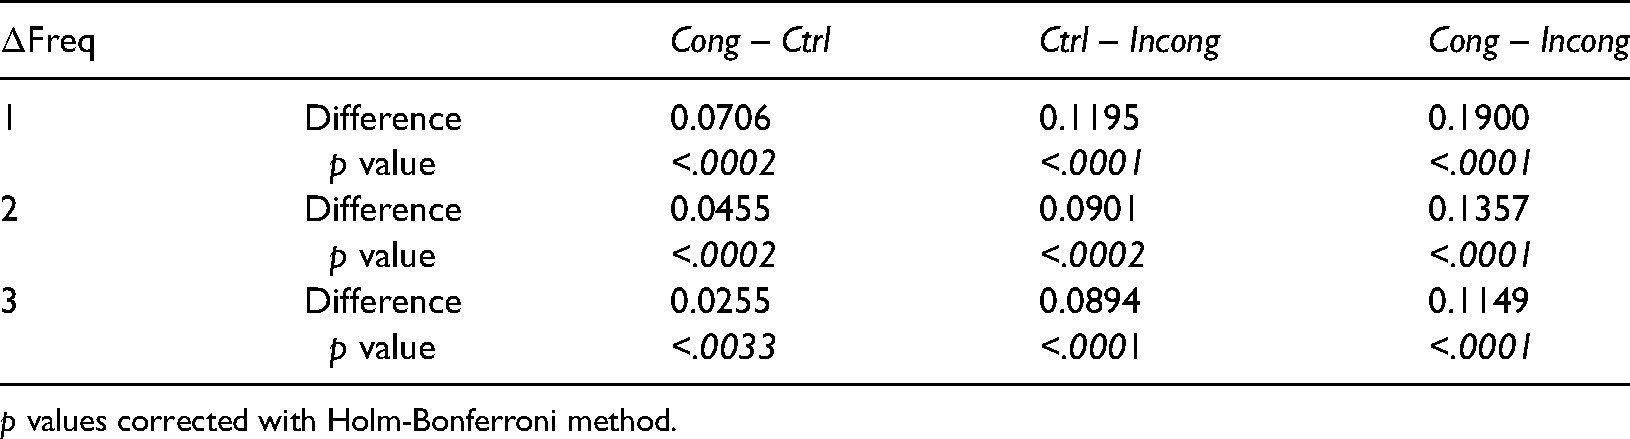
p values corrected with Holm-Bonferroni method.
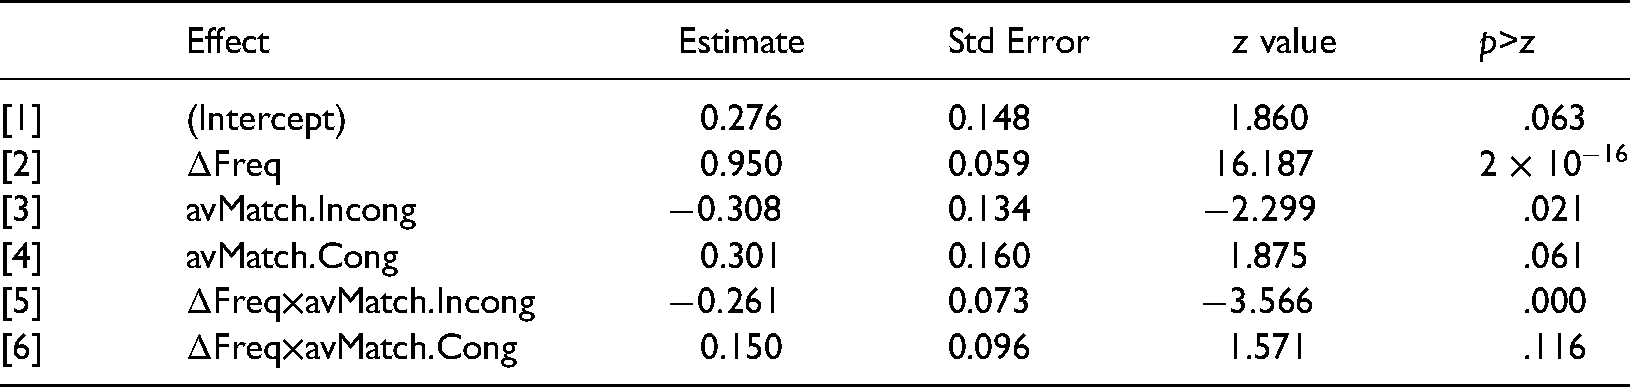
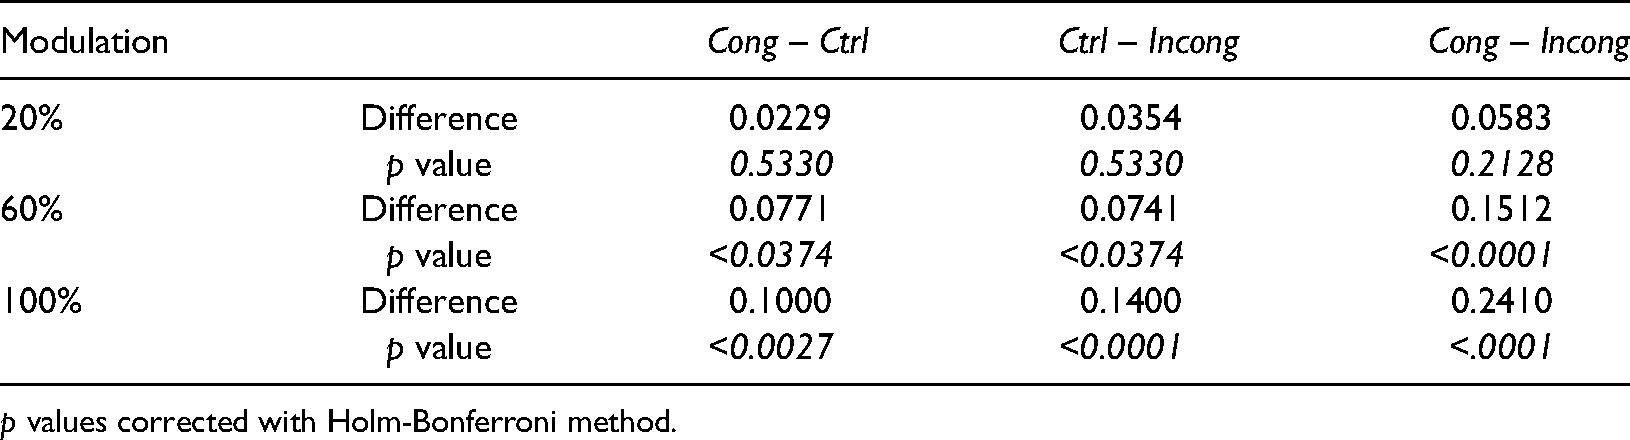
The generalized linear model included a random subject-dependent intercept, six fixed effects, and a term for residual variance. Table 5 includes the subject-dependent intercept (term [1]) along with the fixed effects, and gives the results associated with each. A note of explanation may be helpful in interpreting the table. When lme4’s glmer() routine includes a factor, e.g., avMatch, its levels are evaluated relative to a single, designated reference level, by default the level that would be first alphabetically. Because the Control condition seemed a more natural reference category, we forced the model to reference other categories to it.
Summary of GLMER for Experiment 1: Accuracy data
Fixed effect
In Table 5, term [1] shows a significant subject-dependent intercept, reflecting the fact that subjects differ from one another in overall accuracy. Term [2] shows that
As just mentioned, the GLMER showed a significant interaction, but only for the difference between Control and Incongruent conditions. To check the importance of including an interaction term in model, we recomputed the model, this time omitting the interaction between the two fixed variables. Note that the model with the interaction had two more degrees of freedom than the model without. We then compared the two nested models with an analysis of variance. The result,
Results: Response Times
As explained in the “Introduction” section, our principal focus was on how accurately subjects categorized visual modulation frequency under various conditions. Although response times held just secondary interest, for sake of completeness, we decided to supplement the analysis of accuracy by examining response times as well. The analysis was based on subjects’ median response time in each condition, considering only trials on which the response was correct. Figure 2 shows results for individual subjects in each condition. Table 6 presents a corresponding, within-subject repeated measures ANOVA. Both main effects, the types of avMatch and values of
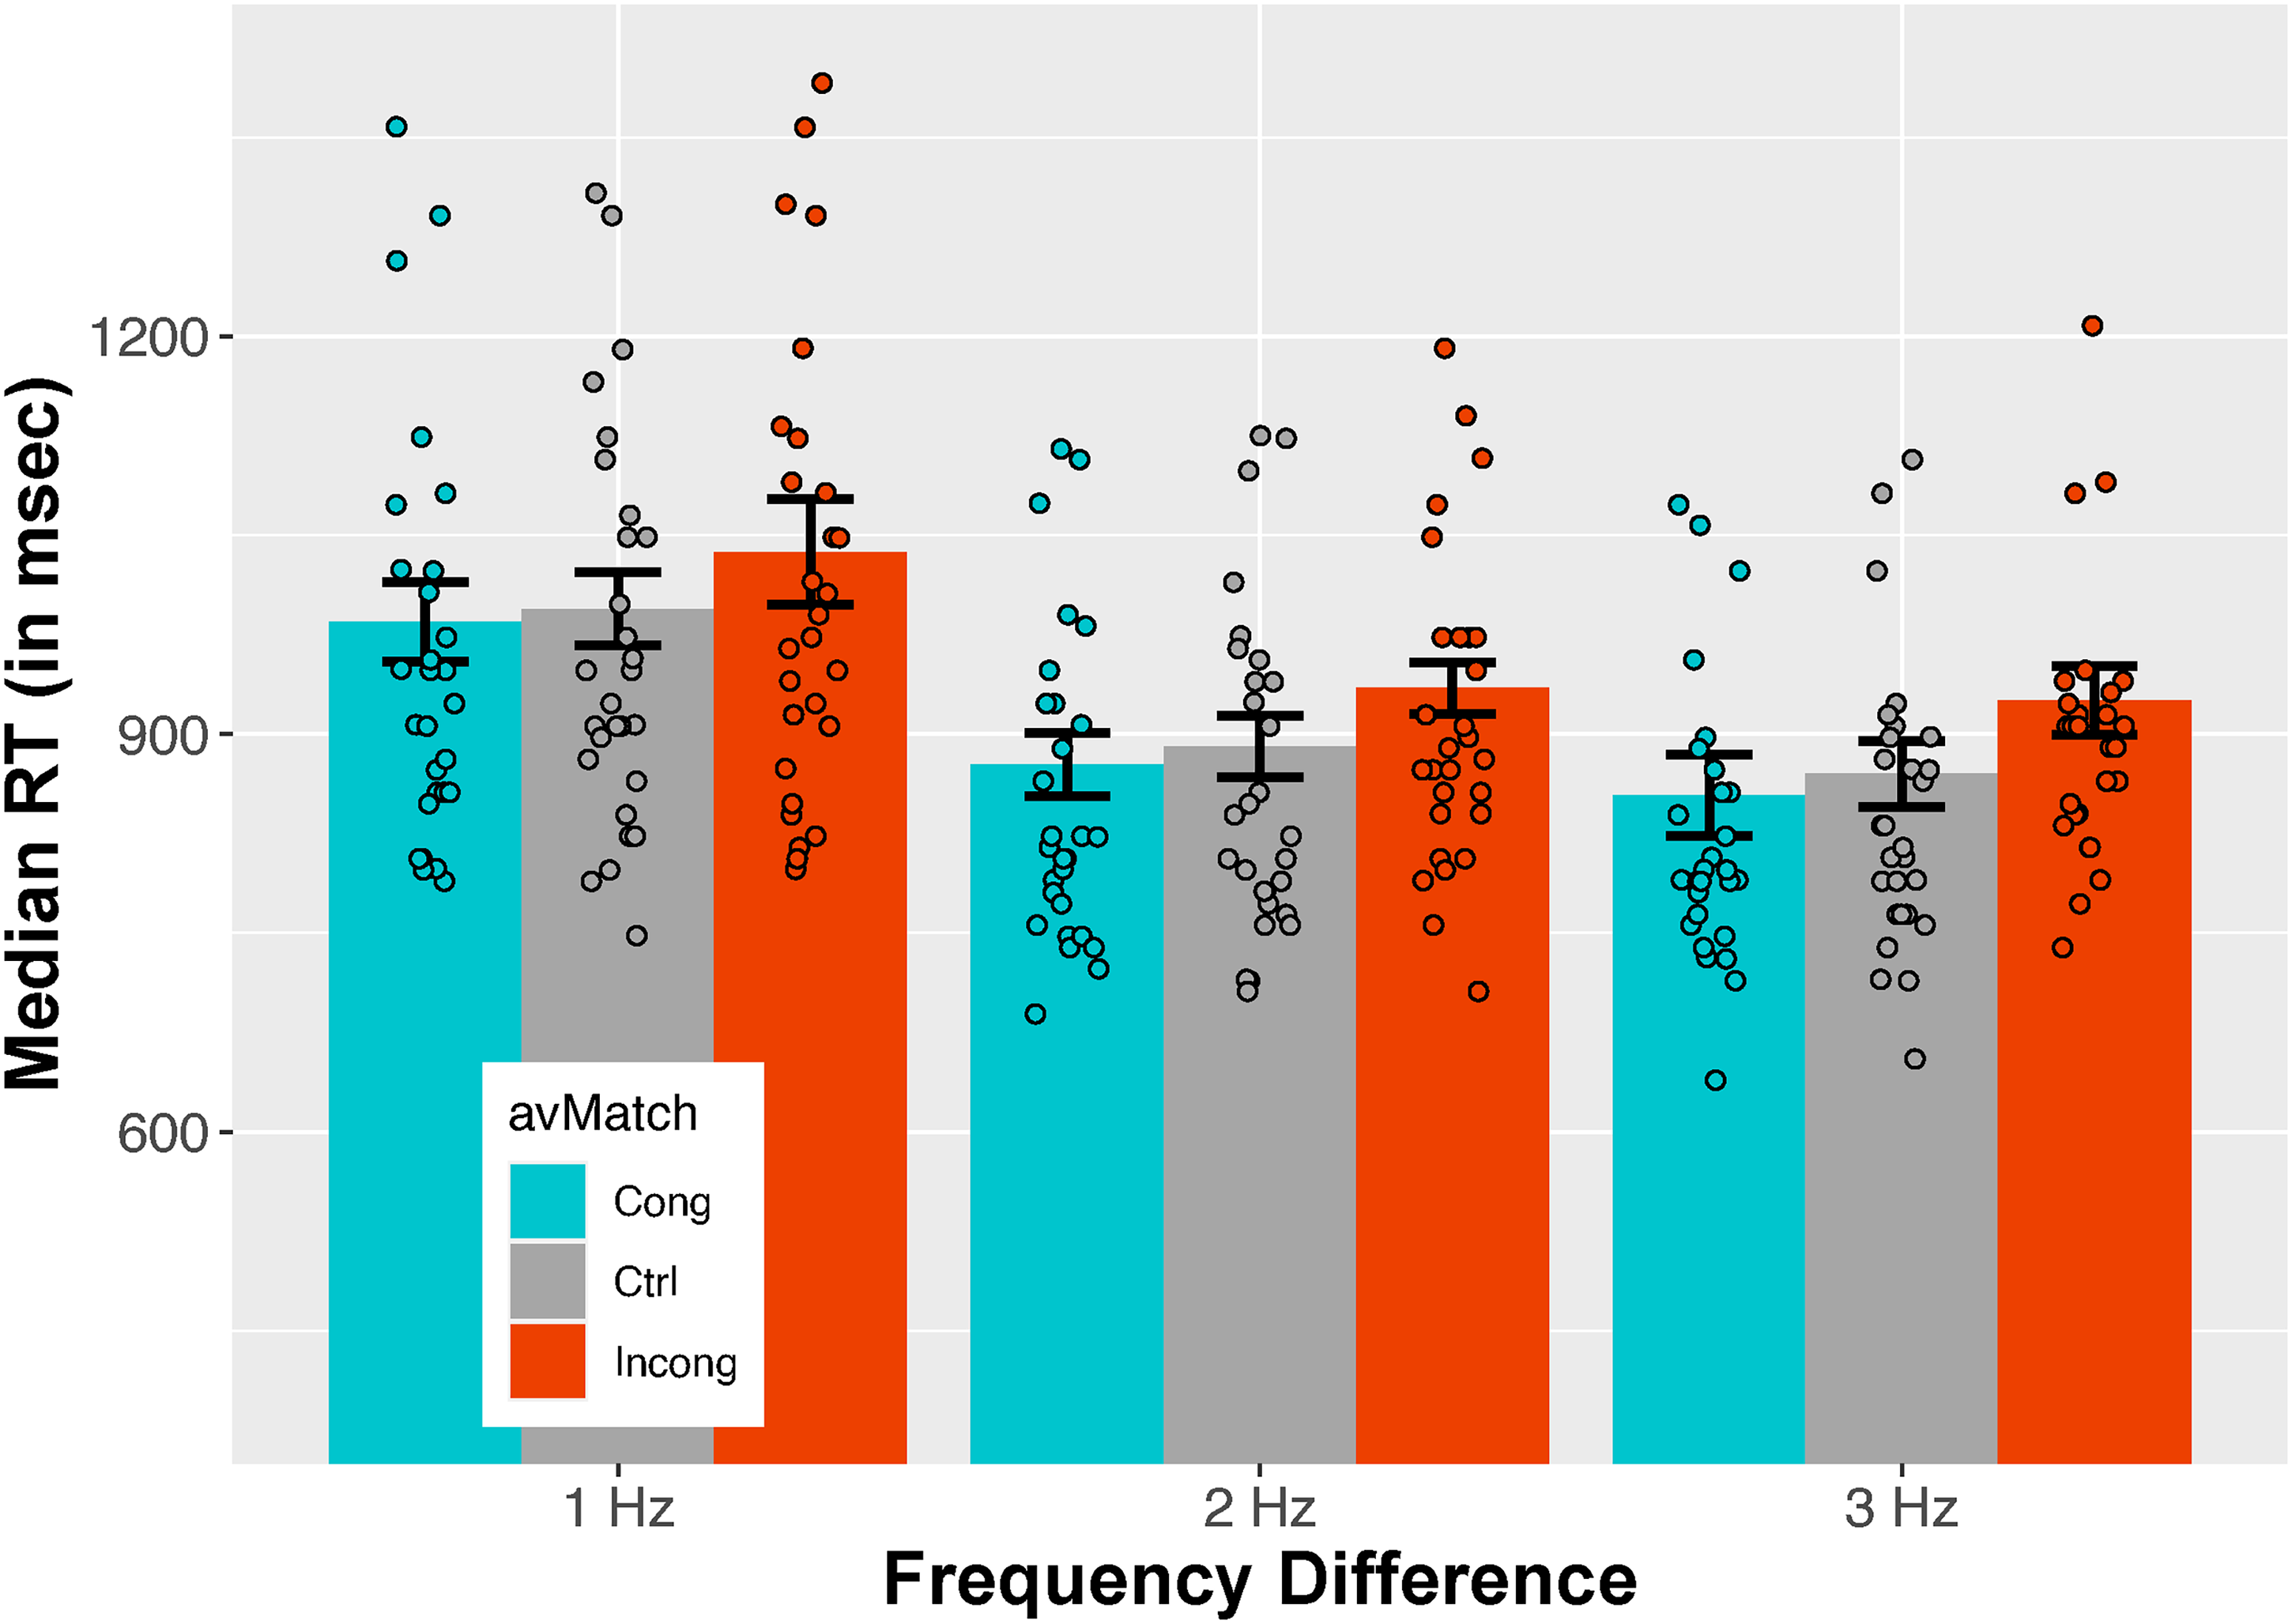
Response times for various combinations of (i) the difference on Incongruent trials between modulation frequencies of the visual stimulus and auditory stimulus, and (ii) three classes of audiovisual match. Each error bar spans the 95% confidence interval. Data points represent individual subjects.
Analysius of Variance (ANOVA) on Response Times in Experiment One
Select Pairwise Differences From Experiment One: Response times
p values corrected with Holm-Bonferroni method.
Experiment One focused on
Experiment Two
The task-irrelevant auditory stimulus in Experiment One was modulated at 100%, a higher value than in most previous experiments with the Fish Police!! protocol: 25% in (Sun et al., 2017) and in (Sun and Sekuler, 2021), and 50% in (Varghese et al., 2017). Experiment One showed that with
Subjects
Ten Brandeis undergraduate and graduate students, nine female. participated in this experiment. Four subjects had participated in Experiment One. Each subject received $10 for participation. Visual acuity was again measured using the ETDRS vision chart at a view distance of 60 cm (Rosser et al., 2001). Subjects had normal or corrected-to-normal logMar visual acuity (
Stimuli
Except for the following changes, the experiment used the same apparatus, task, and testing environment as Experiment One. For the amplitude modulated sound, two new modulation depths (60% and 20%) were added to the 100% modulation carried over from Experiment One. Throughout,
Procedure
In Experiment Two, the task irrelevant auditory stimulus’ modulation depth varied between blocks in block-randomized fashion.
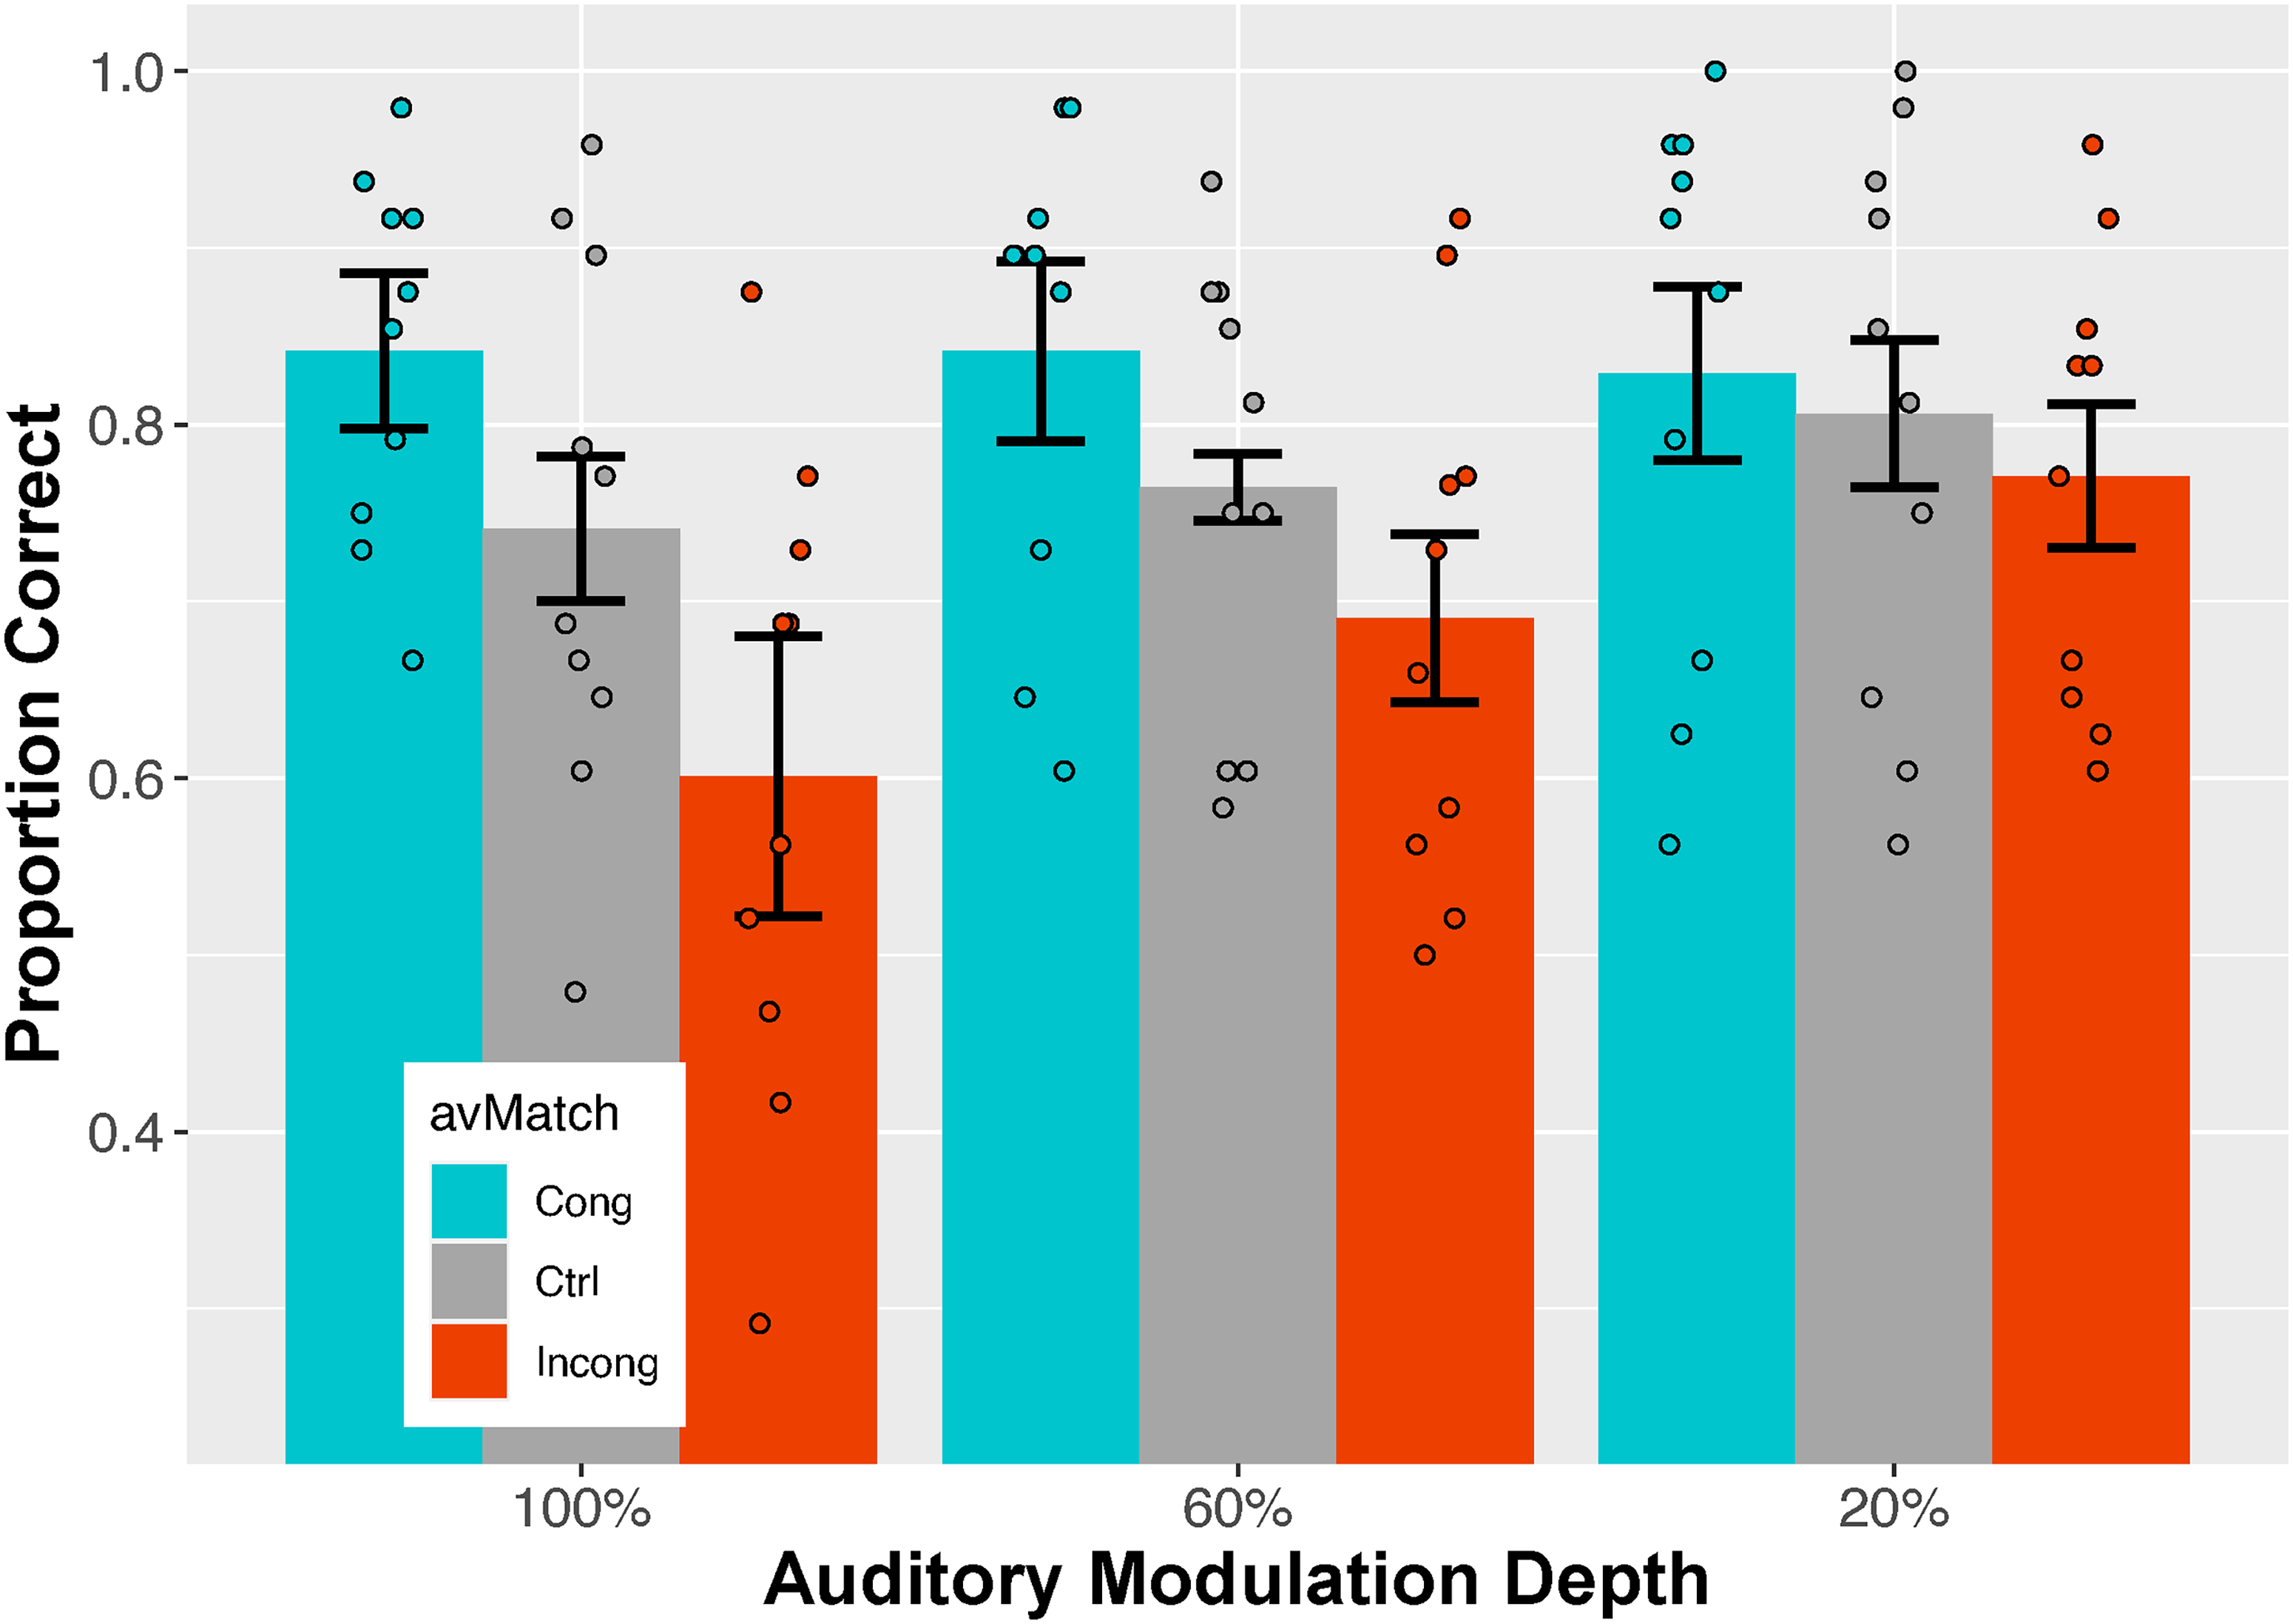
Results: Response Accuracy
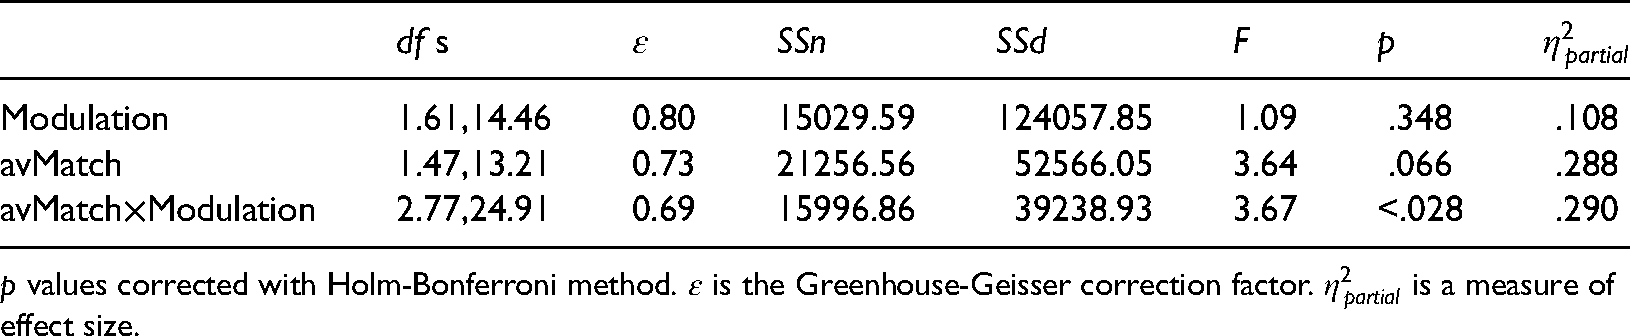
Figure 3 shows mean categorization accuracy for individual subjects as a function of the strength (modulation depth) of the concurrent auditory stimulus. Within each level of modulation depth, results are separated according to the category of avMatch. As a reminder, these were Congruent (both stimuli modulating in phase at the same frequency), Control (the auditory stimulus was unmodulated), and Incongruent (the visual and auditory stimuli modulated at frequencies that differed by one Hz). Table 8 summarizes the results of an ANOVA on subjects’ mean accuracy data. Both main effects and the interaction between them were statistically significant.
Categorization accuracy for various combinations of (i) the difference on Incongruent trials between modulation frequencies of the visual stimulus and auditory stimulus, and (ii) three classes of audiovisual match.
ANOVA on Accuracy Results From Experiment Two
p values corrected with Holm-Bonferroni method.
To uncover the components of the significant interaction between Modulation and avMatch, we examined pairwise differences between categories of avMatch within each level of Modulation. The results are summarized in Table 9. The table reveals a strong connection between depth of modulation and differences among types of avMatch. Not only are there no reliable differences at the lowest level of Modulation (20%), but also pairwise differences between avMatch categories increase systematically with Modulation depth.
Select Pairwise Differences From Experiment Two: Accuracy Results
p values corrected with Holm-Bonferroni method.
As was the case in Experiment One, several subjects’ accuracy in some conditions approached the limit of measurable performance (a ceiling effect). To guard against the possibility that this was primarily responsible for the significant interaction in the ANOVA, we applied a generalized linear mixed model to Experiment Two’s trial-by-trial accuracy data. The model included a random, subject-dependent intercept, six main and interaction fixed effects, and a term for residual variance. Table 10 gives the results associated with each term. Term
Summary of GLMER for Experiment 2: Accuracy Data

Table 10 summarizes the regression’s results. First, the depth of modulation of the task-irrelevant auditory stimulus (Term [2]) was statistically reliable. Although neither comparison involving avMatch ([3, 4]) was significant, both interactions involving avMatch and depth of modulation were ([5, 6]). This last result is consistent with the finding shown in Table 9 that differences among categories of avMatch vary with the depth of auditory stimulus’ Modulation.
In order to unpack the interaction terms in Table 10, we followed up with three post hoc GLMERs, one for each Modulation depth. The analyses treated avMatch as a fixed effect and individual subjects as a random effect. The results are summarized in Table 11, which omits the signifiicant intercept value from each GLMER. Note first the opposite signs associated with estimates for the contrasts at each Modulation level: they confirm what was already discussed, namely, that, compared to the Control condition, the Incongruent auditory stimulus reduced accuracy, while the Congruent auditory stimulus increased it. Moreover, the effect of avMatch tended to increase with modulation depth, which is consistent with what can be seen in Figure 3. Finally, at the weakest Modulation of the task-irrelevant auditory stimulus (20%), avMatch had negligible effect, with neither contrast against the Control condition approaching statistical significance.
Summary of GLMERs for separate Modulation levels
Results: Response Times
Taking the same approach as for Experiment One, we next examined subjects’ response times on correct trials. The data were each subject’s median response time in each condition. Figure 4 shows each condition’s results for individual subjects along with their mean and 95% confidence intervals.

Median response times for various combinations of (i) the difference on Incongruent trials between modulation frequencies of the visual stimulus and auditory stimulus, and (ii) three classes of audiovisual match.
Table 12 summarizes an ANOVA on subjects’ median response times from correct trials. Neither Modulation depth nor type of avMatch had a significant effect on speed of response, although their interaction did. As in Experiment One, we followed up the ANOVA by examining select pairwise differences. In particular, we restricted the focus to pairs within the same level of Modulation depth; Table 13 shows the result. Only at the highest Modulation did any pairwise response time comparison reach statistical significance. Interestingly, with that highest modulation (100%), response times in the Incongruent condition were significantly slower than in the Control condition, but times in the Congruent condition were not.
ANOVA on Response Time Results From Experiment Two
p values corrected with Holm-Bonferroni method.
Select Pairwise Differences From Experiment Two: Response Time Results

p values corrected with Holm-Bonferroni method.
Discussion and Conclusions
Our experiments show that categorizing the rate of size modulation is affected by both
The accuracy results from Experiments One and Two go some way toward explaining many of the discrepancies among previous applications of Fish Police!! (shown in Table 1). Extrapolating from our results, combining small
Experiments One and Two had a single condition in common: both included a condition in which
Our experiments showed that audiovisual interaction depends on the degree of mismatch between auditory and visual signals and on the modulation depth of a task-irrelevant sound. Both variables have counterparts in the interference seen in multi-speaker environments and in other noisy settings. Interference with speech reception depends upon the similarity between the characteristics of a speaker’s voice and speech, on one hand, and the characteristics of irrelevant, background speech or noise, on the other Brungart and Simpson (2002, 2007); interference also depends upon the relative loudness of the irrelevant background speech or noise (Rhebergen et al., 2008). Of course, to understand audiovisual interference fully, many other variables need to be considered, including ones not usually considered in perception or in decision-making research. As one example, shortening the interval between successive trials in Fish Police!! severely disrupts performance (Sun and Sekuler, 2021). This disruption was disproportionately large on Incongruent trials, perhaps mediated by diminished capacity to engage selective attention. Interestingly, the effect is accompanied by (i) heightened autonomic activation and (ii) self-reports of increased stress. Shrinking the interval between trials without altering other aspects of an experiment, also disrupts performance on Eriksen’s Flanker Task, especially on trials most dependent on selective attention (Sussman et al., 2021). It would be worthwhile to explore these seemingly parallel effects from the Flanker Task and Fish Police!! to determine what, if any, shared mechanisms may be behind the reduced accuracy seen in both.
Although a temporal correlation between auditory and visual stimuli usually benefits performance, that is not always true. Consider a case in which subjects’ task was very different from the one in our experiments. Strand et al. (2020) presented listeners with a disc whose size fluctuations were synchronized to amplitude variations in spoken sentences or words. The visual stimulus, then, provided information that tracked the acoustic envelope of what subjects were hearing. The presence of the dynamic disc led subjects report that the speech recognition task was easier, but paradoxically, it failed to improve recognition of the speech stimuli. Strand et al. speculated that the disc had been distracting while not providing sufficient phonetic detail information to aid task performance.
On Fish Police!!’s Incongruent trials discounting the frequency of the task-irrelevant auditory stimulus requires that subjects filter out some or all of that task-irrelevant information. Otherwise, the auditory stimulus could influence or even dominate judgments of visual frequency. Ineffective or incomplete filtering would allow the task-irrelevant stimulus to reduce accuracy and lengthen response times relative to the other conditions. The fact that accuracy on Incongruent trials tended to fall below that of other trials suggests that filtering was imperfect. Experiment One showed that filtering became less effective as the target visual stimulus and the irrelevant auditory stimulus grew more similar; Experiment Two showed that filtering became less effective when the task-irrelevant auditory stimulus was stronger, that is, when its modulation was greater. These effects fit well with what is known about selective attention (Carrasco, 2011).
The random intermixing of Congruent, Control, and Incongruent trials kept subjects from knowing before the trial what stimulus type would be presented. That temporal unpredictability was different from what is encountered when competing background speech or noise were relatively constant over extended periods. As a result, our task might demand more transient selective attentional than what would be called for in some common situations, like a noisy restaurant whose background din may be relatively constant over time. To bring selective attention online in Fish Police!!, subjects had to detect the presence of an audiovisual mismatch in real time, preferably early in the stimulus. To identify a possible marker of that detection process, Sun and Sekuler (2021) measured scalp electroencephalographic signals while subjects were playing Fish Police!!. When concurrent auditory and visual stimuli were mismatched in frequency (that is, on Incongruent trials), a large transient increase in theta band (4–8 Hz) power was seen
Footnotes
Acknowledgements
The authors thank Mercedes B. Villalonga, Long Yi, and Professor Xiaodong Liu for very helpful advice at various stages of this project. Jaiyue Tai: ORCID orcid.org/0000-0003-3624-9556; Jack Forrester: ORCID orcid.org/0000-0001-9755-6854; Robert Sekuler: ORCID orcid.org/0000-0002-2519-4943. Raw data for each experiment and the R code used to analyze the data have been published to the Open Source Foundation repository.
Declaration of conflicting interests
The authors declared no potential conflicts of interest with respect to the research, authorship and/or publication of this article.
Funding
The authors disclosed receipt of the following financial support for the research, authorship, and/or publication of this article: This work was supported in part by the National Science Foundation (Center for Excellence in Education, Science, and Technology). JT was supported by Brandeis’ Provost Research fund.