



Abstract
Audiovisual integrations and interactions happen everywhere, including in music concerts, where combined visual and auditory perception contributes to overall enjoyment. Thirty-three participants evaluated their overall subjective preference at various seats in four virtual auditoria, which comprised congruent and incongruent auditory and visual renders of two auditoria that differ only in size. Results show no significant difference between participants who completed the experiment in a fully calibrated and standardized laboratory environment and participants who completed remotely using various VR equipment in various environments. Both visual and auditory auditorium size have significant main effects, but no interaction. The larger hall is preferred for both conditions. Audiovisual congruency does not significantly affect preference.
Concert auditoria are a context where visual and auditory sensory input combine through architecture and performance. While most studies of auditorium quality focus on sound alone, this is a context where multisensory studies could provide useful insights. The last two decades has seen a boom in multisensory research which has revealed the extent to which sensory experience is inherently multisensory at both neural and perceptual levels (Alais et al., 2010). Sensory signals for sight, sound, and touch are integrated very early in a subcortical structure called the superior colliculus, before they arrive in the brain at their respective primary sensory cortices (Stein & Meredith, 1993). Once in the cortex, the primary sensory regions once thought to be unisensory are now known to interact through anatomical links before converging on a host of multisensory cortical areas at higher levels (Ghazanfar & Schroeder, 2006; Murray & Wallace, 2012). The perceptual consequences of this rich multisensory interaction are considerable. For example, perception of vision and sound is improved in sensitivity and precision when the signals are synchronized and from a common origin (Alais & Burr, 2004; Frassinetti et al., 2002). Importantly, studies of the multisensory cortex show that audiovisual integration requires more than just blindly applying a spatial and temporal coincidence rule: stimuli must be congruent to trigger audiovisual integration. That is, video of an action must be paired with the appropriate sound of the action (Barraclough et al., 2005). For example, video of a violinist bowing the strings would not trigger integration if paired with sound of a drum roll on the tympani.
Recent theories of perception view the brain as a Bayesian predictive process that uses prior probability distributions to model the world and generate expectations and predictions (Clark, 2013; Knill & Pouget, 2004). These predictions originate from high-level, multisensory brain regions and thus perception is shaped at all times by top-down, multisensory input. For example, upon entering a large auditorium, vision of its vast expanse leads to a strong expectation that sounds will be highly reverberant—a prediction built upon years of experience and stored knowledge about the relationship between visual space and reverberation. Expectations are surprisingly powerful in shaping a host of perceptual experiences in all sensory modalities and there is an increasing awareness that audiovisual interactions play a role in how we experience an environment. A number of recent studies have shown audiovisual interactions in how soundscapes and landscapes are rated, with visual factors significantly influencing preferences for the sound environment (Jeon & Jo, 2020; Li & Lau, 2020).
Research into audiovisual interactions in room acoustics have mostly focused on spatial auditory perception. For example, studies have shown that perceived distance of an auditory source is more accurate and less variable with visual cues present (Calcagno et al., 2012; Zahorik, 2001), and when auditory and visual stimuli are incongruent, the combined perceived distance is affected by both (Maempel & Jentsch, 2013). Other spatial room acoustic perception attributes like perceived room size, apparent source width (ASW, also called auditory source width), or listener envelopment have also been found to be affected by visual input (Cabrera et al., 2004; Larsson et al., 2001; Maempel & Jentsch, 2013; Valente & Braasch, 2010). A recent paper (Neidhardt et al., 2022) summarized studies relating to audiovisual perceptual matching in augmented reality. On the other hand, fewer studies have addressed audiovisual factors in auditorium preferences. In two early studies on the effect of auditory and visual factors on seat preference in opera theatres using static photographs and binaural auditory renders (Jeon et al., 2008; Sato et al., 2012), significant visual effects were found. A recent study using virtual auditoria found that while concert hall interior color affects visual preference and sound level affects auditory preference, these two preferences enhanced each other (Chen & Cabrera, 2021).
Already used in a number of studies, virtual reality (VR) is still a relatively new experimental method for audiovisual research. One of its great advantages is the possibility to construct environments that would be impossible in reality, such as spaces with conflicting vision and sound. This makes VR a perfect method for manipulating auditory and visual factors in experiments. Moreover, with VR technology becoming more and more accessible at the consumer level, and the ease of online data transfer, the possibility of recruiting VR participants for remote participation in audiovisual experiments has great potential for increasing sample size and diversity. We first trialed this approach under the pressure of the COVID-19 pandemic, but the compatibility of experiments using highly controlled laboratory setups versus remote participants with differing equipment needs to be investigated for various VR experiment scenarios.
This study has two aims. First, we will use VR to examine the effect of two auditorium sizes on subjective seat preference. We do this by creating auralizations and visual renderings of two auditoria that only differ in size. All combinations are tested, creating auditoria that can be either congruent or incongruent in audiovisual terms. Seat preferences are obtained at matched locations in all audiovisual combinations. Second, we will trial the method of conducting VR audiovisual experiments of this type remotely, by comparing the results of laboratory-based participants using standard, calibrated equipment with those of remote participants using their own individual setups.
Method
Testing was done in VR with 33 volunteer participants, of which 18 participated remotely with their own VR headsets and headphones using an executable application distributed over the internet, and 15 participated in a laboratory using calibrated equipment. The participants experienced four distinct audiovisual auditorium simulations: two auditory room sizes crossed with two visual room sizes. They evaluated 18 seat locations in each auditorium simulation, of which 12 had the same relative positions to the stage. As the focus of this paper is on room size perception, only the 12 locations with the same positions are analyzed. The participants listened to orchestral music at each location and, taking into account the audiovisual environment, they rated their overall preference for each location.
Visual Stimuli
The visual environment used for the experiment was two auditorium models that were different in size but had the same materials and decorations. The smaller hall was approximately 35 m × 18 m × 12 m (length, width, height), while the larger hall was approximately 35 m × 28 m × 14 m (Figure 1). The dimensions and material layouts of smaller hall model was based on an existing auditorium, the Verbrugghen Hall at the Sydney Conservatorium of Music, a space regularly used for concerts and rehearsals of solo, ensemble, and orchestral music. A 3D static 61-piece orchestra model was also presented on the stage (Figure 1).

Example views of the visual simulations used in the experiment. Left: the smaller auditorium based on Verbrugghen Hall (35 m × 18 m × 12 m). Right: the larger auditorium (35 m × 28 m × 14 m).
The simulations were presented in head-mounted VR displays (VR headsets) using the 3D engine of Unity (Unity Technologies, 2019) with SteamVR plugin (Valve Corporation, 2019) for VR calculation. The lab-based participants used a HTC Vive VR headset with calibrated height and position. The remote participants used their own VR headsets, but they were told to ensure that the seating position was correctly centered at the start of the experiment, and use a non-moving chair if possible. Of the VR headsets used by the remote participants, 10 were HTC VR headsets, 7 were Oculus VR headsets, and 1 was Varjo VR headset.
Auditory Stimuli
The acoustic environment were simulated in ODEON (Odeon, 2020), room acoustics simulation software that can accurately calculate and recreate acoustic environments of complex 3D spaces. The acoustic simulations used the same space dimensions, surface materials, sound sources, and listening positions as the visual simulations. The absorption coefficients of the surface materials were initially chosen based on the materials used in Verbrugghen Hall (e.g., plaster walls, wooden boards on ceiling and stage, carpet auditorium floors and fabric seats), then calibrated by matching the simulated results of the smaller hall to measured results conducted at the same locations in the Verbrugghen Hall, so that the reverberation times (T15, T20, and T30) and early decay times at all seat locations were as close as possible between the measurements and simulations (4.0% mean relative difference for all octave bands between 250 and 4000 Hz). The average octave band reverberation time (T30) and its ranges in the two simulated room sizes together with the reference measurements in the Verbrugghen Hall are plotted in Figure 2. The mid-frequency reverberation time of the larger hall (2.6 s) is 0.5 s longer than that of the smaller hall (2.1 s, same as measured in the Verbrugghen Hall).
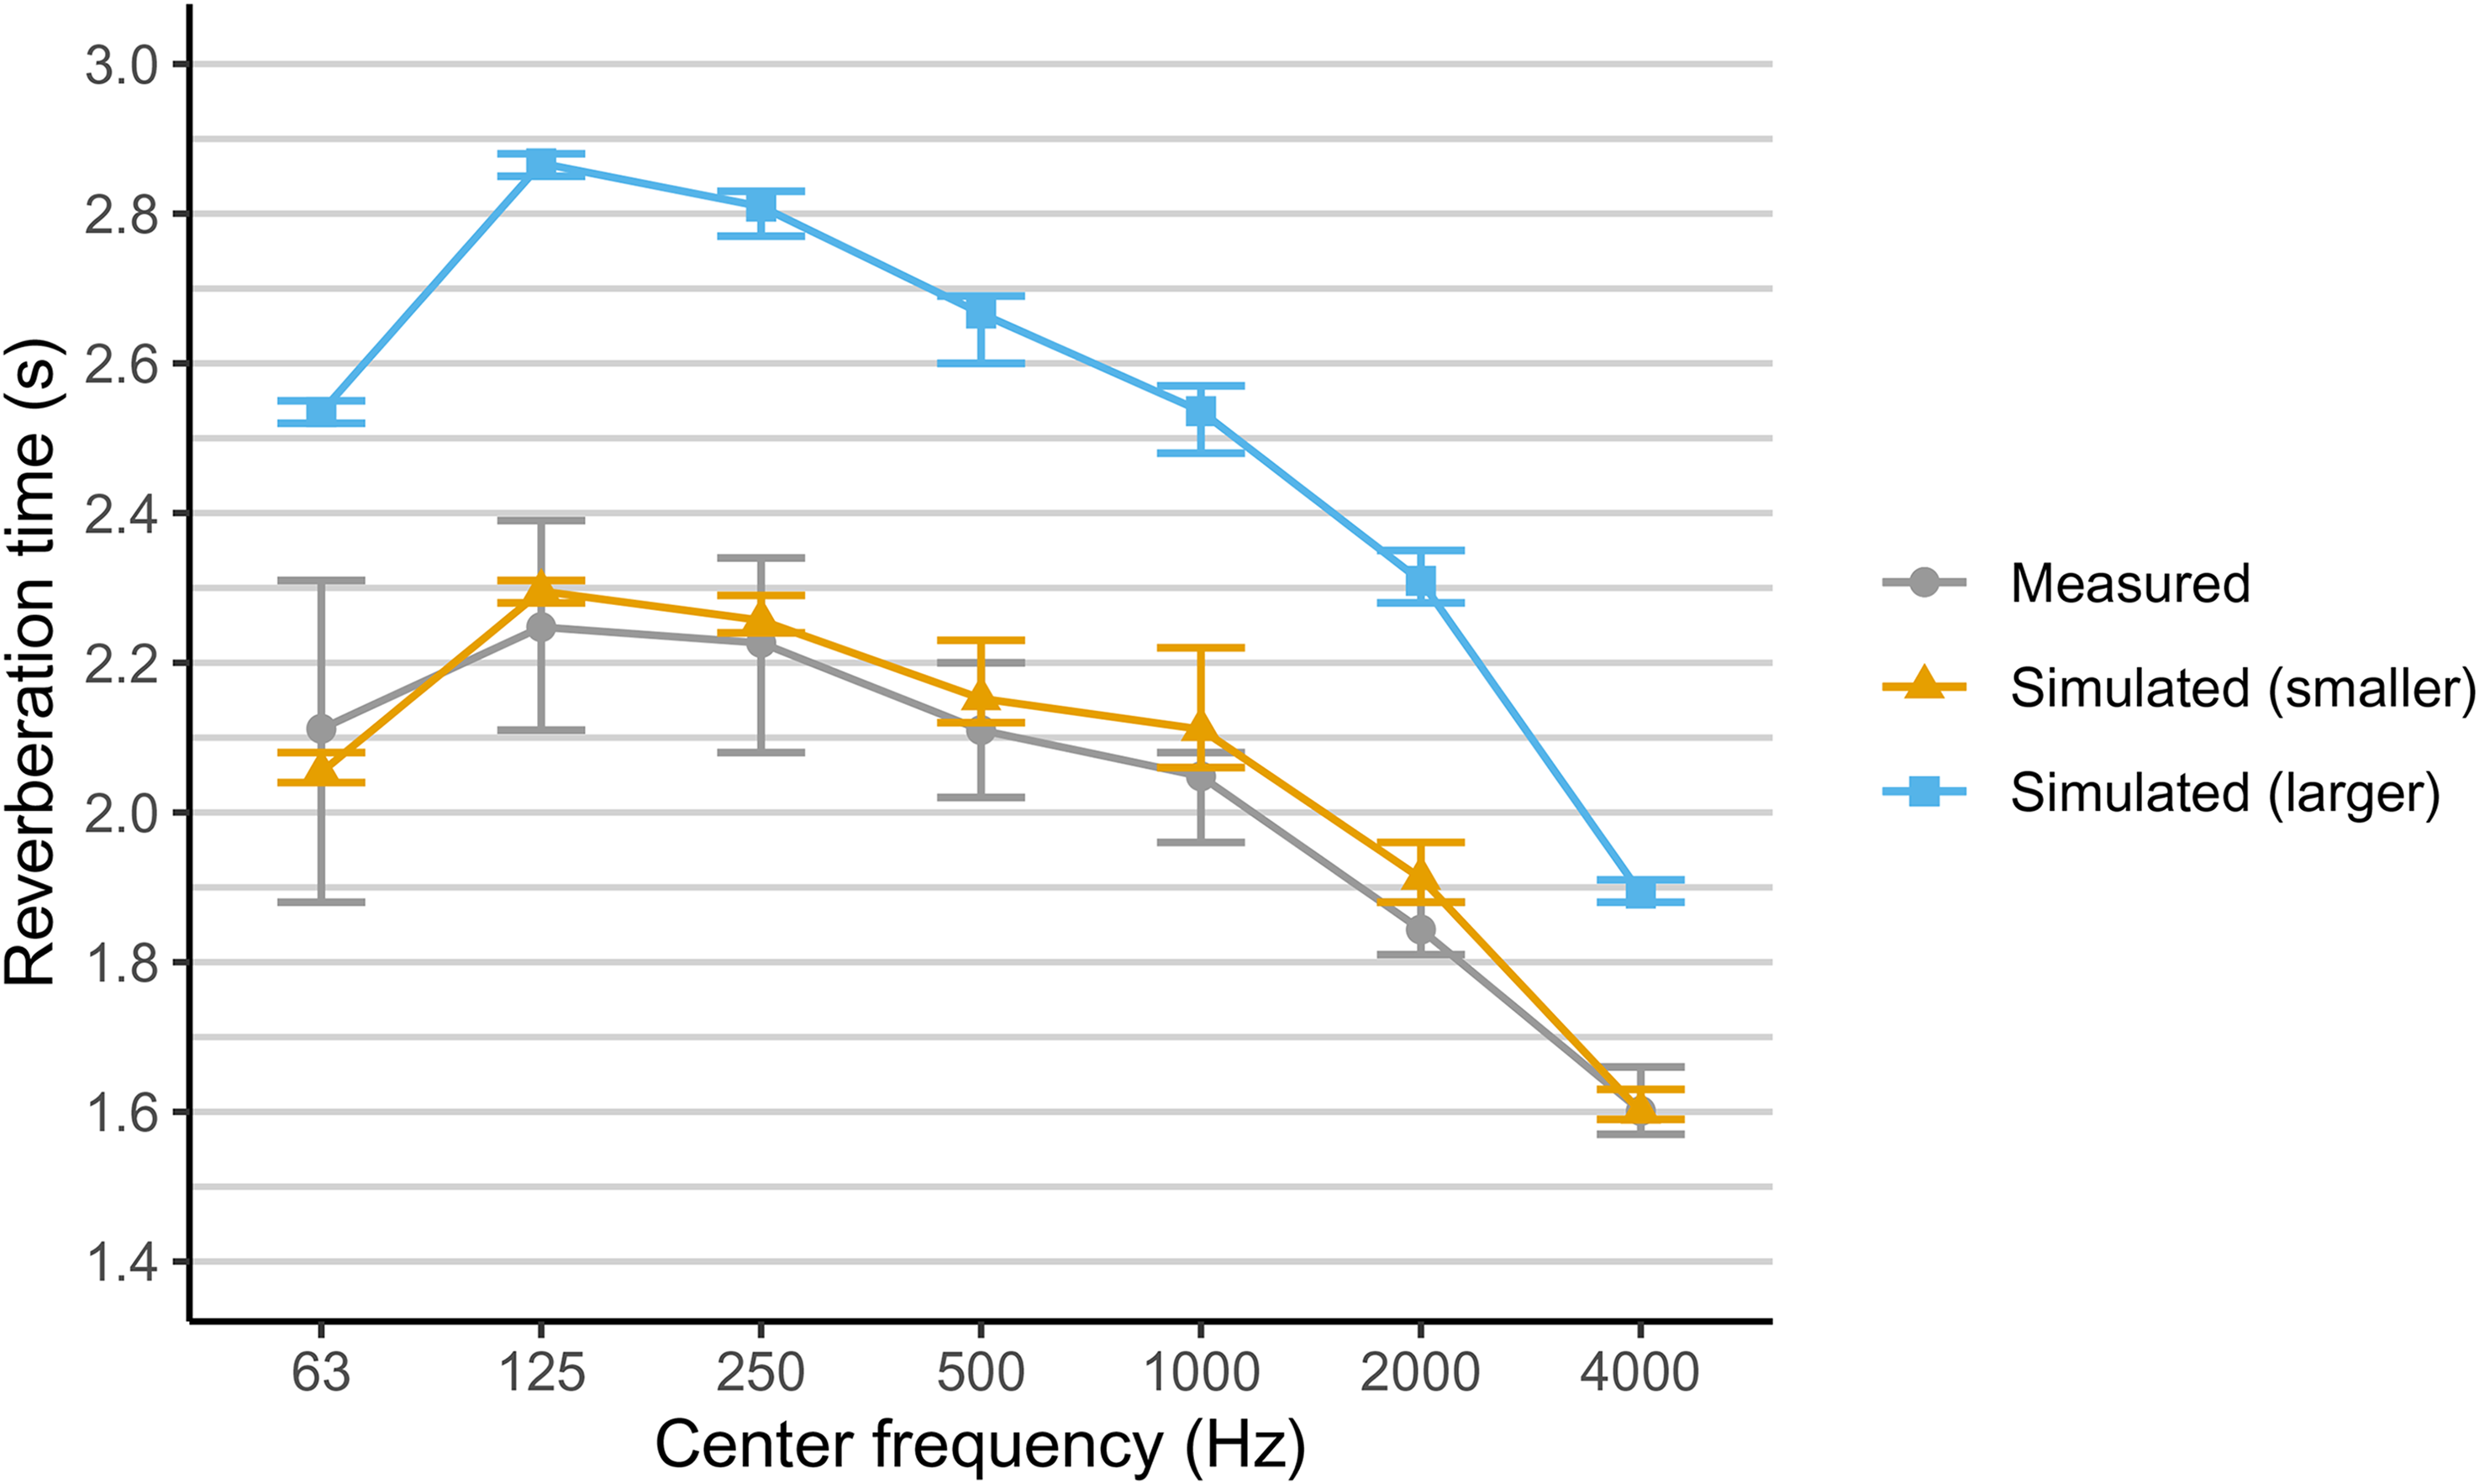
Octave band reverberation time (T30, mean in seconds) at all seats in the physical and the two simulated concert halls. Error bars are minima and maxima.
The propagation of sound in the space was simulated using combined image-source and ray-tracing methods, and the calculation was done from each sound source on stage (61 distinct locations, one for each musician in the orchestra: see Figure 1) to each simulated location in the audience. The locations and instruments of each musician were matched in audio and vision.
The music used was Beethoven Symphony No. 8 in F Major (Op. 93) (movements 1, 2, and 4). Each instrument came with an individual anechoic recording (recording done in an anechoic chamber which contains almost no reflections) made by TU Berlin (Böhm et al., 2018), so that the only room effect in the auditory stimuli was from the simulated auditoria. The relative gain of each source used in the auralization was set based on the aural judgment of the experimenter (who is an experienced musician) and kept constant across the two halls, to ensure the final auralization results sounded as natural as possible. Individual directivity for each instrument measured by Otondo and Rindel (2004) was used, apart from the timpani for which an omnidirectional source was used.
First-order Ambisonic impulse responses were simulated for all 61 × 18 × 2 = 2196 combinations of the source-receiver locations in the two simulations, convolved with the corresponding anechoic recording channels, then mixed down to one first-order Ambisonic music signal for each receiver location. The Ambisonic audio format contains both the musical information (pitch, dynamic, timbre, etc.) and the spatial information (directions from which the sounds came). Both the convolution and mixing processes were done in ODEON. The Ambisonic audio was decoded binaurally in real time into the headphones according to the head orientation tracked by the VR headsets so that the auralization was updated for dynamic head movements. The decoding was done using the Ambisonics decoder in the Resonance Audio plugin for Unity (Google, 2018) with KU 100 head-related transfer functions. Due to the need for online distribution of the experiment program, all the real-time calculations needed to be done within the experiment program without the need to install any software.
The lab-based participants completed the experiment in a room with very low background noise, while the computer and researcher remained in a different room to eliminate the effect of the computer cooling fan noise on the experiment. The headphones used by the lab-based participants were Sennheiser HD 800 open-back headphones. The sound pressure level was calibrated using a Neumann KU 100 Dummy Head system to match the realistic sound pressure level in the auditoria, calculated using sound strength and the estimated sound power level of each instrument given by Weinzierl et al. (2018).
The remote participants completed the experiment in their own chosen environment with their own headphones, and they were told to adjust to a comfortable listening level at the beginning and to keep the same audio gain throughout the experiment. Of the headphones used by the remote participants, 11 were closed-back over-ear headphones (including 2 built-in with the VR headset), 6 were open-back over-ear headphones, and 1 was in-ear headphones.
Experiment Procedure
The two visual room size simulations and the two auditory room size simulations were cross-paired to form four pairs, two that were congruent and two that were incongruent. There were: (1) matched simulation of smaller auditory room size + smaller visual room size; (2) unmatched simulation of smaller auditory room size + larger visual room size; (3) unmatched simulation of larger auditory room size + smaller visual room size; (4) matched simulation of larger auditory room size + larger visual room size.
The 18 seat locations were used in each hall (Figure 3). The 12 red locations (number 1–12, of which 8 were on the first floor in the stalls, 4 were on the second floor in the rear balcony) have the same relative position to the stage between the two room sizes, thus are included in the analyses of this paper. The 6 grey locations (numbers 13–18) were located on the side galleries (3 on the first floor, 3 on the second floor) and their relationships with the side walls stayed relatively constant between the two room sizes, meaning that their positions relative to the stage changed (they were further away from the centerline of the auditorium and had larger source-receiver distances in the larger hall due to its larger width). As this paper’s focus is on the effect of room sizes and the change of source-receiver position introduces extra variables, seats 13–18 were excluded from the analyses. The distances of each location to the conductor location on stage ranged from 4.7 m (location 1) to 22.1 m (location 12).

Floor plans of Verbrugghen Hall (on which the smaller Hall was based) with the 18 marked seat locations used in the experiment. Left: first floor (orchestra level); right: second floor. Red locations (1–12) are included in the analyses of this paper.
Every participant experienced 18 seat locations in all four combined auditory and visual simulations, spending a total of 36.6 min on average (SD = 14.9 min). The participants were instructed to give each seat location in each auditorium a rating out of 100 based on how much they liked the overall experience of the seat location given the sound and view from the seat. No separate evaluations of the auditory and visual preference were asked, to control the total experiment time and avoid fatigue of participants. They started at a random seat position in a random auditorium simulation, and subsequently chose their own order to visit and evaluate all of the seats. They could visit the same location and auditorium multiple times, and modify their ratings. Results were recorded when they were satisfied with all of their ratings.
The participants used VR hand controllers to conduct all operations including giving their preference scores, changing seats, and exporting results. While they were touching the thumbpad or thumbstick on the VR controller, the score for the current location would appear inside the VR display as floating texts (Figure 4(a)). All seats started with a score of 0, then they could move their thumb clockwise to increase the score or anti-clockwise to reduce the score. Every 60 degrees of rotation would trigger an increment or decrement of 1, and the controller would give a short feedback vibration. They could not change the score to higher than 100 or lower than 0. When they pulled the trigger at the back of the VR controller, all available locations would appear as seated person models with the score previously given for each location (Figure 4(b)), and a laser-like beam would be visible from the location of the controller. If they pointed the beam at any location, and while the person was highlighted, released the trigger, the audiovisual scene would be switched to the selected location.

User interface examples (a: scoring interface example (enabled when thumbpad/thumbstick was being touched); b: seat selection interface example (enabled when with trigger was being pulled); c: menu interface example (turned on/off when menu button was pressed).
Participants were familiarized with the controls through the experimenter (live demonstration for the lab-based participants, and video demonstration for the remote participants) and an instruction document with detailed pictures before they put on the VR headset and headphones. Once they were inside the VR environment, the experiment began directly with no training session. However, they were encouraged to visit a few different seats before starting their evaluation process. There was also a menu button on the controller that turned a menu on/off (Figure 4(c)). The menu included options for saving the process (if the participants wanted to pause the experiment and return at a later time), switching between the four “auditoria,” or exporting the results if they were completely satisfied with the scores that they have given to all the seats in all the auditoria. When the participants switched between seat locations within one auditorium, the music continued in time, while the auditory renders changed according to the locations; when they switched between auditoria, the music restarted from the beginning of the first movement. There were also options in the menu to restart music from first movement, restart the current movement, or skip the current movement. The participants had full control of how long they spent at each seat location, how many times they visited each location, and in what order they completed the evaluations.
Results
The results of the preference ratings were analyzed in three sections that examine: (1) the effect of experiment environment on the group averages; (2) the separate effects of auditory and visual room size; and (3) the effect of auditory and visual room size congruency.
Remote Versus Lab-Based Experiment
Figure 5 contrasts the ratings for the remote versus the lab-based participants. To test whether the two groups differed significantly in their results, a two-way mixed-effects ANOVA was conducted for the rating scores, with the experiment environment (remote vs. lab-based) as the between-subject independent variable, and each unique audiovisual stimulus (12 seats × 2 auditory room sizes × 2 visual room sizes = 48 stimuli) as the within-subject independent variable. While the main effect of unique stimulus was significant as expected (F(47,1457) = 15.52, p < .001), the experiment environment showed neither a significant main effect (F(1,31) = 0.04, p = .837) nor a significant interaction with unique stimuli (F(47,1457) = 0.63, p = .976). This indicates that in terms of group average, the ratings given by the group who completed the standardized experiment in the laboratory with calibrated VR headset and headphones and the other group who completed the experiment remotely in their own selected environment with their own VR headset and headphones do not significantly differ from each other. This supports for the validity of the method of conducting VR experiments remotely in the context of this experiment for the analysis of average preference and shows that the results of all participants can be analyzed together.

Mean (with 95% confidence intervals) and individual rating scores for each unique audiovisual stimulus, with the experimental environment separated by color and point shape.
Auditory Room Size Versus Visual Room Size
Figure 6 plots the preference ratings for each audiovisual auditorium on both experimental groups combined. A tendency of higher ratings can be seen for both larger visual room size and larger auditory room size at most seat locations.

Means and 95% confidence intervals of rating scores in each combined auditory and visual auditorium renders at seat locations 1 to 12.
To examine the effect of different auditory room size and different visual room size, a three-way random-effects ANOVA was conducted for auditory room size, visual room size, and seat positions. Both auditory room size and visual room size have significant main effects (auditory room size: F(1,1504) = 23.30, p < .001; visual room size: F(1,1504) = 34.74, p < .001), but no significant interaction (F(1,1504) = 2.98, p = .084). All other interactions between auditory room size, visual room size, and seat location are not significant.
To further examine the effect, paired-sample t-tests were conducted between different auditory room size, and between different visual room size. The seat ratings are significantly different between the two auditory room sizes (t(791) = −6.33, p < .001), with the larger auditory room size preferred by a mean difference of 3.17. The seat ratings are also significantly different between the two visual room sizes (t(791) = −7.81, p < .001), with the larger visual room size preferred by a mean difference of 3.86. Together, this shows that on average across all seats, people prefer both the acoustics and the appearance of the larger auditorium.
As preference is a subjectively defined attribute, the preference of each individual participant is also examined in terms of the preference difference between the two room sizes (auditory and visual). Figure 7 shows each participant’s mean preference difference between the larger and smaller auditory or visual room size as a correlation between visual and auditory preference differences. The values for each participant were calculated for all seats and both halls (e.g., the visual preference difference for a participant is the mean difference between all the 12 × 2 seat ratings they gave in the two halls with larger visual room size, and the 12 × 2 seat ratings they gave in the two halls with smaller visual room size). A value of preference difference larger than 0 indicates that the larger hall is preferred by the participant. The number of people preferring the larger hall acoustically (24/33) and the number of people preferring the larger hall visually (25/33) are similar. However, the 8/33 who preferred the smaller visual hall to the larger one rated the two sizes of visual halls similarly, with a maximum difference of 1.96, which may possibly have been random error, as the differences between seats are generally much larger. This means that the people who rated the smaller visual hall higher did not have a strong preference for the smaller hall. In other words, all people who have strong visual preferences prefer the larger hall. On the other hand, the few participants (9/33) who preferred the smaller auditory hall showed relatively large rating differences, with a maximum difference of 9.42, meaning that although relatively few in number, there are some people who relatively strongly prefer the smaller auditory hall. It also shows that there is a moderate and highly significant positive correlation between auditory preference difference (i.e., large minus small) and visual preference difference (r = .587, p < .001). This indicates that people’s preference for the different auditorium sizes are relatively consistent between auditory and visual perception, as those who rated the larger auditory room size higher also tended to rate the larger visual room size higher.
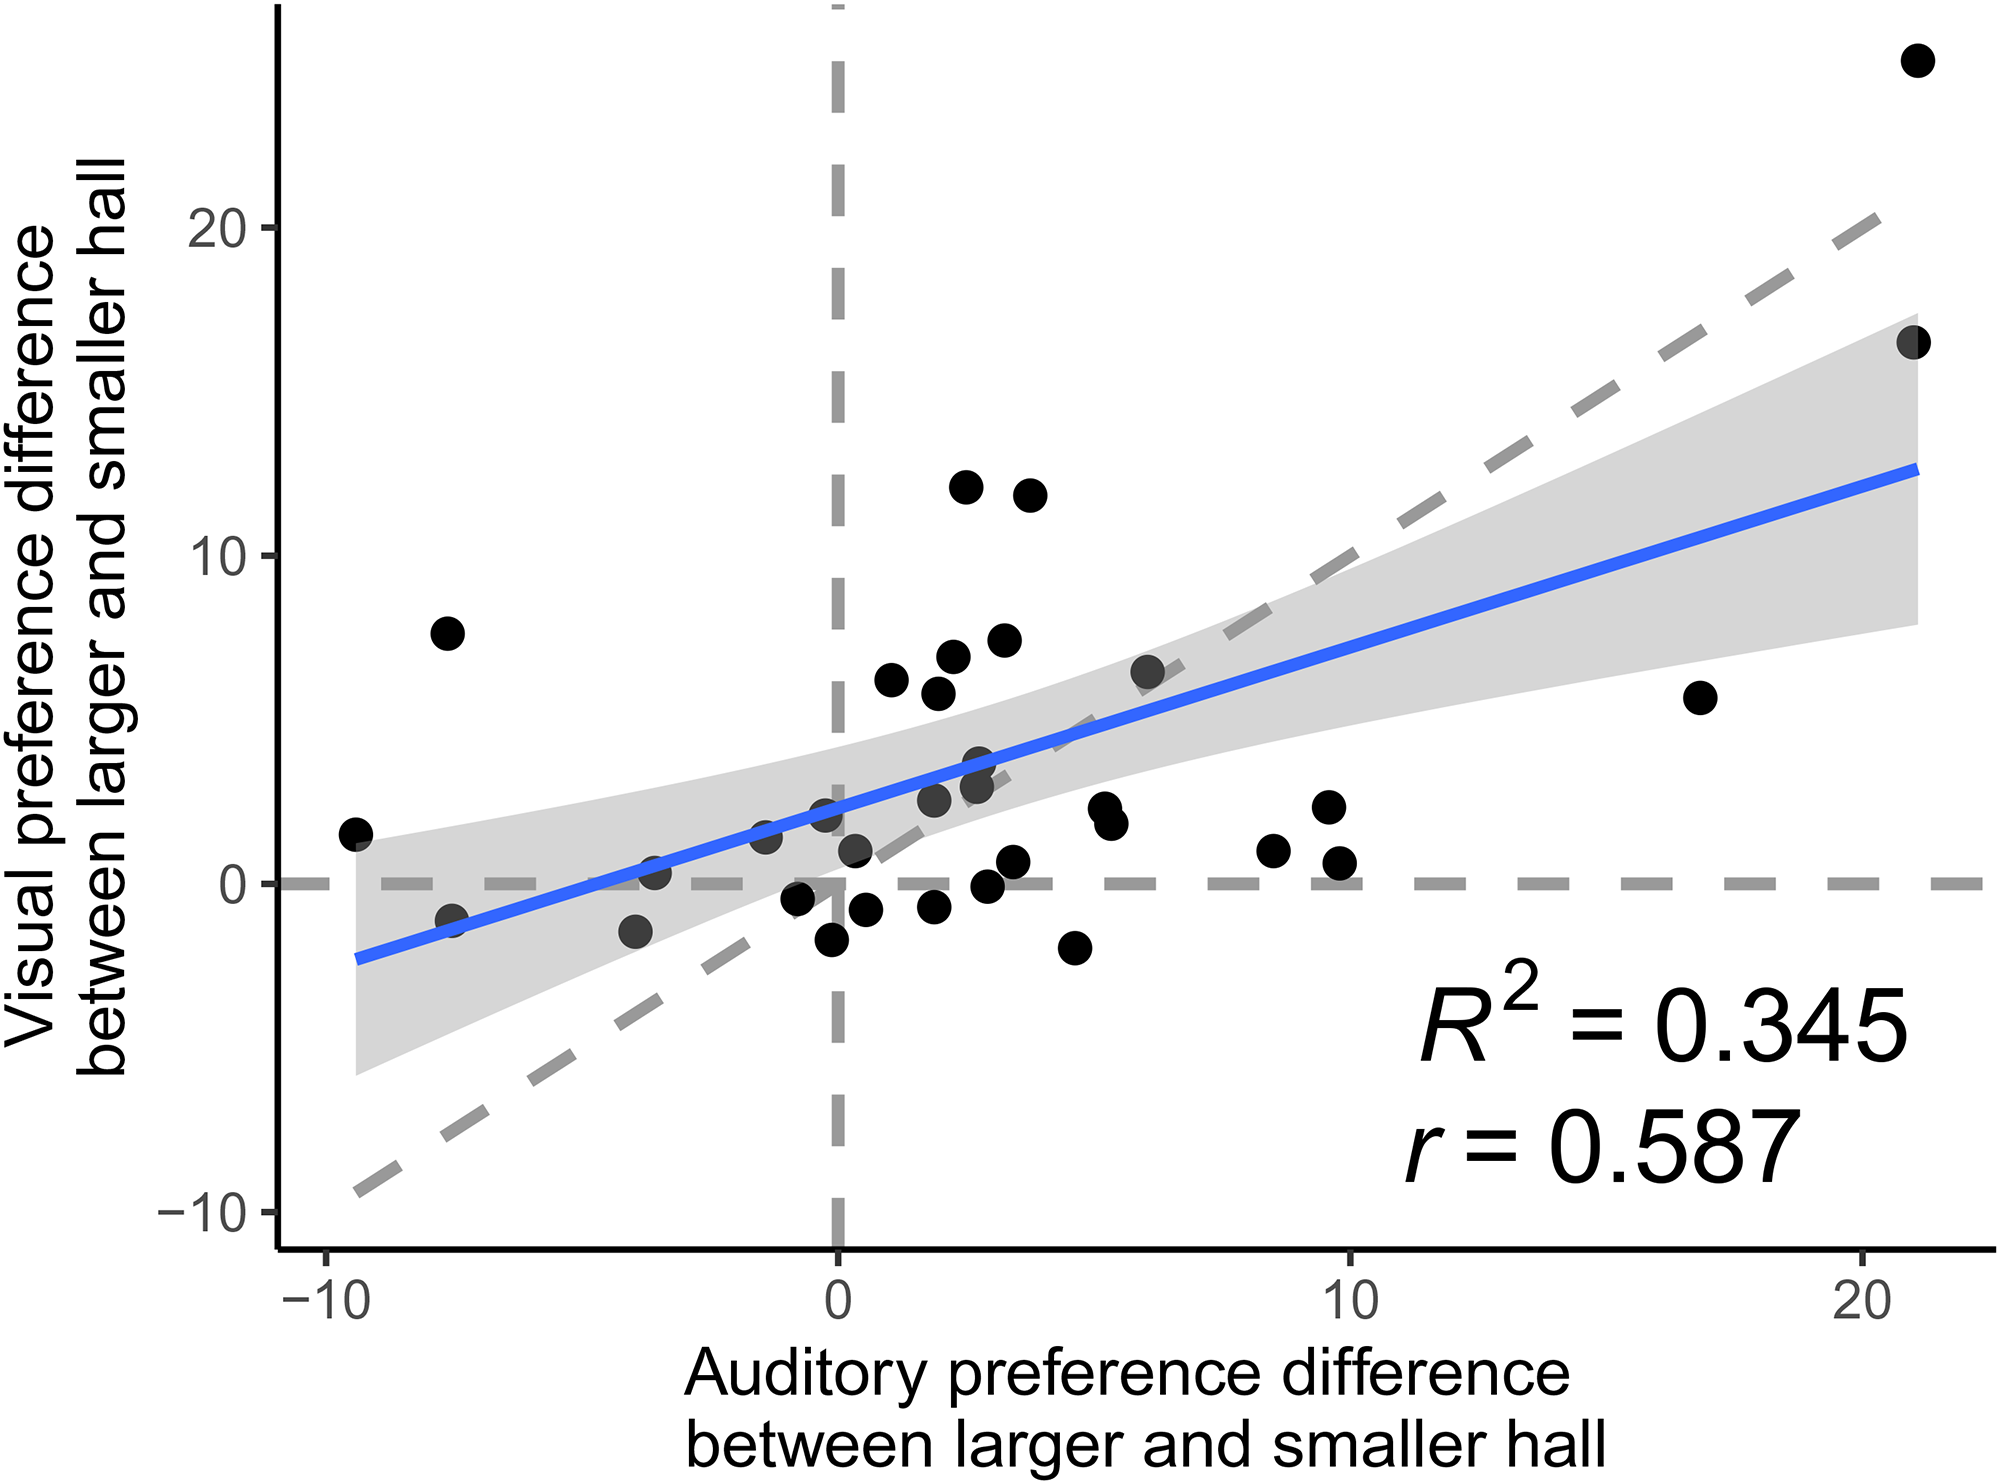
Mean difference of seat rating between larger and smaller auditory or visual room size for each participant: scatter plot and correlation of visual preference difference versus auditory preference difference.
Congruent Versus Incongruent Auditory and Visual Room Sizes
As previous research has found that congruent and collocated audio and vision triggers better audiovisual integration, the seat ratings were also compared between congruent auditory and visual room sizes (auditory and visual renders both of the larger hall, or both of the smaller hall) and incongruent auditory and visual room sizes (mismatched for size, with one of the visual and auditory render being the larger hall and the other the smaller). A two-way random-effects ANOVA was conducted with congruency and seat locations factors. While seat location still had a significant main effect (F(11,1528) = 56.78, p < .001), whether the audiovisual room sizes were congruent or not only has a small non-significant effect (F(1,1528) = 2.87, p = .090), with no interaction (F(11,1528) = 0.51, p = .901). The independent t-tests between congruent and incongruent audiovisual room sizes also show that there is no significant difference between them (t(1581.7) = −1.19, p = .231).
Discussion and Conclusion
This study examined the subjective ratings of twelve seat locations in four audiovisual concert hall simulations produced by combining two levels of visually defined auditorium size with two levels of auditorily defined auditorium size. The virtual auditoria were experienced using head-mounted VR displays with headphone audio playback, and the study compared lab-based and remotely participating subjects. The main findings are discussed below.
The first notable finding is that in terms of average preference, there was no significant difference between the ratings of participants who did the experiment in the laboratory using calibrated VR headsets and headphones and those who did the experiment in their own environments using various VR headsets and headphones without calibration. This is a promising finding that opens up future research possibilities by showing the viability of remote VR audiovisual experiments as a feasible alternative to traditional lab-based experiments in the context of this study. While our results only validated this method for the specific context of this experiment—for studying mean preference of people in two sizes of concert halls—it may encourage future studies to test this method on other similar audiovisual studies. It might be especially useful when an experiment requires a large sample size, when a target population is remote from a laboratory testing location, or when it is simply impractical to conduct lab-based experiments. Nonetheless, this is a very new method and more experimental studies will be needed to validate the method of remote audiovisual VR experiments in other experimental contexts and to establish the limitations. As the testing environment was an inter-participant factor in the current experiment, meaning that each participant only experienced one of the two environments, further tests may be needed to compare between the results of the same participants in different environments. In addition, only preference was studied in the current experiment, other attributes of room perception were not examined in the current study and will need to be examined in future experiments, especially the more subtle attributes that may have higher requirements on the listening environment (e.g., auditory source width). One practical limitation of this method is that the quality of the audio may be constrained because of online data transfer limits, so this may not suit experiments that use very large file size (e.g., very long audio files, a large number of audio files, or very high-quality audio files). Remote VR audiovisual experiments would also not suit experiments where the absolute sound level is strictly controlled or is manipulated as part of the experimental design or where specific equipment is required.
We found significant main effects of seat location and the size of the auditorium (both auditory size and visual size) on the participants’ ratings but no interaction between these factors. This means that the size of the auditorium environment does affect people’s preference—with larger halls being preferred both auditorily and visually—and that preference also depends on seat location within each auditorium, independently of the auditorium. These findings are consistent with a number of previous studies that have separately investigated seat preference (Chen & Cabrera, 2022; Jeon et al., 2008; Sato et al., 2012) and auditorium preference (Barron, 1988; Beranek, 2003; Lokki, 2014), although fewer results have been established of the relationship between seat preference and auditorium preference (Lokki et al., 2016), and the current study is the first to examine this with both visual and auditory stimuli. We also found that the variation in ratings between seat locations was generally larger than between auditoria. However, the effect sizes are related to the range of stimuli, as the seat locations were spread out across the whole auditoria, while the two auditoria were very similar and only differed in size. Using more drastically different auditoria could reveal a greater dependency of preference by auditorium than we report here (e.g., Lokki et al., 2016), especially given that seating layouts in most auditoria tend to be similar and so should produce relatively constant seating preferences. We also used VR to produce a more immersive 3D experience than was possible with the photographs or stereoscopic images used in most previous studies. The ease of manipulating the visual environment in VR will facilitate further exploration of preference variation due to seat location and auditorium.
Both auditory and visual auditorium sizes have significant main effects on the seat ratings, and people preferred both the audio and visual simulations of the larger hall over the smaller hall, but no interaction is observed. In other words, both the changes in visual environment and auditory environment have significant and separate effect on preference, but the larger hall was always preferred. The visual room size has a slightly larger effect than the auditory room size. All participants rated the two visual room sizes similarly or the larger hall higher and most participants rated the two auditory room sizes similarly or the larger hall higher, while a few participants rated the smaller auditory room size higher. A consideration here is that the smaller hall model (35 m × 18 m × 12 m) is relatively small in size compared to most other symphony concert halls (e.g., Wiener Musikverein: 49 m × 19 m × 18 m; Amsterdam Royal Concertgebouw: 44 m × 28 m × 17 m), due to the fact that the base auditorium is part of a conservatorium of music instead of a commercial auditorium. While the larger hall model (35 m × 28 m × 14 m) is still relatively small, it is closer to people’s expectations for orchestral performance. This may be part of the reason why the larger hall is preferred for both visual and auditory room size. Further investigation of other auditorium sizes or interviews may be needed to confirm the explanations for the preference difference in different halls.
One interesting finding in the current study is that both simulations that had mismatched auditory and visual dimensions (i.e., one large, one small) were preferred over the auditorium that was small in both sensory modalities. While this clearly underlines the preference for the larger of the two auditoria, it raises the interesting question of whether the participants were aware of the size mismatch. The same question is raised from the insignificant or small effect of audiovisual incongruency. If the participants did perceive the incongruency, then the preference for a larger auditorium is a powerful one that trumps the perceived mismatch in size. On the other hand, they may not have been aware of the size mismatch between the visual and auditory modalities, suggesting considerable malleability in the merging of auditory and visual representations of auditorium size. Our data cannot answer which was the case, however, it would be very interesting in future studies to investigate the relationship between the preference for larger auditoria and the perceptual threshold for noticing crossmodally mismatched sizes.
Data relating to congruent versus incongruent audiovisual stimuli in an auditorium context is scarce, with one study finding that incongruent audiovisual stimuli from different seat locations sometimes but not always results in lower plausibility (Postma & Katz, 2017), one finding that congruent or incongruent audiovisual stimuli from different rooms did not significantly affect distance or room size perception (Maempel & Jentsch, 2013), while another has shown that perception of reverberation in a variety of rooms is not affected when the visual dimensions are altered to make the visual room incongruent with the auditory one (Schutte et al., 2019). In the study of Jeon et al. (2008), when crossmatching 3 auditory and visual stimuli with different subjective preferences, a significant interaction was observed, although the effect size was very small compared to the main effects. All the above findings point to the hypothesis that audiovisual incongruency has little to no effect on perception in the context of auditoria. If the threshold for noticing an auditorium size difference between sensory modalities is large, then it would lend further weight to using VR in audiovisual studies of auditoria as small errors or inconsistencies in size would not be a critical limitation.
One possible explanation for the insignificant or small effect of audiovisual congruency in the listed auditorium studies is the relatively small distinctions between the auditory stimuli, and the difficulty in auditory-based spatial judgements. Compared to most psychology experiments investigating audiovisual interaction which usually have very clear and distinguishable sound sources (e.g., Battaglia et al., 2003; Frassinetti et al., 2002), the acoustic environments in auditoria are much more complex with numerous reflections and late reverberation, increasing the difficulty for auditory localization or environment recognition. Past studies have found that auditory-perceived room size of the same room dimensions is significantly different when varying reverberation time, source-receiver distance, or the type of sound source (Cabrera & Jeong, 2007; Cabrera et al., 2005; Kolarik et al., 2021), and auditory-perceived distance is also much less accurate compared to visual-perceived distance (Anderson & Zahorik, 2014; Maempel & Jentsch, 2013) and is significantly affected by sound pressure level (Cabrera et al., 2005; Kuusinen & Lokki, 2015) and visual input (Anderson & Zahorik, 2014; Calcagno et al., 2012). On the other hand, the combined audiovisual perception of distance and room size in simulated auditoria depends 90% on visual input and only 10% on auditory input (Maempel & Horn, 2022). Due to the large variance and general inaccuracy of auditory spatial perception, the audiovisual incongruency may not have been perceived as incongruent by the participants. This may prompt future studies to investigate the perception of incongruency along with preference to confirm the extent of incongruency perceived by the participants when using different stimuli, and the relationship between perceived incongruency and preference.
Footnotes
Acknowledgements
The authors thank the participants who volunteered their time for this project. The ethical aspects of this study have been approved by the Human Research Ethics Committee of the University of Sydney [2020/449].
Author Contributions
Chen, Y.: Conceptualization, Methodology, Software, Formal analysis, Investigation, Data curation, Writing – original draft, Visualization. Cabrera, D.: Supervision, Writing – review & editing. Alais, D.: Writing – review & editing.
Declaration of Conflicting Interests
The authors declared no potential conflicts of interest with respect to the research, authorship, and/or publication of this article.
Funding
The authors disclosed receipt of the following financial support for the research, authorship, and/or publication of this article: This work was supported by the H.J. Cowan Architectural Science Scholarship, University of Sydney Research Training Program (RTP) International Scholarship.
