
Abstract
How humans recognise faces and objects effortlessly, has become a great point of interest. To understand the underlying process, one of the approaches is to study the facial features, in particular ordinal contrast relations around the eye region, which plays a crucial role in face recognition and perception. Recently the graph-theoretic approaches to electroencephalogram (EEG) analysis are found to be effective in understating the underlying process of human brain while performing various tasks. We have explored this approach in face recognition and perception to know the importance of contrast features around the eye region. We studied functional brain networks, formed using EEG responses, corresponding to four types of visual stimuli with varying contrast relationships: Positive faces, chimeric faces (photo-negated faces, preserving the polarity of contrast relationships around eyes), photo-negated faces and only eyes. We observed the variations in brain networks of each type of stimuli by finding the distribution of graph distances across brain networks of all subjects. Moreover, our statistical analysis shows that positive and chimeric faces are equally easy to recognise in contrast to difficult recognition of negative faces and only eyes.
Understanding the fundamental building blocks of face perception and recognition is seeking the attention of researchers from the past few decades (Bruce & Young, 1986; Zhao et al., 2003; Naseem et al., 2010). Contrast features, in particular, are reported to be crucial in recognising individuals (Gilad et al., 2009; Ohayon et al., 2012; Otsuka et al., 2013; Vuong et al., 2005; Liu-Shuang et al., 2015; Sandford et al., 2021). Researchers have claimed that contrast polarity in the eye region plays an important role in face perception and recognition (Royer et al., 2018; Gilad et al., 2009). Hence contrast chimeras are introduced in the literature which incorporates the ordinal contrast relationships of the eye region in photo-negated faces (Gilad et al., 2009).
Various approaches are proposed in the literature to understand the contrast relationships (Sormaz et al., 2013; Balas & Tonsager, 2014; Kramer et al., 2017; Gandhi et al., 2012). In a behavioural study (Gilad et al., 2009), authors have reported that contrast relationships around the eyes are the determinants of facial recognition. Photo-negative facial images do not preserve these relations and hence they are difficult to recognise (Itier & Taylor, 2002). Another study (Otsuka et al., 2013), demonstrating the importance of eye contrast polarity for facial recognition, has shown consistent results in infants too. In Sormaz et al. (2013), authors have further explored the importance of the eye region in facial recognition. This is a behavioural study in which percentage correct recognition accuracies have been used for analysis. Authors have conducted several experiments and affirmed the results shown in Gilad et al. (2009). They have also reported that positive contrast eye region along with the contrast negated faces provide better recognition than eyes alone. Moreover, chimeric recognition benefits are due to holistic processing of the facial images.
In order to validate the above-mentioned behaviourally driven finding, our previous study (Gandhi et al., 2012) made an attempt to find the neural markers of face perception demonstrating the importance of ordinal contrast relationships. We analysed the event-related potential (ERP) in response to contrast varying facial images. We used amplitudes and latencies of three ERP components: N170, P100, and P250 as features and demonstrated statistically that these features in response to positive and chimeric faces were significantly different from those corresponding to the negatives faces and eyes alone.
In the past, researchers have also explored the underlying process of face and object recognition in the brain using feed-forward pathways (Riesenhuber & Poggio, 1999; Serre et al., 2007). According to the feed-forward pathways, object recognition comprises information flow from the primary visual cortex to the prefrontal cortex (PFC) via the extrastriate visual areas II (V2), IV (V4) and the inferotemporal cortex. In Grill-Spector (2003), authors suggested that object recognition is a hierarchical process comprising various steps, proceeding from low-level stages that extract local visual information to high-level stages that recognise an object by comparing it with the stored objects in the memory. Another study (Thorpe et al., 1996) proposes to measure the time taken by the human visual system to process a natural image. In this study, authors designed a go/no-go experiment in which subjects had to decide whether a previously unseen image contains an animal or not. This study demonstrated a no-go specific activity at 150 ms in the frontal lobe which suggests that target detection process (go task- relatively easier one) had already finished before this time. In other words, a lot of visual processing in the primary visual cortex, the extrastriate visual areas and the inferotemporal cortex must have finished before a no-go specific activity in the frontal lobe which is a higher level stage in object recognition (Thorpe et al., 1996).
Although many studies tried to know the underlying process of face recognition, two issues, (a) what facial features really help in face recognition and (b) how those features are processed in the brain, are still being explored. Since the graph-theoretic approaches to electroencephalogram (EEG) analysis are found to be an innovative and promising way of understating brain, we explored such approaches to understand the importance of contrast features around the eye region in face recognition and also analyzed the associated cortical connectivity. In this endeavour, we observed the functional brain networks corresponding to the positive, negative, only eyes and chimeric faces. Further, we analyzed the natural variability of the brain networks corresponding to each type of visual stimulus and compared these graph populations using statistical tests. As negatives faces and only eyes are difficult to recognise compared to positive and chimeric faces, we conjecture that recognition of the former ones is a more cognitively demanding task. Hence, we propose that functional brain networks corresponding to negative facial stimulus and only eyes should show higher connectivity in the frontal cortex compared to positive and chimeric faces.
The rest of the paper is organised as follows: The proposed analysis has been described in the method section. We have used a real-time data to demonstrate the proposed analysis in the result section. Finally concluding remarks and future scope have been discussed in the last section.
Methods
Dataset Description
In this paper, we have used the dataset introduced in (Gandhi et al., 2012). This dataset includes EEG signals of 9 adults (four females) between the ages of 20 and 30 years (mean age=24.8). All participants, without any history of neurological abnormalities, had normal or corrected-to-normal vision. The dataset comprises EEG responses to the four categories of visual stimuli: positive, chimeric, eyes on a silhouette and negative (30 images for each type) as shown in Figure 1. All images were presented in a random order and duration of each stimulus was 500 ms along with the poststimulus recording period of 1000 ms. During the inter-trial intervals which varied randomly between 1500 and 2000 ms, a black fixation cross was shown on a grey background. The acquired continuous EEG was segmented into epochs of 700 ms, starting from 100 ms prior to stimulus onset. The provided 128 channel data was recorded at a sampling rate of 500 Hz. We used the averaged EEG response of dimension 128*350 (No. of channels * Samples) for each category of stimulus across all participants in our analysis.

Four categories of visual stimuli.
Proposed Scheme
Human brain can be viewed as a complex network consisting of nodes and edges. Three types of brain networks are studied in the literature: Structural (Park & Friston, 2013), functional (Bullmore & Sporns, 2009; Friston, 2011; Bassett & Bullmore, 2006) and effective brain networks (Schurz et al., 2014). Our research focuses mainly on functional brain networks which can be constructed using various existing connectivity measures proposed in the literature such as correlation (Zalesky et al., 2012), coherence (Bowyer, 2016), phase lag index (Stam et al., 2007), granger causality (Bressler & Seth, 2011) etc.
Let
Our objective is to investigate the static functional brain networks corresponding to various face stimuli. In this direction, we focused on contrast relationships in face perception. Our study comprises of four categories of faces with varying contrast relationships: positive faces, contrast chimeric faces (complete photo-negated faces except the eyes area), contrast negated faces and only eyes on head-silhouette as shown in Figure 2.
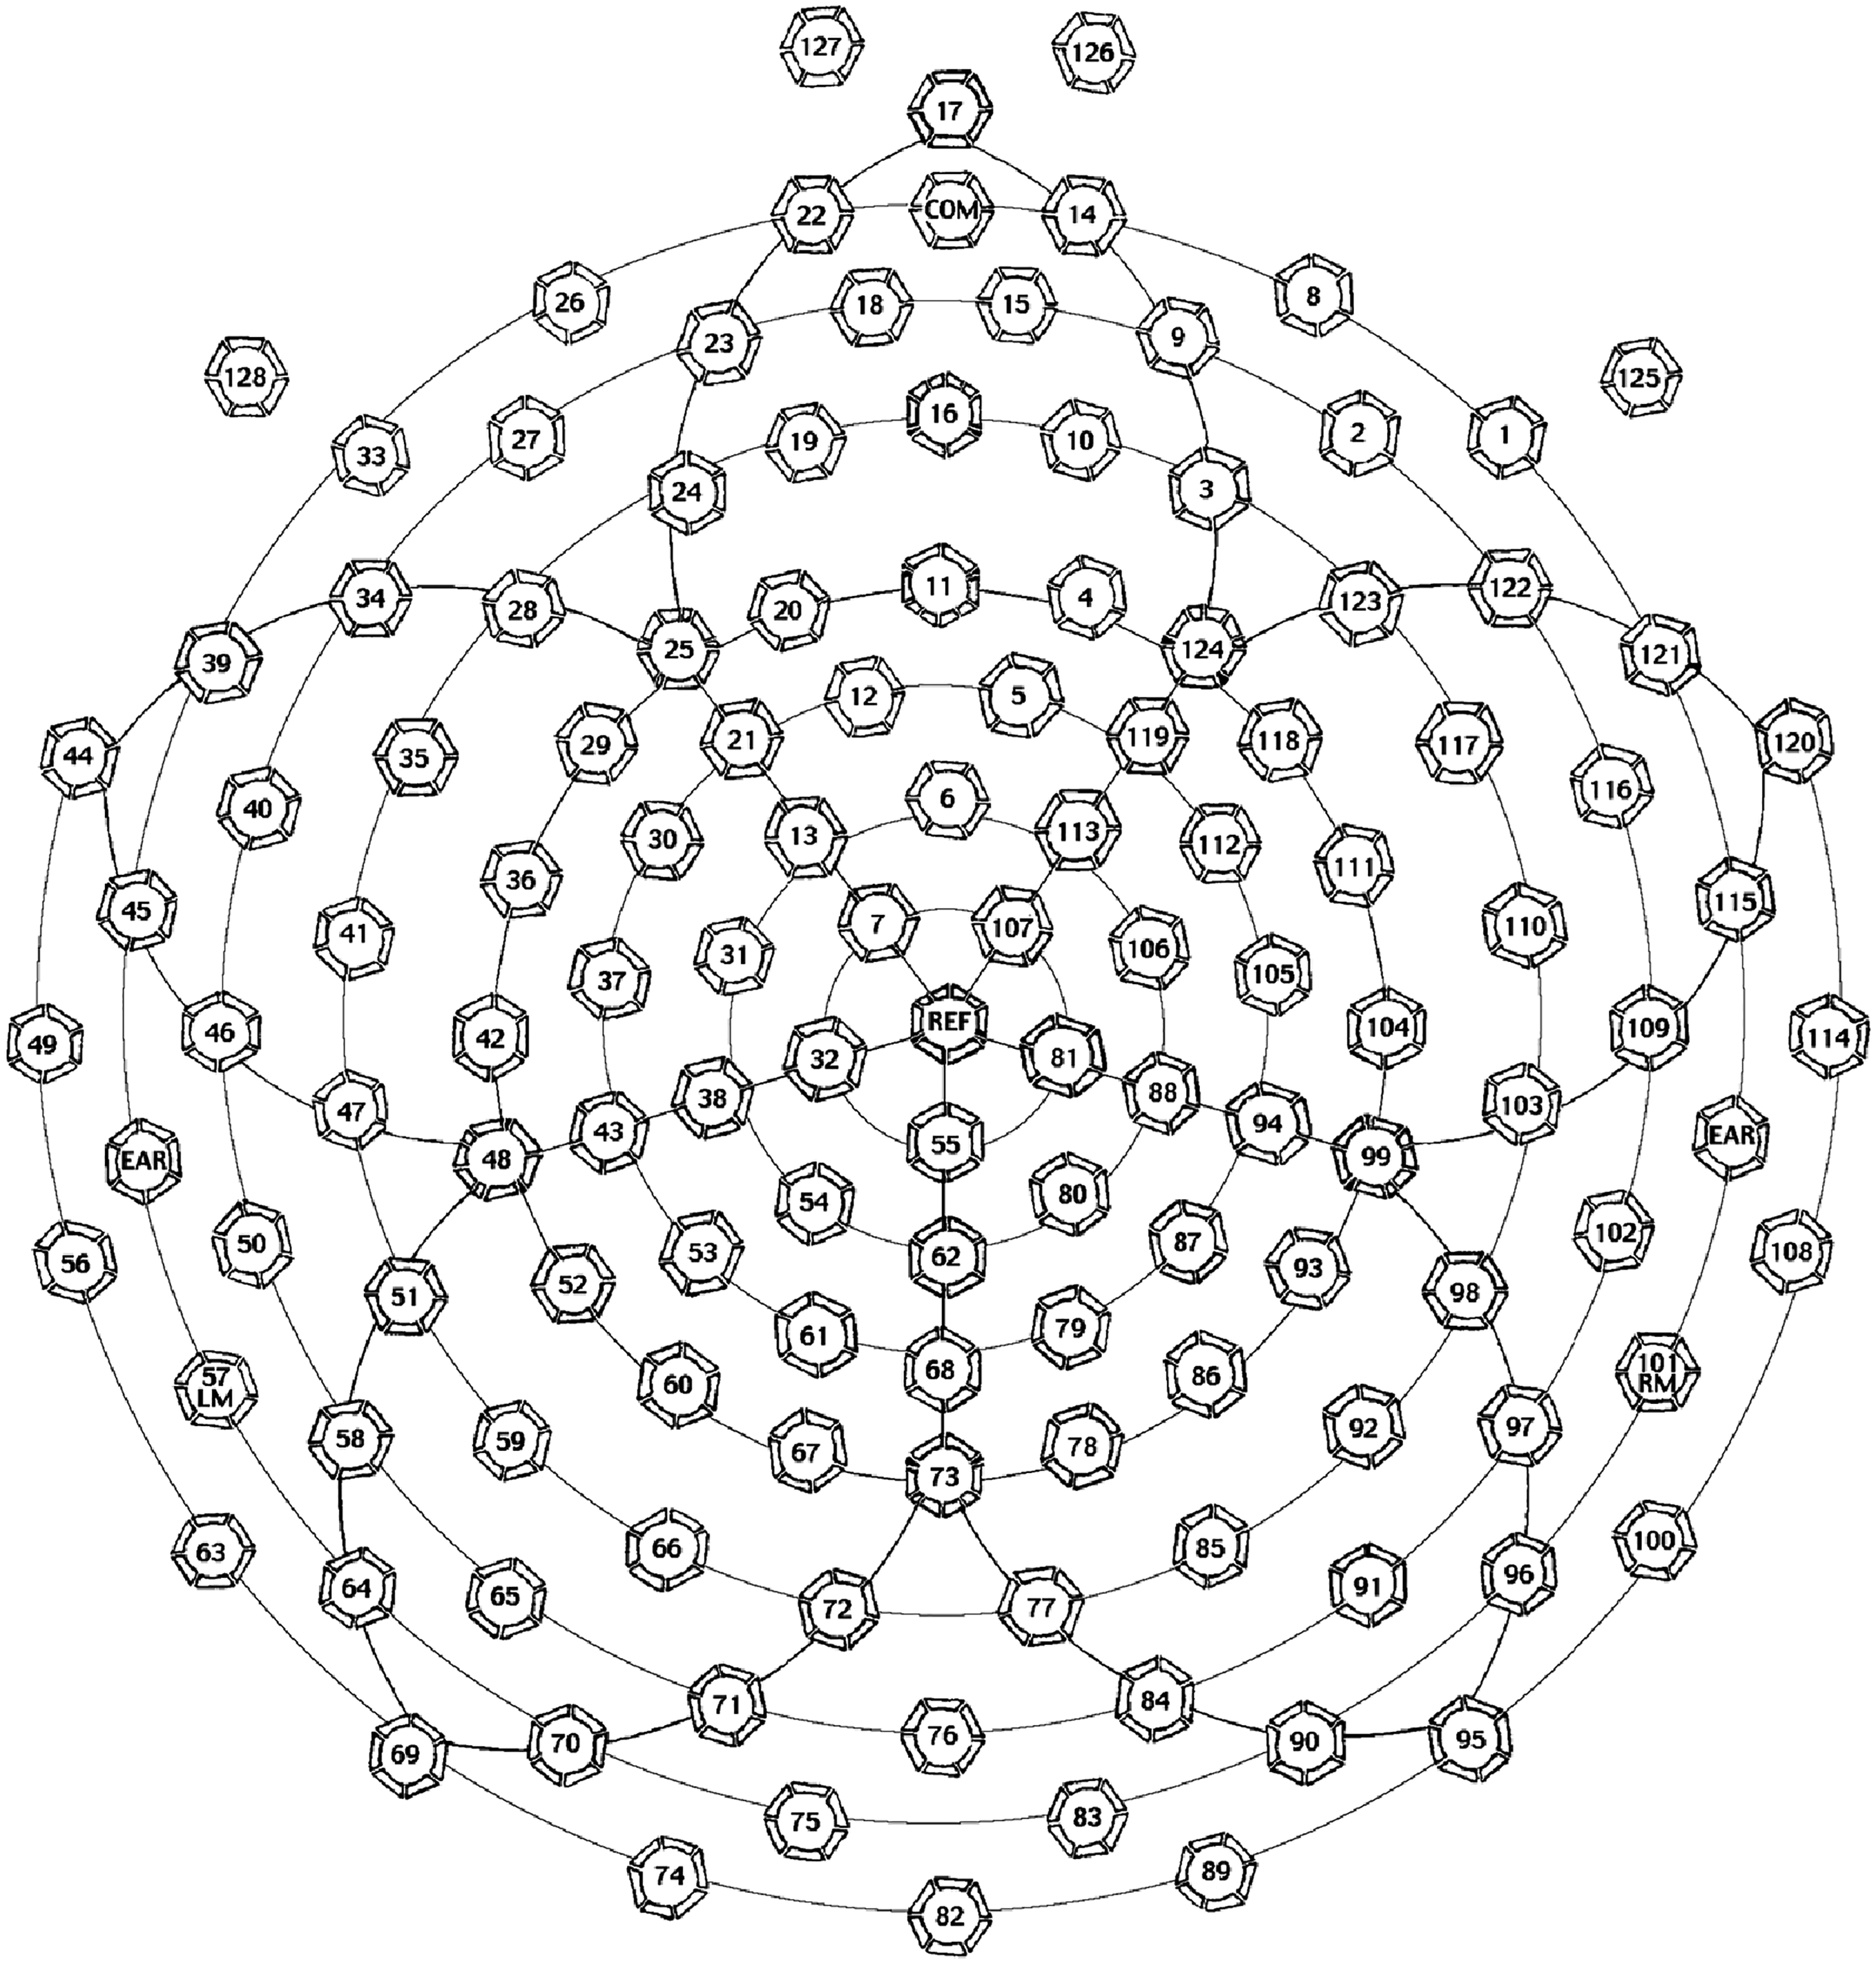
Channel locations in 128 channel Geodesic sensor net.
In this paper, we made an attempt to observe the functional brain networks constructed from the EEG data in response to contrast varying faces. We speculate that functional brain networks involved in the processing of positive and chimeric faces, which are easy to recognise, should have lower connectivity in the frontal lobe compared to fully negative faces and eyes alone (Gandhi et al., 2012; Gilad et al., 2009). In contrast to the previous studies, our approach is not dependent on the selection of electrodes belonging to the type of stimuli.
To find the distance among brain networks corresponding to the four categories of contrast-varying faces, we have used graph distance measures as described in the next section.
Graph Distance
Graph distances are the measures of degree of similarity between graph/networks. Various network distance measures are proposed in the literature based on connectivity (Donnat et al., 2018), features (Akoglu et al., 2015), spectral methods (Wilson & Zhu, 2008) and matrix distances (Monnig & Meyer, 2018; Zhu et al., 2014) etc. In particular, matrix distances require node correspondence which is obvious in case of brain networks as the nodes (channels) are fixed and edge weights are different for the four categories of stimuli across subjects. Let

We assume that four categories of stimuli belong to four different graph populations
We hypothesize that the graph population corresponding to positive faces differs from the graph populations of negative faces and eyes alone as they provide poor face recognition. Whereas contrast chimeras preserve the ordinal relationships in the eye region and its neighbourhood and hence graph population corresponding to it should provide similar results as positive faces. In order to compare these graph populations, we performed two statistical tests: (i) one-way analysis of variance (one-way ANOVA) and (ii) Wilcoxon test.
Results
In this paper, we have used a real time dataset for the complete analysis which is performed in MATLAB environment (Mathworks Inc., Nattick Massachusetts, USA-IIT Delhi licensed version).
Proposed Approach
Firstly, we calculated Pearson correlation coefficient matrix of dimension 128*128 (No. of channels * No. of channels) for each of the four categories of stimulus for all subjects. Then we found the distribution of graph distances signifying variability of each graph population for every stimulus. Histogram of the distributions along with the distribution fit is shown in Figure 3. We explicitly observe that the distribution fit of fully positive faces differs significantly from the distribution fit of negative faces and eyes alone. Whereas the distribution fit for chimeric faces is very close to the distribution fit of positive faces. The bar plot of distribution of distances is shown in Figure 4. Here, square red point represents mean of the distances for each class and vertical bars above and below the red point represent standard error (SE) of the mean. SE is defined as the ratio of standard deviation to the square root of the sample size. SE shows how well the sample dataset represents the whole population. It can be clearly observed that graph population of the positive faces is significantly different from the negative faces and eyes alone while it is very close to the graph population of chimeric faces.

Histogram of the distribution of distances for all four categories of stimuli (Total distance values used per distribution =
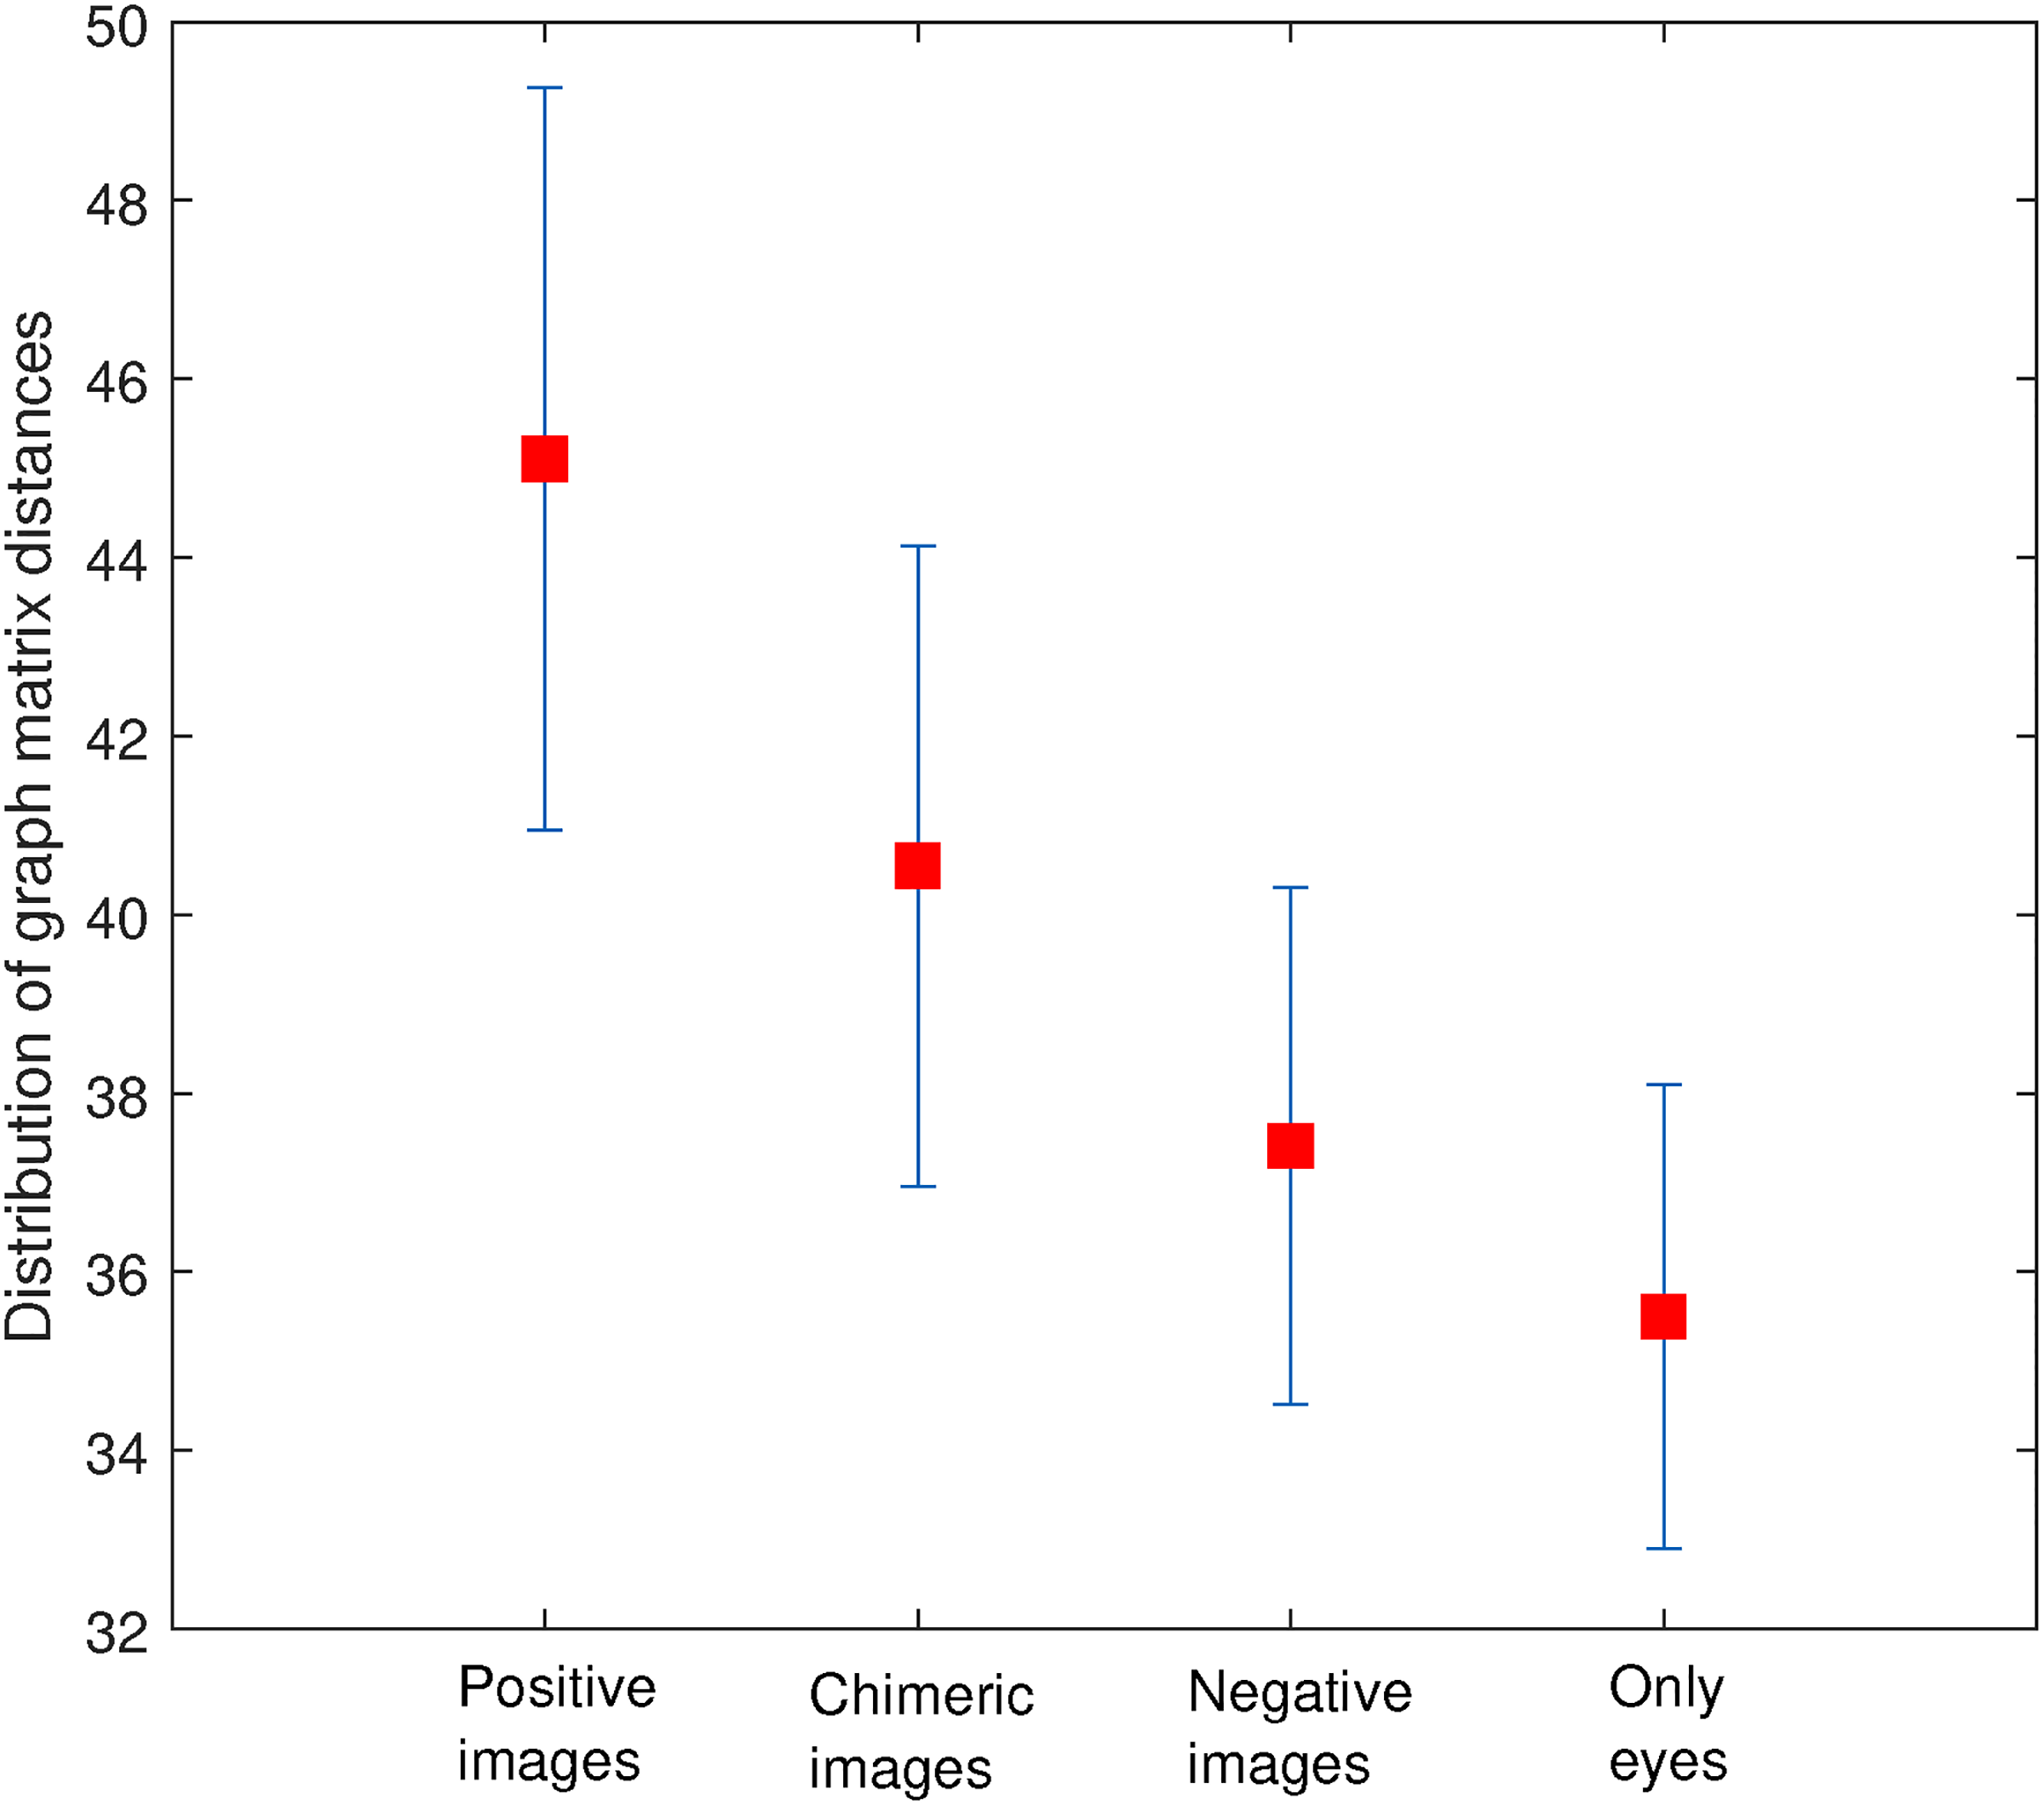
Bar plot of the distribution of distances for all four categories of stimuli.
We also performed statistical tests (one-way ANOVA) to compare the distribution of graph distances. We observed that distributions of positive faces and chimeras are significantly different from the negative faces [F = 4.66 and
In addition to the statistical analysis of graph populations, for every subject, we have also calculated the graph matrix distances
Graph matrix distances
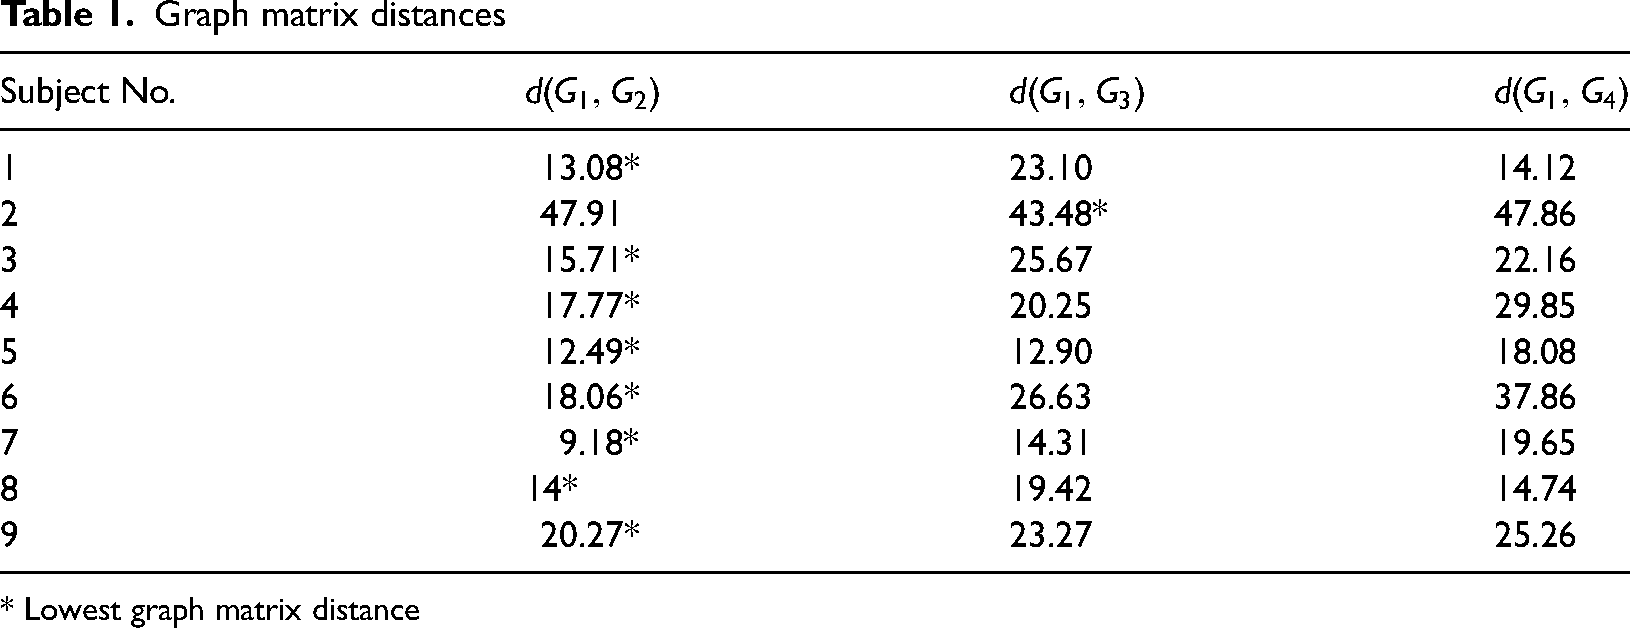
* Lowest graph matrix distance
Associated Cortical Connectivity
In order to find the associated cortical connectivity with the contrast varying faces, we have analysed functional connectivity matrices and corresponding functional brain networks for each type of visual stimuli. The mean Pearson correlation coefficient matrix for each of the four populations has been shown in Figure 5. To study the strong interactions between different nodes, we chose a threshold value of 0.8 for visualising the correlation coefficients. We can explicitly observe that mean matrices of the positive and chimeric faces is significantly different from the mean matrices of negatives faces and eyes only along the off diagonal (lower left and upper right part of the matrices). Strong correlations can be seen in lower left and upper right side of the mean correlation coefficient matrices of negatives faces and eyes only.
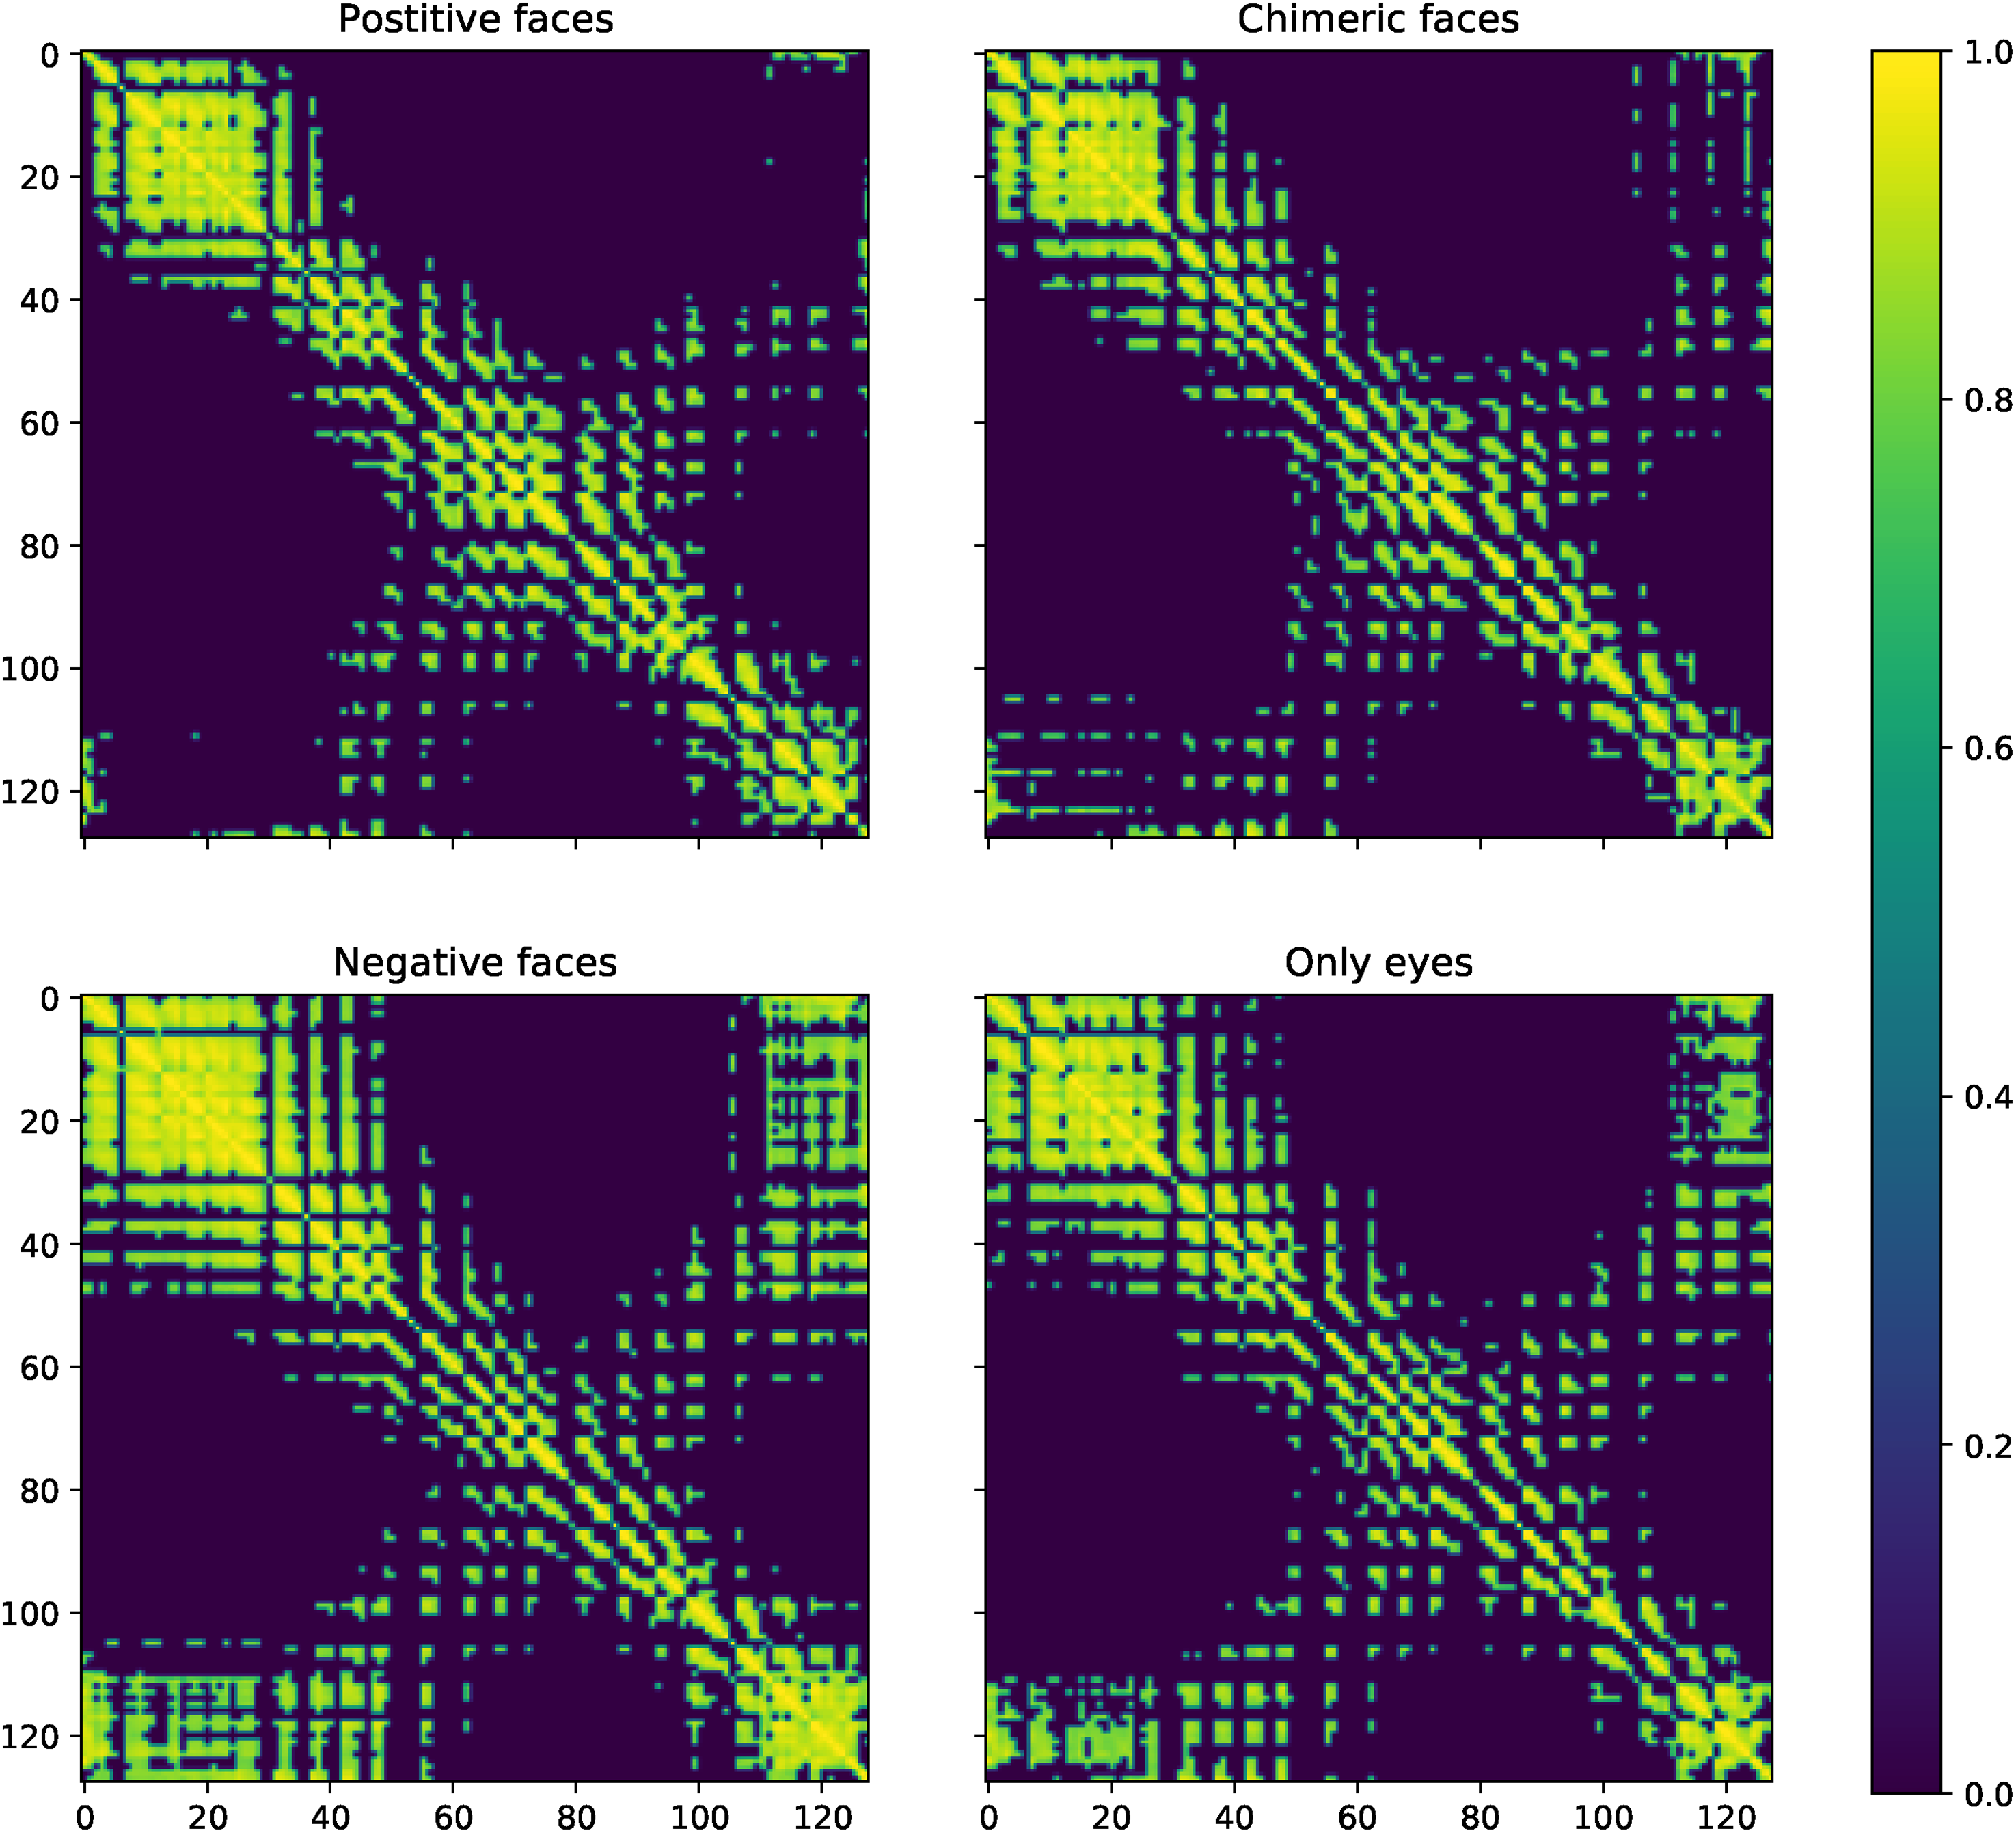
The mean Pearson correlation coefficient matrices of the positive, chimeric, negative faces and only eyes.
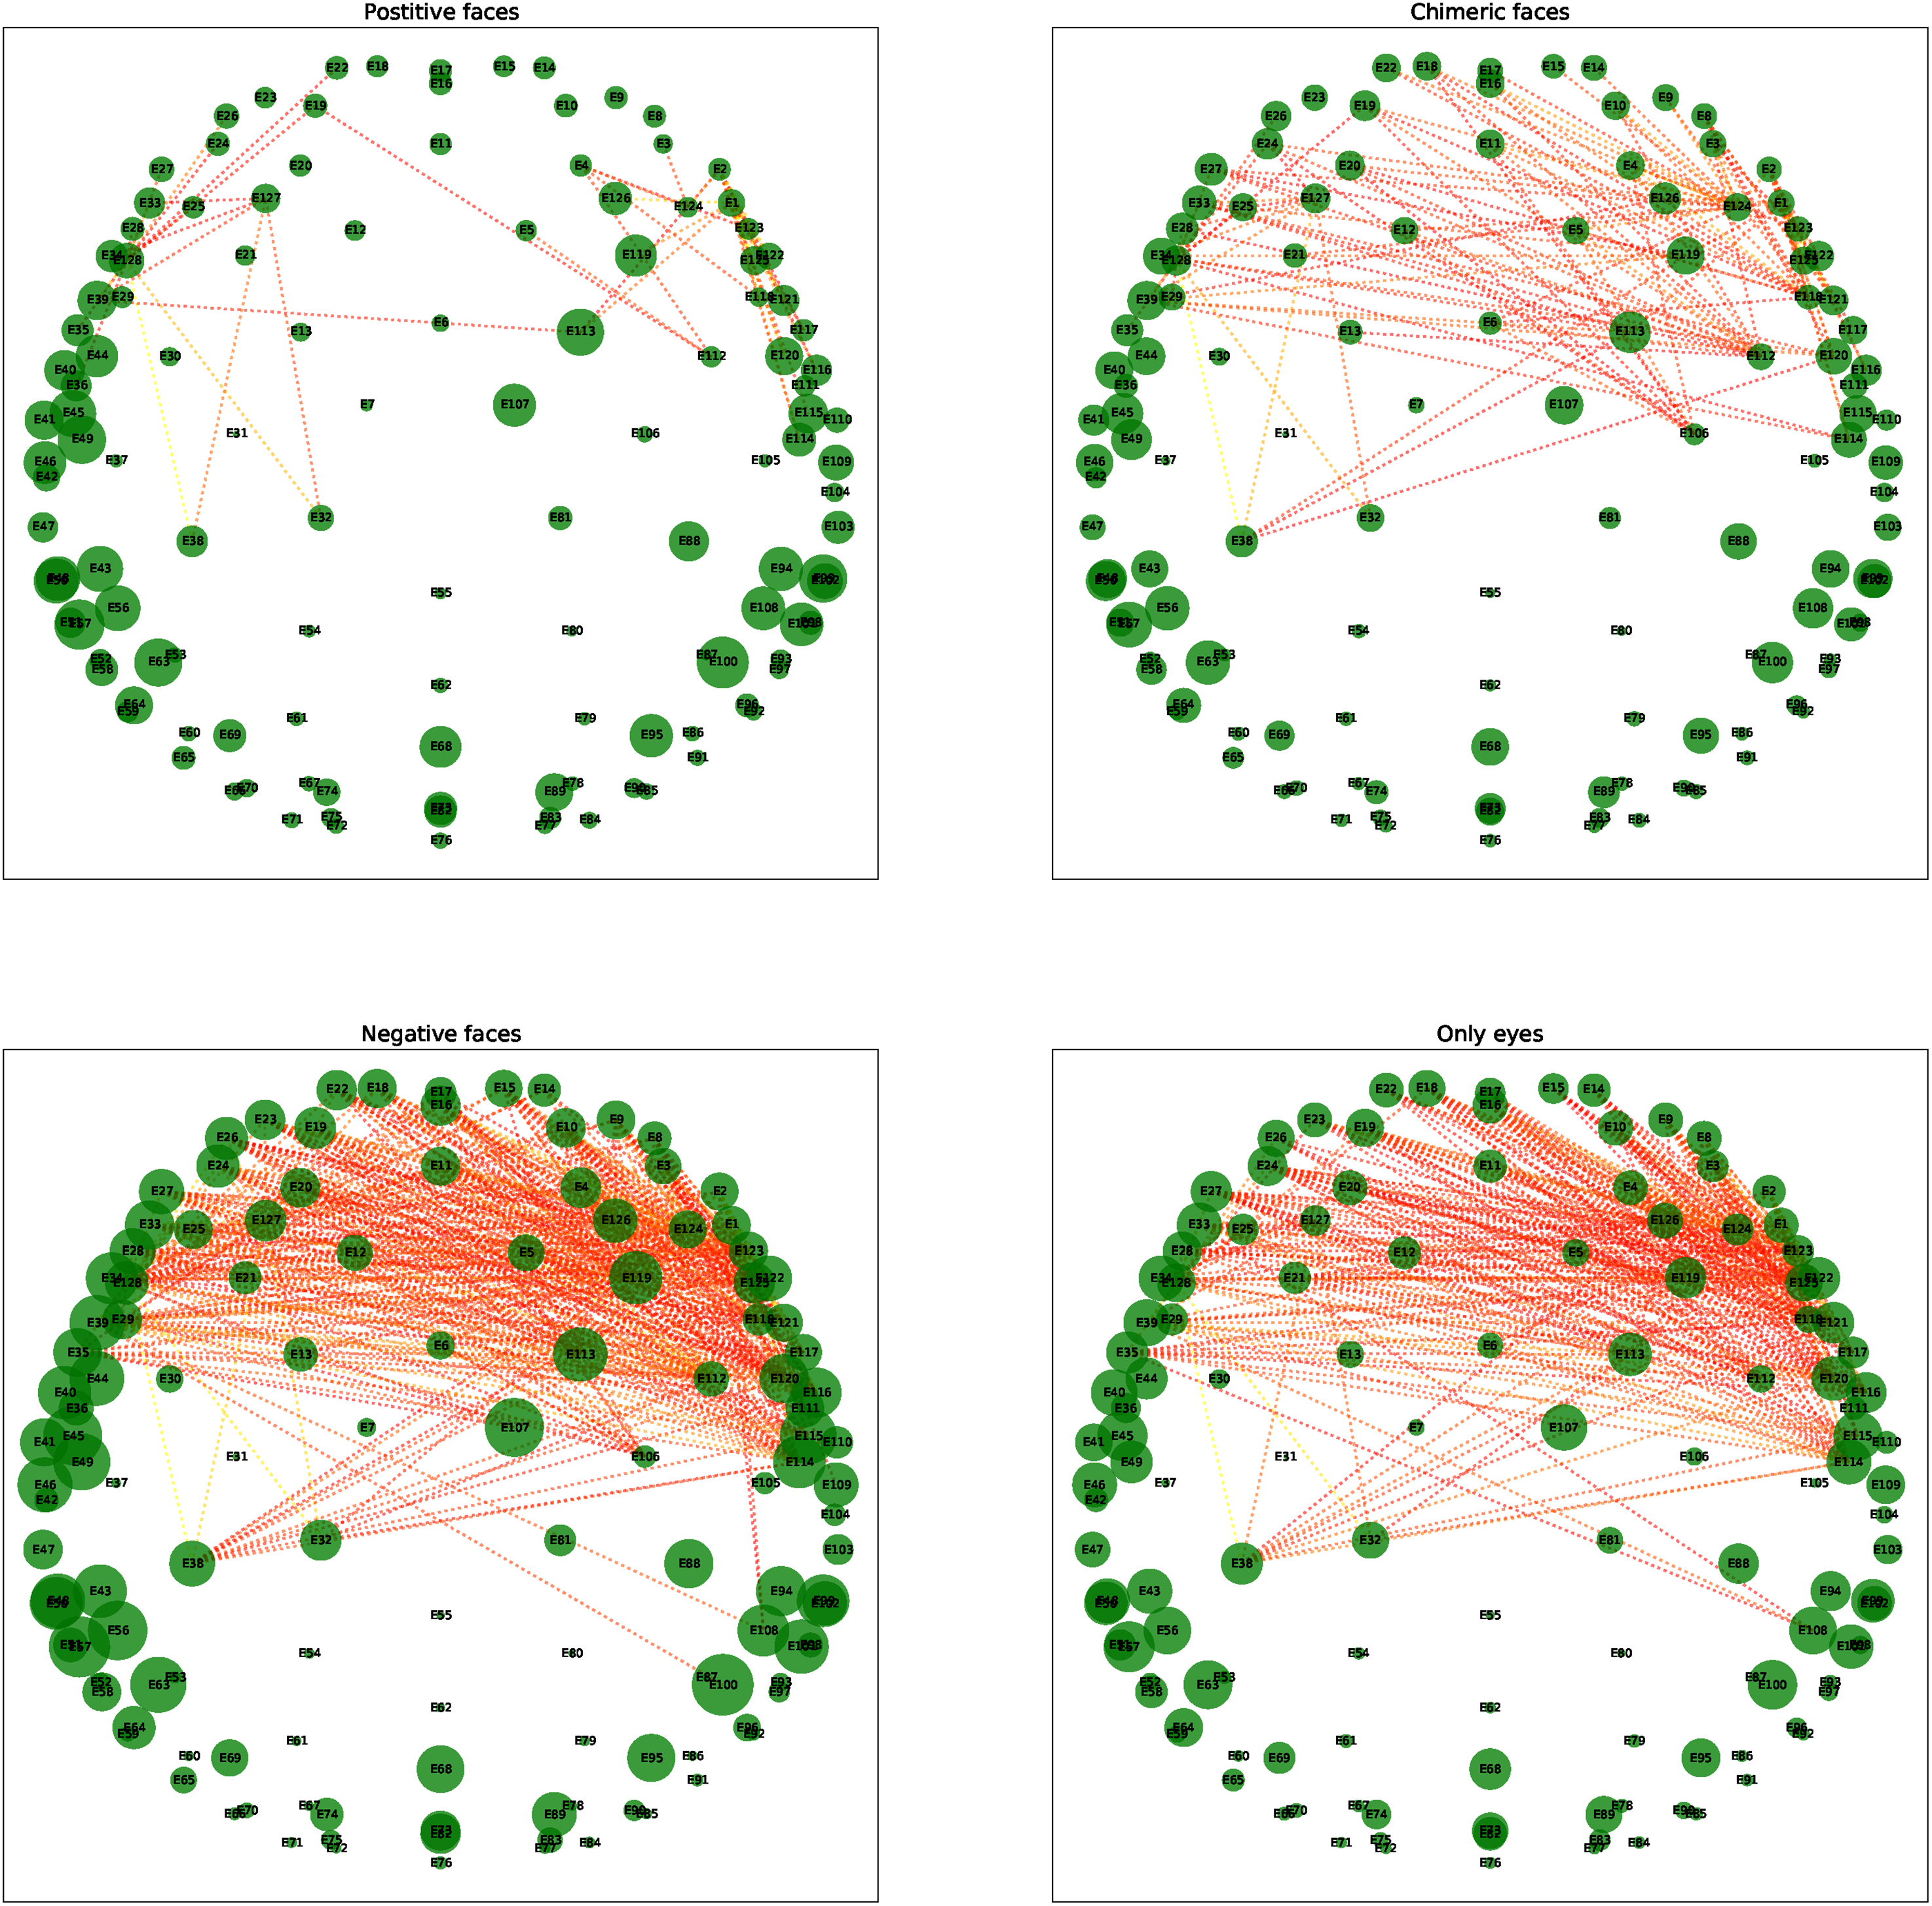
Brain networks corresponding to the mean correlation coefficient matrices have been plotted in Figure 6. Here node sizes are proportional to the weighted degree of each node and edge weights greater than 0.8 are shown in this figure. We observed less connections in the frontal lobe in the case of positive and chimeric faces comparative to negative faces and eyes only. The graph matrix distance between the brain networks corresponding to the mean correlation coefficient matrices in case of positive faces and to those of chimeric faces, negative faces and only eyes came out to be 7.73, 23.72, and 15.91 respectively. Since the graph distance is minimum between positive and chimeric faces, the brain network formed in these two cases have the maximum similarity while the brain networks of the remaining cases are significantly different from that of the positive faces. In addition, the bigger nodes imply stronger connections in the lateral areas of the brain networks for negative faces and eyes only. To observe the differences among four populations more clearly, we plotted the brain networks corresponding to only off diagonal elements of the mean correlation matrices as shown in Figure 7. It can be noted that off diagonal elements of the mean correlation coefficient matrix represent the connections between various channels of the frontal lobe. Figure 7 clearly shows more connectivity in the frontal lobe in case of negative faces and eyes only compared to positive and chimeric faces.

Brain networks corresponding to the mean correlation coefficient matrices of the positive, chimeric, negative faces and only eyes.
Brain networks corresponding to only off diagonal elements (lower left and upper right) of the mean correlation matrices of the positive, chimeric, negative faces and only eyes.
Moreover, we have used the “Networks-based statistics” (NBS) tool for multiple comparisons of brain networks developed by Zalesky et al. (2010). In order to compute the statistical significance, NBS uses a paired
Discussion
In this work, we used graph theoretic approach to find the facial features crucial in face perception and also explored the associated cortical connectivity. Results explicitly show that the functional brain networks for positive faces is closer to the brain networks for chimeric faces than that of negatives faces and eyes alone. It can be inferred from the results that chimeric faces may have preserved the facial features crucial for face recognition which causes similar brain networks in case of positive and chimeric faces having minimum distance between them compared to other two stimuli.
In a behavioural study (Gilad et al., 2009), authors reported that recognition performance of chimeras was better than the recognition performance of negative faces and eyes alone. In other words, authors reported that contrast polarity in the eye region is important for face recognition in adults. In addition to that, authors observed lower activation in the fusiform face area for contrast negated faces compared to positive faces. Another recent study aligning with the above results shows that eye contrast polarity is critical for face recognition by infants too (Otsuka et al., 2013).
It is claimed in the literature that right inferior PFC plays a key role in taking inhibitory decisions (Kawashima et al., 1996; Aron et al., 2014; Chikazoe et al., 2009; Chambers et al., 2009). Most of the studies used go/no-go tasks in order to find the cortical association of inhibition. Another study (Rapcsak et al., 1996) discusses the role of frontal lobe in face recognition. In this study, authors claimed that right PFC is involved in taking the decisions regarding the recognisability of a person based on critical evaluation of all the available information. In addition to that, authors reported that participation of frontal cortex is not always necessary in the face recognition. Whereas the degree of participation of the frontal lobe depends on the requirement of problem solving and decision-making tasks in face recognition. In the literature (Rapcsak et al., 1994, 1996; Natu & O’Toole, 2011; Caharel et al., 2005), many researchers have reported that recognition of familiar faces is a passive task that needs minimum frontal cortex resources. In contrast to that, recognition of unfamiliar faces significantly requires frontal decision mechanisms.
In this work, we used graph theoretic approaches to investigate brain networks corresponding to various contrast varying face stimuli. These brain networks clearly depict the specific cortical areas involved and their degree of connectivity. In particular, our results show that the degree of connectivity of the frontal lobe depends on the relative difficulty at recognition. Connectivity of frontal lobe has been higher in case of negative faces and only eyes as they are difficult to recognise (Itier & Taylor, 2002). This can also be attributed to the fact that recognition of negative faces and only eyes involves some degree of inhibitory decision-making leading to more connectivity of frontal cortex (Aron et al., 2014). In contrast, the results show that there is statistically no significant difference between positive and chimeric faces, hence our brain responds equally well in recognising both types of stimuli which being a less cognitive demanding task comparatively. Hence in this case, less connectivity is seen in the frontal lobe.
As our study considered only nine subjects for analysis, the statistically significant results may be questionable due to small sample size. However, since our study includes the significant differences across four conditions instead of comparing only two conditions, positive and chimeric faces, it is not accountable to lack of power.
The major limitation of the proposed approach is that it analyses functional brain networks formed using scalp EEG signals which tells only about functional connectivity between EEG channels at scalp. Instead of this, brain networks formed using EEG data with source localisation (Jatoi et al., 2014) can be studied in future in order to interpret the results with regard to activity within particular anatomical structures.
Conclusions
The present study implements graph theoretical approach for the analysis of contrast varying faces. Our statistical analysis shows that brain networks in the case of positive and chimeric faces are almost similar in contrast to the brain networks of negatives faces and only eyes. It can be due to the fact that chimeric faces preserve the important facial features crucial for face recognition which needs to be analysed in future. Also, our study shows higher frontal lobe connectivity in vthe case of negatives faces and only eyes than positive and chimeric faces which is in line with the fact that negative faces and only eyes are difficult to recognise and require higher cognitive activity. The above two findings strongly suggest that different brain networks are formed corresponding to different types of visual. In the future, this study can be extended to a large data set. In addition to that, other connectivity measures can also be explored which may describe the contrast relationships more accurately.
Footnotes
Author contribution(s)
Declaration of conflicting interests
The author(s) declared no potential conflicts of interest with respect to the research, authorship, and/or publication of this article.
Funding
The author(s) received no financial support for the research, authorship, and/or publication of this article.