
Abstract
Having two forward-facing eyes with slightly different viewpoints enables animals, including humans, to discriminate fine differences in depth (disparities), which can facilitate interaction with the world. The binocular visual system starts in the primary visual cortex because that is where information from the eyes is integrated for the first time. Magnetic resonance imaging (MRI) is an ideal tool to non-invasively investigate this system since it can provide a range of detailed measures about structure, function, neurochemistry and connectivity of the human brain. Since binocular disparity is used for both action and object recognition, the binocular visual system is a valuable model system in neuroscience for understanding how basic sensory cues are transformed into behaviourally relevant signals. In this review, we consider how MRI has contributed to the understanding of binocular vision and depth perception in the human brain. Firstly, MRI provides the ability to image the entire brain simultaneously to compare the contribution of specific visual areas to depth perception. A large body of work using functional MRI has led to an understanding of the extensive networks of brain areas involved in depth perception, but also the fine-scale macro-organisation for binocular processing within individual visual areas. Secondly, MRI can uncover mechanistic information underlying binocular combination with the use of MR spectroscopy. This method can quantify neurotransmitters including GABA and glutamate within restricted regions of the brain, and evaluate the role of these inhibitory and excitatory neurochemicals in binocular vision. Thirdly, it is possible to measure the nature and microstructure of pathways underlying depth perception using diffusion MRI. Understanding these pathways provides insight into the importance of the connections between areas implicated in depth perception. Finally, MRI can help to understand changes in the visual system resulting from amblyopia, a neural condition where binocular vision does not develop correctly in childhood.
Keywords
Background
Binocular vision is essential to make precise judgements of depth, which guide movements and actions in our environment and help us to recognise objects. Binocular vision arises from combining the two different viewpoints created by the separation of the two eyes. These viewpoints provide slightly different images that are projected along the optic nerve and eventually to the primary visual cortex (V1). The differences between retinal images are used to recreate the perception of depth. Figure 1 shows how the slight difference in position of features on the two retinas (binocular disparity) is created (A) and is projected to V1, where the information from the two eyes is combined for the first time (B). Since the first location in the brain where signals from the two eyes are combined is cortical, the binocular visual system stands as a model system for studying how the neocortex combines information from different sources, and how this information is transformed for perception.
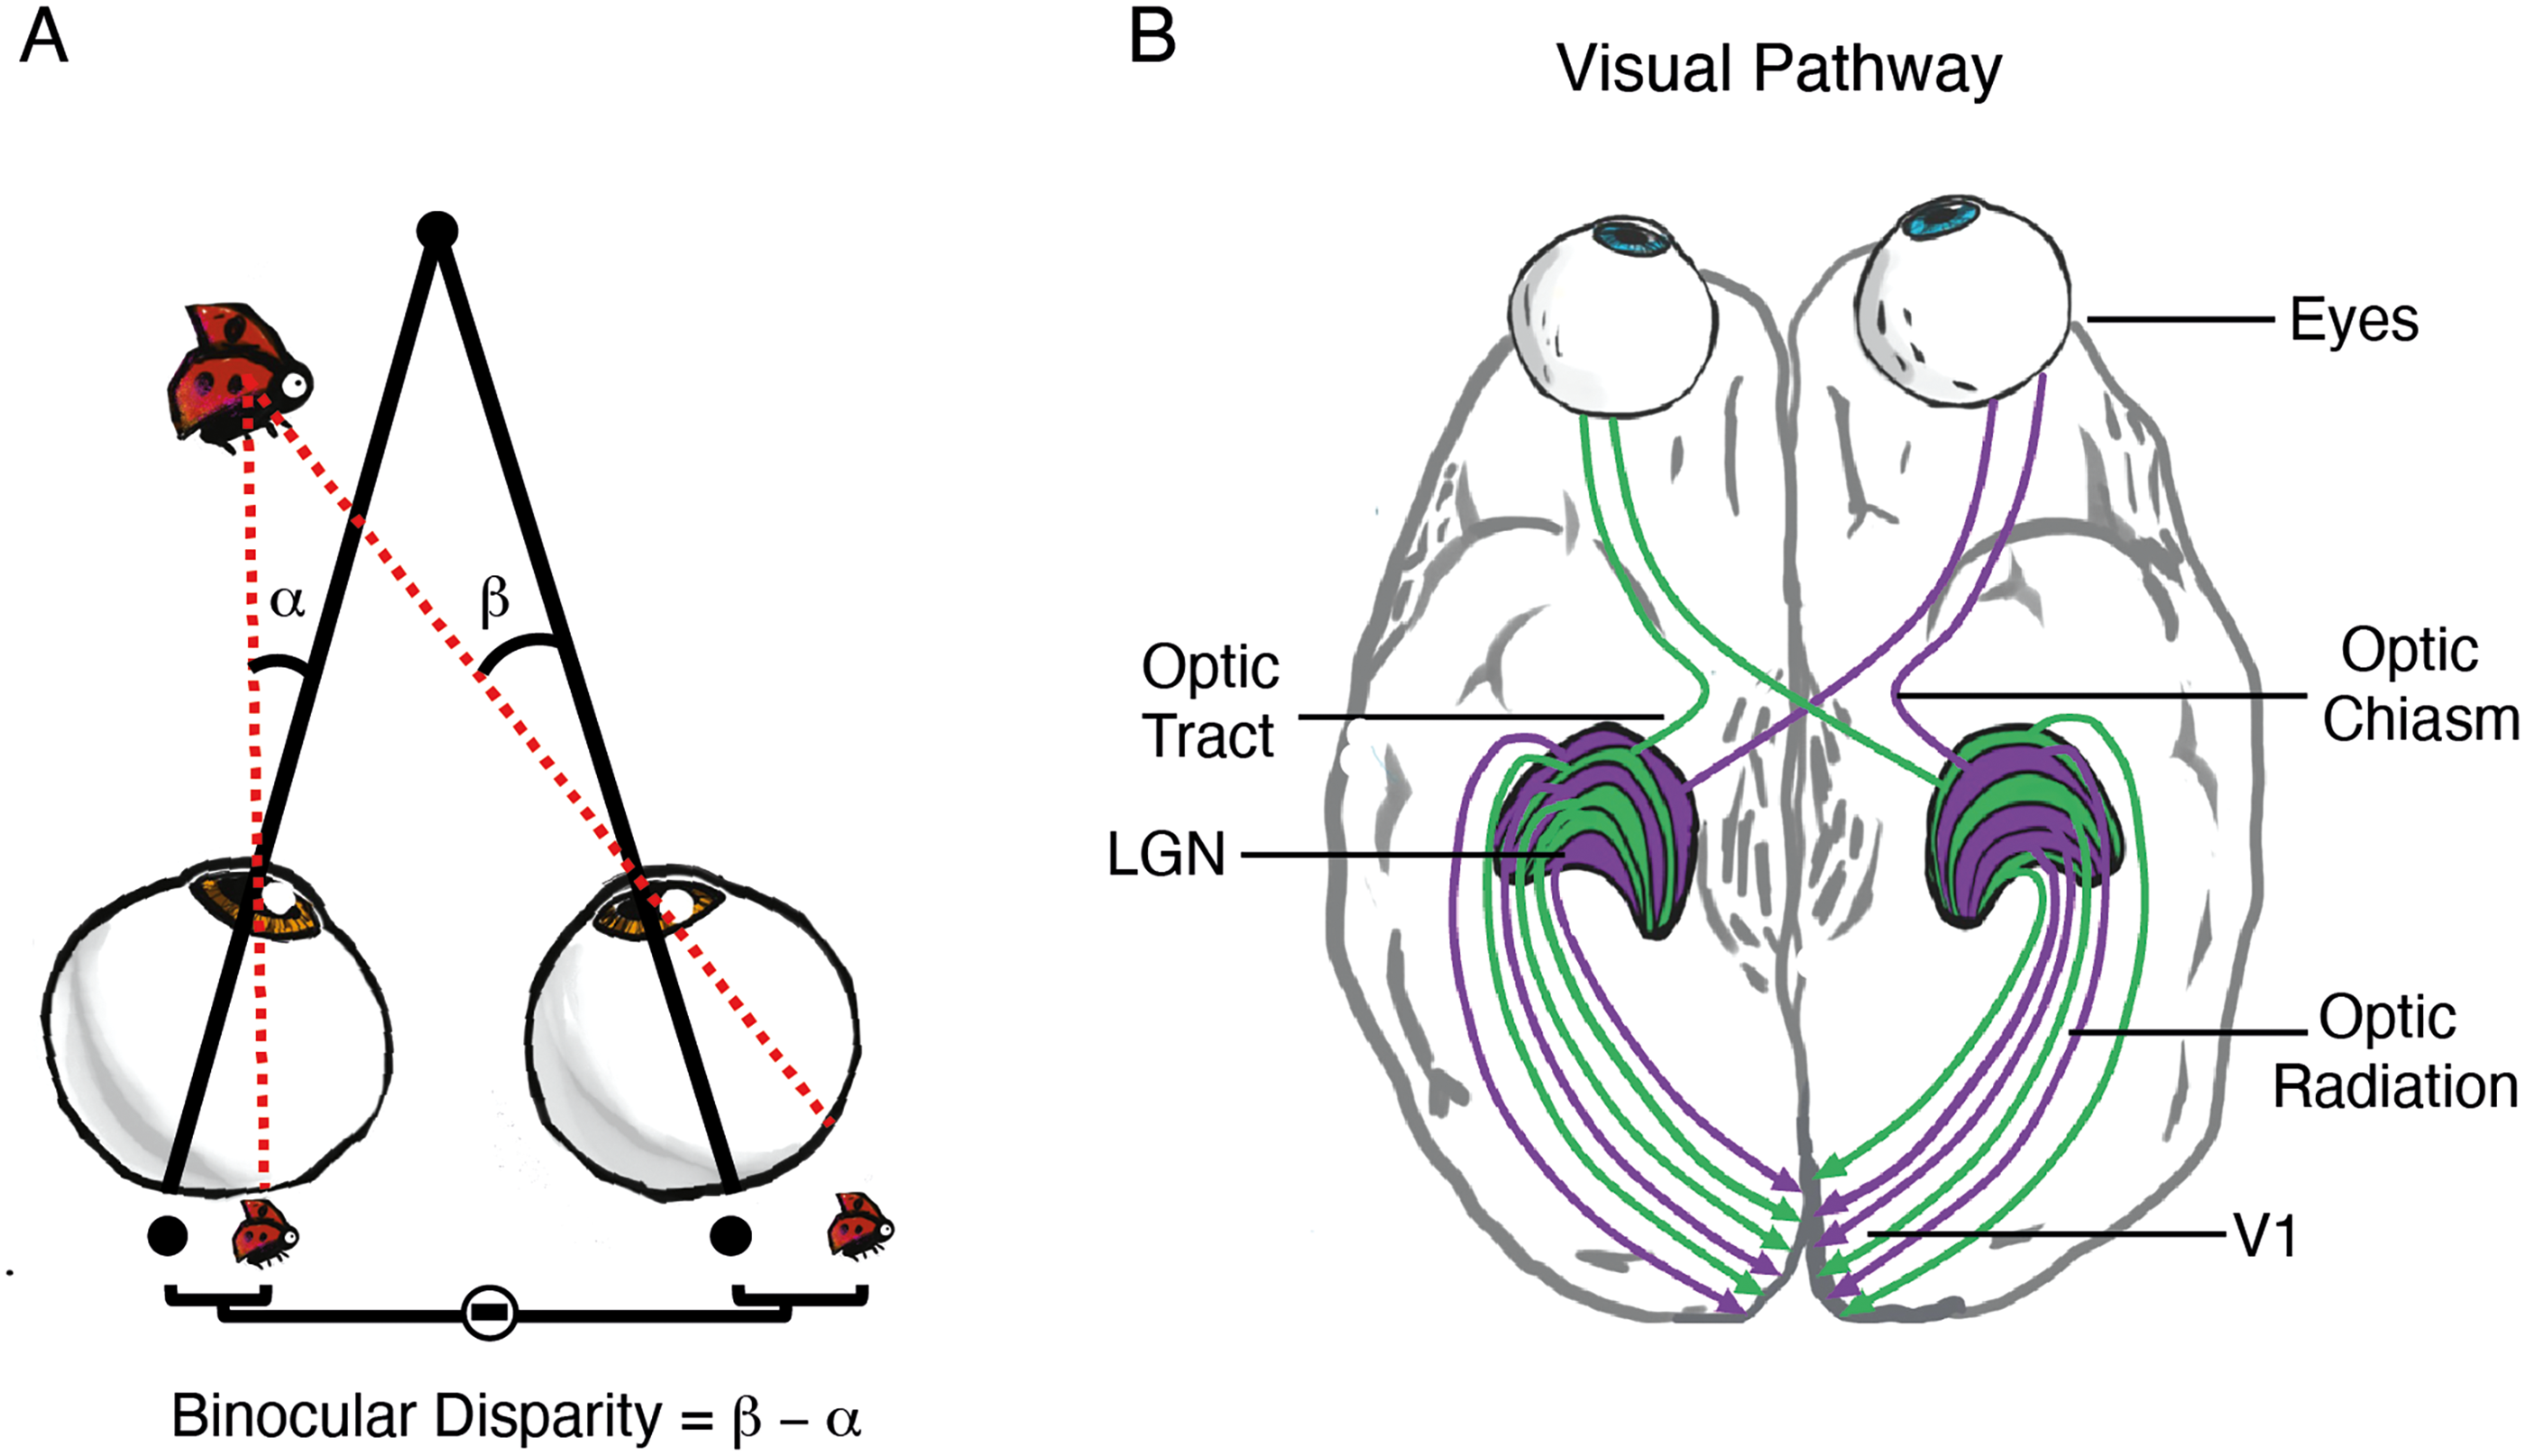
The human binocular vision system. (A) shows how the different viewpoints of the two eyes leads to binocular disparity between the retinal images. When the eyes are looking straight ahead (fixation) a bug in the near visual field forms images on slightly different locations on the two retinas (β − α). (B) shows the pathway from the eyes via the optic nerve, optic tract, lateral geniculate nucleus (LGN), optic radiation to the eventual combination in the primary visual cortex (V1).
Several conditions are needed for the two eyes to produce a perception of depth. The most obvious is the presence of forward-facing eyes that can point in the same direction and focus on the same point. This usually requires adequate control of both eye motility and stability, although the owl is an exception (Steinbach & Money, 1973). In addition, the eyes need to have similar ability to focus images as blurring in one eye destroys the quality of matched binocular information. When these conditions are not met, the balanced stimulation of binocular neurons, critical for perception, is disrupted. If this happens in early childhood, binocular vision does not develop normally. Indeed, around 2–5% of children have amblyopia (Powell & Hatt, 2009), a cortical weakness of vision in one eye that is the most common visual impairment in the United Kingdom. Where intervention is not attempted or unsuccessful, the loss of binocular vision persists throughout life in the form of amblyopia. An often-unforeseen consequence is that if life events result in accidental damage to the unaffected eye of amblyopes, there is a risk of some form of blindness or low vision for the rest of the person's life (van Leeuwen et al., 2007).
In this review, we will consider how MRI has been used to investigate human binocular vision, presenting a number of different approaches including (i) functional MRI to investigate which visual areas are involved in binocular vision and the functional organisation within these areas, (ii) recent advances in magnetic resonance spectroscopy that indicate a role for inhibitory transmitter GABA in determining eye dominance and (iii) diffusion-weighted imaging that quantifies the white matter connections between areas that reflect binocular depth perception . Having laid out these approaches in the healthy visual system, we briefly describe their application in the abnormal binocular system.
Brief Primer to Magnetic Resonance Imaging
MRI uses a superconducting magnet and radio waves to measure different aspects of brain structure and function. Figure 2A–C shows three common types of imaging that can be performed with the MRI scanner. Figure 2A shows a functional MRI scan, indicating the brain regions that are more active when people view a visual stimulus that contains depth information compared to one that does not. FMRI scans use the blood-oxygenation-level-dependent (BOLD) signal, which is a measure of the ratio of oxygenated: de-oxygenated blood within the brain. Brain regions that are active have an increase in demand for oxygen, which is associated with an increased flow of oxygenated blood to the region. Figure 2B shows how the concentrations of excitatory and inhibitory neurotransmitters glutamate and GABA can be measured within a small region of brain tissue. Given the necessary neuronal interaction between information projecting from the two eyes to produce binocular vision, knowing the local concentrations of these major transmitters could provide insight into the requirements for successful signal combination for eye balance. Finally, Figure 2C shows an example of diffusion-weighted imaging that can be used for measuring white matter tracts that connect different brain areas. This technique exploits the fact that water molecules diffuse more freely along the length of axonal compartments, compared with transversely. The diffusion difference is summarised by the measure of fractional anisotropy. In addition to visualising the pathways, it is possible to quantify the condition of the white matter, which may be affected by disease or damage and track any improvements that can be achieved with training or rehabilitation.
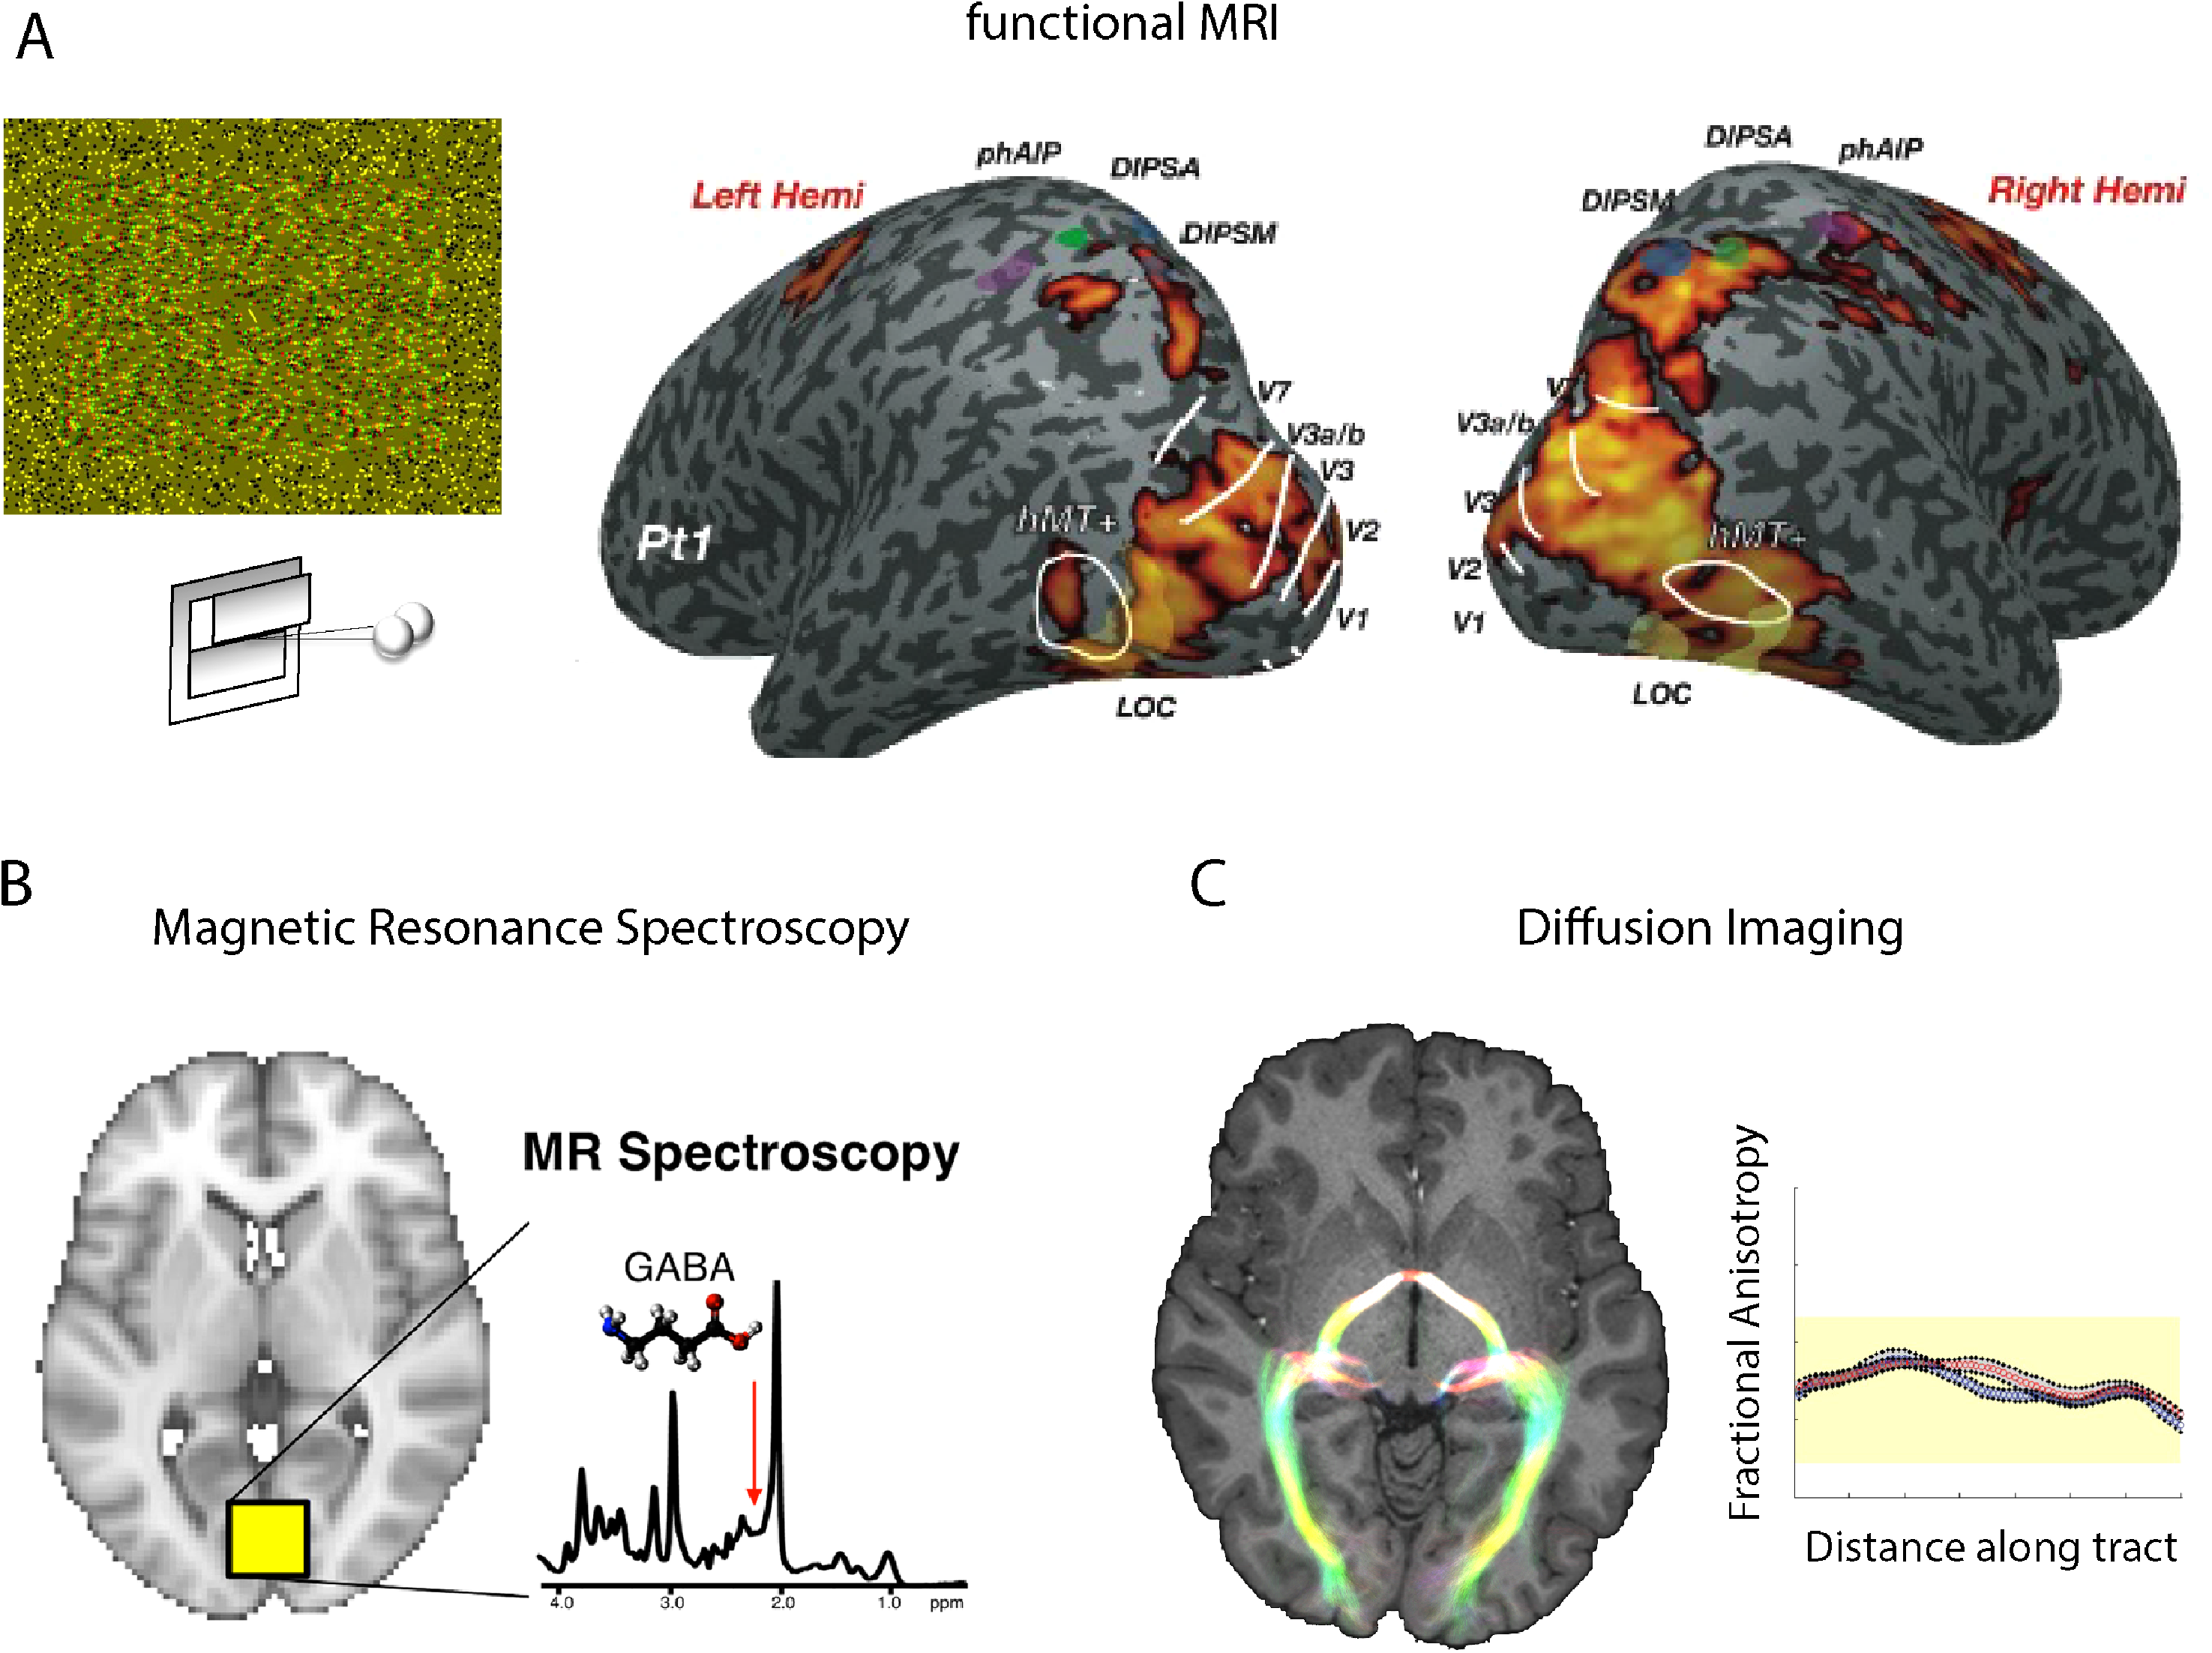
Magnetic resonance imaging techniques to investigate the binocular visual system. (A) shows the regions activated using the BOLD signal when a participant is viewing a stimulus defined by binocular disparity (adapted from Ip et al., 2014). (B) is an illustration of how neurochemical signals can be quantified from a small region of the cortex, allowing concentration levels for inhibitory transmitter GABA and excitatory transmitter glutamate to be determined (adapted from Ip & Bridge, 2020). (C) shows the tracts that can be identified using diffusion-weighted MRI and the metric of fractional anisotropy (FA) that can be extracted along the tract and used as a measure of white matter microstructure (adapted from Ajina et al., 2015).
Retinotopic mapping is particularly useful in visual MRI studies: this technique models the response of individual fMRI voxels to a visual stimulus (Figure 3A). It allows mapping of the topography of visual cortical areas and permits the identification of individual visual areas based on their representation of the visual field (Figure 3B). The same technique also provides a measure of the eccentricity representation voxel-by-voxel within an area. An extension of this paradigm permits a population receptive field (pRF) to be modelled for each voxel (Figure 3A), by identifying the range of stimuli that are effective at activating a specific voxel. This allows for a map of pRF size or other properties across the visual cortex (see Figure 3B, right). The technique of retinotopy can be extended to evaluate the selectivity for binocular stimuli across multiple areas from primary visual cortex to extra-striate regions in the temporal and parietal regions. This approach combines fine-grained mapping of neurally active responses with the benefit of being able to map wide regions of the brain simultaneously.
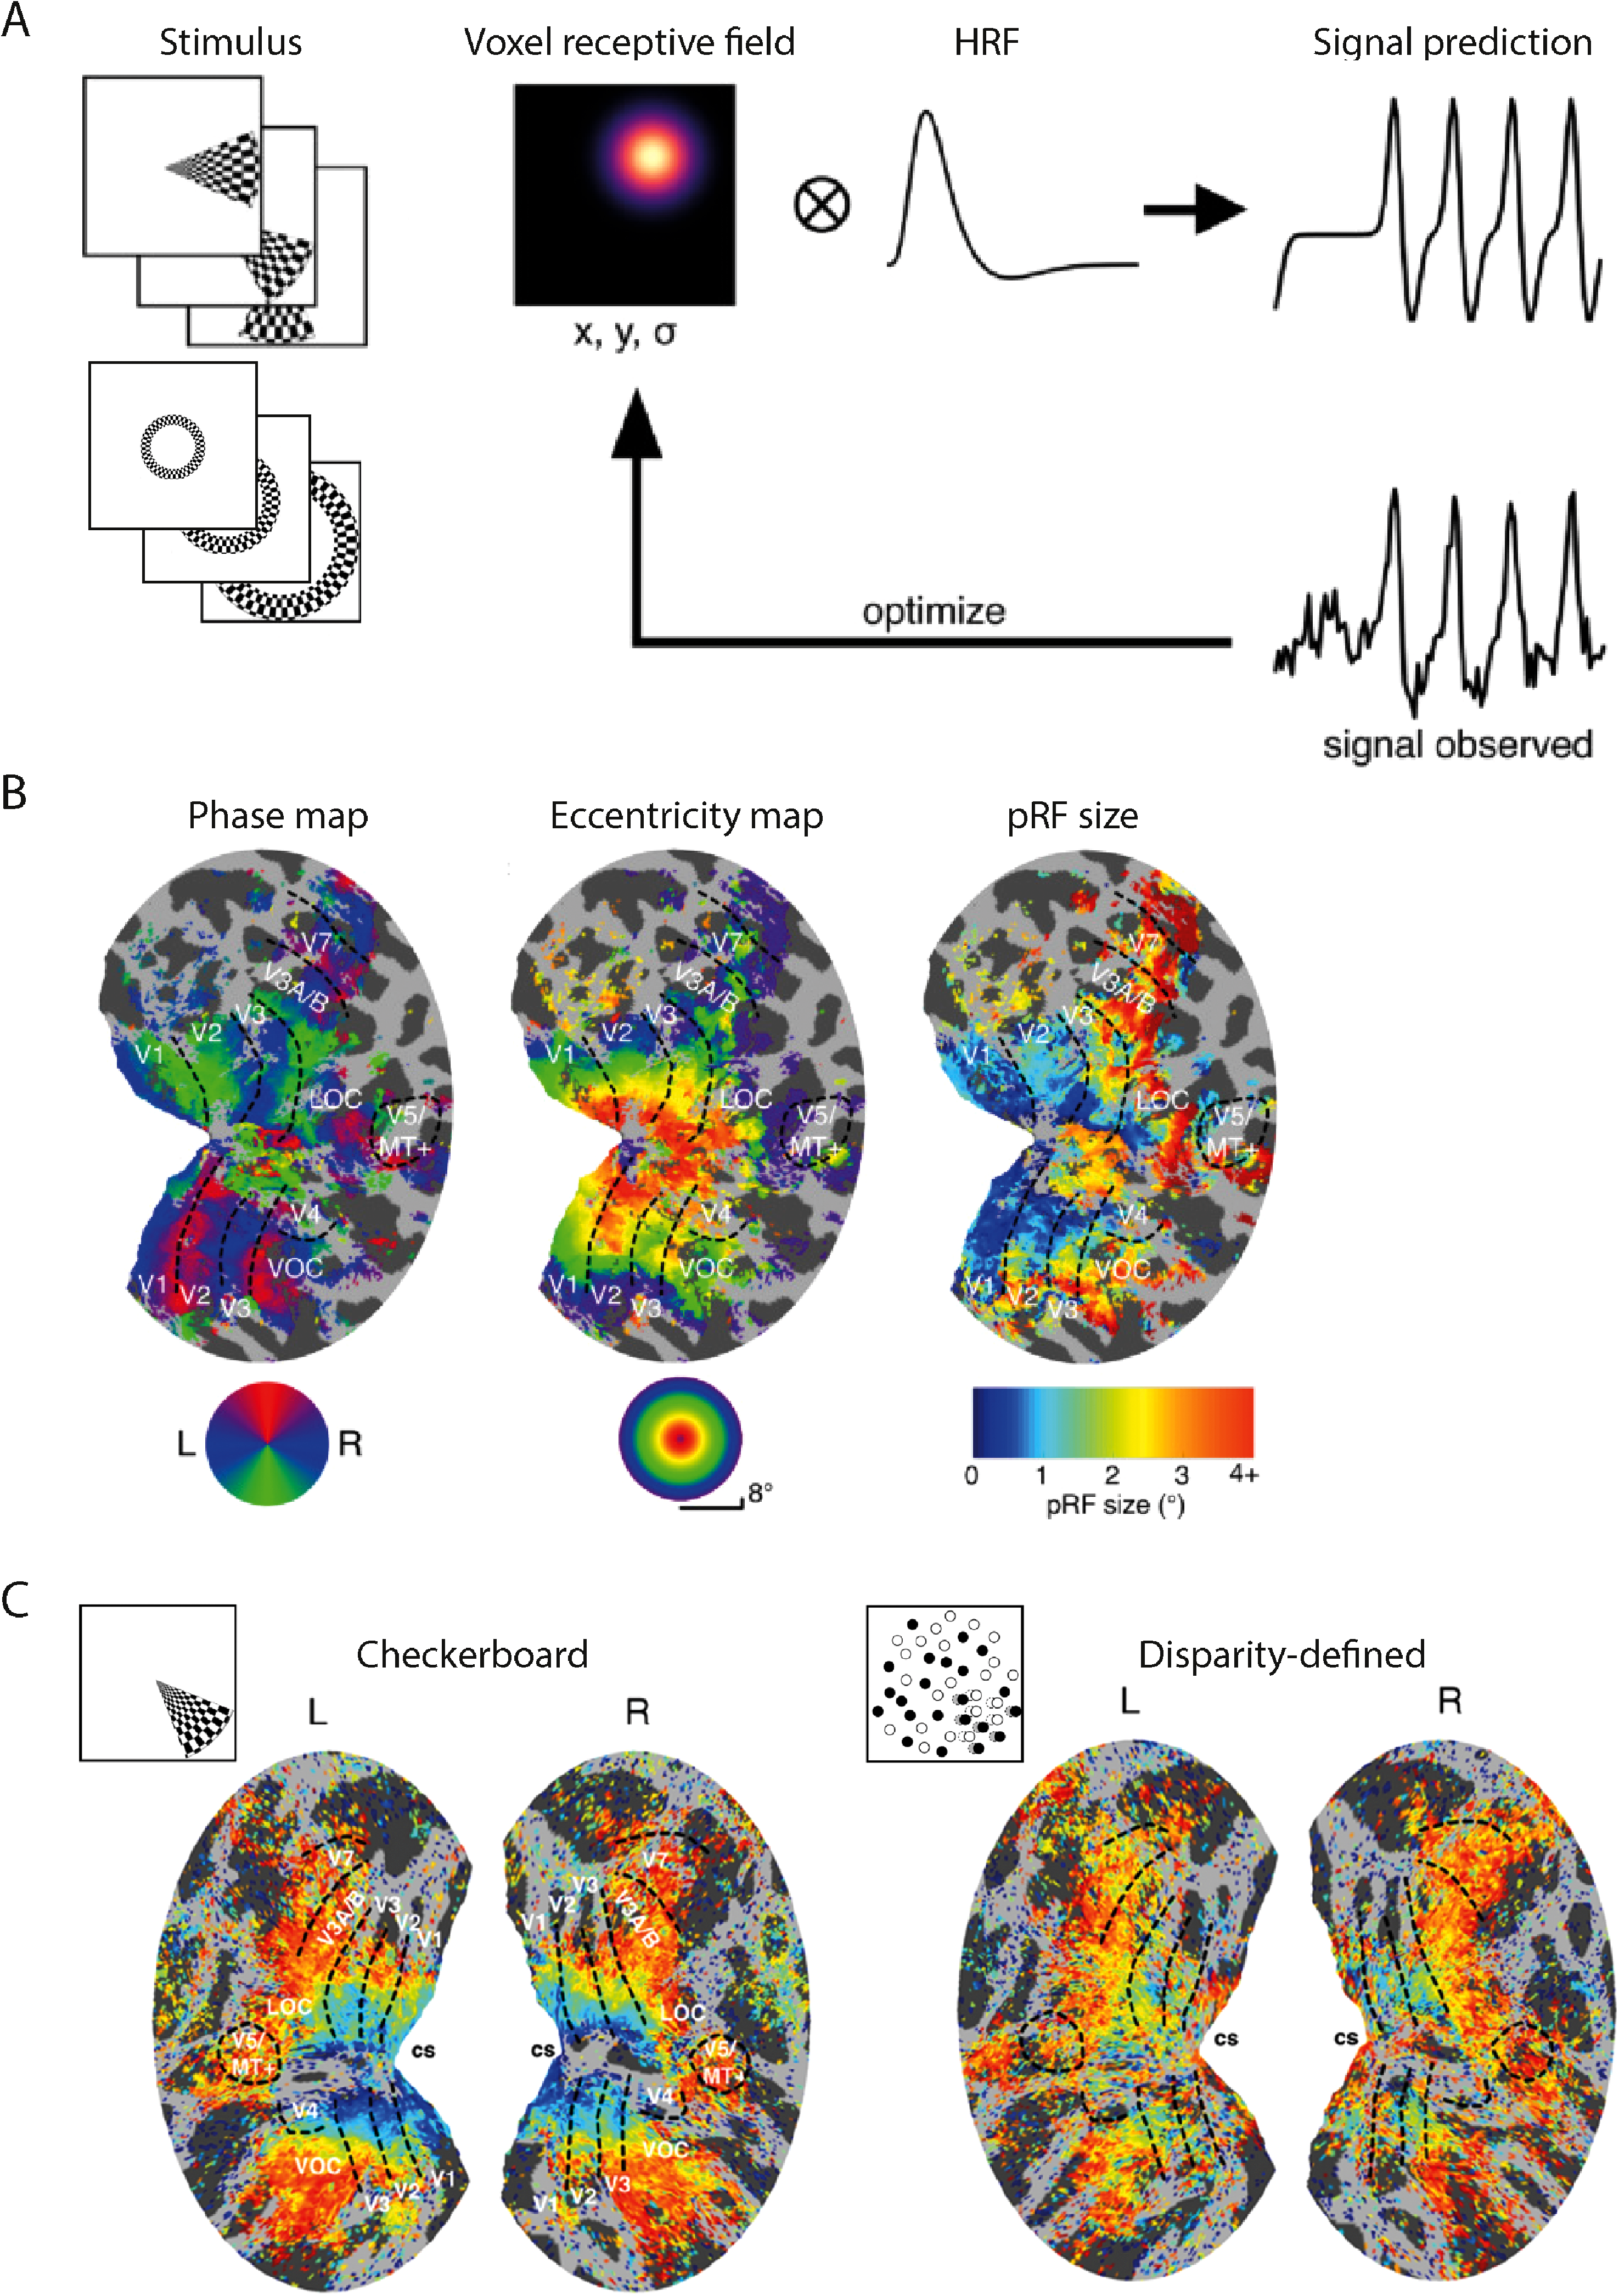
Using stimuli that move across the visual field in an ordered manner, it is possible to map out the topography of individual areas and estimate a ‘population receptive field’ or pRF that is the region of the world to which a given voxel responds (A). From this analysis it is possible to identify within individual visual areas, a map of eccentricity within each area and the size of the pRF for each voxel (B). When a disparity-defined stimulus is used for mapping the visual areas compared to a flickering checkerboard, the pRF sizes are larger for the disparity-defined stimulus by an amount predicted by computational models of binocular combination. All adapted from Alvarez et al. (2021).
Use of Functional MRI to Understand Human Binocular Vision Extends and Supports Notion of Depth Selectivity in Extra-Striate Cortical Areas
A key question in binocular depth perception is how, and in which visual areas, the correct combination of images from the two eyes occurs and ‘false’ matches are rejected (Cumming & Parker, 1997). Selection of correct matches and discarding of false matches is the first step to converting disparity signals to perceptually relevant measures of binocular depth. One method to investigate this matching is the comparison of responses to correlated and anticorrelated random dot stereograms (RDS). In correlated RDS, the dots presented are matched in contrast polarity in the two eyes, whereas in anticorrelated RDS, black dots in one eye are paired with white dots in the other eye (Figure 4A). For dense arrays of dots, aRDS patterns do not lead to a coherent percept of depth. Neurophysiological studies have indicated that neurons in primary visual cortex respond to the false matches in aRDS patterns (Cumming & Parker, 1997) but the response to these patterns is significantly reduced higher within the ventral visual stream, notably in V4 and IT (Janssen et al., 2003; Tanabe et al., 2004). Evidence from neurophysiology thus suggests that neurons in V1 perform a simple correlation analysis, and that assignment of correct matches is performed deeper in the ventral visual stream.
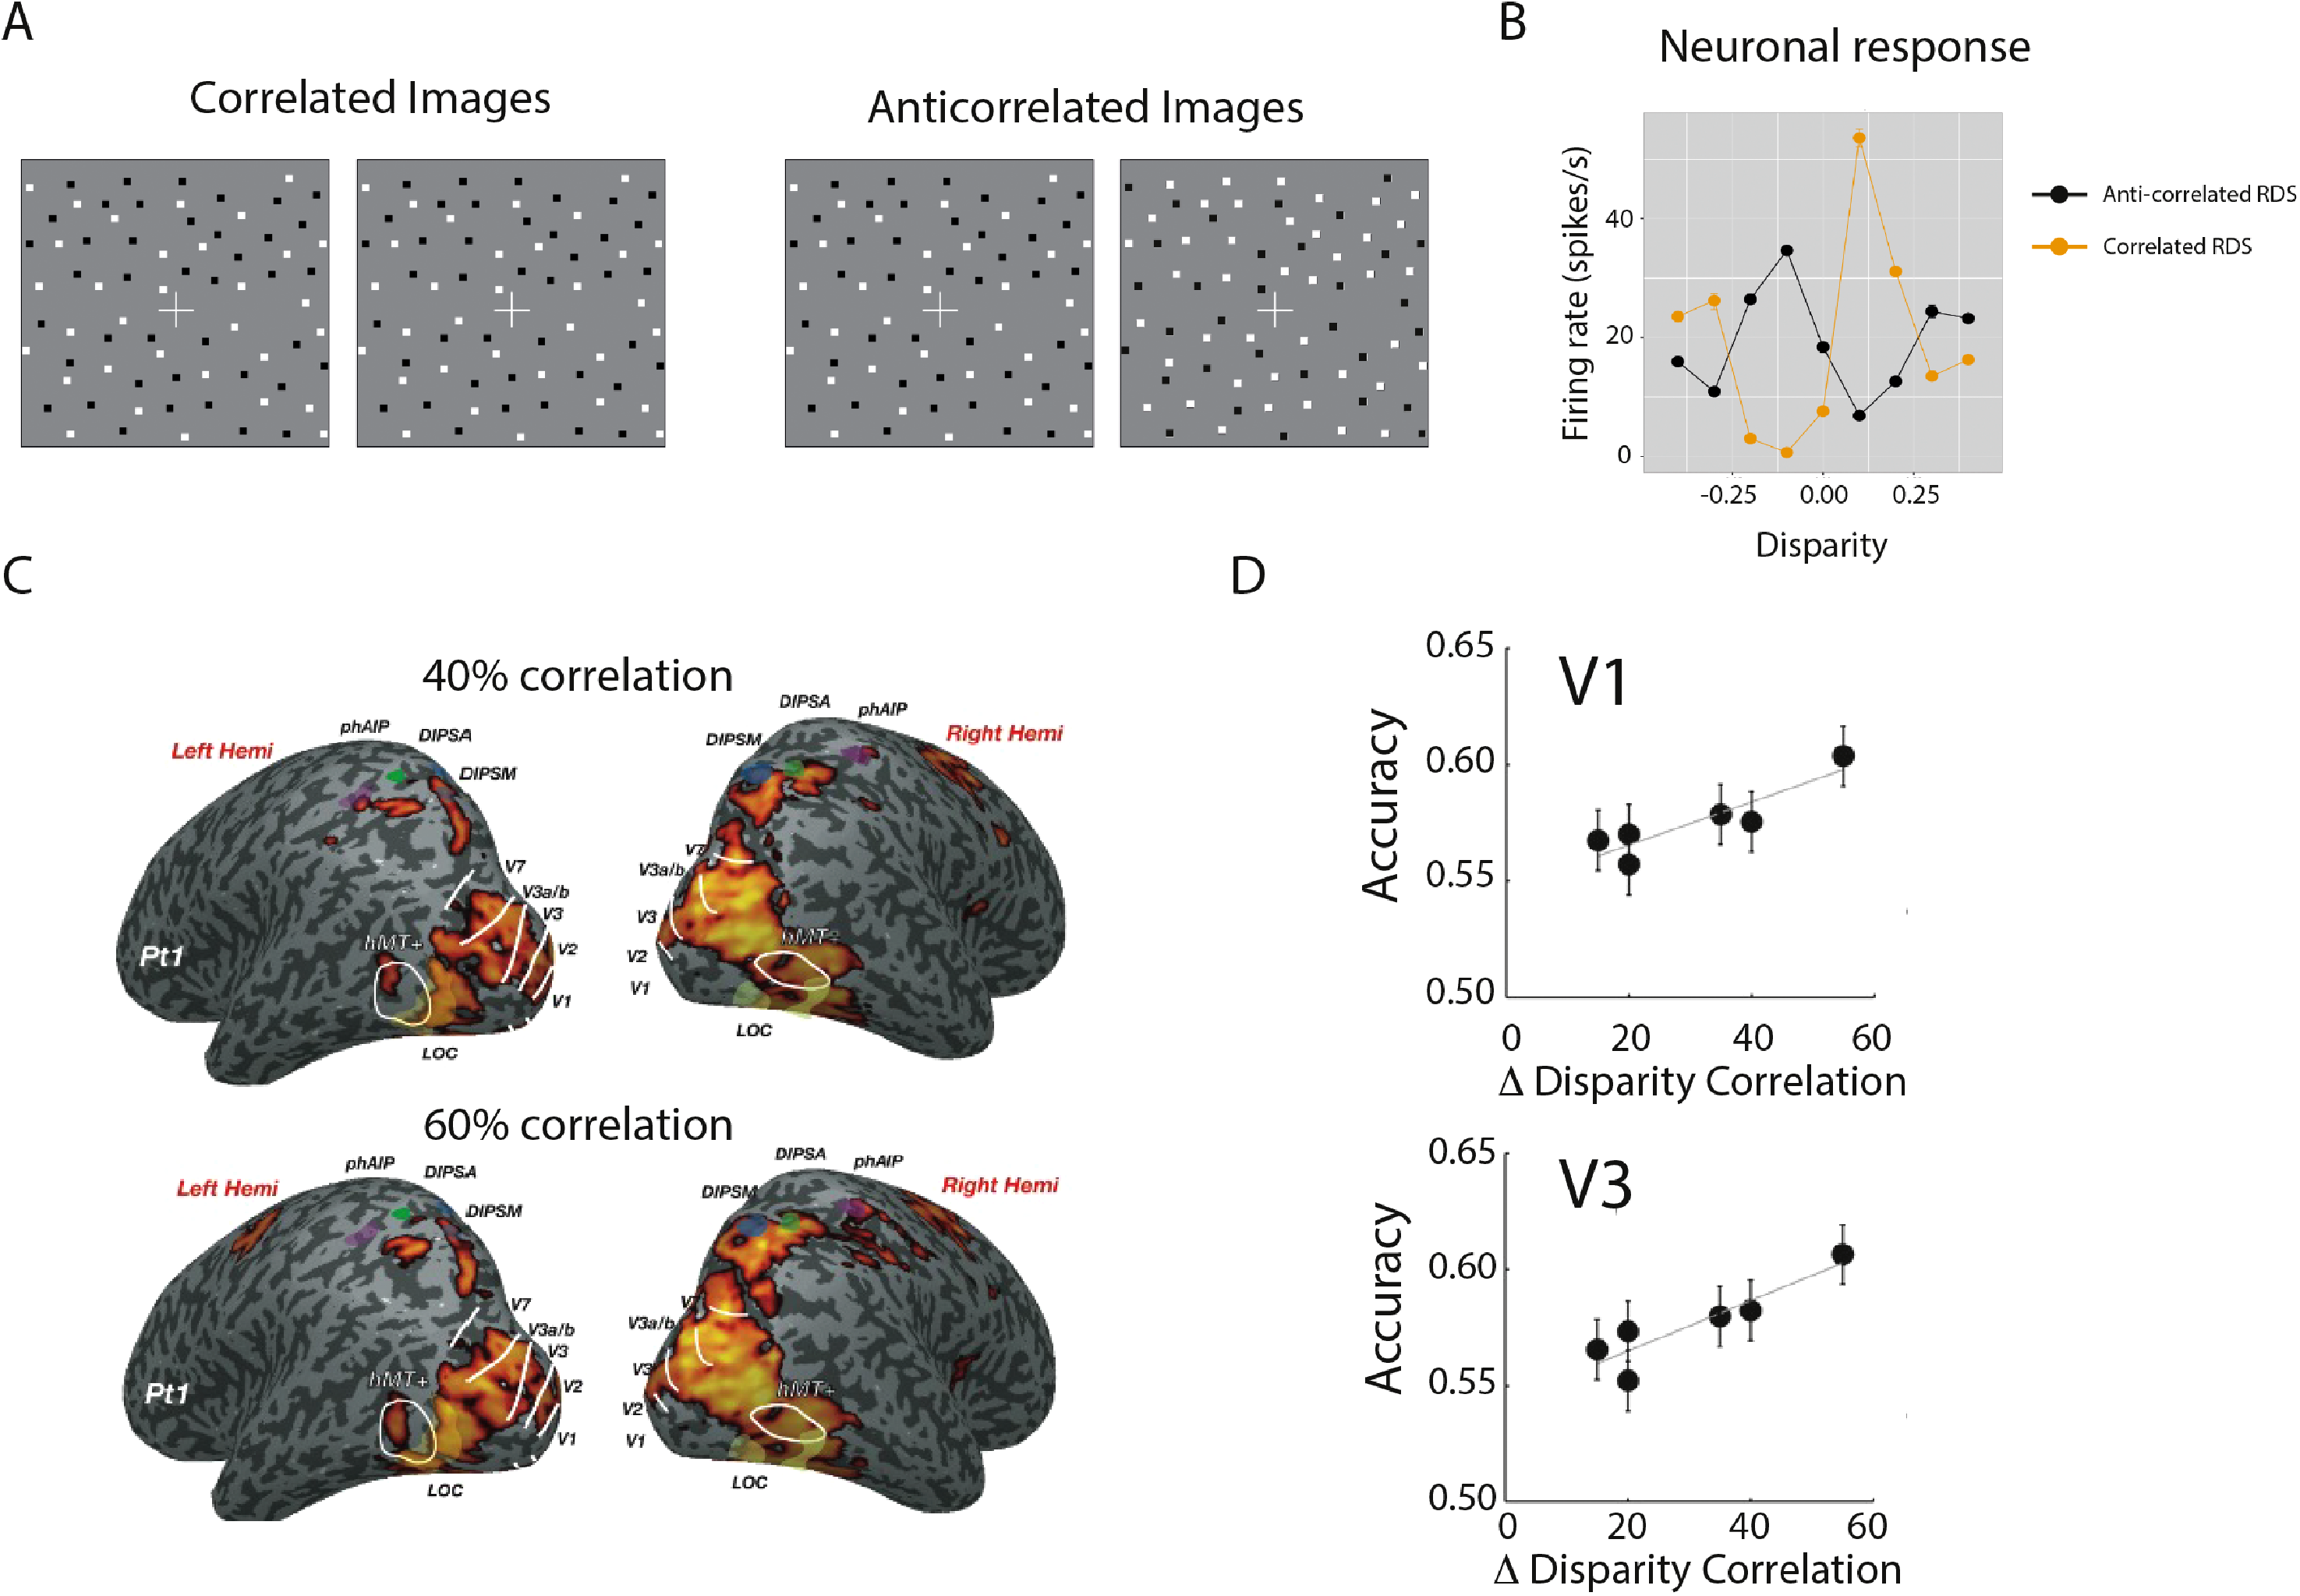
The effect of correlation to combine images on neuronal responses. (A) shows a pair of images in which the dots are correlated between the two eyes and an anticorrelated pair in which black dots in one eye are paired with white dots in the other and vice versa. (B) shows an example of neurons in V1 where all respond to these anticorrelated stimuli, even though they do not generate a strong percept of depth (replotted from Cumming & Parker, 1997). (C) shows the fMRI response to stimuli with different levels of correlation (compared to a blank screen). (D) shows that a linear classifier can detect information about disparity correlation, and that detection accuracy increases with difference in disparity correlation in areas V1 and V3 (Ip et al., 2014).
In human fMRI studies, most regions outside V1 show more consistent and coherent activity to correlated stimuli compared to anticorrelated (Bridge & Parker, 2007; Preston et al., 2008). Moreover, in both these studies, the lateral occipital area appeared to show the largest difference between the two stimulus types. Complementary work by Ip et al. (2014) modulated the correlation level of RDS patterns from a very low level of 5% up to 60% and measured the response across the visual cortex. They found that there was very little variation in the %BOLD signal with correlation level across visual areas (Figure 4C). However, the ability of a linear classifier to distinguish correlation levels was significantly linked to the difference in the disparity correlation of the stimulus in areas V1, V3 and LOC. In other words, the difference in fMRI response in these regions was greatest when comparing the 0% with the 60% correlation stimulus, but lowest when comparing 40% with 20% and 20% with 5%, suggesting that signal strength is encoded in these three areas (Figure 4D).
Binocular neurons need to receive signals from retinal positions that are slightly offset from one another to perform disparity calculations at the earliest level of input. Using the technique of pRF mapping (Figure 3), which allows a receptive field to be estimated for a given voxel in the brain, Alvarez et al. (2021) mapped the visual cortex at high spatial resolution (1.2 mm isotropic resolution) using stimuli defined by checkerboards, contrast reversing dots, motion and binocular disparity. When a binocular, disparity-defined stimulus was used, the pRF size in V1 was larger than when the stimuli contained only zero disparity (Figure 3C), suggesting that the disparity-responsive receptive fields in V1 are increased due to the offset of the receptive fields in the two eyes. This is consistent with the work of Barendregt et al. (2015) who used high-resolution fMRI to investigate the representation of a binocular bar across cortical visual areas, specifically whether it reflected the summation of the two retinal images (two slightly offset bars) or a fused cyclopean image (a single bar). They found that across all extrastriate visual areas the activity reflected the cyclopean image, but in V1 the response reflected the summed pair of retinal images. Both these results from humans are consistent with the neurophysiological work of Nienborg et al. (2004) who showed that the size of receptive fields in V1 for disparity-specific stimulation is greater than the size measured by luminance contrast stimuli delivered to left or right eye alone.
The second key point is whether the neural response reflects the retinal disparity compared to fixation (‘absolute disparity’) or the more perceptually-relevant ‘relative disparity’ between objects that is insensitive to changes in eye position (Cumming & Parker, 1999; Westheimer, 1979). Figure 5A shows how absolute disparity changes when the eyes are moved from looking straight ahead to looking at the bug. In contrast, relative disparity is the disparity between two objects, such as the tennis ball and the bug in Figure 5B. Now when the eyes move from fixation to look at the bug, the relative disparity between the objects remains the same.
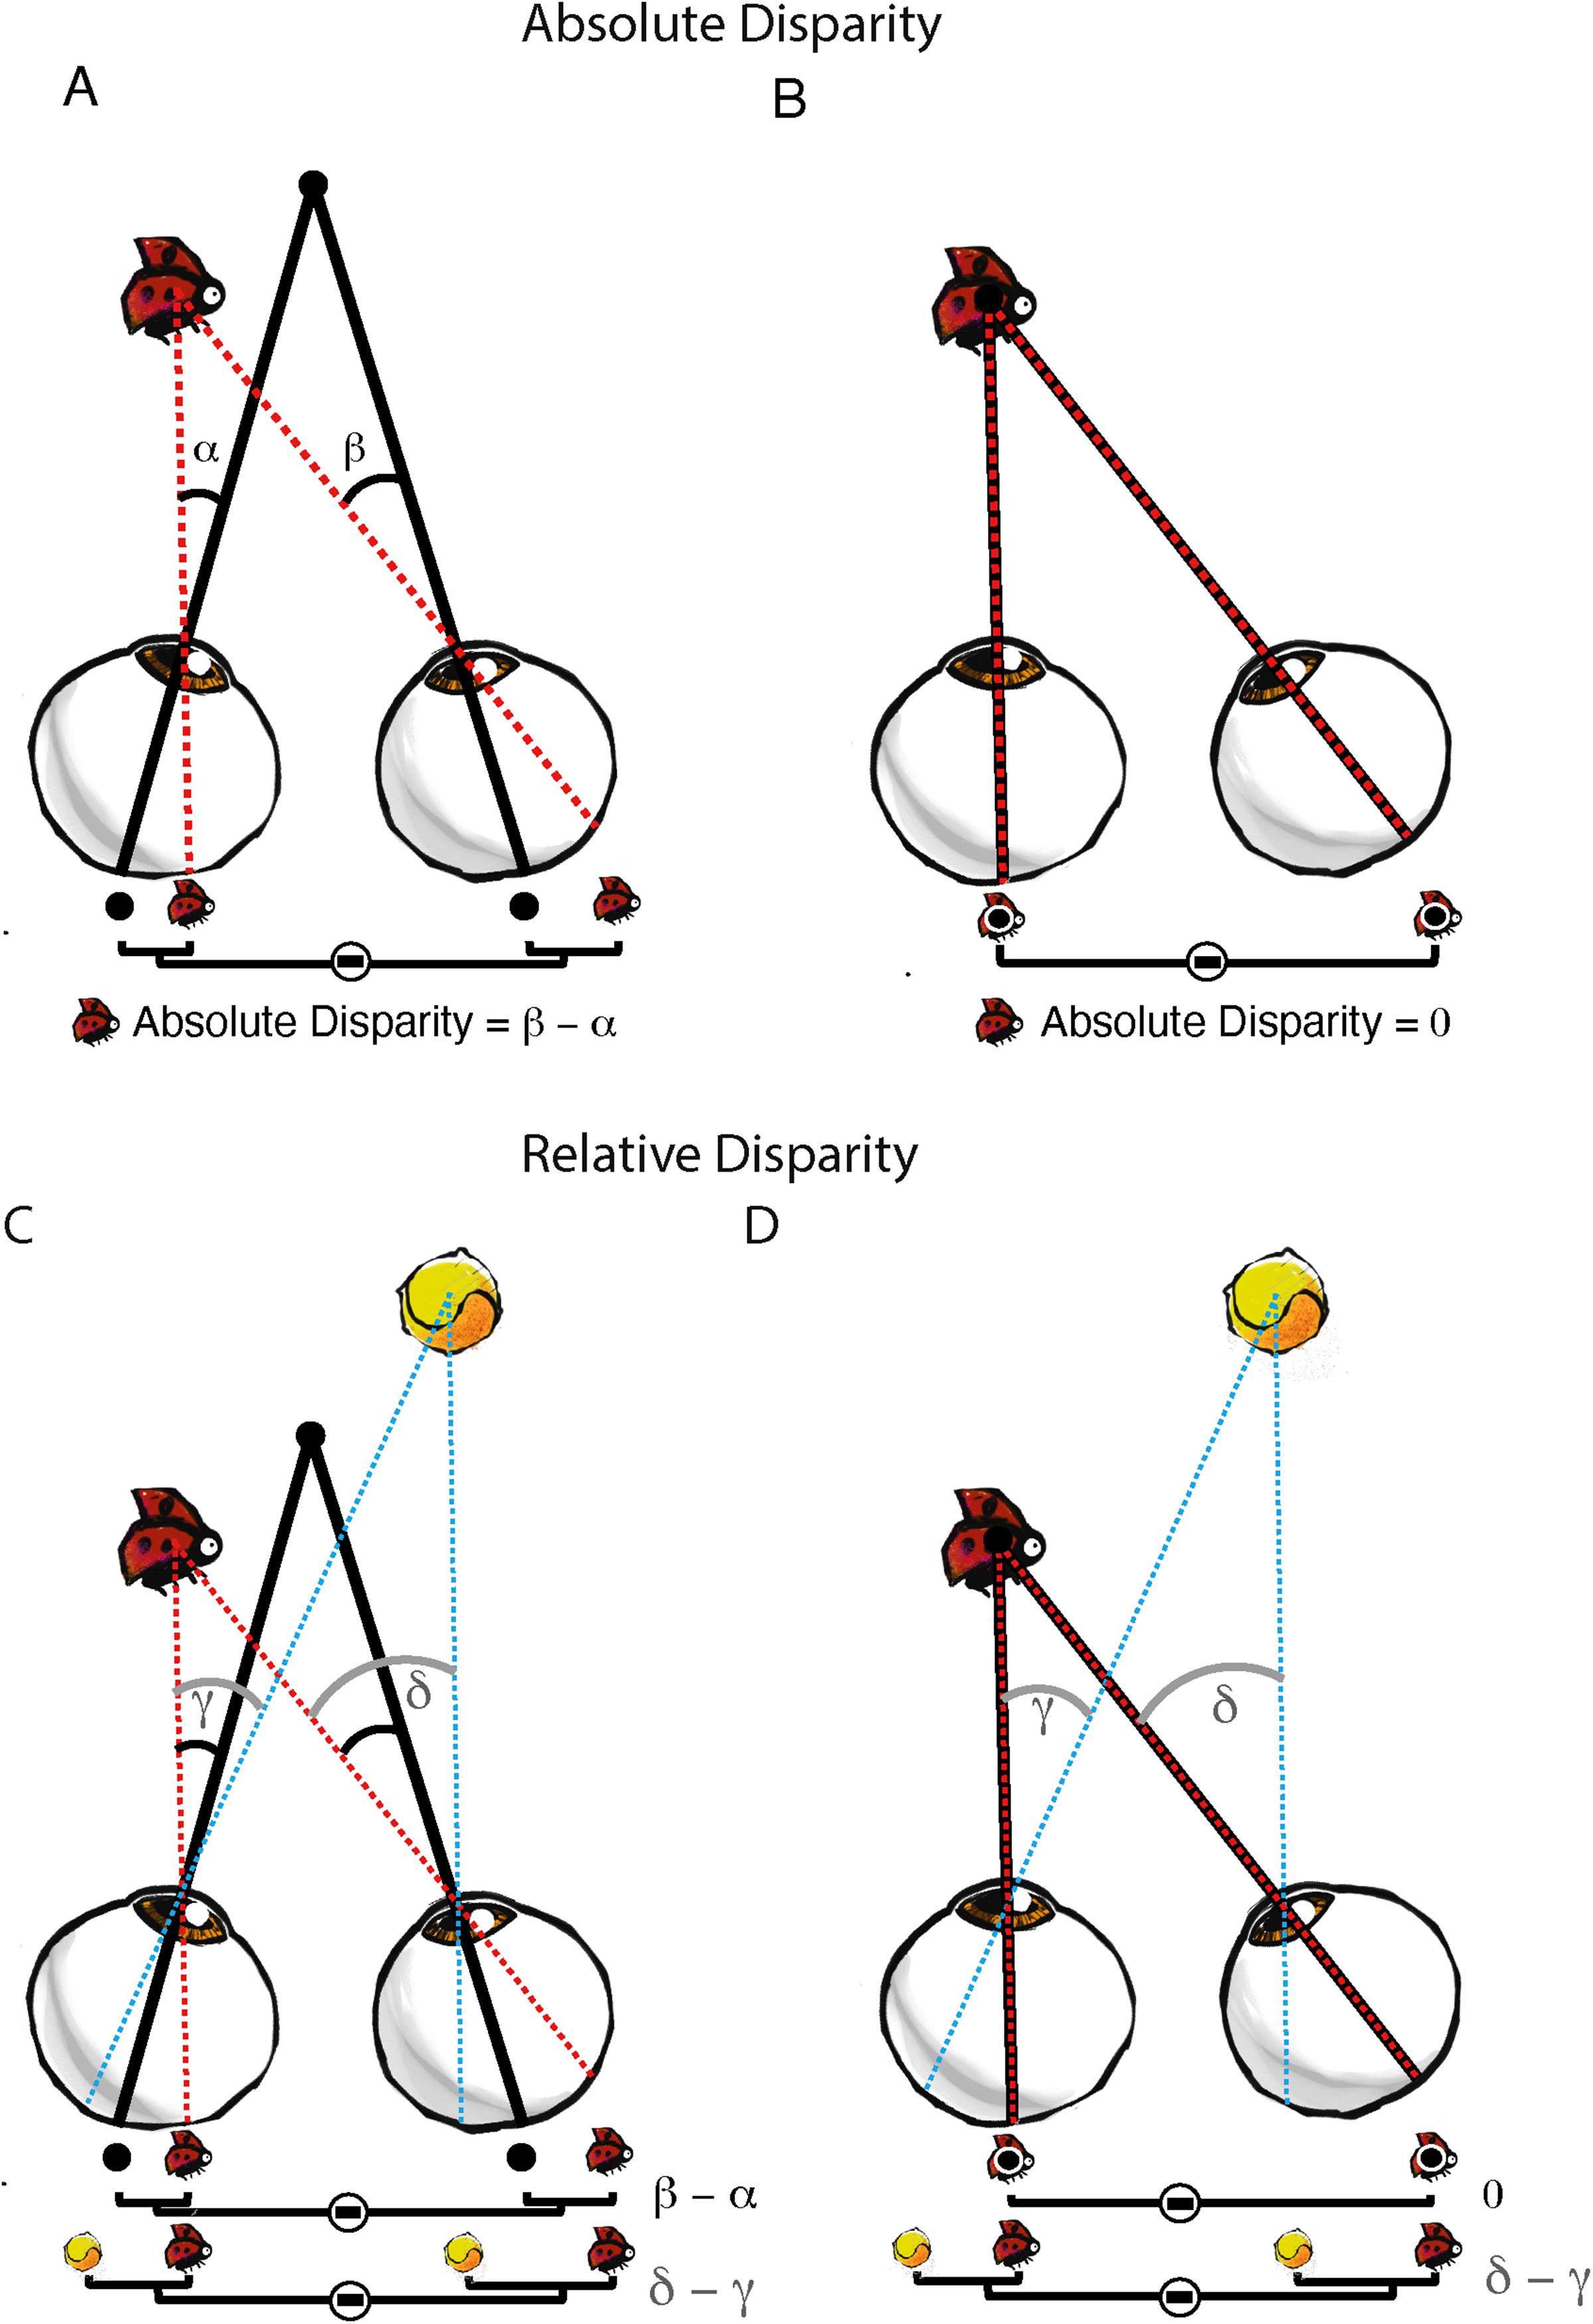
Absolute and relative disparity. (A) shows the absolute disparity of the bug relative to where the eyes are fixating (β − α) as in Figure 1. However, the absolute disparity of the bug becomes zero when the eyes move to look at it because its image then lands on the fovea of both retinas (B). When an additional object (tennis ball) comes into view (C), the relative disparity between the bug and the tennis ball is then defined by the difference between their images on the retina (δ – γ or between red and blue lines). When the eyes move to look at the bug (D), the relative disparity between the bug and the tennis ball remains constant (δ – γ). Thus, relative disparity is not affected by where the eyes are pointing.
Backus et al. (2001) were the first to investigate the activity across the cerebral cortex to RDS containing binocular disparity information using a stimulus rich in relative disparity. Two transparent planes separated in depth were compared to a single zero-disparity plane. The greatest level of activation was found in V3A, an area previously implicated in motion processing. A caveat at that time was that only a few visual areas could be reliably defined using retinotopic mapping. Yet subsequent work has largely reinforced the major result that area V3A is important in many aspects of binocular stereopsis. In this original study, however, the stimuli contained both absolute and relative disparity and thus it was not possible to dissociate these mechanisms.
Neri et al. (2004) used an adaptation paradigm to identify visual areas sensitive to absolute and relative disparity. This approach relies on the finding that repeated presentation of a stimulus (‘same’ blocks) reduces the BOLD signal compared to novel stimuli (‘mixed’ blocks). Thus, when measuring selectivity for absolute disparity, ‘same’ blocks all contained the same absolute disparity, ‘mixed’ blocks had varying absolute disparity and relative disparity remained the same across all blocks. Similarly, when measuring selectivity for relative disparity, the absolute disparity remained consistent across blocks. Dorsal regions V3A, hMT+ and V7 showed selectivity for absolute disparity, whereas ventral regions (V4, V8) showed equal adaptation to both types of disparity.
These early studies used planar disparity stimuli, showing flat surfaces in depth. However, the visual world consists of complex surface and object shape in addition to these flat surfaces. Therefore, to better understand the areas involved in processing of depth from disparity, a parallel line of research has explored the representation of disparity shapes in the human brain by contrasting different disparity structures. Georgieva et al. (2009) found that a network of parietal regions was involved in the extraction of shape from disparity. In addition, V3 and V3A were also involved in processing this stereo information and activity in V3A correlated with the depth perceived by the observers in these experiments. These dorsal regions were also robustly activated by the spatially sinusoidal modulation of disparity used in the study of Minini et al. (2010). In this study, disparity modulations were presented at different positions in depth (pedestal disparities). While all visual areas showed an increase in response with increasing pedestal disparity, the difference was greatest in dorsal occipital and parietal regions. Participants performed a task to indicate which of the two sinusoidal stimuli had the greater amplitude in depth. Importantly, the activation in dorsal visual and parietal regions was significantly greater for correct judgments of depth discrimination, as compared with incorrect judgements.
Thus, studies consistently find that dorsal visual areas, particularly V3A, and parietal regions are significantly involved in binocular depth perception, and that activity is related to the perception of depth. One of the areas that is more problematic to investigate with this type of approach is V1, due to the large number of stimulus parameters that are encoded at this stage in the visual pathway. Moreover, the neurophysiology indicates that V1 contains a much higher number of neurons that respond dominantly to one eye only. As a result, modulation by binocular disparity may be predicted to have a relatively weaker effect on neural responses. Furthermore, since the ocular dominance structures of V1 are 0.8 mm (Adams et al., 2007), the effect of disparity processing measured at 8 mm3 voxels would be attenuated further. Nonetheless, as the initial location for binocular combination (Hubel & Wiesel, 1962), neurophysiological data (Ohzawa et al., 1990) suggests that V1 may be a crucial step in disparity processing, and therefore requires further investigation with human neuroimaging.
High-Resolution Mapping of Binocular Disparity Organisation Across the Cortex
Orderly representation of stimulus features in the cortex provides computational advantages, and such organisation has been described using neurophysiological approaches for eye dominance (Hubel & Wiesel, 1965), orientation (Blasdel, 1992) and direction of motion (Albright et al., 1984). Studies using ultra-high field fMRI at 7-Tesla have exploited higher resolution mapping to reveal ocular dominance (Yacoub et al., 2007) and orientation columns in human V1 (Yacoub et al., 2008).
Cortical area V2 contains cytochrome oxidase stripes that are classified as thick, thin or pale. Optical imaging studies in the primate indicated an ordered representation of disparity from near to far within each of these sub-compartments (Chen et al., 2008; Ts'o et al., 2001). This type of organisation was investigated with fMRI in areas V2 and V3 by Nasr et al. (2016) at 1 mm3 resolution. Using colour- and disparity-defined stimuli, the authors mapped out the patterns of neural activity across the cortical surface. They found that the regions selective for disparity were distinct from those for colour in both V2 and V3. Thus, using MRI in human cortex, it appears that there are specialised regions of V2 for disparity, although no clear ordered representation was detectable.
By comparison, several studies have found that human V3A has an ordered representation from near to far disparities, which is not detectable in earlier areas. Goncalves et al. (2015) used 7T imaging at approximately 1 mm3 resolution to map the organisation of near and far disparities, finding consistent representations in V3A across scan sessions on different days. Building on their earlier work, Nasr & Tootell (2018) mapped out the thick stripes of V2 and thick-type columns of V3 and investigated the tuning of these regions to binocular disparity. In both regions, there was greater selectivity for near disparities in the lower visual field and greater selectivity for far disparities in the upper field, consistent with the perceptual bias observed in natural scenes (Yang & Purves, 2003). These findings with human MRI are compatible with the neurophysiological work of Anzai et al. (2011) who found clustering of disparity tuning in both V3 and V3A of the macaque.
One visual area in which organisation for disparity-selective neurons has been described neurophysiologically is motion area MT (DeAngelis & Newsome, 1999). Using single-neuron recording they revealed patches of disparity-sensitive neurons. Within these regions there was a smooth progression from near to far disparity selectivity. This ordered representation implies that disparity is an important parameter in the function of MT. However, the fine structure in this region may be at a resolution that is too high to be determined by fMRI, particularly given the small size of human hMT+ relative to V1.
Thus, looking across the cortical surface, there is no mapping of disparity in V1, but high-resolution fMRI has shown that macro-organisation becomes ordered in both V2 and V3, and potentially to a greater extent in V3A, which has been repeatedly highlighted as one of the visual areas most responsive to binocular disparity. Despite neurophysiological evidence for clustering of disparity-sensitive neurons in area MT, fMRI approaches have not revealed any such structure in human subjects.
Neurochemistry Underlying Balanced Vision for Binocular Combination
A key role for V1 is combination of input from the two eyes. The macro-organisation of this area relates directly to the interaction of the eyes, most obviously in the existence of the ocular dominance columns. Indeed, binocular neurons first appear in V1, where the balance between the eyes is a prerequisite to (excitatory) binocular combination. Interactions between neurons rely on neurotransmitters, both excitatory and inhibitory. Neurochemical signals can be measured using a specialised MR method called magnetic resonance spectroscopy (MRS). MRS uses chemical shift imaging to quantify the concentration of metabolites within a specific region of the visual cortex (Figure 2D; Ip & Bridge, 2022). MRS has been used recently to quantify the levels of glutamate and GABA in the visual cortex in order to provide insight into how interactions between the two eyes can be balanced.
Cortical inhibition via GABA in the V1 is thought to underlie binocular interactions. The first investigation used a variety of bistable stimuli to determine whether switching between percepts related to GABA concentration in the early visual cortex (van Loon et al., 2013). With all bistable stimuli, including binocular rivalry which involves interocular competition, they found that those with higher GABA switched between percepts more slowly. However, a later study using a bistable structure-from-motion stimulus, but not binocular rivalry, did not find a relationship between GABA concentration and percept duration (Sandberg et al., 2016). An intervention study by Lunghi et al. (2015) investigated the effects of monocular patching on binocular rivalry and visual cortex GABA concentration in people with healthy vision. Figure 6A illustrates the experimental protocol. Eye dominance was initially measured using binocular rivalry. Participants were then given an MRS scan before wearing a monocular eye patch for 2.5 h while moving around the research centre. At the end of the patching, eye dominance was measured again, before the second MRS scan. Behaviourally, consistent with their previous study (Lunghi et al., 2011), they showed that 2.5 h of patching increases the dominance of the patched eye (Figure 6B). In addition, the MRS data indicated that patching also led to a reduction in GABA concentration in early visual cortex (Figure 6C). Furthermore, the extent of GABA reduction correlated to the change in eye dominance, suggesting that the reduction in GABA was linked to increased dominance of the patched eye (Figure 6D).
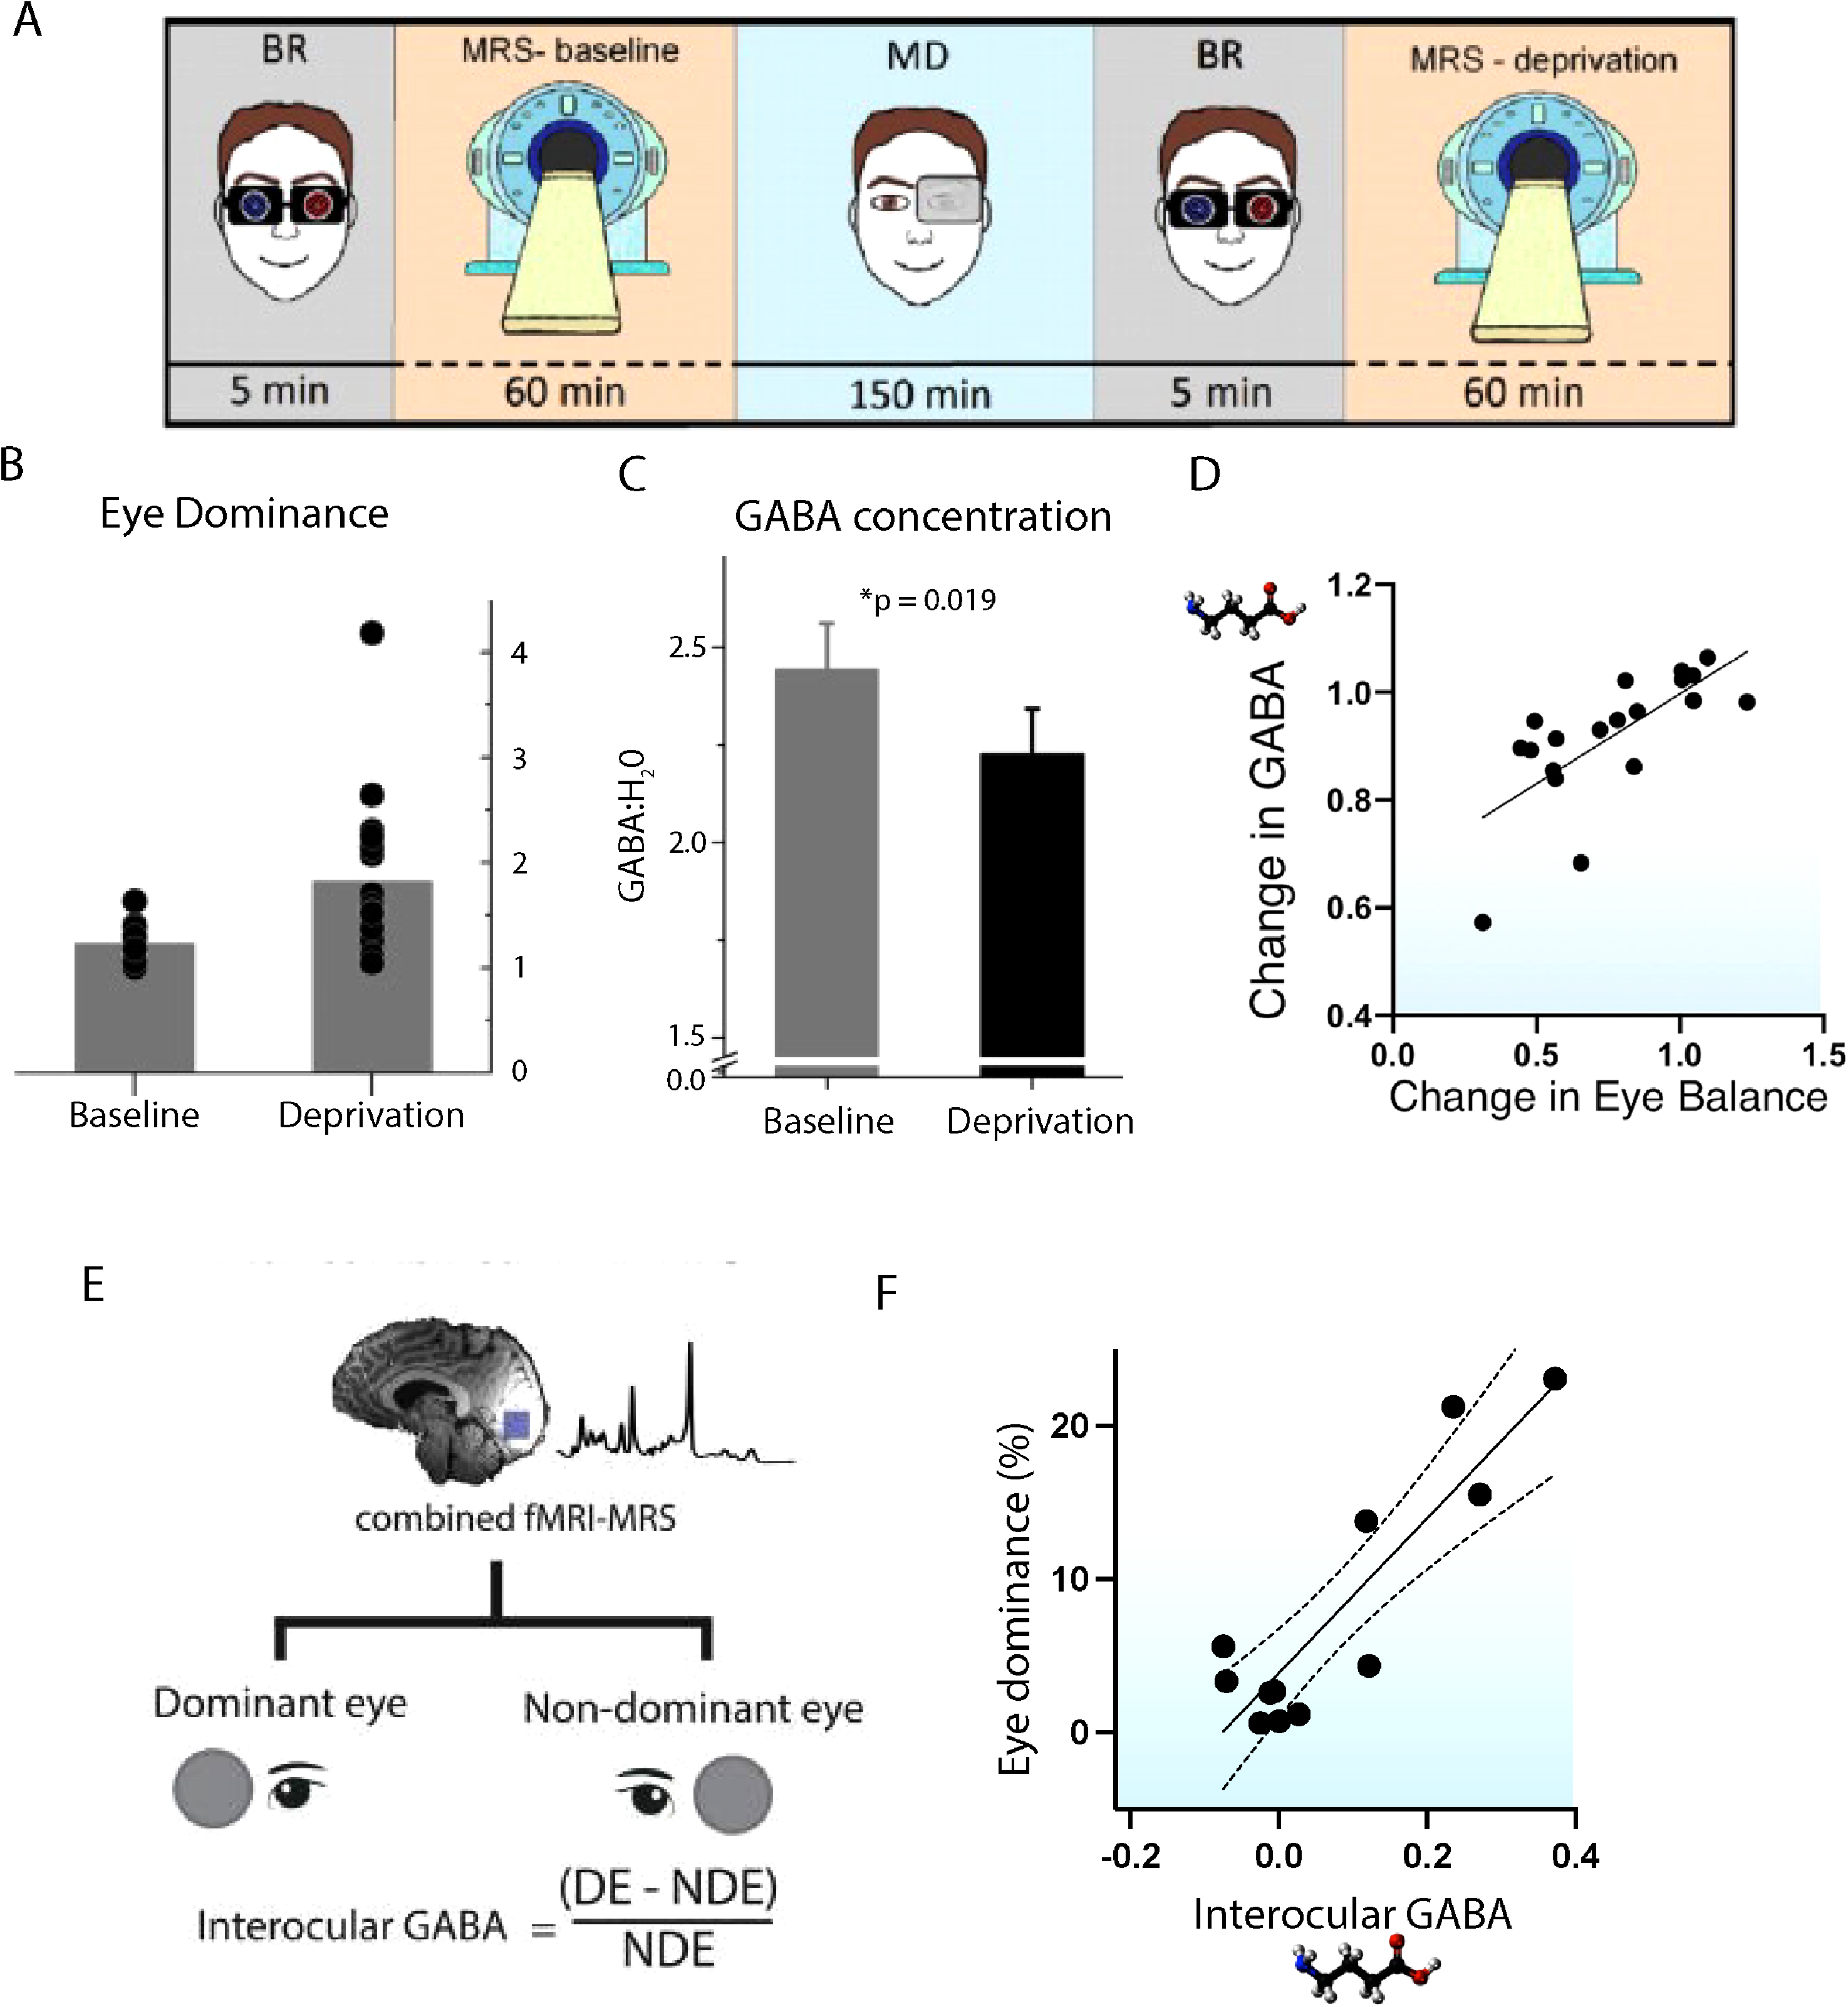
MRS studies of eye dominance indicate a role for GABA. (A) shows the experimental paradigm for Lunghi et al. (2015) who measured eye dominance and GABA levels before and after 2.5 h of monocular patching. The patching increased dominance of the patched eye (B) and decreased levels of GABA in the early visual cortex (C). Moreover, there was a correlation between the change in GABA and eye dominance, meaning that a greater decrease of GABA was seen in those participants with the greatest increase in dominance of the patched eye (D). Ip et al. (2021) measured GABA levels in healthy participants while the dominant and non-dominant eyes were stimulated with a checkerboard. The eye dominance of each participant was then correlated with the difference in GABA concentration during dominant (DE) and non-dominant (NDE) eye stimulation. (F) shows the significant correlation between these measures.
Ip et al. (2021) quantified levels of GABA in early visual cortex while each eye was stimulated monocularly with a high-contrast flickering checkerboard (Figure 6E). Eye dominance was measured behaviourally using a binocular rivalry paradigm that compared the amount of time that the rivalrous stimulus was perceptually evident to the dominant eye relative to the non-dominant eye. Those with a more dominant eye showed greater GABA concentration during stimulation of the dominant eye (Figure 6F). The same analysis applied to BOLD-fMRI data revealed no relationship. This indicates that neurochemistry may provide a more sensitive neural metric of eye dominance in normally sighted participants than traditional fMRI activation.
Rideaux et al. (2019) quantified levels of GABA and glutamate at 3T during presentation of RDS to relate neurochemicals in the early visual cortex to depth judgements. These random dot stimuli contained binocular disparity, which were either ‘same polarity’ where dots were either all black or all white or ‘mixed polarity’ where both black and white dots were presented. While a previous result showing that the polarity of dots can affect depth perception (Harris & Parker, 1995) was later shown to contain some significant confounds (Read & Cumming, 2019), Goncalves and Welchman (2017) showed that ‘same’ and ‘mixed’ polarity stimuli evoke different levels of activity in a deep neural network trained to make depth judgements. Neurotransmitter levels to these conditions were also compared to resting concentration. They found that the GABA concentration in the two stimulation conditions did not differ from rest, but did differ from each other, with a lower concentration for mixed polarity. There was, additionally, a significant correlation between GABA concentration in the two stimulation conditions, but not with rest. The glutamate concentration did not differ between stimulation and rest either, but glutamate was higher in the mixed polarity condition compared to the same polarity (and did not differ from rest). Unlike GABA, glutamate levels were correlated between both stimulation conditions and rest, in addition to between the different polarities. The next important step would be to determine the behavioural relevance of these neurotransmitter differences.
Investigating the Pathways for Depth Perception
Diffusion-weighted imaging provides a method of tracking fibre bundles within the brain, by measuring the movement of water molecules within the brain. Specifically, the technique relies upon the differing extent of water molecules diffusion in different brain tissue types. While water molecules in cerebrospinal fluid are free to diffuse equally in all directions, those in the white matter tracts can diffuse more easily along the tract rather than across the myelinated axon membrane. Thus, the diffusion signal is anisometropic, directionally dependent. Moreover, the strength of this anisotropy, known as fractional anisotropy (FA) is related to the white matter microstructure, where higher FA is thought to reflect ‘better’ connectivity (Zatorre et al., 2012). In many different brain functions, and in disease, higher FA has been linked to superior cognitive performance (Grieve et al., 2007), learning a new task (Scholz et al., 2009) or less severe disease (Osoba et al., 2013). With respect to the white matter pathways involved in binocular vision, the earlier sections of this article laid out the extensive network of cortical visual areas involved in depth perception. Since both the dorsal and ventral visual streams have been implicated in depth perception, Oishi et al. (2018) were interested in a tract called the vertical occipital fasciculus (VOF; Yeatman et al., 2014) which runs inferior–superior in the occipital lobe. This pathway could link the lower and upper visual field representations into a unified depth field.
FA in the right VOF was correlated with stereoacuity, whereas there was no relationship with the left VOF. Two additional control measures support the role of this tract; firstly, fMRI activation to correlated compared to uncorrelated RDS patterns was present in both the dorsal and ventral visual regions where the VOF fibre bundle terminated and secondly, performance on a contrast detection task (which does not require binocular depth perception) did not correlate with FA.
As both the spatial and angular resolution of diffusion becomes higher with increasing MRI field strength and more powerful coils it should be possible to investigate smaller tracts in addition to the major ones. Additional metrics of binocular disparity processing will be interesting to investigate, particularly given the non-human primate literature which suggests that fine (stereoacuity) and coarse disparity may be processed in different cortical locations (Uka & DeAngelis, 2003).
MRI Investigation Into the Amblyopic Visual System
A hallmark of amblyopia is the loss of visual acuity in the amblyopic eye that is accompanied by impaired or absent binocular vision, in addition to higher-level (Ho & Giaschi, 2009) visual deficits and lower-level effects on the eye such as impaired accommodation (Webber, 2018). Research with normally sighted participants described above demonstrates the extent to which multiple visual areas are involved in processing of binocular cues. It is hence not surprising that studies in the human amblyopic visual system have failed to pinpoint a single cortical area to explain the amblyopic deficit. Instead, MRI studies have characterised widespread abnormalities in functional activation during viewing of stimuli by the amblyopic eye compared to the fellow eye, while measures of cortical connectivity have shown abnormal functional and structural connectivity along visual pathways and visuo-motor, visuo-attentional regions (Clarke, 1999).
An early study of visual activity in four people with amblyopia (type not specified) found that the number of voxels activated to Gabor patches of different spatial frequencies was consistently reduced when the amblyopic eye was stimulated compared to the fellow eye (Goodyear et al., 2000). Indeed the majority of studies have found this reduction in activation of the amblyopic eye (Conner et al., 2007). Moreover, Hess et al. (2010) compared the difference in activation between the fellow and amblyopic eyes at low and high contrast and found that the deficit was greater at high contrast. They concluded that this might reflect a selective loss of P-type ganglion cells, consistent with the lower BOLD signal in LGN during stimulation of the amblyopic, compared to the fellow, eye (Hess et al., 2009).
By measuring pRFs across the visual cortex, one pertinent study aimed to determine what led to the cortical deficit in amblyopia (Clavagnier et al., 2015). While there was normal magnification across the cortical surface, the pRF size in early visual areas resulting from stimulation of the amblyopic eye was greater than stimulation of the fellow eye. The study presents an example of how an advanced fMRI technique, combined with computational modelling, can be used to dissociate multiple competing hypotheses. The authors concluded that enlarged pRF sizes in amblyopia reflected a loss of spatial resolution or increased disorganisation, rather than a loss of cortical magnification.
There is a clear case for investigating the white matter microstructure in amblyopia using diffusion imaging, given that it is a condition of altered connectivity of one eye. Indeed, there have been several studies that have identified changes not only in the early visual system, but also in higher visual areas. Allen et al. (2015) compared the white matter of 10 people with amblyopia (mixed aetiology) with age-matched controls and found that while there were no differences in FA, there was increased mean diffusivity (MD, indicating potential damage or loss of integrity) in the pathways from LGN to V1 and to hMT+. With a slightly larger, but still heterogeneous, population the same group found that the FA of the optic nerve and tract was lower in amblyopia, but there was no difference in MD (Allen et al., 2018). In contrast, consistent with their previous study, the optic radiation showed only an increase in MD. Duan et al. (2015) restricted their investigation of white matter tracts to 16 strabismic amblyopes, compared to 32 healthy controls. They only examined tracts within the brain, and found that the VOF, which appears to be linked to stereoacuity performance (Oishi et al., 2018) had increased MD compared to controls. However, in this sample there was no significant difference in the optic radiations.
MR spectroscopy has only recently been applied to an amblyopic population in a study by Mukerji et al. (2022), who measured the concentration of GABA in the early visual cortex and a control sensorimotor region. There was no difference in the GABA concentration in early visual cortex between the group with amblyopia and the control group. However, there was a significant correlation between the difference in visual acuity between the two eyes and GABA concentration.
It is important to keep in mind that amblyopia is a heterogeneous disorder in which the binocular loss may have resulted from strabismus (deviating eye), anisometropia (unequal refraction) or a combination of these conditions. Moreover, strabismus is not a unitary phenomenon with the misalignment commonly occurring due to esotropia (inward turned eye) or intermittent exotropia where one eye drifts outwards sometimes (Clarke, 1999). These realities, which are well known in clinical settings, are not always fully accounted for in the design of current MRI studies. As research on amblyopia advances, it will be important to replicate findings with larger cohorts and to account for the heterogeneity in the disorder.
Potential MRI Developments to Investigate Binocular Vision
The number of MRI scanners, and particularly the number of high field scanners, has increased over the past decade, and with this increase comes the potential for further innovation. As a sensory system that is predominantly cortical, there is great potential for improving our understanding of binocular vision processing, and a few examples are given here.
Firstly, while most current MRS methods focus on acquiring neurochemical concentrations from a single, large voxel to maximise the signal, modern methods allow for MRS imaging, which provides an image of multiple, smaller voxels. If this type of slab is laid across the visual cortex, it should be possible to determine whether the neurochemistry differs across the visual field (within V1) and also between visual areas. Since we currently hypothesise that eye balance is established and maintained due to competing GABAergic inputs in V1, a comparison of V1 GABA levels with those in V2 and V3 during monocular and binocular stimulation may provide further insight into the role of GABA in binocular combination. It may also be possible in consider regions of V1 within the monocular zone of the visual field to investigate the levels of GABA where there is no binocular combination.
Secondly, recent data have indicated that the visual system has considerable potential for plasticity (Bavelier et al., 2010). The design of training programmes to improve binocular vision in adults (and ideally children) should allow the concurrent measurement of neural changes in the brain. Such measures give an objective assessment of the effects of any interventions. Moreover, if we can elucidate the nature of the changes that are related to improvement in binocular vision future therapies can exploit this knowledge.
Finally, the accessibility of virtual and augmented reality systems opens the possibility to produce naturalistic disparity-defined 3D stimuli to determine how the system responds to different types of depth cues. In scenes that are rich, yet easy to manipulate, it will be possible to measure neural responses to subtle changes in disparity cues to investigate cue combination. These experiments have generally been performed with precise, but basic stimuli, restricted to two cues (Welchman et al., 2005). Using more interesting stimuli will also improve participant experience, a factor that should not be underestimated in this type of research.
Footnotes
Acknowledgements
This work was supported by the Medical Research Council (MR/K014382/1 to AJP and HB and MR/V034723/1 to HB and IBI) and The Royal Society (Dorothy Hodgkin Research Fellowship to IBI). The Wellcome Centre for Integrative Neuroimaging is supported by core funding from Wellcome (203139/Z/16/Z). AJP is supported by EFRE Projekt “Entwicklung einer Plattform für hochauflösende Magnetische Resonanz Spektroskopie (MRS) (7T) in Primaten in vivo.”
Author Contribution
HB: wrote and edited the manuscript; AJP edited the manuscript; IBI edited the manuscript.
Declaration of Conflicting Interests
The author(s) declared no potential conflicts of interest with respect to the research, authorship, and/or publication of this article.
Funding
The author(s) disclosed receipt of the following financial support for the research, authorship, and/or publication of this article: This work was supported by the Wellcome Trust, EFRE, Medical Research Council (grant number 203139/Z/16/Z, MR/K014382/1, MR/V034723/1).
Correction (August 2023):
Article updated online to correct article type from “Guest Editorial” to “Article”.