



Abstract
Dynamic visual acuity (DVA) is considered an essential component for studying the visual function, especially in challenging environments like team sports. Beyond frequent comparative studies, much information is still lacking about the mechanisms underlying DVA and possible differences in stimulus presentation. It is crucial to understand the performance of DVA under different conditions of contrast and trajectories to achieve more specific data and better ecological validity of measurements. Fifty-five top professional male Spanish athletes, including 23 soccer, 14 basketball, and 18 water polo players were selected. Static visual acuity (SVA) was evaluated at 5 m. DVA was determined at 2 m under combined conditions of velocity (52°/s), three trajectories (horizontal, diagonal 45° and 135°) and two contrasts (99.7% and 13%). Significant differences in most DVA conditions measurements show that the best scores correspond to horizontal, over diagonal trajectories, and high contrast. The correlation between SVA and DVA showed a different relationship depending on the contrast conditions. Professional soccer, basketball, and water polo players have similar characteristics with reference to all the DVA evaluated conditions.
Dynamic visual acuity (DVA) is defined as the ability to discriminate fine spatial details of an object during relative motion conditions between the object and observer (Ludvigh, 1962), and it appears to be an essential component in the study of the visual function. Team sports entail rather demanding visual needs because they involve constant movement with frequent changes in direction and speed under severe time pressure. Unpredictable paths of key elements, such as occlusions and segmentations, may also add difficulties to visual performance. Because athletes must analyze available temporal and spatial information during sports situations relatively quickly to make accurate decisions and precise responses, the visual system as a whole, and DVA, in particular, are expected to be of great importance for its practice.
The most common investigation approach has focused on determining DVA differences between athletes and non-athletes, and a close relationship has been found between DVA and the level of expertise in different team sports, such as water polo (Quevedo-Junyent et al., 2011), soccer (Jorge & Fernandes, 2019), baseball (Uchida et al., 2012), cricket (Kelly & Roberts, 2020), and volleyball (Morris & Kreighbaum, 1977), compared to sedentary.
Much information is still lacking about the mechanisms underlying DVA and possible differences in stimulus presentation. Conventional assessments are mostly aimed at horizontal displacement (Aznar-Casanova et al., 2005; Hoshina et al., 2013; Ishigaki & Miyao, 1993; Palidis et al., 2017; Rouse et al., 1988; Uchida et al., 2012; Yazgan & Cidi, 2023), with maximum contrast between the moving stimulus and the background (Chen et al., 2022). However, other studies have evaluated DVA in either predictable and random directions in soccer players (Jorge & Fernandes, 2019), and athletes involved in tracking sports (Yee et al., 2021), and different predictable trajectories in water polo (Quevedo-Junyent et al., 2011), and martial arts athletes (Muiños & Ballesteros, 2015). Hence, it is crucial to understand the performance of DVA under different conditions of contrast and trajectories (e.g., diagonals and vertical) to achieve better ecological validity of measurements.
Sports can differ from different visual factors, such as contrast levels (i.e., weather conditions, artificial illumination, glare, playing surface), target size (i.e., soccer, water polo or tennis balls), gaze angles, or visual attention (central vs. peripheral) (Erickson, 2021). All these factors contribute to challenging visual performance in players, in contrast to sedentary. However, although there is an amount of research showing superior visual skills in elite athletes, especially DVA (Jorge & Fernandes, 2019; Kelly & Roberts, 2020; Morris & Kreighbaum, 1977; Quevedo-Junyent et al., 2011; Uchida et al., 2012), as well as other aspects such as depth judgment (Barrett et al., 2017), eye movements (Di Russo et al., 2003), and peripheral vision (Berg & Killian, 1995), the intricate differences between DVA trajectory and contrast have scarcely been studied, with some notable exceptions, such as Yee et al. (2021), who compared predictable horizontal trajectories to random and unpredictable ones.
The main goal of the present study was to investigate the influence of contrast and trajectory of displacement of the target on the DVA between three groups of elite athletes, including water polo, soccer, and basketball players. Moreover, we explored the relationship between DVA and static visual acuity (SVA) in order to study potential differences between them and discuss the implications of these differences for each sport modality. Finally, we aimed to analyze the DVA loss, which is calculated as the difference among both skills (Marquez et al., 2017). To our knowledge, DVA loss between elite team sports players has never been explored in this domain.
Materials and Methods
Participants
Fifty-five male top professional Spanish athletes, including 23 soccer, 14 basketball, and 18 water polo players were selected. All of them had achieved the highest sporting achievements in their respective modalities. Mean age and standard deviation was 24.78 ± 3.93 years, ranging from 18 to 33 years. A certified and experienced optometrist conducted the assessments. Participants had a good binocular SVA of 1 (decimal) or better at distance (5 m), and none had any corrected refractive error superior to a range from −2.50 D to +1.00. Contrast sensitivity function was assessed using CSV1000 test and was within the normal range. Eye movements, both saccades and pursuits, were considered normal according to the Northeastern State University College of Optometry (NSUCO) oculomotor test criteria (Scheiman et al., 2018). Players had good ocular health and reported no recent history of medication intake or systemic illness. All participants provided written informed consent before participation. The study was approved by the UPC institutional review board (11/2018) and conducted in accordance with the Declaration of Helsinki (2013).
Instrumentation
Participants were tested using the Palomar Universal ring disk as a stimulus for spatial resolution (Palomar-Petit et al., 2008). This optotype (see Figure 1) has a peripheral gap, which can appear randomly in eight directions (right, left, up, bottom, up-right, up-left, bottom-right, and bottom-left) to challenge observers to choose from. The central circle ensures the same visual angle in all retinal meridians, because along with the peripheral gap, every size corresponds to the minimum separable visual acuity. The same optotype was used to measure distance binocular SVA and DVA. DVA was determined by using the computerized software DinVA 3.0 (Universitat Politècnica de Catalunya, Terrassa, Spain), validated in previous studies (Quevedo-Junyent et al., 2011; Quevedo et al., 2012).

Palomar rings with different sizes, positions of the gap, and the two contrasts tested in this study. Above: high contrast; below: low contrast.
Procedure
All participants sat 2 m in front of a 22-inch monitor (MSI Pro MP221, 1366 × 758, 60 Hz), subtending 13.88° of visual angle and a wireless keyboard that was manipulated with their dominant hand. DinVA 3.0 requires the pixels of the monitor for precise visual acuity and speed measurement. For every sequence, participants were instructed to use numeric keys to indicate the perceived orientation of the spot of the rotating Palomar ring stimulus that appeared in random order and progressively increased in size as it moved across the screen until the lower limit for discrimination was determined. A forced choice task with eight different alternatives (orientation of the target stimuli) was implemented by using the modified (only ascending, with the size of the stimulus increasing until the lower limit for orientation discrimination was determined) psychophysics limits method and the experimental procedure described below.
Each series began with the stimulus moving at random horizontally (180°) or diagonally (45° and 135°) across the monitor in both directions (from side to side) at a given speed (52°/s). Two contrast levels were measured: black and clear gray, equivalent to 0.997 (high contrast) and 0.13 (low contrast) respectively using Michelson contrast formula (Peli, 1997). A lux meter (Mavolux, Germany) was used to determine the luminance of the background and the optotype. The stimulus was initially set to its smallest angular presentation (2 pixels of target gap size, or 10 pixels in total diameter, equivalent to a visual acuity of 0.964) and, progressively increased in size 1 pixel every 2.3 s. Gap orientation remained constant during each trial.
Once the stimulus reached the edge of the screen, it reversed its trajectory. As mentioned, players pressed the corresponding key as soon as the target was large enough for them to determine the orientation of the gap in the optotype. Thus, even if participants could predict where the stimulus would appear, gap orientation cannot be detected if the DVA is lower than threshold. Each series ended when the number of correct responses reached 10, with a maximum of 13 trials in total, beyond which the score for that particular series would be zero. Observers were informed that the software permits 3 errors at maximum. Consequently, they were instructed not to anticipate to avoid penalization. All participants completed the series within this limit. The combination of target size, moving speed, and viewing distance was subsequently processed to calculate the DVA score, expressed in visual acuity units (decimal). The global DVA was the mean of the result of each trial of the same serial (for a given trajectory and contrast).
After a training for familiarization task of 5 series in which the different conditions of the stimulus appeared at random, each observer completed each trials for the 10 repetitions to obtain 60 measures (1 speed × 2 contrasts × 3 trajectories) in approximately 15 min. Reaction times were not measured because every presentation and DVA discrimination was 2.3 s, which is more than enough for elite team players, who are considered to have excellent reaction times (Tønnessen et al., 2013). No participant was excluded because of failure to complete the training exercise. Observers were not informed of their performance at any time during the study. Assessment of players occurred between competition intervals, periods of time to rest, recover, and prepare for the season, with the aim of ensuring that the three groups underwent similar intensity, duration, and frequency of sporting training. All the measurements were collected manually during the examination, and entered into the statistical package after.
Statistical Analysis
All the DVA measurements were compared using a 1-way ANOVA with Tukey's HSD multiple comparison test. Sphericity was checked using Levene's test. Data distribution was analyzed using the Shapiro–Wilk test. Non parametric Kruskal–Wallis test was performed to calculate the differences in the SVA between groups. Comparisons between DVA measurements were made using paired t-student test, or Wilcoxon test (Z-statistic), based on their parametric or non-parametric distribution. Correlations were performed using Pearson correlation (parametric) or Spearman rho (non-parametric). SPSS (IBM Corp. Released 2020. IBM SPSS Statistics for Windows, Version 27.0. Armonk, NY: IBM Corp) was used for the statistical analysis, and Prism GraphPad version 8.0.1 for Windows (GraphPad Software, Boston, Massachusetts USA, www.graphpad.com) for data visualization.
Results
Influence of Trajectory and Contrast
No statistical differences were found in the horizontal trajectory and higher contrast, F(2,54) = 1.15, p = 0.322, η2 = 0.04, diagonal 45° and higher contrast, F(2,54)= 0.46, p = 0.631, η2 = 0.01, and diagonal 135° and higher contrast, F(2,54)= 0.79, p = 0.458, η2 = 0.03. No differences in SVA were found either between groups, p = 0.272. In the lower contrast conditions, no statistical difference between groups was found either in horizontal trajectory, F(2,54)= 0.96, p = 0.387, η2 = 0.03, diagonal 45°, F(2,54)= 0.19, p = 0.981, η2 = 0.00, and diagonal 135°, F(2,54) = 1.85, p = 0.167, η2 = 0.06. The descriptive results are summarized in Table 1. In Figure 2, the box plots for each DVA condition and group are shown, in addition to the SVA. Tukey's HSD multiple comparisons for DVA trajectories and contrast between groups were not significantly different in any condition of DVA (p > 0.05).
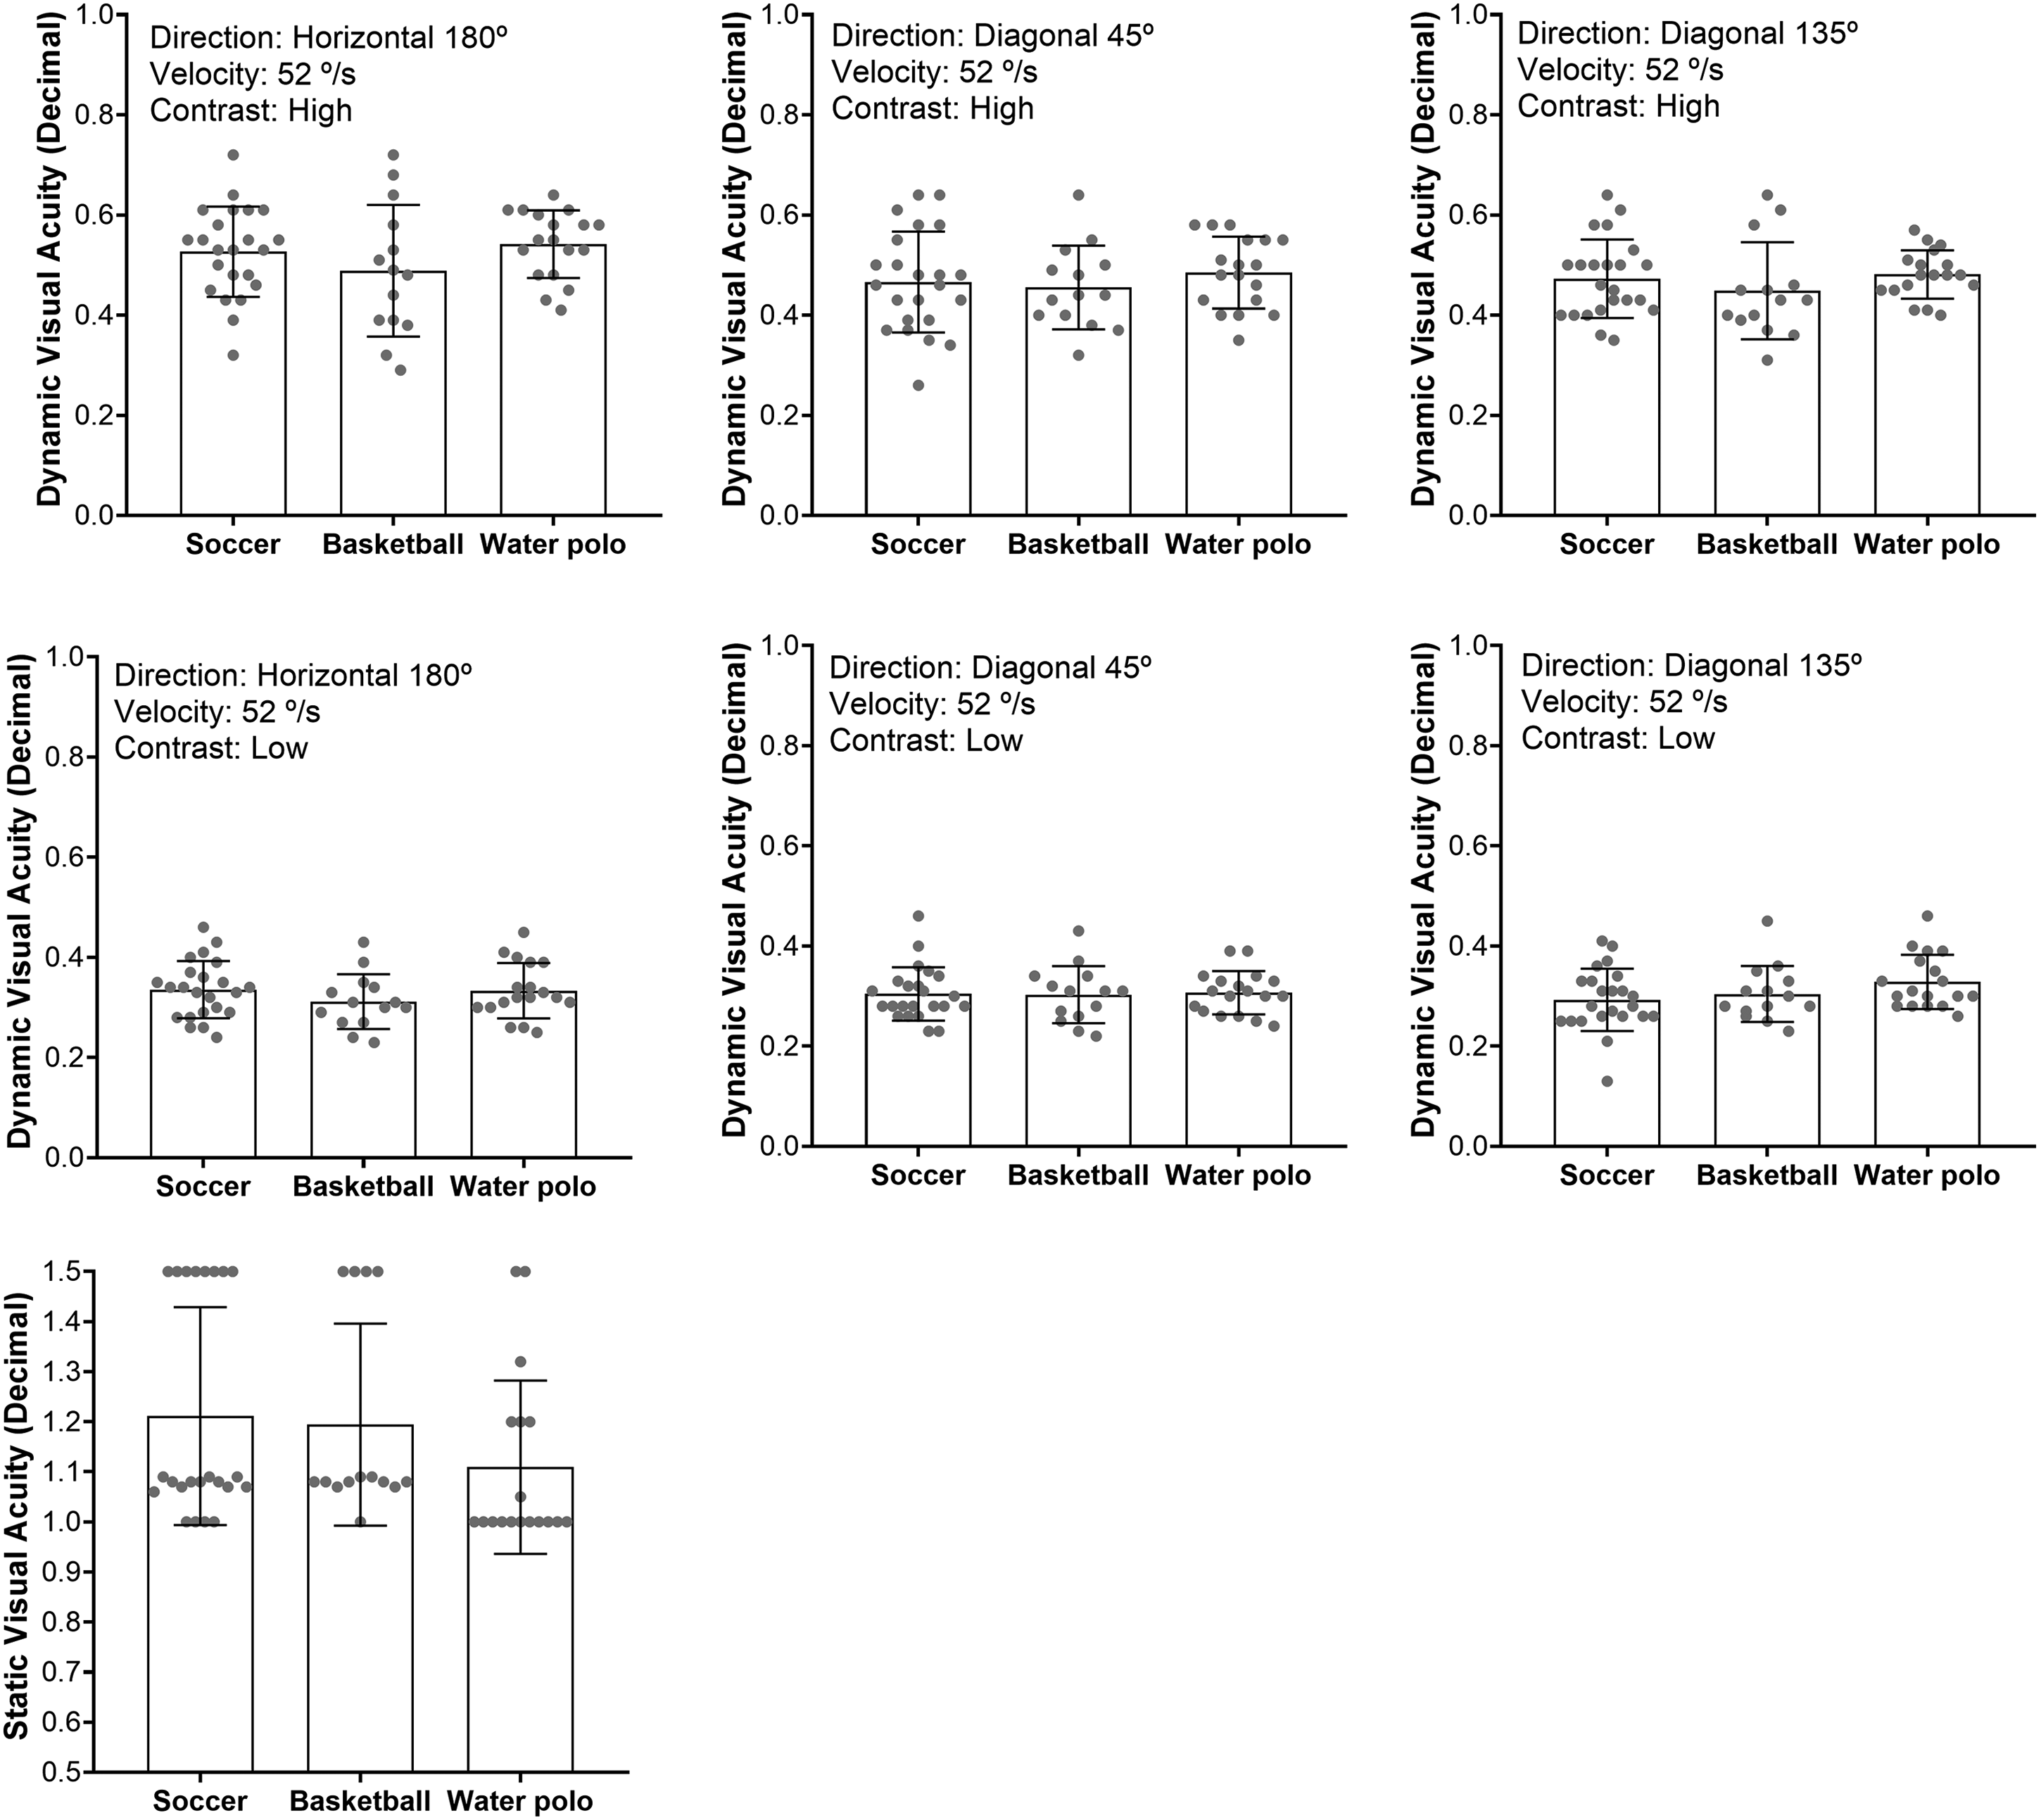
Results of the dynamic visual acuity and static visual acuity between groups. For visualization purposes, the y-axis in the SVA is not in the same scale as DVA. Error bars represent the standard deviation.
Descriptive results for static visual acuity (SVA) and dynamic visual acuity (DVA) between groups.
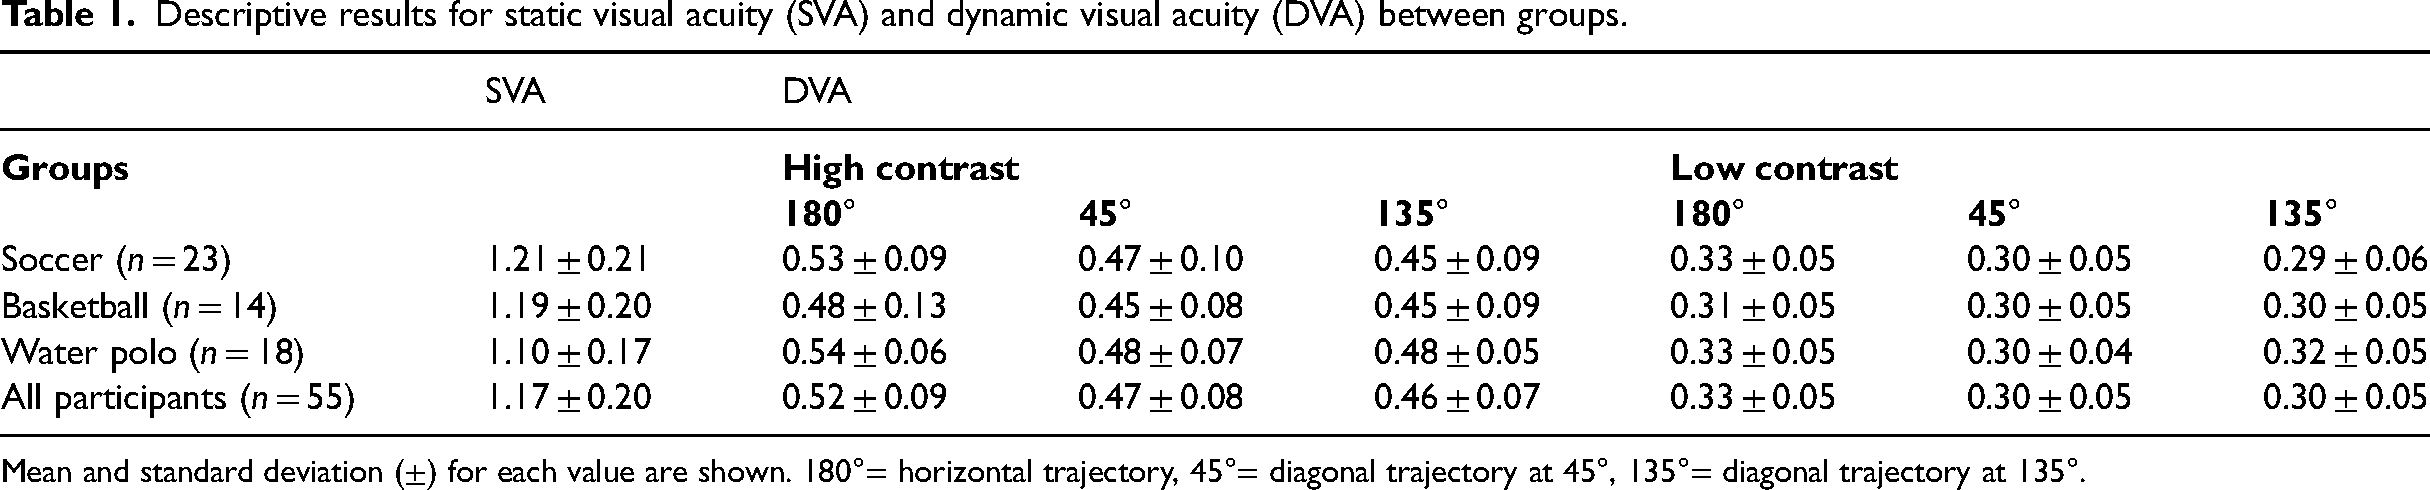
Mean and standard deviation (±) for each value are shown. 180°= horizontal trajectory, 45°= diagonal trajectory at 45°, 135°= diagonal trajectory at 135°.
For all participants (N = 55), DVA for maximum contrast was significantly different between horizontal and diagonal 45°, t(54) = 6.83, p < 0.001, Cohens’ d = 0.05, and horizontal with diagonal 135°, t(54) = 5.90, p < 0.001, Cohens’ d = 0.05, but not between two diagonals, t(54) = 0.06, p = 0.952, Cohens’ d = 0.00. For the low contrast conditions, horizontal trajectory was also significantly different with diagonal 45°, t(54) = 5.04, p < 0.001, Cohens’ d = 0.03, and 135°, Z = −3.05, p = 0.02, but not between diagonals, Z = −0.90, p = 0.366.
A statistically significant correlation was found between all the DVA measurements for the participants. Shapiro–Wilk test indicated that most of the data were parametric (p > 0.05), except for DVA at 45° in low contrast (low), p = 0.027). Every DVA condition (trajectory and contrast) had a significant correlation, as shown in Table 2. All correlations were positive.
Matrix correlation between all trajectories and contrast.
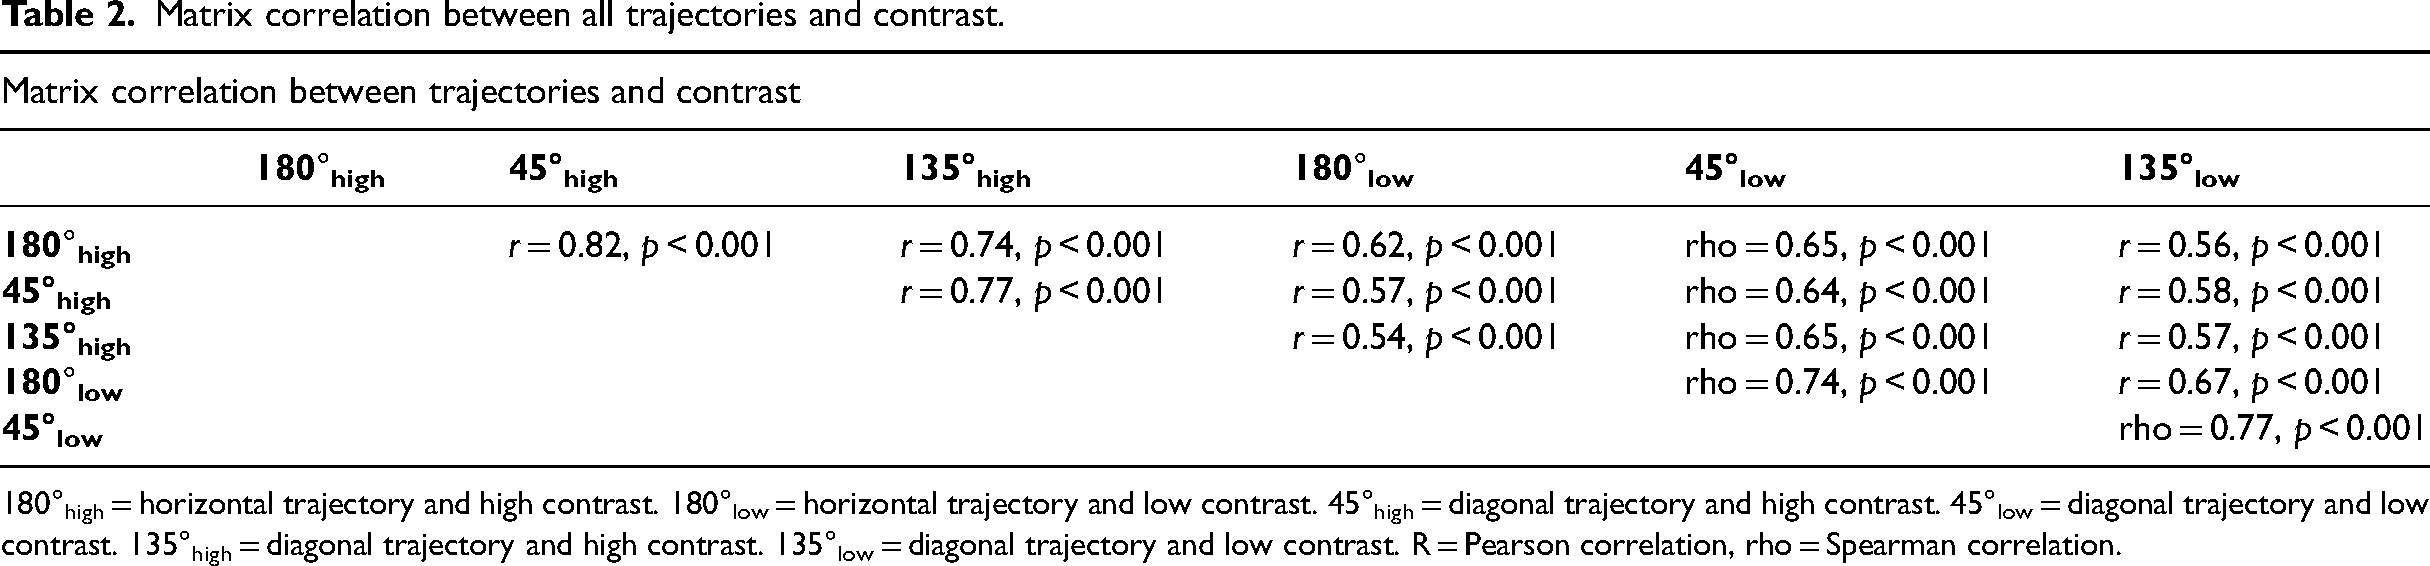
180°high = horizontal trajectory and high contrast. 180°low = horizontal trajectory and low contrast. 45°high = diagonal trajectory and high contrast. 45°low = diagonal trajectory and low contrast. 135°high = diagonal trajectory and high contrast. 135°low = diagonal trajectory and low contrast. R = Pearson correlation, rho = Spearman correlation.
Relationship Between SVA and DVA
Spearman correlations between SVA and DVA showed a different relationship between high and low contrast conditions. Data for SVA were non-parametric, Shapiro-Wilk test, p < 0.001. Specifically, all DVA measurements (N = 55) at low contrast were significantly correlated with horizontal, rho(55) = 0.51, p < 0.001, 45°, rho(55) = 0.38, p = 0.004, and 135°, rho(55) = 0.27, p = 0.047. However, all conditions at high contrast were not correlated with SVA, in horizontal, rho(55) = 0.24, p = 0.074, 45°, rho(55) = 0.20, p = 0.136, and 135°, rho(55) = 0.24, p = 0.073 (Table 3).
Correlations between static visual acuity (SVA) and dynamic visual acuity (DVA) between all participants (N = 55) and groups of elite team sports (soccer, basketball, and waterpolo).
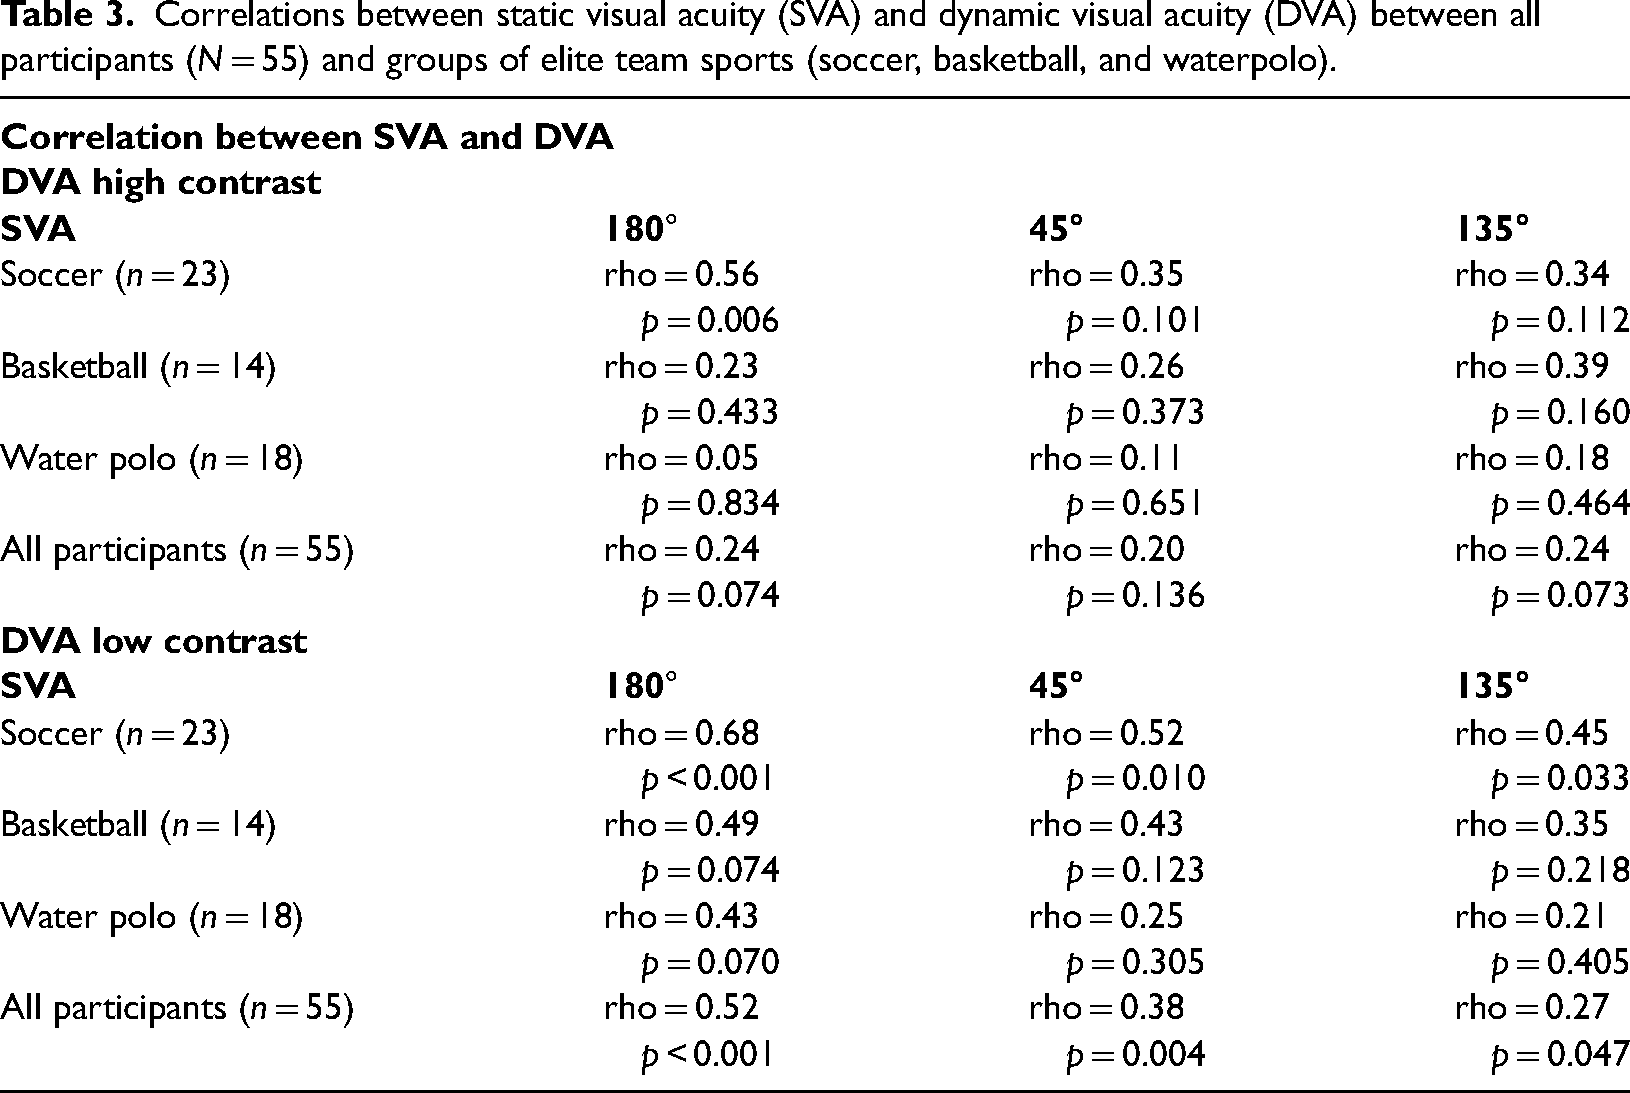
An exploratory analysis between groups showed that soccer players had a correlation between SVA in all conditions of DVA, except diagonal conditions at high contrast, 45°, p = 0.101, and 135°, p = 0.112. Basketball and water polo players did not have any correlation between SVA and DVA in all conditions (p > 0.05) (Table 3).
In addition, global DVA loss was calculated, adapted from Marquez et al. (2017). We computed the difference between SVA and DVA as an expression of SVA less than the DVA, in decimal. The result from horizontal with 99.7% contrast for all participants was 0.65 ± 0.18. Between groups, soccer players had a DVA loss of 0.68 ± 0.18, basketball players 0.70 ± 0.20, and water polo 0.58 ± 0.12. No significant statistical differences were found between groups, F(2,54) = 2.30, p = 0.110.
Discussion
The main goal of the present study was to investigate the influence of contrast and trajectory of displacement of the target on the DVA of elite athletes, including water polo, soccer, and basketball male players. We also proposed two secondary objectives that we will discuss in the following subsections.
Influence of Contrast and Trajectory
The obtained data evidenced that the three groups of the study have similar characteristics with reference to all the DVA evaluated conditions. These data are feasible if we consider that they are team sporting modalities with similar characteristics and needs in terms of visual control of the ball, teammates, and opponents in continuous movement that require analogous multisensory integration. Previous research has found differences when comparing athletes’ DVA in a dynamic context (e.g., team sports) with other modalities with less “visual” requirements such as swimming, showing a marked superiority in favor of the first (Tidow et al., 1985), and it seems also clear that athletes have superior DVA compared to sedentary (Hoshina et al., 2013; Ishigaki & Miyao, 1993; Jorge & Fernandes, 2019; Morris & Kreighbaum, 1977; Quevedo-Junyent et al., 2011; Uchida et al., 2012; Yee et al., 2021).
When focusing, specifically, on the influence of the studied parameters on DVA scores, and taking the sample as a whole, it can be observed, in agreement with previous research (Aznar-Casanova et al., 2005; Quevedo-Junyent et al., 2011), that the best scores correspond to horizontal over diagonal trajectories at high contrast. Moreover, lack of statistical significance between 45° or 135° for high and low contrast conditions, evidence that it is indifferent to measure both conditions. Its clinical significance is time-saving while screening DVA, because evaluating horizontal and only one diagonal displacements would be sufficient. In fact, most of the studies assessing DVA in general have explored the horizontal trajectory (Hoshina et al., 2013; Morris & Kreighbaum, 1977; Palidis et al., 2017; Uchida et al., 2012; Yazgan & Cidİ, 2023), although some researchers have used predictable and random order in soccer (Jorge & Fernandes, 2019), and athletes involved in tracking sports (Yee et al., 2021), and different predictable trajectories in water polo (Muiños & Ballesteros, 2015; Quevedo-Junyent et al., 2011). Hence, based on the results of the present study, elite players from team sports such as soccer, basketball, and water polo have similar DVA performance in predictable horizontal and diagonal trajectories for both contrast conditions. However, when we analyze the complete sample, there are differences in the DVA performance between horizontal and diagonal, while there are not between diagonals, for both contrast conditions. There is a common playing condition for the three studied groups of sporting modalities, where the main ocular task is dynamic, and the players need to determine as efficiently as possible the trajectory and movement of the ball with similar size and displacement trajectories. Thus, it is plausible to suggest that these implicit sporting dynamic visual factors would be more relevant for DVA, than differences in lighting conditions or the specific playing field of each sport. In addition, data show statistically significant moderate to high correlations between all measurement conditions. As expected, the highest correlations were found between the same contrasts, being slightly superior in maximum contrast. Hence, these results indicate that DVA performance is correlated with different trajectories and contrast of stimulus that appears in the visual field, possibly involving eye movements tracking abilities, which are superior in sport players, in agreement with previous studies (Di Russo et al., 2003; Uchida et al., 2012).
Static and Dynamic Visual Acuity
Correlations between the global scores of SVA and DVA appear to be influenced by contrast. We did not find any significant correlation in the high contrast conditions. However, for the low contrast, scores in all DVA trajectory measurements significantly correlated with SVA. Attempting to interpret results for separate modalities, soccer players exhibited a high correlation between SVA and DVA in most of the conditions evaluated, except for diagonals at higher contrast, in opposition to basketball and water polo players, which did not show any correlation during any of the test conditions. Contrast levels are affected by illumination changes produced by environmental variability (Erickson, 2020), which can influence the ability to discriminate the ball in movement. Soccer players, opposite to basketball and water polo players, train and compete in outdoor fields, and they are more impacted by uncontrolled ambient circumstances, for example, weather conditions such as rain, fog, or shiny days, which could explain why SVA and DVA in low contrast are more related between soccer players, as they need more visual processing in changing and challenging environmental conditions. The authors believe that the influence of contrast on DVA and its links to SVA is a very interesting topic to develop in future research.
Dynamic Visual Acuity Loss
Additionally, it is interesting to note that elite sports have slightly different DVA loss, from soccer, basketball, and water polo, although not statistically different between groups. To the best of our knowledge, DVA loss has mainly been considered in patients with vestibular problems (Marquez et al., 2017). In any case, comparison of results cannot be made, because our measure of DVA relied on the movement of the stimulus, instead of the head, in addition to the different velocities and units used. Interestingly, the study of Yee et al. (2021) compared the differences in SVA and DVA between athletes, gamers and control and found an average of 0.1 logMAR reduction in DVA compared to SVA across all groups.
Sanderson (1981) introduced the term of “individual visual susceptibility to speed,” suggesting that while some people could be described as “resistant” to speed changes, others should be classified as “sensitive” because they would show a rapid deterioration of DVA by increasing the speed of movement of the stimulus. Thus, the authors believe that this could be an interesting research topic and recommend future studies focused on the comparison of different samples, such as athletes of various levels of performance and diverse modalities, to determine whether individuals that perform under highly dynamic visual demands have lower or high DVA loss.
Limitations and Future Research
Although there are few participants in each group, the lack of statistically significant differences among them, permits a joint analysis of the DVAs of 55 elite team players. Other studies evaluating DVA in top athletes used a sample of 147 football players (Jorge & Fernandes, 2019), 15 athletes (Yee et al., 2021), and 15 in water polo (Quevedo-Junyent et al., 2011). Moreover, these athletes had achieved the highest sporting trophies in their respective modalities, winning the Champions League in soccer, the Spanish league in basketball, or ranked second in the European Championship in water polo. Thus, our sample of participants and the data offered in this study are unique in this field. These facts lead the authors to believe that very conclusive assertions can be made from the obtained results. On the other hand, though all participants were instructed not to anticipate their response in order not to be penalized, we have to always take into account that some people are more risky and some more conservative, and this could evidence a limitation of the measurement method.
In addition, in this case, all were male participants, which is an actual limitation, and does not allow us to generalize conclusions to all team athletes. While Ishigaki & Miyao (1994) evidenced superior DVA for males, Quevedo-Junyent et al. (2011) did not find gender differences in DVA, for either sedentary or water polo players. Nevertheless, future studies on women's top athletes are strongly recommended, especially in recent times, when female basketball, water polo, or soccer players are exhibiting a magnificent level of performance.
Conclusions
According to previous literature, DVA best scores for a sample of elite team players correspond to horizontal over diagonal trajectories and high over low contrast. Professional soccer, basketball, and water polo players have similar characteristics with reference to all the DVA evaluated conditions. DVA scores for diagonal trajectories (45° and 135°) are comparable. Therefore, it seems not necessary to evaluate both for clinical means. Correlations between the global scores of SVA and DVA appear to be influenced by contrast. Only for low contrast, all DVA trajectories measurements were significantly correlated. Specifically, soccer players exhibited a high correlation between SVA and DVA in most of the conditions evaluated in opposition to basketball and water polo players, which did not show any correlation. DVA loss could be an interesting parameter to investigate when comparing different samples, such as athletes and non-athletes.
Footnotes
Author contribution(s)
Declaration of Conflicting Interests
The authors declared no potential conflicts of interest with respect to the research, authorship, and/or publication of this article.
Funding
The authors received no financial support for the research, authorship, and/or publication of this article.
