
Abstract
Previous research comparing musically trained and untrained individuals has yielded valuable insights into music cognition and behaviour. Here, we explore two aspects of musical engagement previously studied separately, auditory-visual correspondences and sensorimotor skills, in a novel real-time drawing paradigm. To that end, musically trained and untrained participants were presented with 18 short sequences of pure tones varying in pitch, loudness and tempo, as well as two short musical excerpts. Using an electronic graphics tablet, participants were asked to represent the sound stimuli visually by drawing along with them while they were played. Results revealed that the majority of participants represented pitch with height (higher on the tablet referring to higher pitches), and loudness with the thickness of the line (thicker line for louder sounds). However, musically untrained participants showed a greater diversity of representation strategies and tended to neglect pitch information if unchanged over time. Investigating the performance accuracy in a subgroup of participants revealed that, while pitch-height correspondences were generally represented more accurately than loudness–thickness correspondences, musically trained participants’ representations of pitch and loudness were more accurate. Results are discussed in terms of cross-modal correspondences, the perception of time, and sensorimotor skills.
Keywords
Here, we investigate musically trained and untrained participants’ representational strategies, and their performance accuracy, using visualizations of basic sound characteristics (pitch, loudness) and of music, in a real-time drawing paradigm. Literature on cross-modal correspondences of pitch and loudness, on visualizations of music, and on sensorimotor skills in musically trained participants will be reviewed first of all, before bringing these strands of research together to introduce the novelty of this approach.
Cross-modal correspondences of pitch and loudness
Psychophysical research applying experimental matching tasks, speeded discrimination, and speeded detection has shown that dimensions of auditory stimuli such as pitch and loudness often correspond to dimensions of other modalities (for reviews see Eitan, in press; Marks, 2004; Spence, 2011). Studies investigating audio-visual and audio-spatial correspondences revealed that humans tend to match higher-pitched sounds with greater brightness (Marks, 1974, 1982; Wicker, 1968), with higher elevation in space (Mudd, 1963; Pratt, 1930; Roffler & Butler, 1968a; Wagner, Winner, Cicchetti, & Gardner, 1981; P. Walker et al., 2010; R. Walker, 1987), with smaller objects (Marks, Hammeal, Bornstein, & Smith, 1987; Mondloch & Maurer, 2004), and with spikier shapes (P. Walker, et al., 2010). Similarly, louder sounds are matched with greater brightness 1 (Bond & Stevens, 1969; Marks, 1974; Stevens & Marks, 1965), with higher contrast (Wicker, 1968), and with larger objects (L. B. Smith & Sera, 1992; R. Walker, 1987).
The extent to which these correspondences are innate or learned is currently debated. Findings indicating that 3–4-month-old infants associate higher-pitched sounds with higher spatial positions and with spikier shapes (P. Walker, et al., 2010), and that 20–30-day-old infants show some kind of loudness–brightness matching (Lewkowicz & Turkewitz, 1980), suggest that cross-modal matching is innate. However, given the speed of learning of arbitrary cross-modal correspondences (Ernst, 2007), it remains unclear to what extent cross-modal correspondences are primarily the result of statistical learning (Spence, 2011, p. 986). Another experiential factor, the mediation of language, which plays a role for post-perceptual, semantic mappings of pitch (Eitan & Timmers, 2010; Nygaard, Herold, & Namy, 2009) and which may account for pitch–height mappings in congenitally-blind children 2 (Welch, 1991), fails to explain, however, evidence from an experiment in which chimpanzees showed mappings between high brightness and high pitch (Ludwig, Adachi, & Matsuzawa, 2011). Although Ludwig and colleagues argue that it is unlikely that chimpanzees acquire this association through statistical learning (but see Spence & Deroy, 2012), the development of humans’ cross-modal correspondences is at least shaped by repeated exposure, cultural factors, and training.
There is good reason to expect effects of musical training on cross-modal correspondences: for instance, Western musical notation is implicated in well established audio-visual mappings; the wider musicological discourse draws heavily on the notion of cross-modal metaphor (Zbikowski, 2002); and perhaps most significantly, musical performance itself engages (the interaction of) auditory, visual, motor, and tactile senses. A common way to account for the influence of musical training on cross-modal correspondences is to compare groups of musically trained and untrained participants. Testing over 800 participants differing in age, cultural, environmental and musical backgrounds, R. Walker (1987) showed that, among these four factors, musical training has the largest impact on participants’ consistency in matching pitch with vertical space (higher-pitched sine tones referring to higher elevation in space) and loudness with size (louder sine tones referring to larger shapes). Eitan and Granot (2006) similarly concluded that the difference between musically trained and untrained participants in an experimental task whereby participants had to imagine and specify the spatio-temporal motion of a humanoid character in response to changing musical parameters (e.g., pitch contour, pitch interval, loudness) is more a matter of consistency and security than of qualitative differences in cross-modal mappings. Musically trained individuals showed significantly stronger associations than musically untrained individuals between pitch + vertical space (higher pitch referring to higher in space) and pitch + lateral space (higher pitch referring to rightwards motion), whereas no significant differences were found regarding the mapping of loudness. Two further findings of Eitan and Granot’s study are pertinent here too. First, the mapping of musical parameters onto spatial or temporal dimensions often occurred asymmetrically. For instance, a falling pitch contour was significantly more strongly associated with downward motion than was a rising pitch contour with upward motion. Secondly, pitch and loudness led to a multidimensionality of cross-modal mappings: changes in loudness were associated with changes in vertical space and direction; in speed; and in the energy level of the imagined character. Changes in pitch were associated with changes in all three spatial axes; in speed; and in the energy level. Similarly, investigating the relationship between musical training and multidimensional cross-modal mappings, Lidji, Kolinsky, Lochy and Morais (2007) found an automatic association of pitch with vertical space irrespective of musical background, and of pitch with horizontal space in musically trained participants only (see also Rusconi, Kwan, Giordano, Umilta, & Butterworth, 2006; Stewart, Walsh, & Frith, 2004). This corroborates Eitan and Timmers’ (2010) finding that musically trained participants (compared to musically untrained) gave a higher-pitched section of a piano sonata compared to a very similar lower-pitched section of the same sonata a significantly higher rating of the verbal metaphor “right” (direction). 3
To sum up, pitch and loudness are mapped onto a great variety of visuo-spatial dimensions, with musical training influencing mostly the degree, as opposed to the direction or type of mapping. In the light of participants’ eclectic visuo-spatial responses to simple auditory stimuli such as sine tones or MIDI-based instrumental sounds, a question arises: How do musically trained and untrained participants visualize more complex auditory stimuli – in other words, music?
Visual metaphors of music
While some audio-visual correspondences operate on automatic, pre-conscious levels, asking participants to depict or match pieces of music visually engages them in a conscious, reflective task. Studies examining adult musically trained and untrained participants’ visual responses to pieces of music are sparse, which is why some of them will be discussed here in more detail. 4 Investigating the impact of the type of music, motivation, and listening environment on the amount of graphical variation in drawing responses, Hooper and Powell (1970) showed that participants’ sketches were more elaborate for (the now somewhat out-dated term) “absolute music” in comparison with “program music,” when participants rhythmically engaged in the listening, and when the music was presented live as opposed to on record. Tan & Kelly (2004), investigating visualizations of complete musical works, asked their participants to “make any marks” while listening and to explain their drawings verbally. Results revealed that musically trained individuals focused on intra-musical properties (melodic themes, repetition, pitch contour, timbre etc.), making use of abstract representations. Musically untrained individuals, on the other hand, focused on extra-musical properties such as the arousal of (their own) emotions and sensations, resulting in pictorial representations and short narratives including the listener as an agent or narrator. Similarly, Gromko (1995) compared musically untrained participants’ visual representations and verbal descriptions of excerpts of classical music and found that fewer than 50% depicted or described musical elements such as melodic line, rhythm or texture. Those who did represent musical characteristics chose predominantly the rhythm, whereas only 5% depicted several musical elements (see also Dunn, 1997). Applying a matching task, Cowles (1935) asked musically trained and untrained participants to pair musical pieces with paintings depicting landscapes and provide written explanations of their choices. Regardless of musical training, participants matched musical pieces containing a high degree of dynamic changes with paintings rich in dynamic content and “motor activity.” On the other hand, musical pieces without much dynamic variety were paired with paintings depicting little dynamic content. Whereas the choices for high-dynamic music–painting pairings were reflected in the introspective evidence (that is, verbal reports were based on intra-musical properties such as rhythm and tempo), the choices for low-dynamic music–painting pairings were often based on extra-musical properties such as mood.
The lack of a more substantial body of empirical evidence notwithstanding, it seems to emerge that musically trained participants focus more on dynamics and shapes of intra-musical properties in their visualizations, whereas musically untrained participants draw more on music-induced associative ideas and emotions. Unquestionably, musical training involves the development of analytic listening but it remains unclear whether, and if so to what extent, musically untrained individuals are simply uninterested in, or genuinely unable to pay attention to the numerous musical parameters interwoven in musical pieces. 5 Another skill acquired through musical training, which undoubtedly lies beyond mere focused attention because it requires years of deliberate practice, is fine-tuned sensorimotor control.
Transferable sensorimotor skills in musically trained and untrained participants
Behavioural and neurocognitive research concerned with musically trained individuals’ sensorimotor abilities (for a review see Zatorre, Chen, & Penhune, 2007) mainly focuses on effects of instrument specificity or other musically relevant tasks such as synchronization. For instance, studies where the participants’ task involved “tapping to the beat” revealed that musically trained participants outperform musically untrained participants by showing smaller asynchronies, lower tapping variability and better phase correction after tempo shifts (Repp, 2010; Repp & Doggett, 2007) and that musically trained and untrained participants recruit differing neural networks for synchronization tasks (Chen, Penhune, & Zatorre, 2008). However, the extent to which sensorimotor skills are transferable to non-musical tasks lacks thorough investigation. Both musically trained adults and children have been found to perform better than age-matched, musically untrained groups in simple as well as more complex reaction-time tasks involving visuo-spatial-motor integration (Brochard, Dufour, & Després, 2004; Costa-Giomi, 2005). Children who received 2 years of musical training showed no enhanced co-ordination of eye–hand movements in a non-musical task compared to children who did not receive any musical training. Thus, the development of sensorimotor skills supposedly requires substantial amounts of practice and might even be dependent on sensitive periods in motor learning (Watanabe, Savion-Lemieux, & Penhune, 2007). Evidence that musically trained individuals acquire enhanced, transferable, fine-tuned visuo-motor skills has been provided by Spilka, Steele, and Penhune (2010), who compared musically trained and untrained participants regarding their ability to imitate novel, unfamiliar gestures taken from the American Sign Language. Their results, indicating that musically trained participants’ gestures were more accurate on a global (arm, hand and finger movements combined) as well as on a local level (finger only), can be accounted for by theories of experience-based imitation mechanisms such as the associative sequence-learning theory (Brass & Heyes, 2005) or the personal action repertoire hypothesis (Ashford, Davids, & Bennett, 2007; see also Spilka, et al., 2010). It is therefore likely that musical training equips individuals with many more transferable, fine-tuned sensorimotor skills than previously thought. The present study set out to test this assumption applying a real-time visualization paradigm. To that end, audio-visual correspondences, which are intended to reveal the influence of musical training on mappings of sound and music, serve, at the same time, as a measurement of performance in a fine-tuned sensorimotor task.
Novelty and objectives of the present study
Basic characteristics of sound such as pitch and loudness are mapped, sometimes asymmetrically, onto several visuo-spatial dimensions with varying degrees of consistency depending on the amount of musical training. Whereas most studies in this domain included paradigms such as speeded classification/identification, (unspeeded) matching, and stimulus-response compatibility, to the best of our knowledge no one has systematically investigated how pure tones varying in pitch and loudness, nor musical excerpts, are mapped visually in a real-time drawing paradigm. Here, we use an electronic graphics tablet (Wacom™, 2011) to collect digital data about position on the tablet and pressure applied to the pen, which can then be used, together with the audio data, for various analytic approaches. 6 The advantage of such a paradigm is the possibility of gaining insight into both qualitative and quantitative aspects of sound visualizations, with the latter intended to shed light on the performance accuracy of real-time cross-modal mappings. Hence, the objectives of the present study are two-fold:
Comparisons between musically trained and untrained participants’ visual representations of sound and music in a free, real-time drawing paradigm by means of an electronic graphics tablet aim to reveal any commonalities or differences that may occur as a result of musical training.
The exact measurement of “drawing performances” by means of an electronic graphics tablet is intended to reveal the extent to which musically trained and untrained participants’ visualizations correspond systematically to sound parameters such as pitch and loudness.
Methods
Participants
Seventy-three participants (42 female) took part in the study (M = 28.51 years, SD = 7.71 years, range: 18–54 years). Participants were recruited using college-wide emails sent to undergraduates, postgraduates and staff (both academic and non-academic). From over 300 respondents, who were asked to provide information about their musical training, the most musically trained and untrained were selected, balancing age, gender and instrumental category. Thirty musically untrained participants (17 female, M = 28.77 years, SD = 7.14 years) were included, 7 none of whom exceeded Grade 1 of the ABRSM examination system (http://www.abrsm.org/); twenty-two had never played an instrument and those who did had stopped playing at least 7 years ago and had not spent time actively making music for more than 6 years (M = 3.38 years, SD = 1.60 years). Forty-one musically trained participants (24 female, M = 28.63 years, SD = 8.23 years) comprised twelve keyboard players, eight string players, eight wind/brass players, eight composers and five singers. While 10 musically trained participants were above grade 8, 15 at grade 8, and only one at grade 6, not all musically trained participants took formal examinations, since there is no such grading system for composers.
Materials
Sound
Sound stimuli consisted of 18 sequences of pure tones (4.5–14.3 s) systematically varied in pitch, loudness and tempo, as well as two short musical excerpts (see Table 1). Pitch range from B2 (123.47 Hz) to D4 (293.67 Hz) was chosen according to the melodic line of the first bar of Chopin’s Prelude Op. 28 No. 6, which provided the musical excerpts. The simplest sound stimuli (Nos 1–3) consisted of single pure tones (D4) lasting for 5 seconds, either decreasing and increasing in loudness; without change in loudness; or increasing and decreasing in loudness. The same loudness patterns were applied to all pure tone sequences. Sound stimuli Nos 4–6 showed a falling–rising pitch contour in semitone steps whereas Nos 7–18 displayed a rising–falling contour. Nos 7–9 and Nos 13–18 used semitone steps, and Nos 10–12 used the notes B2, D3, F#3, B3, D4 in line with the Chopin Prelude. Nos 13–15 showed two decelerations, Nos 16–18 two accelerations, which always ended/started (respectively) at the peak pitch. Two recordings of the first two bars of Chopin’s Op. 28 No. 6, one by Martha Argerich from 1975 (No. 19, length: 7.3 s) and one by Alfred Cortot from 1926 (No. 20, length: 8.1 s), were included (see Appendix I).
Overview of all experimental sound stimuli.

Graphics tablet
A commercial electronic graphics tablet (WacomTM Intuos4TM L) was used to capture the directional responses in two spatial dimensions and the pressure applied with the pen. Its high sampling rate (maximum 200 points per second; Wacom™, 2011) and high resolution (5,080 lines per inch and 2,048 levels of pressure; Wacom™, 2011) ensured that the software did not miss a drawn point by virtue of the tablet sampling too slowly, and that subtle positional changes were captured. The software was developed in Processing (Fry & Reas, 2011) by Nicolas Gold. For a more detailed account of the capture software the reader is referred to Küssner, Gold, Tidhar, Prior and Leech-Wilkinson (2011).
Procedure
After signing the consent form, participants were instructed and familiarized with the tablet and pen. At all times, they were able to see their drawings on a screen in front of them. Applying more pressure to the pen resulted in a thicker line. Sound stimuli were presented with a commercially-available set of headphones (Sony MDR-7506 Professional Dynamic Stereo Headphones).
During practice trials prior to the experiment, participants were presented with five stimuli very similar to those used in the proper experiment to become familiar with the procedure. Each sound stimulus was played twice. During the first presentation participants were asked to listen carefully without drawing, and during the second presentation they were asked to represent the sound visually by drawing along as it was played.
8
More specifically, they were told to draw everything in one go, that is, without going back to parts which you have already drawn. You can think of it as a musical performance, whereby it is impossible to go back in time and play the last bar or note again. Also, please try to take into account all sound characteristics you are able to identify and ideally, represent them in your drawing.
Participants were asked not to use any formal symbols, numbers or letters.
The presentation order was pseudo-randomized by grouping the stimuli into four categories. Stimuli of the first group only varied in loudness, stimuli of the second group varied in pitch and loudness, stimuli of the third group varied in pitch, loudness and tempo, and the fourth group comprised both musical excerpts. To increase the complexity and interaction of musical variables stepwise, the order of the four categories was always the same, while the presentation order within each category was randomized. The same procedure was applied during practice trials.
A questionnaire was used to collect demographic data and information about music-listening habits, musical education, language skills, familiarity with graphic scores, and any visual or hearing impairments. Participants were asked whether they used any strategies in representing pitch, loudness and time, and if so, what they were and how consistently they thought they had applied them (on a 5-point scale), how difficult they found the task (on a 5-point scale), whether they liked or disliked anything in particular, and whether they had any additional comments. Upon completion, participants received a small financial compensation for their time. This procedure had been approved by the appropriate ethics committee (REP-H/09/10-15).
Analysis
Selection of participants for correlation analysis (performance accuracy)
A selection of participants was necessary to ensure that the performance accuracy (correlations between drawing features and sound characteristics) corresponded to participants’ representational strategies. If, for instance, a participant reporting using the size of circles to represent loudness were entered into a correlation analysis in which perceived loudness is correlated with the thickness of the line, this, unsurprisingly, would result in a low correlation coefficient. Thus, based on participants’ most common representation strategies (see Results), only those reporting using the vertical axis to represent pitch and the thickness to represent loudness were included. Musically trained participants had to be at least at grade 8 ABRSM for their first or second musical activity, and engage in their main musical activity for at least 4 hours per week. This resulted in subsamples of 22 musically trained and 13 musically untrained participants.
Correlation analysis
Feature extraction of frequency and loudness was carried out in Praat (Boersma & Weenink, 2011). An automatic pitch extraction algorithm was run on both musical excerpts, and adjusted manually to ensure only the melody was included. Pitch was represented on a log-transformed frequency scale in Hertz, and perceived loudness values were measured in sone. All values were standardized (M = 0, SD = 1) per stimulus. Similarly, y values (representing height on the tablet) and pressure values (representing thickness of the line/pressure applied to the pen) were standardized per drawing. Analysis was carried out in MATLAB (R2010a, The MathWorks) and SPSS (Version 19.0.0, IBM SPSS Statistics). Spearman’s rank correlation coefficients ρ were calculated due to the nature of the data set being serially correlated and non-stationary (see Vines et al., 2006, for a full description).
Results
Comparisons between musically trained and untrained participants’ visual representations of sound and music
Verbal reports: strategies for representing pitch, loudness and time
Differences in frequency between musically trained and untrained participants’ representational strategies were assessed with χ2 tests, or Fisher’s exact test where appropriate.
Asking participants after the experiment whether they had used any strategies to represent pitch revealed that the majority of both groups used height on the tablet (higher on the tablet referring to higher pitches). Of the musically trained participants, 97.6% reported using this strategy, and only one musician, a female pianist and singer, reported a different strategy insofar as she had used pressure to represent pitch (the lower the pitch the more pressure applied).
A comparably high percentage of musically untrained participants (80%) chose to represent pitch with height, 3.3% used a mixed strategy of height and pressure (the lower the pitch the heavier the weight on the pen), 6.7% used a completely different approach (e.g. representing feelings), and 10% reported that they did not use any strategy. There was a significant association between musical training (“trained” vs. “untrained”) and the representational strategy used (“height” vs. “mixed/different/none”), χ2(1) = 6.011, p < .037 (Fisher’s exact test). The odds of choosing height to represent pitch were 10 times higher if a participant belonged to the “musically trained” category than if a participant belonged to the “musically untrained” category. Three examples of alternative (mixed or different) strategies for pitch representation are shown in Figure 1.
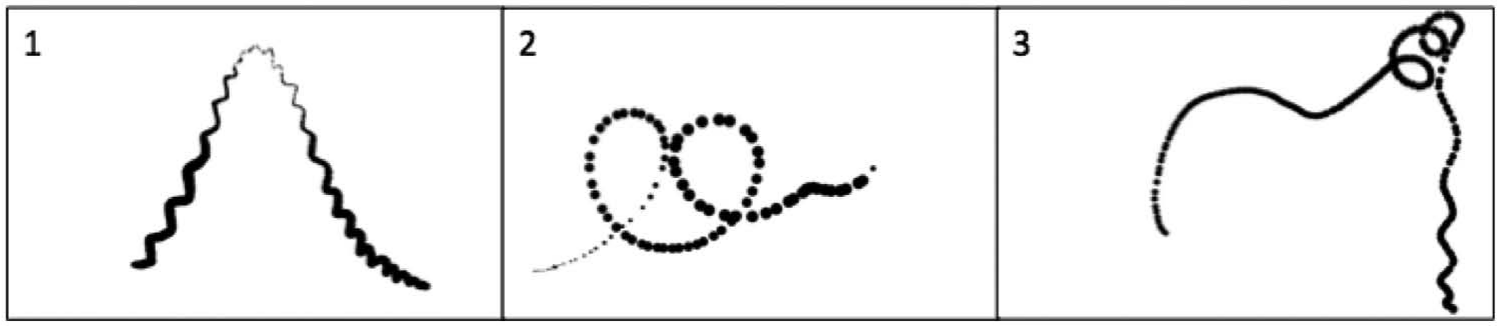
Examples of alternative pitch representations.
Regarding musically trained participants’ strategies for representing loudness, similar frequency distributions were observed. 87.8% of the musically-trained participants reported that they used the thickness of the line (equivalent to the pressure applied) to depict loudness (the louder the sound the more pressure applied) while 4.9% applied mixed strategies consisting of thickness and drawing circles or “wiggles” differing in size. Two musically trained participants chose different approaches, one of them using more pressure for softer sounds and the other using height (higher for louder sounds; when conflicting with pitch, representation of loudness would win). One musician, a female violinist, did not report any strategy.
Displaying more mixed results, 56.7% of the musically untrained participants reported that they used thickness to represent loudness (thicker line for louder sounds), and 16.7% used mixed strategies by applying thickness paired with circles (bigger = louder) and height on the tablet. 23.3% chose to represent loudness with a completely different strategy (height of waves; size of shapes; thickness of line achieved by fast movements up and down; high frequency oscillation), and 3.3% reported using no strategy. There was a significant association between musical training and the representational strategy used (“pressure/thickness” vs. “mixed/different/none”), χ2(1) = 8.876, p < .003. The odds of choosing pressure/thickness to represent loudness were 5.51 times higher if a participant belonged to the “musically trained” category than if a participant belonged to the “musically untrained” category. Six examples of alternative (mixed or different) strategies for loudness representation are shown in Figure 2.
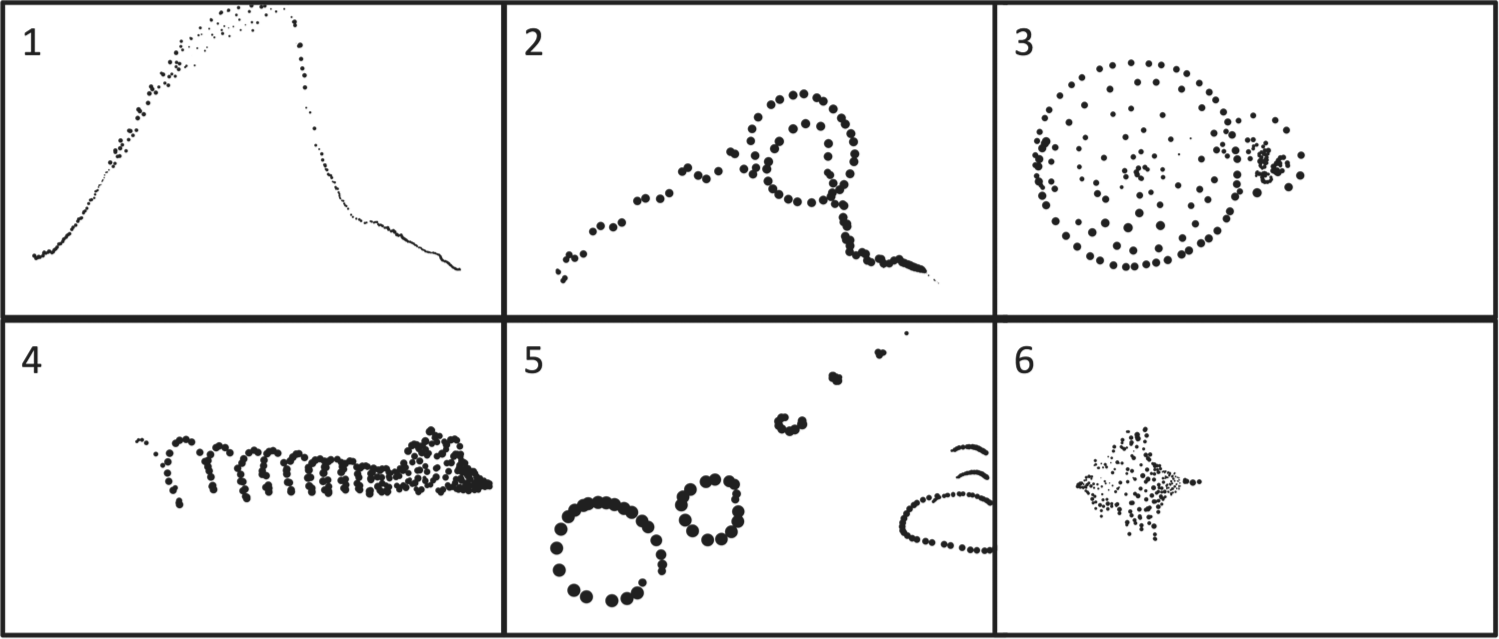
Examples of alternative loudness representations.
Regarding the representation of time, the majority of both groups used the horizontal axis on the tablet (proceeding from left to right). 82.9% of the musically trained participants reported using this strategy; 9.8% applied mixed strategies consisting of horizontal axis (left to right) combined with circles, or pressure, or going into the opposite direction when reaching the end of the tablet; and only one musician, the same female pianist and singer who already reported a different strategy for pitch, reported having “started off and ended with a slight curve.” Two musically trained participants reported no strategy, although their drawings revealed that they, as well as the female musician reporting a different strategy, were in fact going from left to right.
Similarly, 83.3% of the musically untrained participants chose to represent time horizontally (left to right); 6.7% used mixed strategies consisting of horizontal axis (left to right) combined with “swirls,” or changing the direction (right to left), or the vertical axis (going down); 1 participant reported representing his feelings (see Figure 1); and 6.7% (2 musically untrained participants) reported not using any strategy. Visual inspection of the drawings revealed that one of these musically untrained participants went in fact from left to right. There was no significant association between musical training and the representational strategy used (“horizontal axis” vs. “mixed/different/none”), χ2(1) = .002, p > .90.
Exploratory analysis of temporal representation
Visual inspection revealed remarkable differences between musically trained and untrained participants’ representations of peak and trough pitches, which lasted longer than all other (ascending and descending) pitches in the stimuli. Some musically trained participants represented them with a longer line, creating a plateau-like shape. Some musically untrained participants seemed to “pause” their drawing performances at the top (bottom) of the rising (falling) pitch contour, resulting in a somewhat pointed shape of their visual representations. To test the hypothesis that musically untrained participants tend to neglect temporal aspects of pitch, three independent raters, A, B and C, were asked to evaluate on a 5-point scale (1 = very poorly, 5 = very well) how well sustained pitches of sound stimuli Nos 4–12 were accounted for in the drawings, resulting in one global rating per participant. Moreover, they were asked to evaluate on a 5-point scale (1 = very poorly, 5 = very well) how well changes in tempo of sound stimuli Nos 13–18 were accounted for in the drawings, resulting in one global rating per participant. All three raters were blind to the participant group, and two-tailed Pearson correlations were calculated for each rater pair (AB, AC and BC) to assess inter-rater reliability. Whereas “sustained pitch” ratings (sp) achieved high agreement scores, (rsp(AB) = .820, rsp(AC) = .851, rsp(BC) = .797; all p < .001), the agreement scores for “tempo changes” (tc) were more moderate (rtc(AB) = .515, rtc(AC) = .480, rtc(BC) = .348; all p < .01). Ratings were then averaged across all three raters and these averaged “sustained pitch” and “tempo change” values were used to compare musically trained and untrained participants’ ratings with independent t tests (degrees of freedom adjusted where necessary).
Musically trained participants’ visual representations of “sustained pitch” were rated significantly higher (M = 3.03, SEM = .16) than those of musically untrained (M = 1.69, SEM = .12), t(68.282) = 6.800, p < .001, r = .64 (see Figure 3). Similarly, musically trained participants’ visual representations of “tempo change” achieved significantly higher ratings (M = 2.81, SEM = .14) than those of musically untrained (M = 2.22, SEM = .10), t(66.750) = 3.469, p < .01, r = .39.
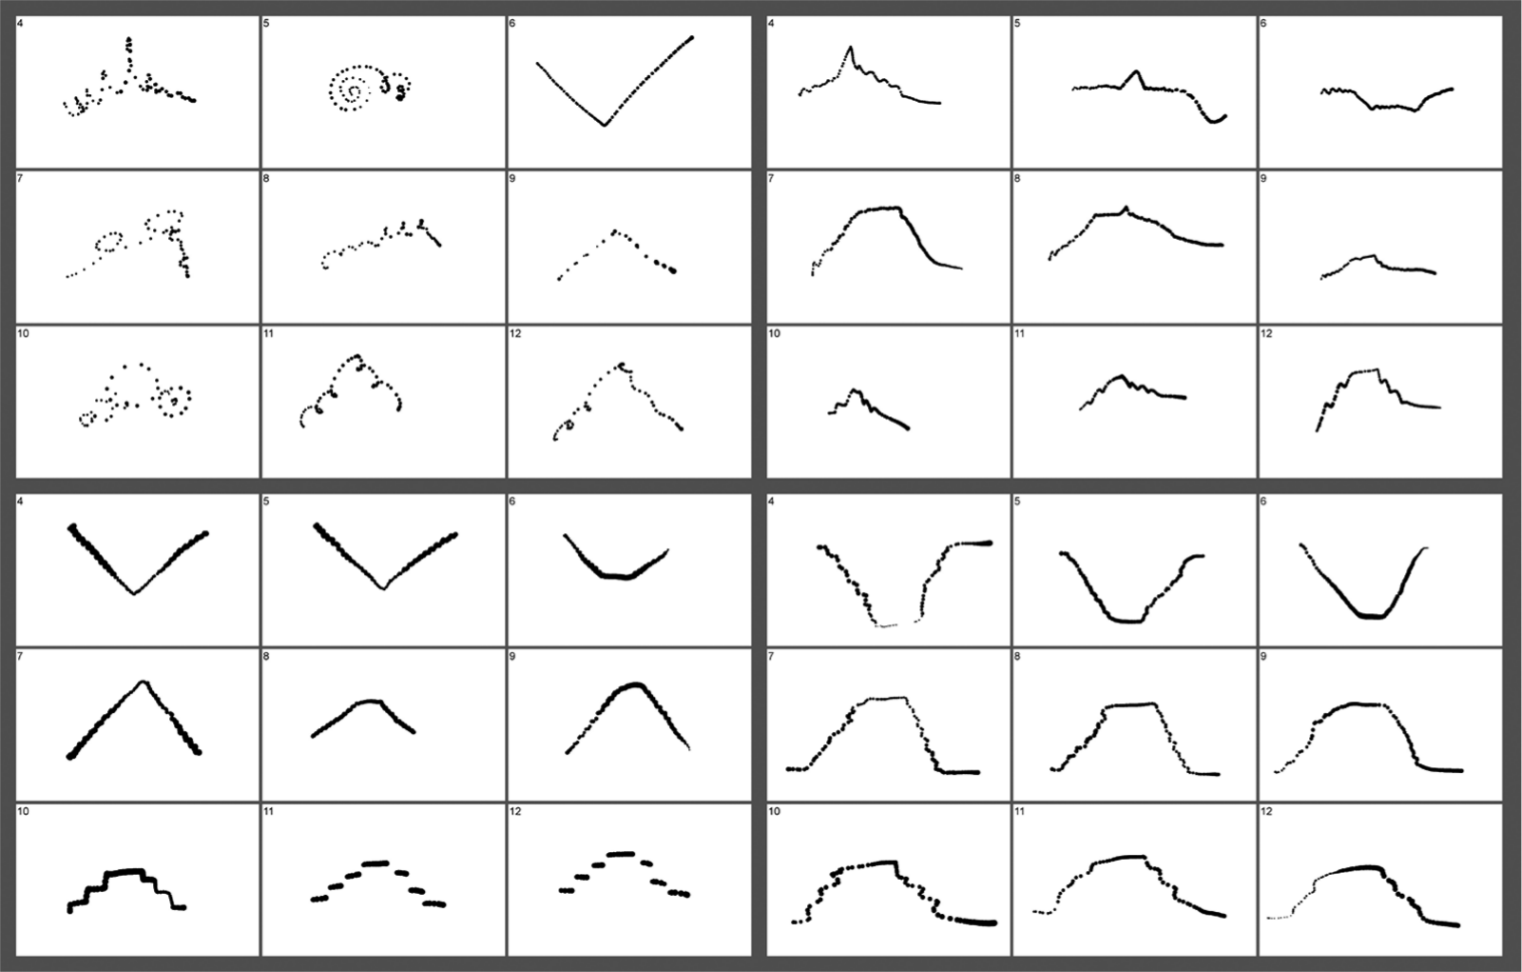
Visual representations of sound stimuli Nos 4–12 by four participants who achieved low, medium, and high ratings of “sustained pitch” representations.
Use of the tablet space in absolute vs. relative terms was investigated by comparing whether sound stimuli Nos 16–18 took up more space horizontally (measured by calculating the x range in pixels xmax – xmin) than sound stimuli Nos 7–9. A mixed-design ANOVA was carried out with the between-subject factor “musical training” and the two within-subject factors “length” (short / long) and “stimuli type” (amplitude decreasing / amplitude equal / amplitude increasing). All participants except for one musically untrained individual who did not use the x-axis for time were included in the analysis.
Results revealed a significant main effect for “musical training” (F(1, 68) = 12. 622, p < .01, partial η2 = .157) and “length” (F(1, 68) = 63.265, p < .001, partial η2 = .482), while “stimuli type” did not reach significance level, F(2, 136) = .452, p > .60. Regardless of the stimulus length, musically trained participants (M = 818.33, SEM = 27.83) used more space along the x-axis on average than musically untrained participants (M = 664.71, SEM = 33.09), and longer stimuli (M = 814.13, SEM = 21.88) generally led participants to use more space along the x-axis than when presented with shorter stimuli (M = 668.92, SEM = 24.95). There was a significant interaction between “musical training” and “length” (F(1, 68) = 17.191, p < .001, partial η2 = .202), revealing that musically untrained participants compared to musically trained participants used significantly less space along the x-axis for short sound stimuli (t(68) = 4.595, p < .001, r = .49), while there was no significant difference between groups for long sound stimuli (t(68) = 1.781, p > .05). No further significant interaction effects were observed.
Exploratory analysis of representational shift between pure tones and music
Visual inspection of drawings in response to the musical excerpts revealed that some participants completely changed their visualization strategy compared to the pure tones. To test the hypothesis that musically untrained individuals (but not musically trained individuals) tend to change their strategy when presented with a musical excerpt, raters A, B, and C were asked to compare participants’ visualizations in response to musical excerpts with all other visualizations of the same participant and indicate whether a shift in the representational strategy had occurred. Inter-rater reliability was fair or slight between the rater pairs: κ(AB) = .208, p < .10, κ(AC) = .337, p < .01, and κ(BC) = .132, p > .50.
Fisher’s exact test (“musical training:” trained/untrained; “shift:” yes/no), including the raters’ mode values, revealed no significance (p > .40). Thus, although more musically untrained (13.3%) than musically trained participants (7.3%) have been rated to change their representational strategy, this difference did not reach significance level.
Comparisons between musically trained and untrained participants’ performance accuracy assessed by non-parametric correlation coefficients
Consistency and difficulty
There were no significant differences between musically trained and untrained participants selected for the correlation analysis regarding the self-assessed consistency in applying their strategies (t(33) = .452, p > .60), nor regarding the perceived difficulty of the tasks (t(33) = .079, p > .60). Both groups reported that they acted fairly consistently in applying their respective strategies (Mmt = 3.841, SEMmt = .145; Mmut = 3.731, SEMmut = .201), and that they found the tasks relatively easy (Mmt = 2.443, SEMmt = .165; Mmut = 2.423, SEMmut = .175).
Local correlations of pitch-height
A local correlation denotes a correlation between the drawing characteristics (height or thickness) of a single drawing by a single participant and the perceived sound properties (pitch or loudness), e.g., the correlation between the y values (height) and frequency values (pitch) of participant k’s visual representation of sound stimulus x. To test statistically whether musically trained participants achieved larger local correlation coefficients compared to musically untrained participants, four mixed-design ANOVAs with the dependent variable ρlocal_pitch-height and the between-subjects factor “musical training” were run. The first ANOVA, investigating sound stimuli Nos 4–9, included the within-subjects factors “pitch” (down-up / up-down) and “loudness” (decreasing–increasing / increasing–decreasing / equal); the second ANOVA, investigating sound stimuli Nos 10–12, included the within-subjects factor “loudness” (decreasing–increasing / increasing–decreasing / equal); the third ANOVA, investigating sound stimuli Nos 13–18, included the within-subjects factors “timing” (decelerando–decelerando / accelerando–accelerando) and “loudness” (decreasing–increasing / increasing–decreasing / equal); and the fourth ANOVA, investigating music stimuli Nos 19 and 20, included the within-subjects factor “performer” (Argerich / Cortot). The same four ANOVAs were run including the dependent variable ρlocal_loud-thick, as well as another ANOVA, investigating sound stimuli Nos 1 and 3 with the within-subjects factor “loudness” (decreasing–increasing / increasing–decreasing / equal).
The musical training × pitch × loudness ANOVA (stimuli Nos 4–9) revealed a significant main effect of musical training, F(1, 33) = 5.348, p < .05, partial η2 = .139. Since Levene’s test of equality of error variances was significant for 50% of the variables (correlation coefficients of sound stimuli Nos 4, 8, and 9), an independent t test was run using adjusted degrees of freedom. Musically trained participants (M = .741, SEM = .042) achieved higher correlation coefficients than musically untrained participants (M = .546, SEM = .084). This difference was not significant, t(18.169) = 2.078, p < .10; however, it revealed a medium-sized effect r = .440.
The musical training × loudness ANOVA (stimuli Nos 10–12) revealed significant main effects of musical training (F(1, 33) = 5.863, p < .05, partial η2 = .151) and loudness (F(1.705, 56.264) = 3.580, p < .05, partial η2 = .098). Musically trained participants (M = .657, SEM = .063) achieved higher correlation coefficients than musically untrained participants(M = .408, SEM = .082), and decreasing–increasing loudness contour (M = .623, SEM = .054) led to higher correlation coefficients than increasing–decreasing loudness contour (M = .447, SEM = .057), F(1, 33) = 7.309, p < .05, partial η2 = .181.
The musical training × performer ANOVA (stimuli Nos 19 and 20) revealed significant main effects of musical training (F(1, 33) = 24.174, p < .001, partial η2 = .423) and performer (F(1, 33) = 10.677, p < .01, partial η2 = .244). Musically trained participants (M = .674, SEM = .067) achieved higher correlation coefficients than musically untrained participants (M = .130, SEM = .088), and the recording by Cortot (M = .523, SEM = .066) led to higher correlation coefficients than the recording by Argerich (M = .282, SEM = .067). The musical training × timing × loudness ANOVA (stimuli Nos 13–18) revealed no significant effects.
Local correlations of loudness-thickness
The musical training × loudness ANOVA (stimuli Nos 1 and 3) revealed significant main effects of musical training (F(1, 32) = 10.678, p < .01, partial η2 = .250), and loudness (F(1, 32) = 6.382, p < .05, partial η2 = .166). Musically trained participants (M = .652, SEM = .060) achieved higher correlation coefficients than musically untrained participants (M = .323, SEM = .081), and increasing–decreasing loudness contour (M = .570, SEM = .061) led to higher correlation coefficients than decreasing–increasing loudness contour (M = .404, SEM = .059).
The musical training × pitch × loudness ANOVA (stimuli Nos 4–9) revealed significant main effects of musical training (F(1, 33) = 6.046, p < .05, partial η2 = .155), and loudness (F(2, 66) = 7.318, p < .05, partial η2 = .182). Musically trained participants (M = .328, SEM = .045) achieved higher correlation coefficients than musically untrained participants (M = .146, SEM = .059). Pairwise comparisons using Sidak correction revealed that increasing–decreasing loudness contour (M = .393, SEM = .053) led to higher correlation coefficients compared to decreasing–increasing loudness contour (M = .122, SEM = .061; p < .01), and equal loudness contour (M = .195, SEM = .054; p = .056), though the latter difference was not significant.
The musical training × loudness ANOVA (stimuli Nos 10–12) revealed a significant main effect of loudness, F(1.666, 54.986) = 9.080, p < .01, partial η2 = .216. Pairwise comparisons using Sidak correction revealed that increasing–decreasing loudness contour (M = .346, SEM = .064) led to higher correlation coefficients compared to decreasing–increasing loudness contour (M = –.052, SEM = .070; p < .01), and equal loudness contour (M = .082, SEM = .073; p < .01).
The musical training × timing × loudness ANOVA (sound stimuli Nos 13–18) revealed a significant main effects of loudness, F(2, 66) = 13.073, p < .001, partial η2 = .294. Pairwise comparisons using Sidak correction revealed that equal loudness contour (M = .166, SEM = .058) led to lower correlation coefficients compared to decreasing–increasing loudness contour (M = .419, SEM = .051; p < .05), and increasing–decreasing loudness contour (M = .537, SEM = .055; p < .001). The musical training × performer ANOVA (stimuli Nos 19 and 20) revealed no significant effects.
Global correlations of pitch-height and loudness-thickness
A global correlation denotes a correlation between the drawing characteristics (height or thickness) of all drawings of a single participant and the perceived sound properties (pitch or loudness), e.g., the correlation between the y values and frequency values of all visual representations of participant k. 9 To test statistically whether musically trained participants achieved larger global correlation coefficients compared to musically untrained participants, two independent sample t tests were run comparing respectively musically trained and untrained participants’ pitch-height and loudness–thickness global correlation coefficients.
Musically trained participants’ mean ρmt_global_ph = .816 (SEM = .027) was significantly larger compared to musically untrained participants’ mean ρmut_global_ph = .683 (SEM = .041) for the pitch–height correlations (t(33) = 2.796, p < .01). Regarding loudness–thickness correlations, musically trained participants’ mean ρmt_global_lt = .401 (SEM = .035) was significantly larger compared to musically untrained participants’ mean ρmut_global_lt = .265 (SEM = .045), t(33) = 2.364, p < .05; however, the overall level was lower compared to global height–pitch correlations (see Figure 4), t(34) = 16.064, p < .001, mean ρglobal_ph = .766 (SEM = .025), mean ρglobal_lt = 0.350 (SEM = .030).
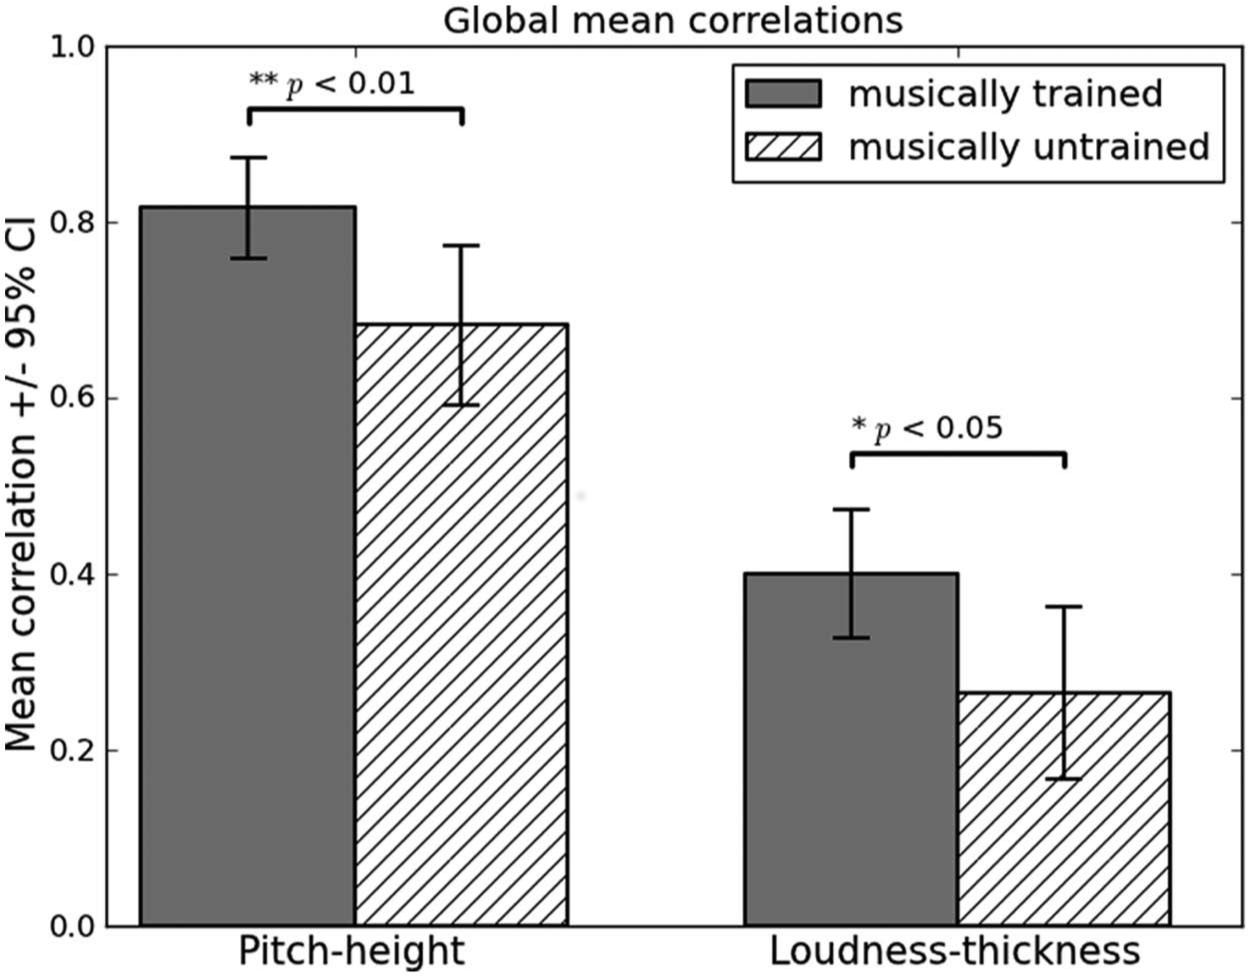
Mean global pitch-height and loudness-thickness correlations.
Pitch-height representations of sound stimuli without pitch change
For sound stimuli Nos 1–3, the pitch-height correlations could not be calculated due to the sine qua non that variables in a correlation calculation must not be constant. Instead, the mean absolute deviation from the median of y was calculated for each individual drawing of sound stimuli Nos 1, 2 and 3. The lower the value of the mean absolute deviation, the closer a visual representation was to a perfectly horizontal line. Three independent sample t tests were performed comparing musically trained participants’ averaged mean absolute deviation values with those of musically untrained.
For sound stimulus No. 1, it was found that musically trained participants (Mmt_mad_ph = .226, SEM = .048) achieved significantly lower scores than musically untrained participants (Mmut_mad_ph = .448, SEM = .071): t(33) = −2.674, p < 0.05. Although the same pattern was observed for sound stimulus No 2 – musically trained participants’ scores (Mmt_mad_ph = .187, SEM = .045) were lower than musically untrained participants’ scores (Mmut_mad_ph = .328, SEM = .075) – the t test failed to reach statistical significance, t(33) = −1.725, p < .10. Sound stimulus No. 3 led again to the same pattern; musically trained participants’ scores (Mmt_mad_ph = .255, SEM = .048) were lower than musically untrained participants’ scores (Mmut_mad_ph = .566, SEM = .068), resulting in a significant difference, t(33) = −3.802, p < 0.01.
Loudness–thickness representations of a sound stimulus without loudness change
For sound stimulus No 2, the loudness–thickness correlation could not be calculated. 10 Thus, the mean absolute deviation from the median of p (pressure applied to pen) was calculated for each individual drawing of sound stimulus No 2. The lower the values of this measurement, the lower the variation in the thickness of the line. An independent sample t test was performed comparing musically trained participants’ averaged mean absolute deviation values with those of musically untrained. There was no significant difference (t(33) = −.839, p > .40) between musically trained (Mmt_mad_lt = .413, SEM = .041) and musically untrained participants (Mmut_mad_lt = .475, SEM = .065).
Discussion
When asked to represent visually pure tones varying in pitch, loudness and tempo, as well as two short musical excerpts, the majority of musically trained and untrained participants reported using the height to represent pitch (higher on the tablet referring to higher pitches), and the thickness of the line to represent loudness (thicker = louder). Various different strategies were observed, and the diversity was generally larger among musically untrained participants (particularly for the loudness representations). Analysis of visualizations of duration revealed that musically trained participants showed greater sensitivity for local timings such as sustained pitches and tempo changes, whereas musically untrained participants were more sensitive to the overall durations of the sound stimuli in relation to one another. Musically trained participants outperformed musically untrained participants regarding the accuracy of their representations, which was independent of self-assessed consistency and perceived task difficulty. Local and global, non-parametric correlations between sound and drawing characteristics showed that musically trained participants are overall more accurate than musically untrained participants in representing pitch with height and loudness with thickness.
Representational strategies of pitch and loudness
Our finding that most participants mapped pitch onto a vertical axis (that is, height on the tablet) is in accordance with previous research (Mudd, 1963; Pratt, 1930; Roffler & Butler, 1968a; R. Walker, 1987) and increases the external validity of such findings with this real-time drawing paradigm. Similarly, the correspondence shown between loudness and size has been reported before (Lipscomb & Kim, 2004; L. B. Smith & Sera, 1992; R. Walker, 1987) and corroborates previous findings. Free-drawing responses to pure tones revealed a greater tendency among musically trained participants to adhere to pitch–height and loudness–thickness representations in comparison with musically untrained participants. While musically trained participants’ more consistent use of pitch–height mappings is in line with previous studies (Eitan & Granot, 2006; R. Walker, 1987), differences in mappings of loudness represent a novel finding which might partly be due to the free drawing paradigm. The greater diversity of representation strategies among musically untrained participants suggests that musical training plays an important role in choosing mapping strategies: it seems that with more musical training, the number of potential representations considered decreases.
Representation of time
The correspondence between time and horizontal axis is in line with previous research (R. Walker, 1987). To account for the fact that the majority of participants went from left to right regardless of musical training, literacy seems to be the most likely candidate and has been shown to influence graphic representations of music (Athanasopoulos, Moran, & Frith, 2011).
However, the finding that musically untrained participants tend to neglect temporal aspects of pitch by “pausing” their visualization performance at peak and trough pitches, as well as visually ignoring the changing durations of pitches in sound stimuli Nos 13–18, was unexpected and deserves closer attention. Note that whether or not participants took into account the varying pitch lengths has no impact on the precision of mere pitch representation. Thus, it is possible to achieve an “exact” representation of pitch while neglecting its temporal aspects. Nevertheless, the fact that musically untrained participants tended to “pause” their drawings when pitch remained unchanged over time is remarkable not because they are unable to account for temporal aspects of pitch (in fact, they may well be able to do so given a specific instruction) but because they chose not to, or at least, because this aspect of the sound was evidently not salient enough to be worth considering. This effect, which in a different experimental paradigm could have been interpreted as a differential effect of musical training on working memory (George & Coch, 2011), is, due to the real-time nature of the experimental task, better regarded as a predominantly attentional bias.
One has to be cautious, though, about drawing premature conclusions regarding musically untrained participants’ attentional bias of time. This becomes evident in the significant interaction between musical training and horizontal expansion of the drawings. Whereas musically trained participants showed no difference between short and long sequences, musically untrained participants used significantly less space horizontally for short sequences. Thus, although musically untrained participants did not consider local pitch timings, they did, unlike musically trained participants, show a sense for the overall length, and captured, if only in a rough manner, the relative global durations of the stimuli. Further research is overdue to shed light on this, as well as other phenomena linking musical training and the perception of time (Phillips & Cross, 2011). It would, for example, be worth testing the hypothesis that while musically untrained participants attribute less informational significance to unchanging pitch in a melody line, when representing music in space they are less influenced than musically trained participants by the non-proportional nature of the representation of time in standard musical notation (cf. Tan, Wakefield, & Jeffries, 2009). For musically trained participants, then, available horizontal space can represent a whole musical extract, whatever its length, since this is their everyday experience of reading scores; for musically untrained participants, space simply maps onto time. At the same time, but for quite different reasons, a continuing note has, for musically trained participants, just as much significance as one that changes.
Representational shift from pure tones to music
Although more musically untrained than trained participants displayed a representational shift from pure tones to music, this effect was non-significant. Note, however, that this result reflects the outcome of a rating procedure whose overall agreement between raters was only fair. While the raters often disagreed whether a shift had occurred, it is plausible that participants applied such a shift, knowingly or not, more often than is apparent in the rating data. This would be in line with previous findings (Tan & Kelly, 2004) showing that musically untrained participants depict more extra-musical, associative ideas when asked to represent music visually. The possibility that a lifetime of seeing music through notation restricts musically trained participants’ options for mapping music cross-modally merits more investigation.
Performance accuracy
Overall, musically trained participants achieved higher correlation coefficients, locally and globally, for both pitch-height and loudness–thickness correlations. A closer look at local pitch-height correlations reveals that musically trained participants achieved higher correlation coefficients for all short sequences (Nos 4–12) but not the longer ones (Nos 13–18). This suggests that musically untrained participants struggled with shorter sequences, which require immediate synchronization. On the other hand, longer sequences, which, unlike the short ones, were also varied in tempo, allow for more adaptive synchronization behaviour if one has missed the start of a sequence, for instance. Apart from one exception (sound stimuli Nos 10–12), loudness did not interfere with the size of the correlation coefficients. In this exception, the rising–falling pitch contour led to higher pitch–height correlations when paired with a falling–rising loudness contour. However, the same effect was absent in stimuli Nos 7–9 with same pitch contour, rendering it otiose to ponder possible interpretations. What is more telling is that musically trained participants’ correlation coefficients are higher when presented with the musical excerpts. It might be the case that musically untrained participants’ response strategies changed when confronted with music, and that musically trained participants are much more familiar with such musical excerpts. Note also that both groups achieved higher correlation coefficients for the Cortot (compared to the Argerich) recording. One would have to test the whole Chopin Prelude before drawing conclusions, but this seems to suggest that Cortot’s timing was easier to follow with the pen, perhaps because it was slightly longer (780 ms) and therefore at a more “comfortable” speed. This finding is particularly interesting, however, because Cortot’s extremely flexible timing is much less familiar to listeners today than Argerich’s more regular playing. Leech-Wilkinson (in press, 2011) also argues that Cortot’s playing elicits unusually strong embodied associations, which might have facilitated participants’ responses.
Loudness–thickness correlation coefficients were generally smaller than those of pitch–height. Arguably, controlling the thickness of the stroke by applying more or less pressure posed a greater challenge to participants because it required fine-tuned motor control. Musically trained participants only achieved higher loudness–thickness correlation coefficients for short sound stimuli that were either unchanged in pitch (Nos 1 & 3) or progressed in semitones (Nos 4–9). When the pitch contour resembled the Chopin excerpt (Nos 10–12), or when sequences were longer (including both musical excerpts), there was no difference between groups. Although the trend was always the same (musically trained participants achieving higher values), the overall lower level combined with greater variances precluded significant differences. There was, however, a strong main effect of loudness independent of musical training. Both sequences unchanged in pitch (Nos 1 & 3), as well as all other short sequences (Nos 4–12) led to higher loudness–thickness correlation coefficients if the loudness contour was increasing–decreasing as opposed to decreasing–increasing, or equal. This makes sense since it is an easier motor task to build up pressure on the pen from zero to a maximum (and going back to zero), rather than reducing pressure from a maximum to (nearly) zero (and then building up again). Equally, in musical phrases in many genres, increases in pitch, speed and loudness followed by decreases towards the phrase-end are much more common than the reverse, so that participants’ expectations of music were being met more readily in the increasing–decreasing sequences. Interestingly, keeping pressure roughly equal during longer sequences (Nos 13–18) was harder than synchronizing with a loudness contour that was either decreasing–increasing or increasing–decreasing. This, too, makes intuitive sense since it is generally harder to keep a force constant over a longer period than to apply gradual changes in whichever direction; and constant intensity is uncharacteristic of musical phrases in everyday musical contexts.
The statistical analysis of sound stimuli Nos 1 and 3 regarding pitch, and of sound stimulus No 2 regarding loudness, revealed a pattern fitting into the overall picture: while musically trained participants achieved higher scores for pitch representations than musically untrained participants, there was no significant difference between groups regarding loudness representation.
Taken together, musically trained participants outperform musically untrained participants in terms of accuracy in a real-time drawing task of pitch and loudness, which adds to the increasing literature of findings suggesting that musically trained participants’ (sensori-)motor skills are transferable to other, non-specific domains (Spilka, et al., 2010). However, our results are limited insofar as they cannot disentangle musically trained participants’ motoric skills from training effects of audio-visual mappings or basic auditory discrimination skills (but note that we attempted to minimize potential differences in the latter by choosing very simple sound stimuli and presenting them twice). Future experiments should address these issues by varying the degree of visual feedback (e.g., include trials in which participants are blind-folded whilst drawing), or by asking participants to draw along an existing shape in synchrony with the sound. Since our results represent an implicit measure of motoric skills, it would be valuable to examine whether differences remain when musically trained and untrained participants are instructed to represent pitch and loudness in the context of a motor skill experiment.
Conclusion
We set out to investigate how musically trained and untrained participants perform in a real-time drawing task that involves tracking pitch, loudness and time of sequences of pure tones, as well as two short musical excerpts, in order to shed light on cross-modal perception, whether conscious or subconscious, and on sensorimotor skills. We were able to demonstrate that auditory–visual correspondences previously reported in the literature also apply in a real-time drawing task, and that musically trained participants’ acquired sensorimotor skills are evident in such drawing tasks, and potentially also other motor tasks unrelated to instrument-playing. What is more, we discovered that the visual representation of duration plays a crucial role in differentiating musically trained and untrained participants’ ways of listening to and representing sound and music. Further research needs to be undertaken to show which aspects of musical training are responsible for these varying effects, and what consequences they have for the ways in which musically trained and untrained participants understand music through cross-modal mappings.
Footnotes
Appendix 1
Musical recordings used in the experiment:
Martha Argerich: Chopin, Prelude in B-minor, Op. 28 No. 6 (recorded October 1975). Deutsche Grammophone. (1977)
Alfred Cortot: Chopin, Prelude in B-minor, Op. 28 No. 6. HMV matrix Cc-8157–3 (recorded 23 March 1926), originally issued on HMV DB 957. Digital transfer © King’s College London. (2007)
Acknowledgements
We are very grateful to Helen M. Prior and two anonymous reviewers for their valuable comments, to Nicolas E. Gold for developing the software, and to all participants who took part in the study.
Funding
This work was supported by King’s College London and by the AHRC Research Centre for Musical Performance as Creative Practice (grant number RC/AH/D502527/1).