



Abstract
The voice plays a crucial role in expressing emotion in popular music. However, the importance of the voice in this context has not been systematically assessed. This study investigates the emotional effect of vocal features in popular music. In particular, it focuses on nonverbal characteristics, including vocal melody and rhythm. To determine the efficacy of these features, they are used to construct a computational Music Emotion Recognition (MER) system. The system is based on the circumplex model that expresses emotion in terms of arousal and valence. Two independent studies were used to develop the system. The first study established models for predicting arousal and valence based on a range of acoustical and nonverbal vocal features. The second study was used for independent validation of these models. Results show that features describing rhythmic qualities of the vocal line produce emotion models with a high level of generalizability. In particular these models reliably predict emotional valence, a well-known issue in existing Music Emotion Recognition systems.
Music Emotion Recognition (MER) systems use audio signal processing and computational models to predict emotions expressed by music. These systems have been developed for a wide range of genres including popular (Yang, Lin, Su, & Chen, 2007), film (Eerola, Lartillot, & Toiviainen, 2009), and production music (Saari et al., 2013). Of these, popular music has perhaps received most attention due to the practical uses of emotion tags for music browsing and organization. At the core of these systems is the process of feature extraction. This is generally performed by analysing the spectral representation of the digital music signal. These spectrally-derived features are designed to capture the dynamic, timbral, and rhythmic properties of music. A good feature for emotion recognition captures the nuances of musical expression and provides good discrimination between emotion classes. In popular music, this type of feature extraction poses significant challenges. Commercial music is technologically-mediated and relies heavily on the use of studio production techniques (Warner, 2003; Dibben, 2014). This can result in features that characterize the production methods and not the music itself. A particular example of this phenomenon is the album effect. The album effect describes the homogeneity of production-based features across tracks in an album which reduces the discriminative power of these features (Kim, Williamson, & Pilli, 2006). The limitations of spectrally-derived features for music recognition is well-recognized (Aucouturier & Pachet, 2004; Celma, Herrera, & Serra, 2006), and has led some towards alternative feature design techniques (Humphrey, Bello, & LeCun, 2012).
Even with highly descriptive features, it is often difficult to isolate their emotional effect. Popular music exists in a complex social and commercial structure with links to fashion, dancing, visual imagery, lifestyle, body image, sex, and age (Eno, 1996). In addition, marketing strategies for popular music rely on repeated exposure over multiple media channels. This exposure effect is linked to enhanced attitudes towards general stimuli (Zajonc, 1968) and preference in music (Pachet, 2012). Closely tied to this is the desire for the listener to be drawn into the music, ideally within the first 7 to 20 seconds. To achieve this, the music tends to be structurally simple and musically repetitive (Warner, 2003). Not only do these requirements place limitations on musical content, but may also be responsible for narrowing the types of emotional message expressed by the music, perhaps leaning towards extremes or over-exaggeration.
Music Emotion Recognition systems demonstrate the interdisciplinary nature of current music emotion research. Once the domain of music psychology, the area is now a major focus of Music Informatics (MI). The result is a significant change in methodology, from empirical investigation to “big data” analysis. The current approach in the MI community is to collect social, tag-based emotion annotations from online databases provided by services like Last.fm and The Echo Nest. Although suitable approximations of mass, socially-determined phenomena like genre, social tags suffer from ambiguity in the representation of emotional responses. In particular they provide no indication as to whether a listener has felt an emotion (emotion induction) or merely recognized an emotion (emotion perception) in response to the music. This ambiguity makes it extremely difficult to isolate the features that are responsible for expressing emotions. Empirical differences of this type have had a negative effect in some MI studies and led to methodological and statistical analysis errors, some of which still persist (Sturm, 2013a, 2013b).
In this study we focus on a style similar to UK chart-orientated music of the last decade. Typically this music follows a strophic (verse/chorus) form and is characterized by short musical phrases with regular lengths, simple time signatures, and mostly stepwise diatonic melodies. “Catchiness” is normally achieved by a hook; a melodic, timbral, or rhythmic motif which is repeated throughout the song (Burns, 1987). Despite the technological developments of the past two decades, the underlying structure of pop music has changed very little. The largest differences occur in rhythm and timbre, especially in the vocal “top line” (Warner, 2003). The importance attributed to vocal melody in pop music offers a potentially rich source of emotional meaning. In addition, melodic structure is a composed aspect of a pop music track. As such, its characteristics are less likely to be modified during the recording process. This means melodic lines are unaffected by the acoustical homogeneity introduced by the modern production process. We seek to augment current spectrally-derived features with those derived from the vocal in order to improve music emotion recognition.
Aim
The aim of this study is to explore the role of vocal melody as a cue to express emotions in pop music. In an attempt to overcome the homogeneity introduced by production techniques and to mitigate the extra-musical aspects of popular music, we examine the effect of vocal melody in semi-prepared popular music tracks. To test the efficacy of these features we examine data from two independent studies. The first is used to identify salient musical cues and build prediction models, the second to validate our models and test generalizability of our results.
Method
Participants
Study 1 involved 196 participants (151 males and 45 females, mean age = 23.23, SD = 7.11). Study 2 comprised 30 participants (22 males, 8 females, mean age = 30.2, SD = 11.6). All were enrolled in undergraduate audio or psychology programmes. Participants in study 1 received vouchers to the value of 15GBP. In study 2 participation was on a voluntary basis.
Materials
The stimuli for both studies were specially prepared to minimize familiarity effects. To ensure participants had no prior experience with the stimuli, music was sourced from a number of community-based music sites and production music libraries (Audio Network, UK; Smashtrax Music, USA). These organizations provide audio for commercial purposes like radio, television and film. An additional benefit of using these libraries is that tracks are occasionally written in the style of established artists, primarily to allow companies to achieve the same sound as mainstream artists without the associated costs. This provides a level of ecological validity, as the stimuli exhibit similar characteristics to music that appears in the mainstream popular music charts.
A further benefit of these sources is that music is often available in multitrack format. The multitrack format provides separate instrument and vocals tracks and provides greater flexibility for manipulation. In all stimuli, the original vocal tracks were re-recorded with wordless utterances substituted in place of the sung vocal line. Removing semantic context in this way retained the timbral aspects of the voice and the melody while removing the emotional connotations of the words themselves. To maintain consistency, vocalists involved in the re-recordings listened to the original and mimicked the expressive qualities. The entire track was then mastered by a professional recording engineer.
A separate corpora of stimuli was prepared for each study. In study 1, the corpus comprised 100 stimuli. This included 50 male vocal and 50 female vocal excerpts. Relative gender balance existed across vocalists in this corpus, with three male and three female vocalists contributing to vocal re-recording. The stimuli were approximately 30 seconds in length. In study 2, the corpus comprised 20 stimuli. This included 11 female vocal and nine male vocal excerpts. Relative gender balance existed across vocalists in this corpus, with two male and two female vocalists contributing to vocal re-recording. The stimuli were approximately 30 seconds in length.
Design and procedure
Study 1
In study 1, participants were tested either individually or in small groups. Stimuli were presented in a randomized block design. Each block consisted of 25 of the 100 prepared stimuli. As a result each excerpt was assessed by 49 participants. Measures of perceived emotions were collected in a self-report format. This was administered using the circumplex model of affect. This model measures emotion as orthogonal dimensions of arousal and valence (Russell, 1980). Participants indicated expressed arousal and valence values on an 11-point Likert scale. These judgements were made while participants listened to the excerpts.
Study 2
In study 2, participants were tested either individually or in small groups. Responses were collected using the identical measurement instrument as in study 1. In study 2 however, responses were collected using a custom-made computer program. These responses were made while participants listened to the excerpts. In this study, stimuli were assessed by all participants. As a result each excerpt was assessed by 30 participants. To mitigate any bias and minimize systematic effects, stimuli were order randomized.
Feature representation
A number of acoustical and melodic structure features were extracted from both corpora. The acoustical feature space is represented by a set of descriptors similar to those proposed in (Eerola, 2011; Lartillot & Toiviainen, 2007). These include features which represent the categories of dynamics, rhythm and timbre. These features were extracted from music clips with a sampling frequency of 44.1 kHz on 32-ms non-overlapping analysis frames. Features were statistically summarized with mean, standard deviation and slope. The total number of spectrally-derived acoustic features was 26 (see Table 1).
Acoustic features.
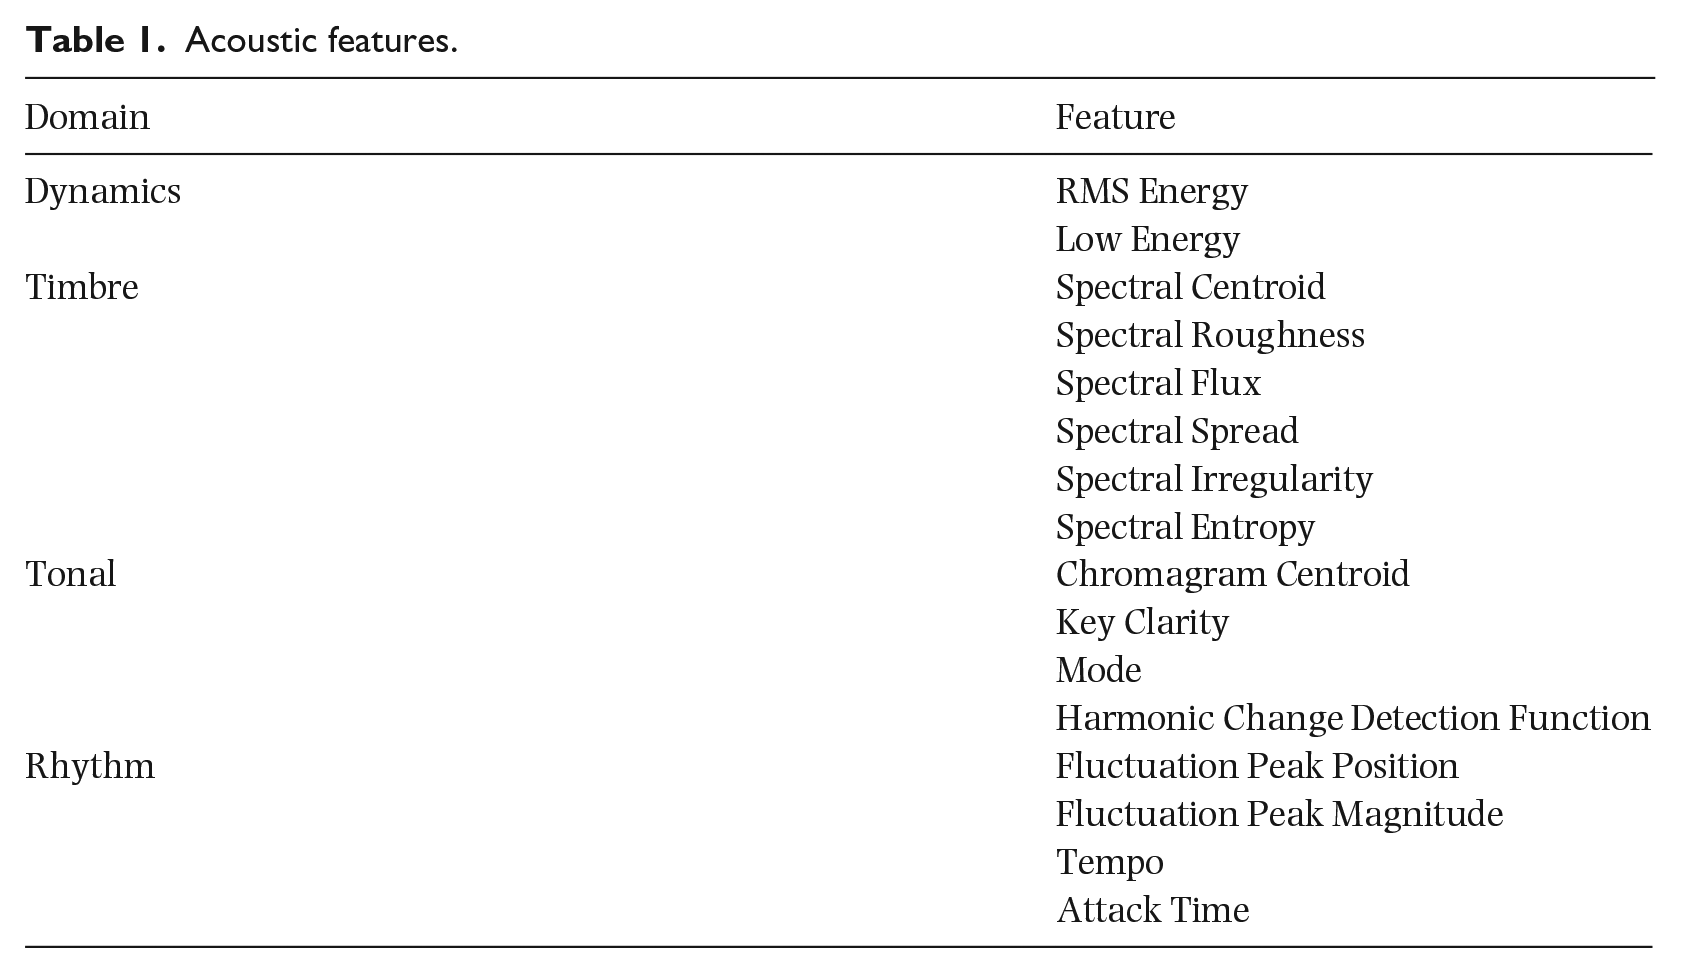
Melodic structural features were extracted from a symbolic representation of the isolated vocal melody. To create this symbolic representation, the isolated vocal track from the multitrack recording was manually processed with a commercial software package (Melodyne, Celemony Software GmbH, Germany). The result of this processing was a Music Instrument Digital Interface (MIDI) representation. The MIDI track was then analysed with two feature extraction toolboxes: the MIDI toolbox for Matlab (Eerola & Toiviainen, 2004) and jSymbloic toolboxes (McKay & Fujinaga, 2006). Two categories of structural features were extracted: those relating to melody and those relating to rhythm. There were 28 melodic structure features (see Table 2).
Vocal melodic structure features.

In some cases, separate vocal tracks were unavailable for processing. In these instances computational methods were used to extract vocal information. Unfortunately, in a number of cases this step was unsuccessful. As a result, seven excerpts (4 male, 3 female) were excluded from the corpus prepared for study 1. The remainder of the excerpts (n = 93) were included in subsequent analysis stages.
Modelling procedure
Data collected in study 1 was used for feature selection, model development and performance evaluation. Model performance was judged using internal validation. Internal validation is a measure of model performance within a target sample or dataset. Study 2 was used to externally validate the models in study 1. External validation involves applying models to a dataset which is independent of the development sample. We adopt this approach to ensure generalizability of our results. By applying models on an independent dataset we test for over-fitting, a problem that occurs when models are tailored to the development dataset. If models developed using study 1 are overfit to that data, they will not perform well when applied to data in study 2.
Feature selection and internal validation
A large number of irrelevant features can pollute a feature space and lead to degradation of model performance (Frank & Witten, 2005). To remove these features it is necessary to perform feature selection prior to modelling. To achieve this we first use a Random Forest\algorithm followed by recursive feature elimination (RFE; Liaw & Wiener, 2002; Kursa & Rudnicki, 2010). The result is a compact, uncorrelated set of features which are used for modelling arousal and valence variables.
The Random Forest algorithm is an ensemble method that creates multiple decision trees on randomly selected samples of the training set. Feature importance is calculated based on the loss of classification accuracy in trees that include each feature. This approach yields a subset of features which are deemed relevant to the target variable. Although a significant reduction in the feature space is achieved using this all relevant approach, it is still possible that features are correlated. Correlation amongst features results in unstable models and decreases generalizability (Kuhn & Johnson, 2013). To obtain a set of relevant and uncorrelated features an RFE step is applied. RFE is a wrapper approach to feature selection that uses cross-validation to judge feature importance and remove redundant features. It measures model performance using a target algorithm that is wrapped in the feature selection process. In this case, the selection algorithm is a linear regression model, and the performance metric is the coefficient of determination (R2). RFE uses a process of backwards selection. It begins by building a model with all available features and assigning an importance ranking to each feature. From this model, a baseline performance figure is calculated using 5-fold cross-validation. Next, the lowest ranked feature is pruned from the model and the performance is recalculated. This process continues until a final model with one feature remains. In cross-validation, data is divided equally into a number of partitions, or folds. This means that each fold in the internal validation study 1 corpus (n = 93) has approximately 18 excerpts. Validation in this manner tests the internal consistency within the development dataset. The overall result of these steps is a ranked set of highly relevant, uncorrelated predictors that are used to build models for external validation.
External validation
External validation is used to test how well internal validated models generalize to an independent dataset. Models which generalize well should have similar performance in internal and external validation. The corpus developed for study 2 is used for external validation. This corpus contains 20 excerpts, which is similar in size to one fold of the cross-validation step described above. For external validation a series of nested models are constructed with the reduced feature sets described previously. This begins with the single highest-ranking feature, with subsequent features added until the inclusion of all features. The first nine features identified by the feature selection process are chosen for external validation. This is to achieve an approximate 10:1 feature-to-cases ratio suggested for multiple linear regression (Tabachnick, Fidell, & Osterlind, 2007). At each iteration the model is used to make predictions on the independent dataset from study 2. As this set is completely independent, it will test the generalizability of our models. At each iteration the Akaike Information Criteria (AIC) is calculated to determine the quality of the statistical model derived from the development dataset. The AIC is a measure of model quality and is used to select the final model based on the minimum AIC value (Frank & Witten, 2005).
Results
Model performance
Nine relevant features were identified when modelling valence. No features were eliminated during the RFE procedure, so all nine were included for internal validation. The highest performing model accounted for 38% of the variance in the data (R2 = 0.38) with all nine features included. However, the AIC reached its minimum value with the first seven features (Figure 1). This optimum model accounted for 34% of the variance in the data (R2 = 0.34). When used for external validation, this model accounted for 61% of the variance in the data (R2 = 0.61). Validation performance figures are shown in Table 3.
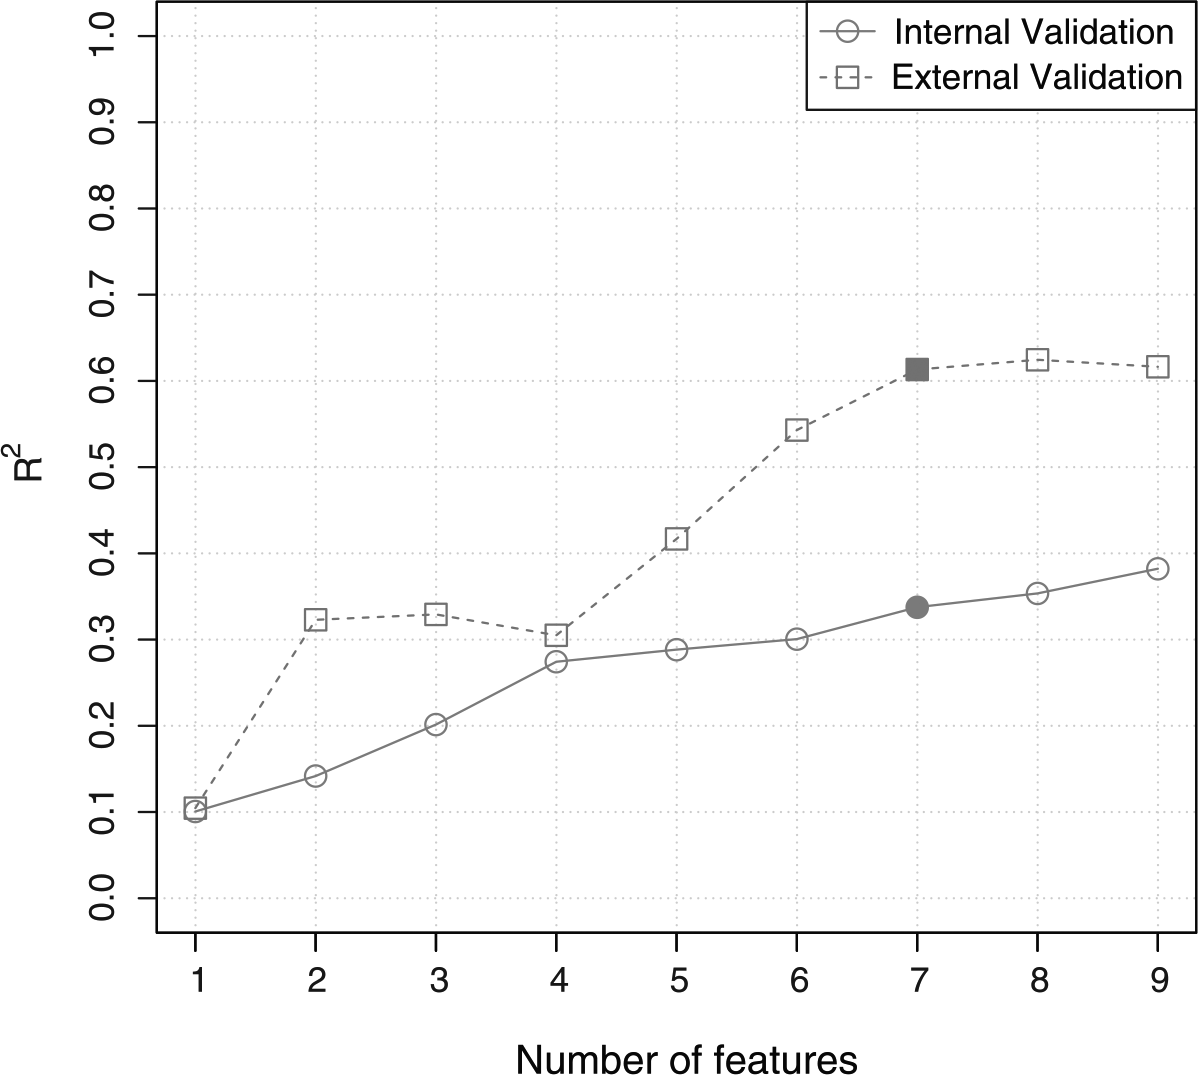
Internal and external validation performance (R2) for models built with the nine selected features and modelling valence.
Internal and external validation performance (R2) for arousal and valence.
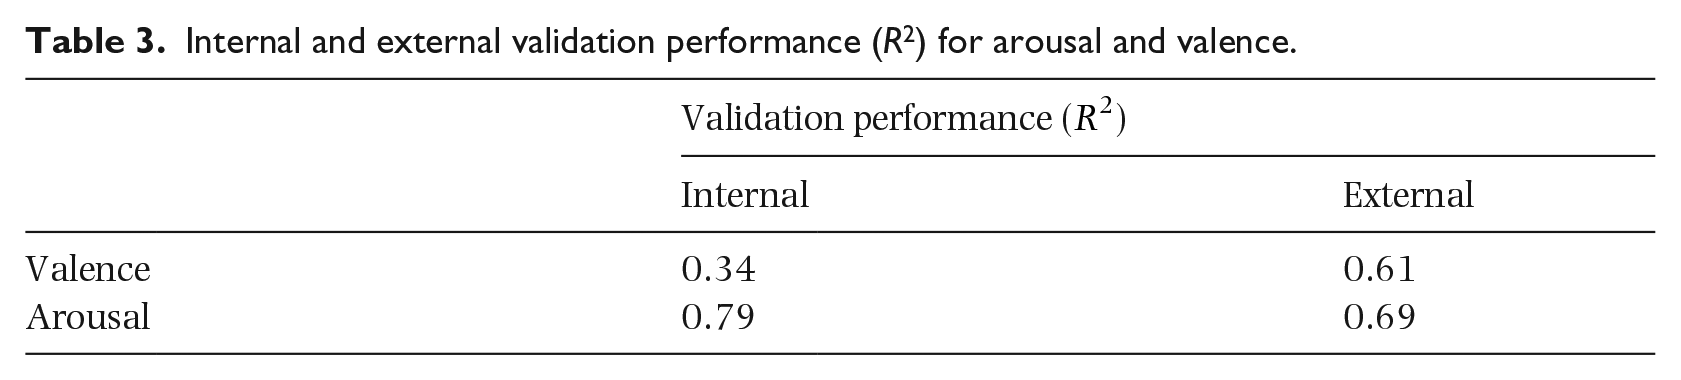
With respect to arousal, 15 features were identified as relevant. As a result of RFE, seven features were eliminated. In internal validation, R2 reached a maximum of 0.79 when eight features were included in the model. The AIC calculation reached a minimum when seven features were included in the model (Figure 2). This model accounted for 79% of the variance in the data (R2 = 0.79). In external validation, R2 reached a maximum of 0.69 with the optimum seven feature model.
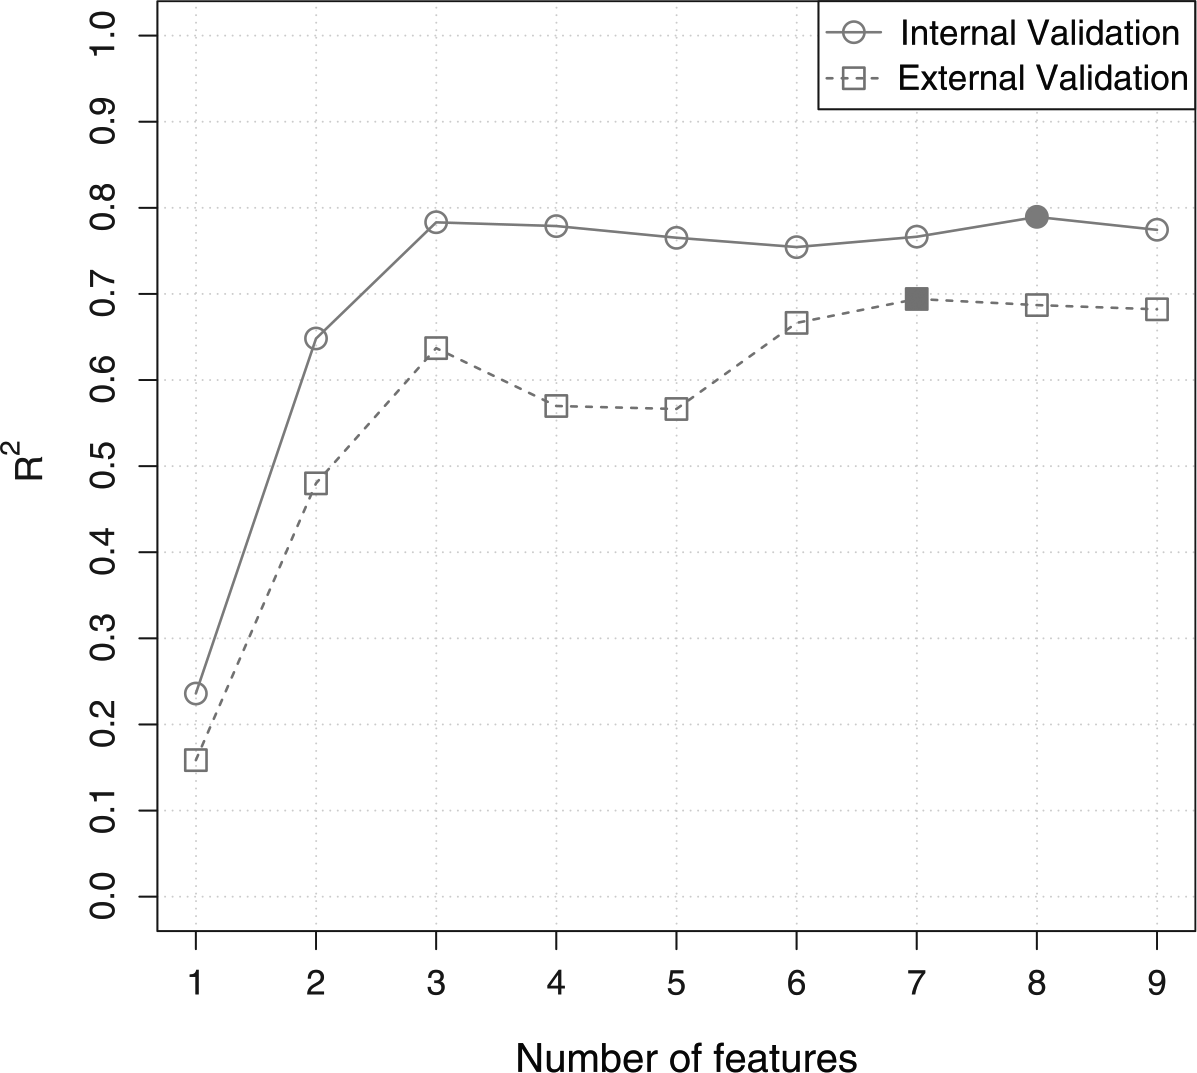
Internal and external validation performance (R2) for models built with the nine selected features and modelling arousal.
Final feature sets
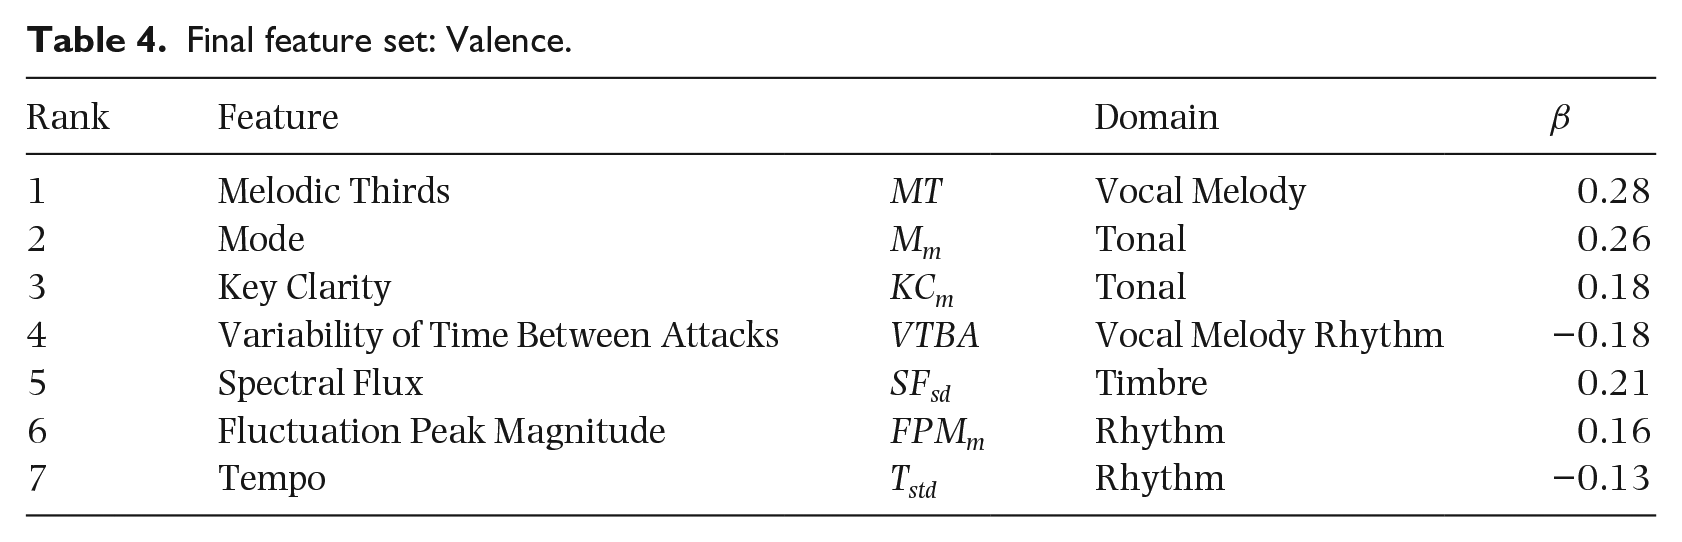
In the valence dimension, the optimum reduced feature space contained seven features; two vocal melodic structure features, two rhythmic, two tonal, and one timbral acoustic feature. Beta weights from the internally validated linear regression model give an indication of the contribution of each feature (Table 4). The highest contributing feature is the melodic structure feature Melodic Thirds. Melodic thirds is the proportion of melodic intervals in the melody that are major or minor thirds. The tonal features Mode and Key Clarity are ranked 2nd and 3rd. Mode describes the measure of majorness whereas Key Clarity describes the strength associated with the tonal centre of the melody (Lartillot & Toiviainen, 2007). Both of these features are represented by the mean frame-level value. The second melodic structure feature, Variability of Time Between Attacks is ranked 4th. This describes the standard deviation of the time in seconds between note onsets in the melody, and is one of only two features which show a negative relationship with valence. The frame-level standard deviation of Spectral Flux is ranked 5th and describes the amount of local spectral change. This has been roughly correlated with articulation in past research (Lu, Liu, & Zhang, 2006). Two rhythm features, Fluctuation Peak Magnitude and Tempo are ranked 6th and 7th. FPM measures the periodicity of rhythm, while tempo measures the overall speed or pace of the piece. Both of these features are represented by the mean frame-level value. Tempo shows a negative relationship with valence.
Final feature set: Valence.
In the arousal dimension, the optimum features space also contained seven features (Table 5). These included two melodic structure features, two tonal features, two timbral, and one rhythm feature. Ranked 1st is Key Clarity. As described above Key Clarity is a measure of the strength of the associated key. In this instance the frame-level mean value shows a negative relationship with arousal. Ranked 2nd is the frame-level mean of Chromagram Centroid. A chromagram shows the distribution of energy along pitch classes, and the centroid is the weighted mean or “centre of mass” of the distribution. The standard deviation of frame-level distribution of Tempo is ranked 3rd. This is a measure of the variability of tempo and shows a negative relationship to arousal. Fourth and 5th are both rhythm features derived from the vocal melody. Maximum Note Duration describes the duration of the longest note in seconds and shows a negative relationship with arousal. Variability of Note Duration shows the standard deviation of note duration in seconds. The frame-level mean of Spectral Centroid is ranked 6th. Spectral centroid is a measure of the weighted mean of the spectrum and is generally associated with brightness. Ranked 7th is the timbral feature Attack Time (AT). Attack time describes the overall duration of attack phase and is thought to give an indication of articulation. Attack time shows a negative relationship with arousal.
Final features set: Arousal.

Discussion
This study investigated the emotional effect of vocal features in popular music. We found that features derived from vocal melody played a significant role in predicting both arousal and valence. Of the seven features automatically selected for arousal and valence modelling, two were derived from vocal melody for each dimension.
In the valence dimension, Variability of Time Between Attacks (VTBA) and the number of Melodic Thirds (MT) were identified as important emotion indicators. VTBA is a measure of the standard deviation of note onsets in the vocal melody and shows a negative relationship with valence. This suggests that uniform timing of note onsets in a melody are perceived as more positively valenced. This finding is supported by the spectrally-derived acoustic feature Fluctuation Peak Magnitude (FPM m ), which is ranked 6th in the final feature set. FPM measures the periodicity of peak values in different spectral sub-bands. A positive relationship between FPM and valence indicates periodicity is perceived as more pleasing. Melodic Thirds (MT) is the proportion of intervals in the melody that are major or minor thirds, and has a positive relationship with valence. This finding suggests that melodies with smaller intervals are judged as more positively valenced.
In the arousal dimension, the vocal melody features Maximum Note Duration (MND) and Variability of Note Duration (VoND) are deemed emotionally salient. MND and VoND both belong to the rhythmic subcategory of vocal melody. MND shows a negative relationship, which suggests that short notes are judged more arousing by participants. VoND, which shows a positive relationship suggests that variation in note duration in a melody is perceived as more arousing. As arousal increases, sung notes become shorter and vary in length. This is supported by the inclusion of the acoustic feature Attack Time (AT sd ), which is a measure of the temporal duration of the attack phase of a note. The frame level standard deviation of Attack Time (AT sd ) has a negative relationship with arousal. This suggests that as perceived arousal increases, note attacks will show less variation.
With respect to vocal melody, our results show rhythm and articulation to be dominant characteristics for the expression of emotion in popular music. In particular we found rhythm regularity to play a central role. Rhythmic regularity, characterized by low variability of time between note attacks (VTBA) was percieved as more positively valenced. This is supported by previous studies that demonstrated links between positively valenced emotion categories of Happiness and Glad and regular rhythms (Gabrielsson & Lindstrӧm, 2010). Our findings also suggest that irregular rhythmic patterns, characterized by high variability of note durations (VoND) were perceived as more arousing. Arousal is also expressed by short articulation of notes, characterized by low maximum note duration (MND). This is consistent with previous research showing that staccato articulation is linked to high arousal emotion categories (Juslin, 1997) and dimensions (Wedin, 1972).
Our findings are supported by previous research in the analysis of popular music (Moore, 2001). In this work, rhythmic qualities “including anticipation and delay, stress and accenting within beats” are considered a central category for evaluating meaning in vocal style (Moore, 2001, p. 189). Rhythm and articulation are also major elements in the extended lens model of communication of emotions in music (Juslin & Timmers, 2010), and the absence of these features has also been shown to greatly reduce the accuracy of music emotion communication (Juslin & Madison, 1999).
Nonvocal structural features also show considerable overlap with previous music emotion research. Tempo, which is present in both arousal and valence feature sets has long been considered of primary importance both in the expression of discrete emotion classes (e.g. happy, sad; Dalla Bella, Peretz, Rousseau, & Gosselin, 2001; Gundlach, 1935; Hevner, 1935, 1936; Juslin, 2000; Juslin & Lindstrӧm, 2010) and continuous emotion dimensions (G. L. Collier, 2007; Ilie & Thompson, 2006). In the present study, the standard deviation or variability of tempo during the music (T sd ) is deemed important, rather than absolute tempo. This further supports the notion that regularity, indicated by steady tempo, is important for emotional effect in popular music. Mode is present in the final features set and shows a positive relationship with valence. In this context, the value is related to majorness of the key. This finding is consistent with a number of previous works where major mode corresponds to happiness and joy, minor mode to sadness (Gerardi & Gerken, 1995; Hevner, 1936; Lindstrӧm, 2006). Pitch height, represented by the Chromagram Centroid (CC m ) represents the “centre of mass” of the chroma of pitch classes. The greater the value of the Chromagram centroid the higher the pitch level. A relationship between pitch height and arousal has been shown in previous research (W. G. Collier & Hubbard, 1998; Hevner, 1937; Ilie & Thompson, 2006). It is important to note that loudness features were not selected for either emotion dimension. This supports our previous argument that production techniques reduce dynamic range, making these features less informative for music emotion recognition.
When considering acoustic and vocal melody features combined, our results show the following relationships between emotion and music features: pop music will be perceived as more positively valenced if it is composed in a clearly defined major key (KC m , M m ), contains melodies that are rhythmically steady, moderate in tempo, with a higher number of smaller intervals (VTBA, FPM m , T sd , MT), and shows uniform instrument articulation (SF sd ); and music will be perceived as more arousing if it is high in register and bright in timbre (CC m , SC m ), contains melodies with predominantly short note durations which vary in length (MaxNM, VoND), and with a steady tempo and clearly defined key (T sd , KC m ).
Our selection technique identified a number of features that coincide with existing findings in popular Music Emotion Recognition (Eerola, 2011). This study found that Mode, Fluctuation Peak Magnitude, Key Clarity, and Tempo play an important role in the prediction of valence in popular music. This is an interesting finding considering the differences in stimuli in both studies. In contrast to the selection of well-known popular songs used in Eerola (2011), this study uses prepared stimuli manipulated to remove familiarity and associations of well-known pop music. This overlap may suggest an underlying universality of cues or features that express valence in popular music.
In this study we used the concept of generalizability to assess the efficacy of vocal melodic features. To test generalizability, we used a modelling procedure based on internal and external validation. Internal validation used data collected in study 1, external validation used data collected in study 2. A model that accurately represents the relationship between vocal melodic features and expressed emotion should perform well in internal and external validation. In terms of internal validation, we found that valence underperforms compared to arousal. The valence model accounts for 34% of the variance of the data compared to 76% for arousal. Despite this imbalance, performance metrics are more evenly balanced in external validation. Here, valence accounts for 61% in contrast to arousal at 69%. It is important to note however, that the methodology presented was designed to identify the optimum model based on the AIC. We have shown that the inclusion of all relevant, uncorrelated features produces models which account for more variance in the data (R2). However, this does not represent the optimum model.
The contrast in internal and external validation performance is also noteworthy within the emotion dimensions. With valence, internal validation is lower than external. With arousal the opposite is true. In this case, the model for arousal showed more stability than that of valence. This could be caused by a number of factors, including an imbalance in the underlying data or a bias during the initial stimuli selection. More likely is that it is a reflection of the inherent difficulties in modelling musical valence.
Footnotes
Funding
The author(s) disclosed receipt of the following financial support for the research, authorship, and/or publication of this article: This research was funded by the Engineering and Physical Sciences Research Council (grant no. EP/F00558X/1).