
Abstract
Can music be rated consistently using icon descriptors without verbal mediation? Sixty-eight participants rated six experimenter- and two self-selected pieces of music along 15 bipolar icon scales intended to portray emotions, and sensory experiences involving color, temperature, shape, speed, texture, and weight. Several replications were reported, including Mozart being blue, Brahms being soft and Bizet being takete (a jagged shape). Crossmodal associations with individual pieces were similar to those reported in previous studies, but self-selected liked and disliked musics did not evoke as many such associations, leading to the conclusion that crossmodal perception may be indicative of music character more so than it is of hedonic tone. The similarity of results in the present study and previous research suggests that icon scales may provide a convenient alternative to sensory scales in various modalities that are difficult to reproduce via current conventional computer interface technology.
An intriguing aspect of music is its capacity to elicit a rich number of often shared sensations and images which can be attributed in part to crossmodal correspondences. Many studies have investigated the relationship between music versus colors, tastes, vision, and odors, suggesting that people can exhibit consistent crossmodal responses in different sensory modalities (Ward, Huckstep, & Takehiko, 2006).
Ward et al. (2006) studied a group of synesthetes reporting color sensations in response to music and other sounds. Their experiment showed that synesthetes choose more precise colors and are more internally consistent in their choice of colors given a set of sounds of varying pitch, timbre and composition (single notes or dyads) relative to a control group. In spite of this difference, both controls and synesthetes appear to use the same heuristics for matching between auditory and visual domains (e.g. pitch to lightness).
Reinoso Carvalho et al. (2015) demonstrated that what people hear exerts a significant influence over their rating of the taste of chocolate. Deroy (2013) showed that the associations between certain odors and music are not primarily conceptual or linguistic, but are grounded in structural perceptual or neurological determinants. These cases of crossmodal correspondences established between contingent environmental features can be explained as amodal, indirect, and transitive mappings across modalities.
Some authors (e.g., Martino & Marks, 2001) place the phenomenon along a spectrum from a strong kind to a weak kind. The strong kind is when a physical object is actually perceived in a different form or sense—for example, a sound is felt as a color or tactile object or taste in the mouth. This is referred to as strong crossmodal correspondence, and for some it is a sufficient condition to label an individual a synesthete. The weaker kind is when an object reminds or primes the individual of something in the different modality, but the individual is aware or able to separate one as being caused by the other (metaphor), rather than being the literal, “same” percept. This weaker kind is referred to as weak crossmodal correspondence.
Sensory scales were first introduced by Da Pos and Pietto (2010) with the aim of studying perceived qualities of colors in terms of Osgood’s semantic differential (Osgood, Suci, & Tannenbaum, 1957) with a sensorial differential. This approach makes use of multisensory scales instead of the corresponding verbal scales: for instance, instead of asking the observer to rate on a bipolar scale how “cold” versus “warm” the music was, the observer immerses his/her hands in a container of cold water (5° Celsius) and a container of warm water (40° Celsius), deciding which sensation best “describes” the music along a rating scale placed between the two sensory objects.
Results showed that subjects’ ratings on nonverbal sensory scales are consistent, offering interesting possibilities about the relationship between music and other sensorial information. Such nonverbal sensory scales have been used to rate music by Murari et al. (2014). In their research, a number of scales in different sense modes were constructed. After listening to an extract of music, participants rated the piece in terms of each bipolar sensory scale, such as between the boundaries of cold water and hot water, or a heavy weight and a feather, or a rough surface and a smooth surface.
Although some consistencies have emerged in the rating of music using sensory scales, a methodological limitation is that the preparation and application of the scales are fairly resource intensive and mostly difficult if not impossible to implement on current computer interfaces. One solution is to represent the various sensory scales in a pictorial, icon form. But no studies have been found which have used a range of icons representing different sensory modalities (e.g., an image depicting warmth versus an image depicting cool) to rate the perception of music.
The aim of the present study is to extend the multisensory approach to the use of icon equivalents, without graphemic (verbal) cues rated during an online survey. The icon items selected are partly equivalent to the sensory items used in previous experiments. This allowed a direct comparison between results obtained with “real” sensory scales used in previous research and newly devised icon scales on the evaluation of the same musical excerpts, casting new light in the complex field of crossmodal associations.
Method
Participants
Sixty-eight participants from a university in Australia were recruited in line with University ethics guidelines. Twenty-seven were male, 40 female, and one did not disclose his/her sex. Average age was 21.97 years (SD = 5.95 range = 18–41). The average years of musical instrument lessons reported was 7.81 years (SD = 6.57, range = 0–30).
Stimuli
The stimuli consisted of two participant (self-)selected pieces and six experimenter-selected excerpts. The instructions the participants received for the self-selected pieces was that one should be a piece that is liked and the other a piece that is disliked. They were instructed that both pieces should be available on a media streaming website, such as YouTube. The aim of including liked and disliked music was to see whether positive/negative connotations of color (e.g., orange/blue, respectively) transferred to general opinions about a piece of music, rather than specific features of a piece of music (to which most of the above cited studies have been limited). The experimenter-selected pieces were taken from previous research (Bigand, Vieillard, Mandrel, Matozeau, & Racquets, 2005; Rodà, Canazza, & De Poli, 2014, also used in Murari et al., 2014 and Murari et al., 2015b) used to evoke a wide range of emotions, and consisting of a variety of combinations of mode (major or minor) and tempo (fast or slow). The details of the experimenter-selected excerpts are shown in the Appendix. They will be referred to by the name of the composer or stimulus number. Each excerpt had a duration of between 8 and 19 seconds.
Material
Scales were constructed to provide icon analogues of a range of non-visual sensory ratings, as well as some visual sensory scales (colors, shapes and emotion faces). Sensory scales from several sensory modes (Murari et al., 2014; for a detailed discussion, see Murari et al., 2015a, Da Pos, Dal Mas, & Stelluto, 2012) were included, as well as nonverbal ratings of emotions, using simple emoticon-like faces (as used by Schubert, Ferguson, Farrar, Taylor, & McPherson, 2013) and images of the poles used in the Self-Assessment Manikin (SAM; Bradley & Lang, 1994) which represent the affective dimensions of pleasure, arousal and dominance. Selection of colors for emotion faces was based on previous work (Da Pos & Green-Armytage, 2007; Schubert et al., 2013). Specifically, the modalities represented by the icons were emotion-related colors (red, blue, orange, and cyan), temperature (hot, cold), shapes (angular, curved), speed (fast, slow), texture (rough, smooth, soft, hard) and weight (heavy, light). In Figure 1, the icon items are represented with their intended verbal descriptions.
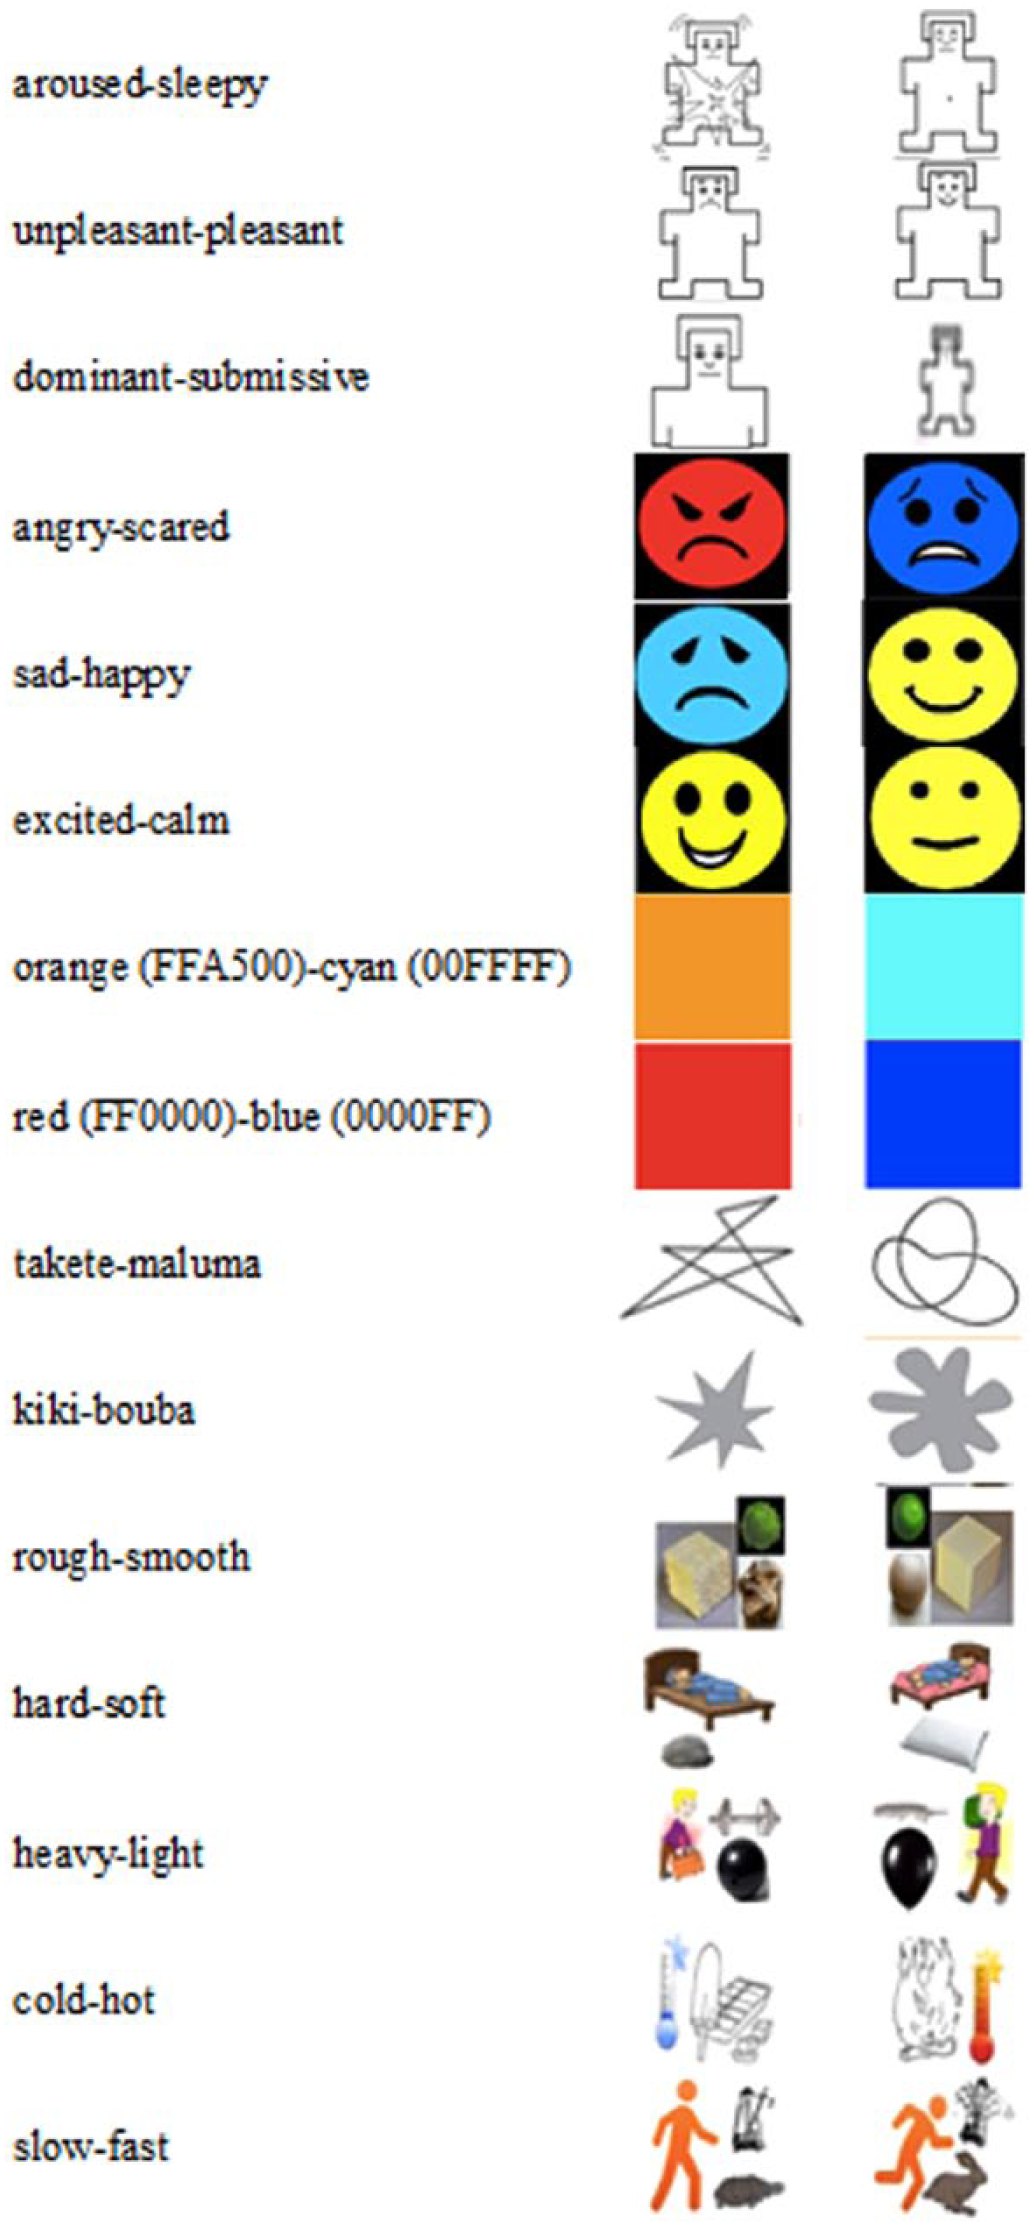
Crossmodal and emotion related icons used in the study. All icons were presented in a 42 × 42 pixel frame. The six-digit code after each color indicates the HTML color code hexadecimal triplets. Hexadecimal web colour codes for each colour are shown in parentheses. See Material section for more details about the source of each icon.
We selected both the visual shapes maluma-takete, the pair of pseudo-words invented by Köhler (1929), to show the non-arbitrary mapping between speech sounds and the visual shape of objects and the pair kiki-bouba, employed by Ramachandran and Hubbard (2001), Nielsen and Rendall (2011), and Milán et al., (2013) to suggest that sound–shape correspondences influence the evolution of language. In our study, takete-maluma and kiki-bouba were used as different versions of the “same” scale, and so the labels are different to help differentiate the two versions for the researchers (not the participants, as they did not see any verbal labels for the experiment).
Procedure
Participants were asked to have ready two pieces of music, one liked and one disliked, which they would use in the study when prompted. They completed the study online and were requested to find a location which was quiet, where they would not be disturbed, and where they had a good audio system (speakers or headphones). The survey was designed and distributed using Keysurvey (WorldApp, http://www.keysurvey.com/). No specifications were made regarding a required screen size and participants were free to respond on whatever electronic device they chose. Demographic information was requested and participants completed the relevant listening tasks for each piece. The order of the musical excerpts (including the location of the liked and disliked ones) was differently random for each participant. The poles of each rating item were swapped across sessions so that an item with poles A–B (e.g. blue–orange) was on some occasions presented in the order A–B (left to right) and at other times B–A (left to right, e.g., orange–blue). The distribution of the differently ordered poles was random. Participants were asked to check that their sound systems were working and that the volume was set to a comfortable level, and to put on their headphones if necessary.
When ready, the participant clicked a start button to commence to listening to a piece of music. The participant then rated the music along each of the 15 seven-point icon-pair items (Figure 2). As pointed out by Lindberg and Näsänen (2003), the pixel size of 32 × 32 was considered adequate for distinguishing icons and for good search speed among a matrix of icons. Moreover, as Milán et al. found (2013), icons containing more than one image conveying the same concept were considered more effective in communicating an unambiguous meaning. Nevertheless, we acknowledge that enlarging greater pixel resolution would facilitate the recognition of icons.

Sample seven-point icon rating item when judging a music stimulus.
The specific instructions for making ratings presented to the participants were “For each pair of images, select the one that best reflects the character of the music (that is, what the music seems to be conveying or representing or expressing). Do this by clicking on the dot in the row of seven dots that is closest to that image. You may click on any of the other dots in the row if you think it provides a better answer. Please give your initial impression.”
When participants had completed their responses to a piece of music, they could not return to check their answers, and moved on to the next piece.
Results and discussion
Descriptive statistics
A multivariate analysis of variance (MANOVA) was carried out treating the musical excerpts as independent variable and the 15 scales as dependent variable. A significant multivariate main effect was found for the musical excerpts, Wilks’ λ = 0.077; F(75,1862) = 17.525, p < .001, η2p = .400.
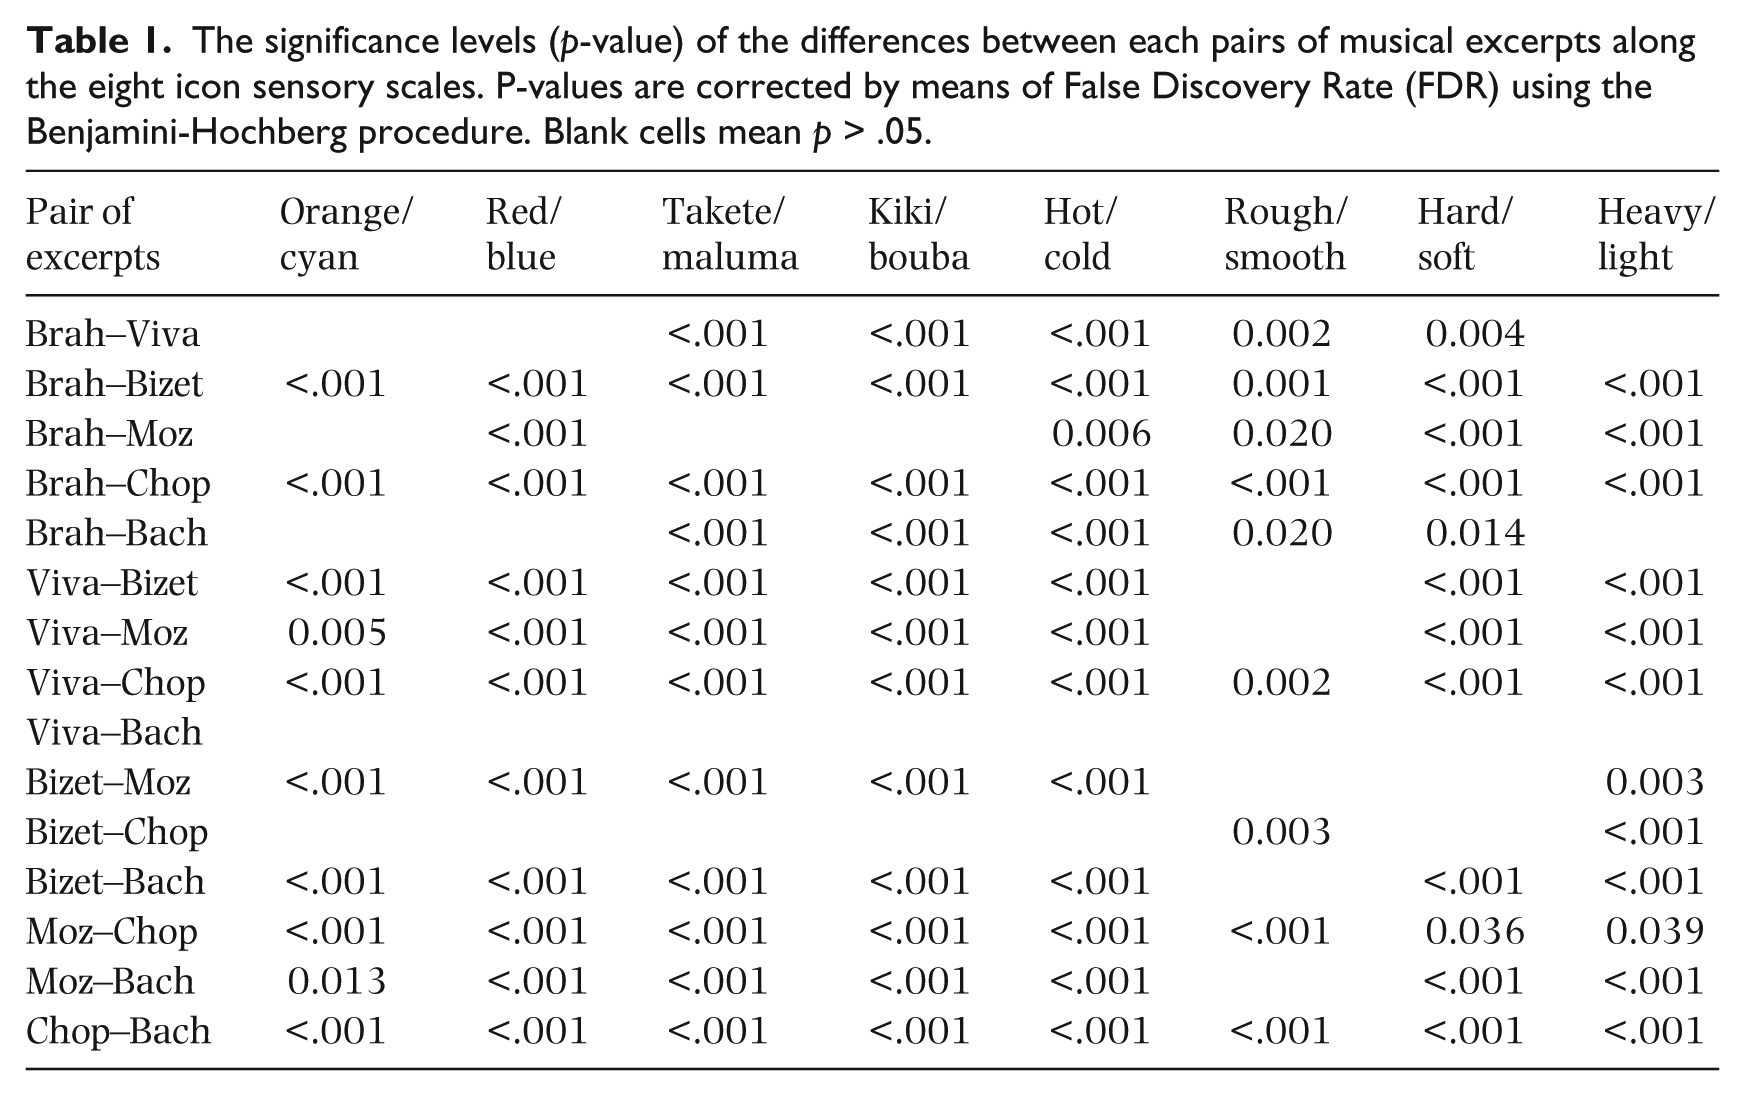
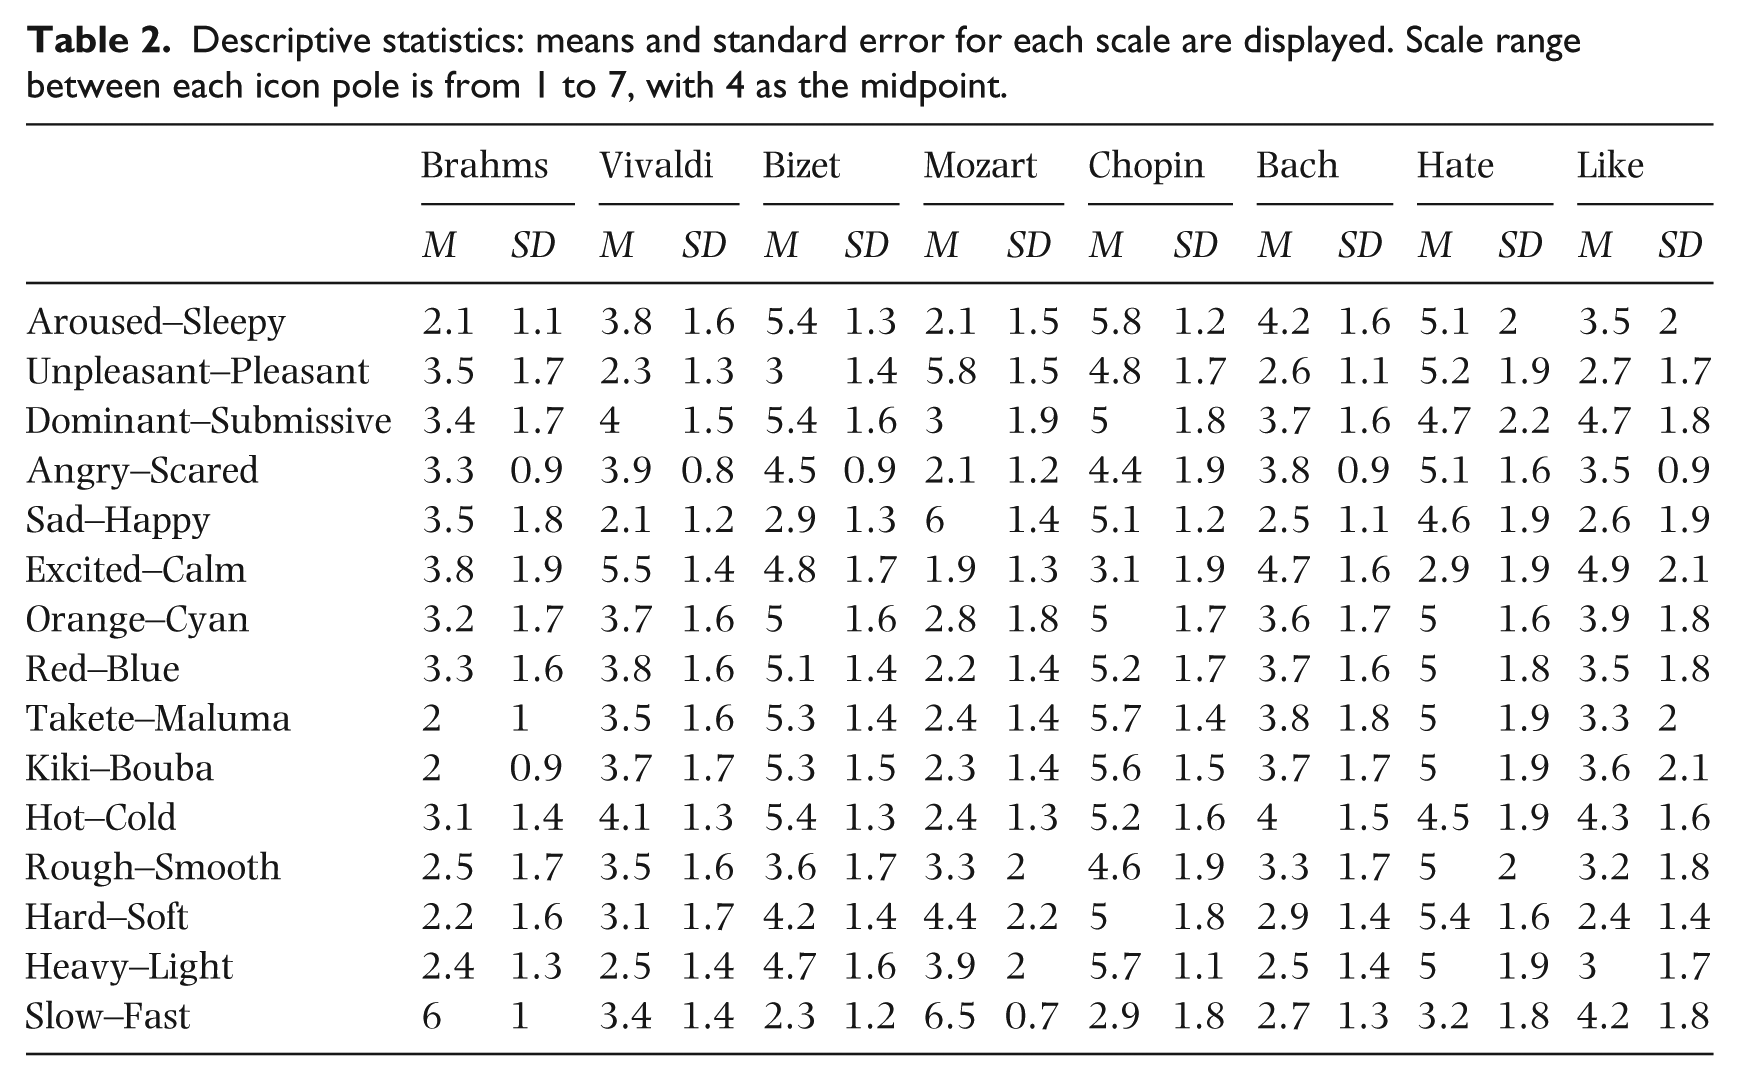
Table 1 shows the significance levels (p-values) of the differences between each pair of musical excerpts along the eight icon sensory scales that were also used in previous studies by Murari et al. (2014; 2015a; 2015b). P-values were corrected by means of False Discovery Rate (FDR) using the Benjamini-Hochberg procedure. Table 2 shows the means and standard error for each scale.
The significance levels (p-value) of the differences between each pairs of musical excerpts along the eight icon sensory scales. P-values are corrected by means of False Discovery Rate (FDR) using the Benjamini-Hochberg procedure. Blank cells mean p > .05.
Descriptive statistics: means and standard error for each scale are displayed. Scale range between each icon pole is from 1 to 7, with 4 as the midpoint.
The pair Vivaldi–Bach presents no significant differences. Chopin is considered significantly different along all the eight scales in comparison with Brahms, Vivaldi, Mozart and Bach. Bizet and Chopin are differentiated only along the scales rough/smooth and heavy/light.
Factor analysis
Principal axis factoring was conducted and the solution was rotated according the Varimax method with Kaiser Normalization. From this analysis, three factors emerged and the explained variance was 57.35%.
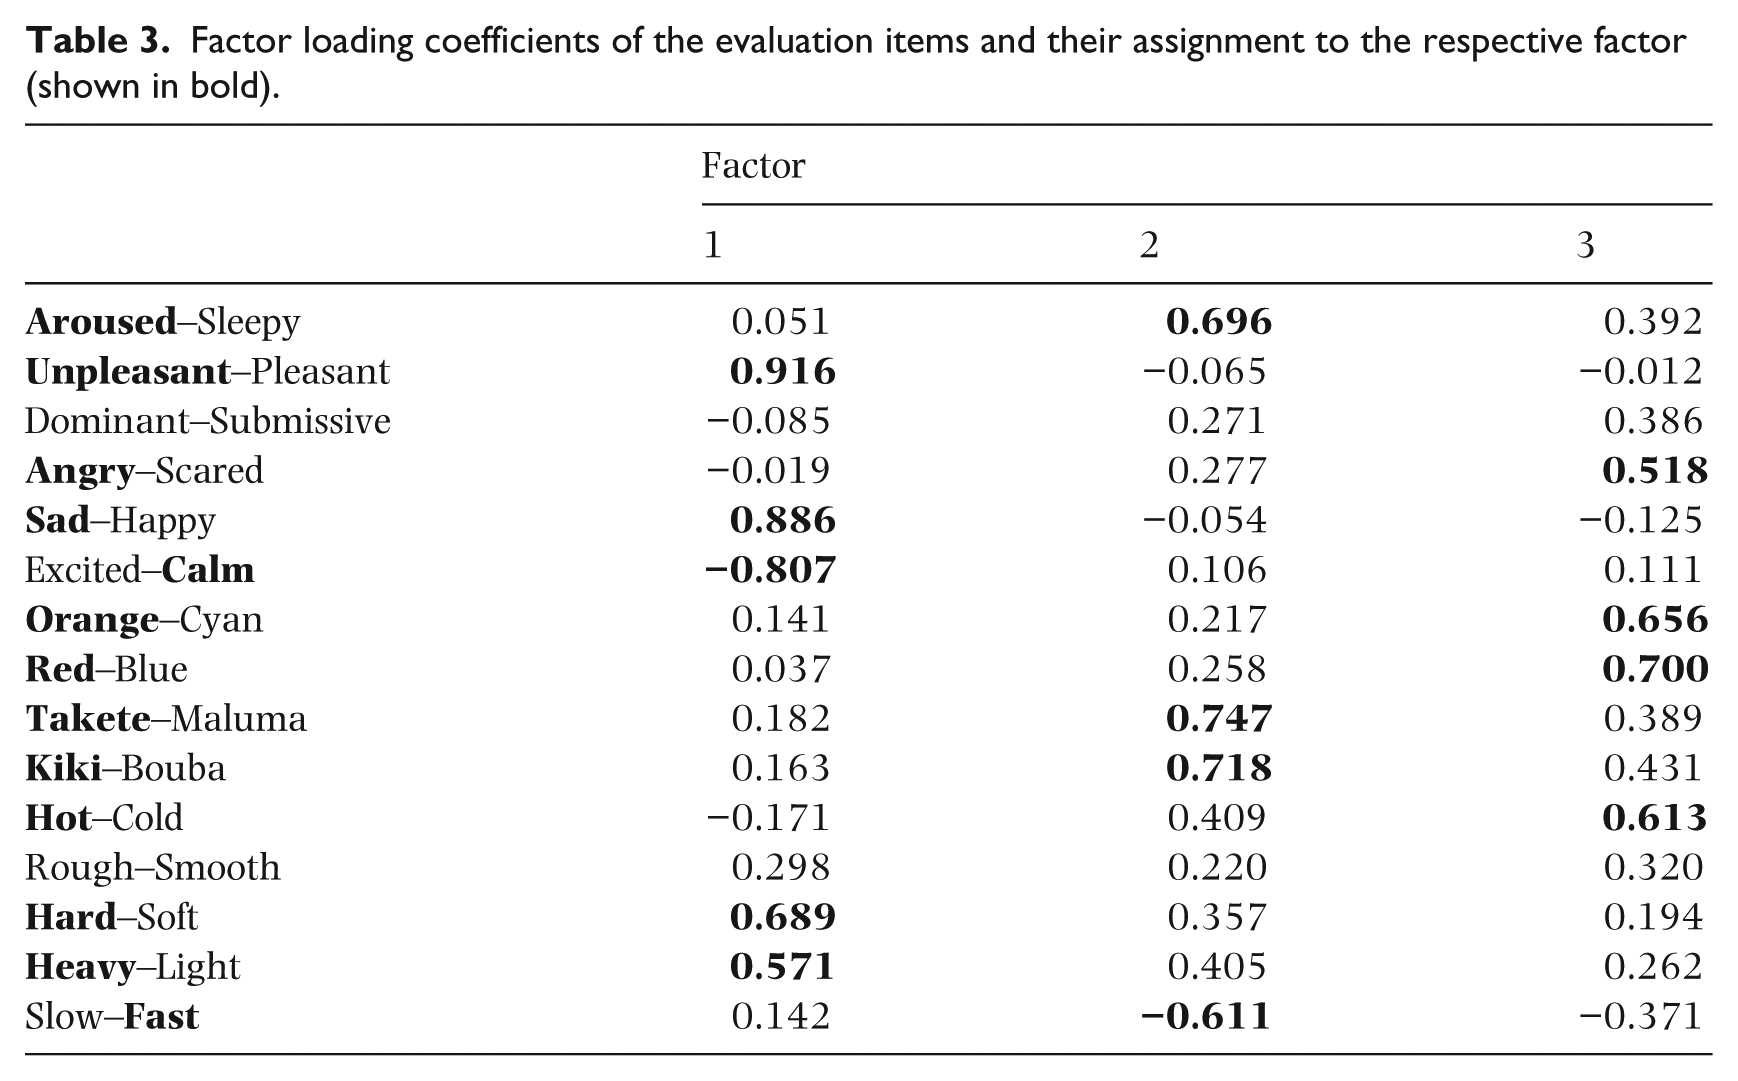
Factor one groups together the scales pleasant/unpleasant, sad/happy, calm/excited, hard/soft and heavy/light. This factor seems mainly connected to the category of valence. Factor two groups together the scales aroused/sleepy, takete/maluma, kiki/bouba, slow/fast and seems mainly connected to the category of arousal. Factor three groups together the scales angry/scared, orange/cyan, red/blue and hot/cold and can be labelled “temperature.”
In this analysis, both colors and temperature load onto the same factor. Furthermore, this factor also has the anger emotion face loaded. According to the Semantic Coding Hypothesis, dissimilar types of signals in different sensory modalities (e.g., color and physical temperature) can interact with each other at a post perceptual level of information processing (e.g., Marks, 2004). The color–temperature combination that is congruent with the post-perceptual association might, then, facilitate a participant classifying/labelling a relatively low temperature as cold and a relatively high temperature as warm.
Only the rough–smooth item failed to load onto either of the three components assuming a factor loading criterion of ≥ .5, possibly reflecting a limitation of the icon chosen to represent this sensory scale (Table 3).
Factor loading coefficients of the evaluation items and their assignment to the respective factor (shown in bold).
Characteristics of the stimuli in terms of icon description
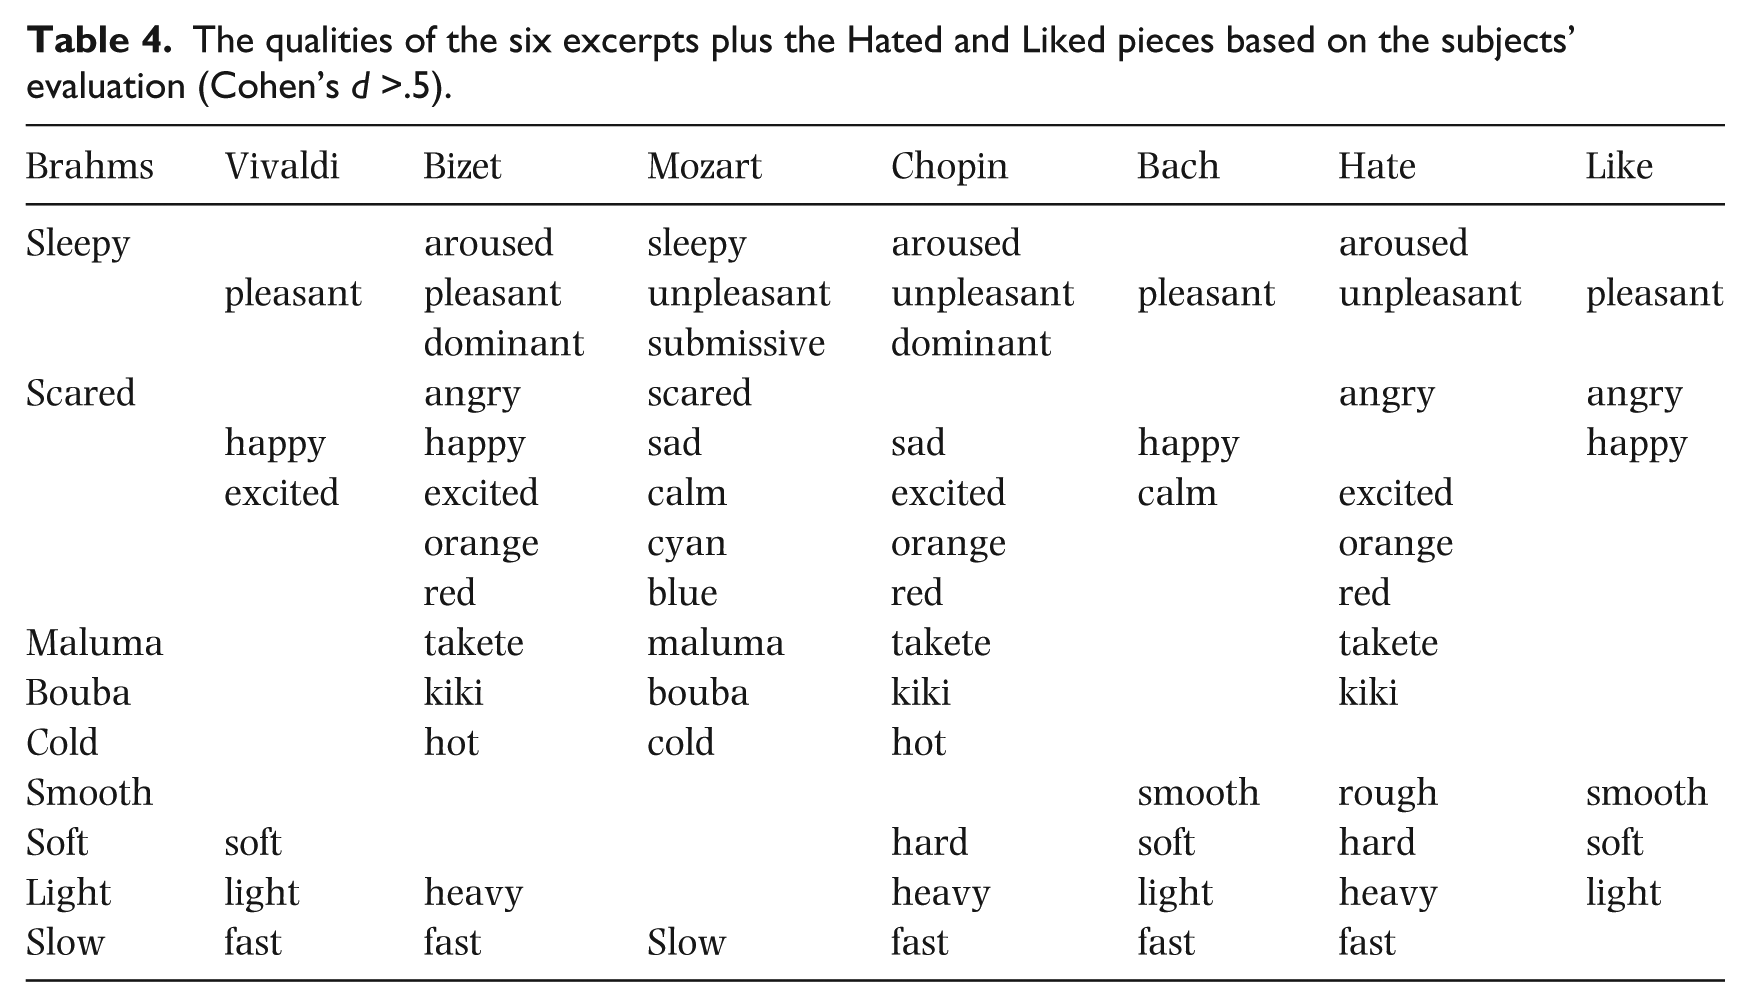
Evaluation of music items was conducted by analysing the mean rating for each bipolar scale, and comparing the mean against the midpoint of the scale. Single sample t-tests were conducted. Only ratings that are significantly different and with Cohen’s d > .5 are reported. Results are shown in Table 4.
The qualities of the six excerpts plus the Hated and Liked pieces based on the subjects’ evaluation (Cohen’s d >.5).
Since Brahms, Vivaldi, and Bizet were used both in Experiment 1 of Murari et al. (2014) and Murari et al. (2015a) and Mozart, Chopin, and Bach in Experiment 2 of Murari et al. (2014) and Murari et al. (2015a), and all the musical excerpts were employed in Murari et al. (2015b), we report a table with the significant qualities of each musical excerpt (Table 5), in order to allow comparison. For ease of understanding, the results of Experiment 1 and 2 described in Murari et al. (2014) will be referred to as Exp14, while the results of the Experiment described in Murari et al. (2015a) will be referred to as Exp15. In both experiments the same sensory scale representations were used (apart from the addition of the scale tense-relaxed in the 2015 experiment). Moreover, only the 2015 study directly compared sensory and equivalent verbal scales. That study used actual sensory items; the present study uses icon equivalents.
The qualities of the six excerpts as evaluated in the experiments presented in Murari et al. (2014) and in Murari et al. (2015b). Only significant values are displayed (p < .05).
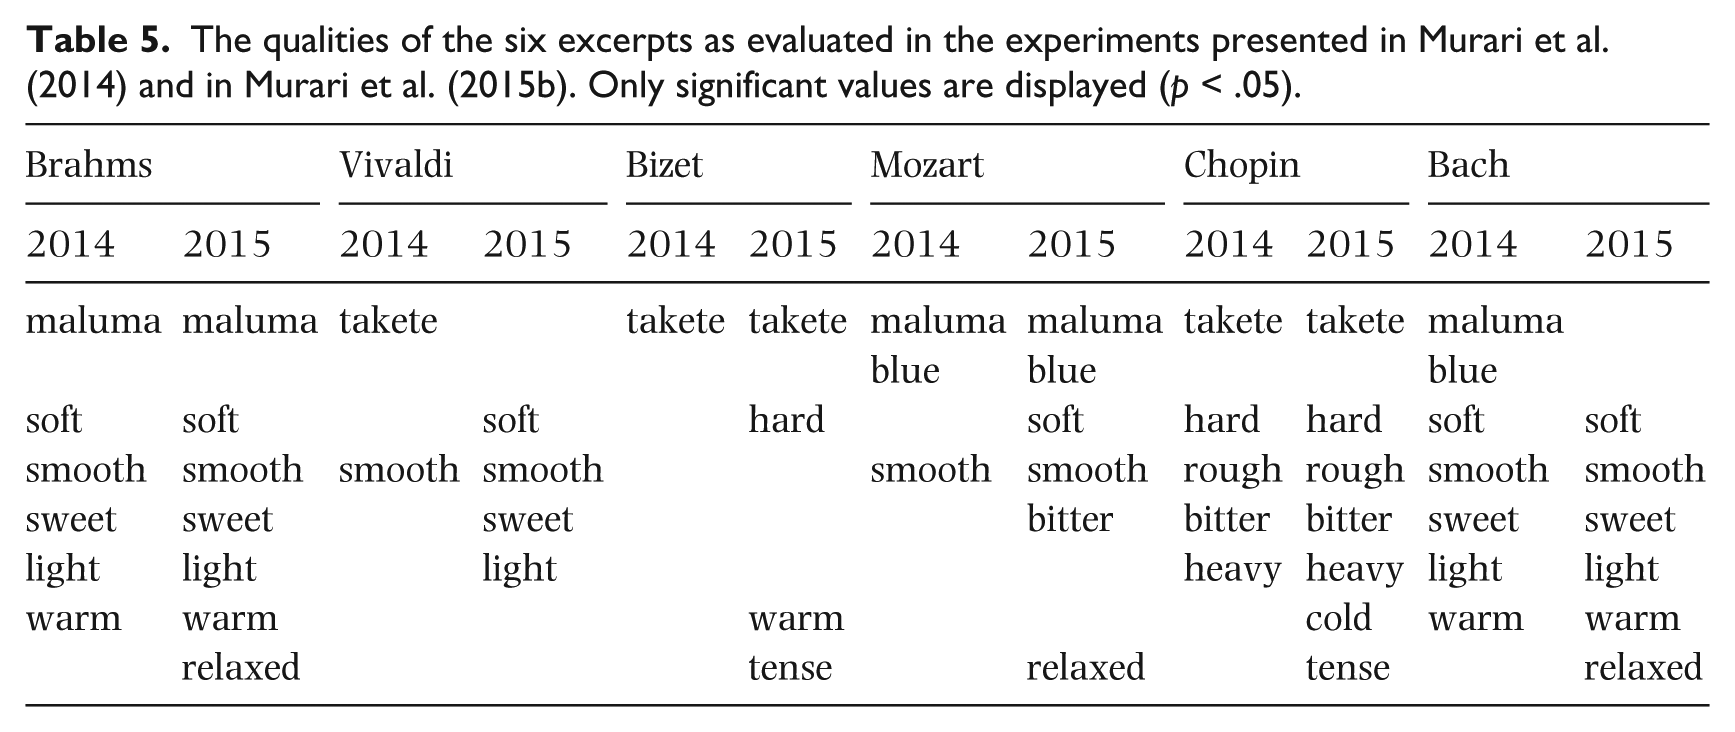
In terms of icons, Brahms is sleepy, scared, cyan, blue, maluma/bouba, cold, smooth, soft, light, slow. In Exp14 and Exp15, the Brahms excerpt is also rated maluma, soft, smooth, and light, with the addition of sweet and relaxed and a different rating in term of warmness.
The icons that characterize Vivaldi are High SAM pleasantness and happy and excited faces, together with the qualities soft, light, and fast. In Exp14, Vivaldi is rated takete and smooth, while in Exp15 it is described as soft, smooth, sweet, light.
Bizet, in terms of icons, is characterized by the SAM items aroused, pleasant and dominant, angry, happy and excited faces, the qualities takete/kiki, orange, red, hot, heavy, and fast. In Exp14 Bizet is rated takete, while in Exp15 it is also rated hard, warm and tense.
Mozart, in terms of icons, is characterized by low SAM arousal, low SAM pleasantness low SAM dominance, sad, scared, and calm faces, and by the qualities cyan, blue, maluma, bouba, cold, and slow. In Exp14 it is rated maluma, blue, and smooth, while in Exp15 it is rated maluma, blue, soft, smooth, bitter, and relaxed. It is interesting to notice that in all experiments this Mozart excerpt is always characterized by the blue quality. It seems as if this color could render the essence of this highly poetical piece, so melancholic and intimate and, in some respects, ineffable.
Chopin is characterized by high SAM arousal, unpleasantness and dominance, sad and excited faces, orange, red, takete, kiki, hot, heavy, and fast. In both Exp14 and Exp15 Chopin is takete, hard, rough, bitter, heavy, cold, and tense.
In terms of icon description, Bach is characterized by high SAM pleasantness, happy and excited faces, and by the qualities smooth, soft, light, and fast. According to Exp14 Bach is soft, smooth, sweet, light, warm, and relaxed, while in Exp15 Bach is also rated maluma and blue. We notice the high agreement between sensory and icon evaluations, except for color qualities and the maluma–bouba pair. We also noticed a strong similarity between the evaluation of the Vivaldi and Bach excerpts. They share the same icon qualities, apart from smooth, and this result is indicative of the similarity of the two pieces, both from the Baroque period and characterized by brightness and brilliance.
The Hated piece is characterized by high SAM arousal, low SAM pleasantness, angry and excited faces, orange, red, takete, and kiki, and rough, hard, heavy, and fast. On the other hand, the Liked piece is characterized by high SAM pleasantness, angry and happy faces, and the quality smooth, soft, light.
The Bizet–Chopin (orange/red, hot) and the Brahms–Mozart (cyan/blue, cold) triangulate a possibility that the color-temperature connection is stronger and more consistent than the color-emotion connection. Further research is needed to understand what mediates the relationship between colors and temperature and between colors and emotions. Moreover, the fact that a piece of music may evoke contrasting emotions is exemplified by the Bizet being rated angry and happy at the same time. In Murari et al. (2015b), Mozart was characterized by the apparently incongruent coupling sad and pleasant. As pointed out by Taruffi and Koelsch (2014), emotional responses to music are multifaceted and linked to a multidimensional experience of pleasure, and according to Schubert (1996, 2013) absorption with music allows a separation of negative emotions such as sadness from pleasure.
Conclusions
Crossmodal correspondences are evident in describing music. Shapes, colors, and temperature were frequently and consistently associated with the characteristics of different pieces.
The consistency of results obtained in this study and in previous experiments suggests that sensory and icon ratings of music can reveal a useful tool in order to move beyond the verbalization of emotions. Nevertheless, further research is needed in order to allow comparison with verbally labelled response scales and in order to identify which aspects of crossmodal perception are indexed by sensory scales. Moreover, it could be interesting to compare results obtained by icon and sensory ratings of musical excerpts in video and audio performances. As demonstrated by Vuoskoski, Thompson, Spence & Clarke (2016), visual kinematic performance cues show crossmodal effects on the perception of auditory expressivity in piano playing. Such results can be extended and integrated with the contribution of sensory and icon scales, which are revealing useful tools to help disentangle the intricate realm of crossmodal correspondences.
In conclusion, the present study offers a further development in sensory scale research on music by promising the possibility of a portable icon version of sensory scales. Icons appear to be able to convey a wide range of sensory experiences, but future research is needed to investigate the specific correlations between the icons representing pieces of music and the character/associations of the music. The further development of the icon multisensory scale proposed here will allow a convenient way of investigating nonverbal responses to music quantitatively.
Footnotes
Appendix
Description of the musical excerpts:
Funding
The author(s) disclosed receipt of the following financial support for the research, authorship, and/or publication of this article: This study was supported by the Australian Research Council.