
Abstract
Cognitive accounts for the formation of expectations during music listening have largely centered around mental representations of scales using both melodic and harmonic stimuli. This study extends these findings to the most recurrent cadence patterns associated with tonal music using a real-time, continuous-rating paradigm. Musicians and nonmusicians heard cadential excerpts selected from Mozart’s keyboard sonatas (perfect authentic cadence [PAC], imperfect authentic cadence [IAC], half cadence [HC], deceptive cadence [DC], and evaded cadence [EV]), and continuously rated the strength of their expectations that the end of each excerpt is imminent. As predicted, expectations for closure increased over the course of each excerpt and then peaked at or near the target melodic tone and chord. Cadence categories for which tonic harmony was the expected goal (PAC, IAC, DC, EV) received the highest and earliest expectancy ratings, whereas cadence categories ending with dominant harmony (HC) received the lowest and latest ratings, suggesting that dominant harmony elicits weaker expectations in anticipation of its occurrence in cadential contexts. A regression analysis also revealed that longer excerpts featuring dense textures and a cadential six-four harmony received the highest ratings overall.
Over the past three decades, the resurgence of associationist conceptions of mental processing in experimental psychology—demonstrated by the emergence of theories like implicit learning, connectionism, and predictive coding—has placed the study of expectations front and center. Indeed, from the associationist point of view, the brain is essentially a “prediction machine” that generates expectations about future events by forming associations between co-occurring attributes within the external environment (Bar, 2007; Clark, 2013). In this context, the formation of mental representations (or schemata) during perception is assumed to be based on an implicit learning strategy that abstracts the pattern of features a given sequence of events might share with previously encountered exemplars. Reber (1993) has argued, for example, that the organizational principles responsible for complex communication systems like natural language result from general induction routines in the cortex that operate across modalities and across stimulus forms. With sufficient exposure, these routines learn the underlying structure of the stimulus display and then guide the sensory apparatus to seek out similar structures. As Bharucha (1987) explains, “events are thus expected, implied, [or] erroneously judged to have occurred, … to the extent that their mental representations have been activated in anticipation of their occurrence” (p. 3).
Applications of this decidedly cognitive view of music processing in experimental psychology have largely centered around mental representations of tonal materials, either in reference to scales (Dowling, 1978), or to the stability relations characterizing tonality more generally, such as Krumhansl’s (1990) studies of the tonal hierarchy. Yet few such studies have applied the schema concept to the variety of recurrent harmonic and melodic ending formulæ found in Western tonal music—what theorists and composers have for centuries called cadences. Indeed, the tonal cadence is generally considered to be the quintessential phrase-level event schema (Eberlein, 1997; Eberlein & Fricke, 1992; Gjerdingen, 1988; Meyer, 1967; Rosner & Narmour, 1992; Sears, 2015, 2016; Sears, Caplin, & McAdams, 2014; Temperley, 2004), with the specificity of the mental representation reflected in the strength and specificity of the schematic expectations it generates. And yet experimental studies explicitly examining the perception of cadences (or cadential closure) are notably few (e.g., Tillmann, Bigand, & Madurell, 1998; Sears et al., 2014). Instead, a vast number of studies employ chorale-like harmonic cadential progressions (e.g., V–I) as stimuli in the expected condition to examine harmonic expectancy violations (e.g., Bigand & Pineau, 1997; Koelsch, Gunter, Friederici, & Schröger, 2000), but generally ignore many of the other parameters associated with the vast compendium of cadence types in tonal music (e.g., a falling melody, a trill above the cadential dominant, the metric position of the final melodic and harmonic events, etc.).
In the expectancy literature, experimental studies using harmonic cadential materials and both explicit and implicit methods have demonstrated that the tonic and dominant scale-degrees receive the highest ratings and the largest within-key priming effects, followed next by the other diatonic members of the scale, and finally by the non-diatonic members (e.g., Krumhansl & Kessler, 1982). Similarly, harmonic expectancy studies generally support a hierarchy of stability (I > V > IV; Bharucha & Krumhansl, 1983; Tillmann, Janata, Birk, & Bharucha, 2008), with more stable chords serving as cognitive reference points, an expression coined by Rosch (1978) for elements that are characterized by their asymmetric temporal relations with less stable elements. To date, further support for increasingly subtle within-key expectancy violations has been found for I vs. V (Tillmann et al., 2003, 2008; Tillmann & Marmel, 2013), and I vs. vi in harmonic contexts (Kim, Kim, & Chung, 2011; Koelsch, Jentschke, Sammler, & Mietchen, 2007), and 1ˆ vs. 4ˆ in melodic contexts (Marmel, Tillmann, & Delbé, 2010).
To generalize these findings to cadences from the extant literature, Sears, Pearce, Spitzer, Caplin, and McAdams (2019) examined expectancy violations for passages from Mozart’s keyboard sonatas that terminated with cadences from one of the following five categories in contemporary tonal cadence typologies (e.g., Caplin, 1998, 2004; Schmalfeldt, 1992): perfect authentic cadence (PAC), imperfect authentic cadence (IAC), half cadence (HC), deceptive cadence (DC), and evaded cadence (EV). Shown in Figure 1, the PAC category features a chord progression from a root-position dominant to a root-position tonic (i.e., a V–I progression with the root scale degree in the lowest voice in each chord), as well as the arrival of the melody on 1ˆ. The PAC category serves as the quintessential closing pattern for musical repertories spanning much of the history of Western music (Margulis, 2005; Sears, 2016). The IAC category is a melodic variant of the PAC category that replaces 1ˆ with 3ˆ in the melody but retains the V–I harmonic progression. These two categories constitute authentic cadences and appear at the top of the harmonic hierarchy (Krumhansl & Kessler, 1982). The HC category concludes with dominant harmony in root position and may support any chord member in the melody (i.e., a V chord with 2ˆ, 5ˆ, or 7ˆ in the melody). Thus, unlike the PAC and IAC categories, the HC category concludes with the less stable dominant chord, and so appears below cadences for which tonic is the expected goal and, presumably, elicits weaker expectations in anticipation of its occurrence (Tillmann et al., 2008). Finally, the remaining two categories represent cadential deviations of the authentic cadence, which is to say that they initially promise an authentic cadence, yet fundamentally deviate from the pattern’s terminal events. The DC category leaves the pattern somewhat open by closing with a nontonic harmony, usually vi, while the melodic line resolves to a stable scale degree, such as 1ˆ or 3ˆ. Finally, the EV category is characterized by a sudden interruption in the harmonic and melodic events of the pattern: instead of resolving to 1ˆ, the melody often leaps up to another scale degree, such as 5ˆ, and the final harmony may be replaced by an unexpected, nontonic chord (for further details, see Sears, 2016).
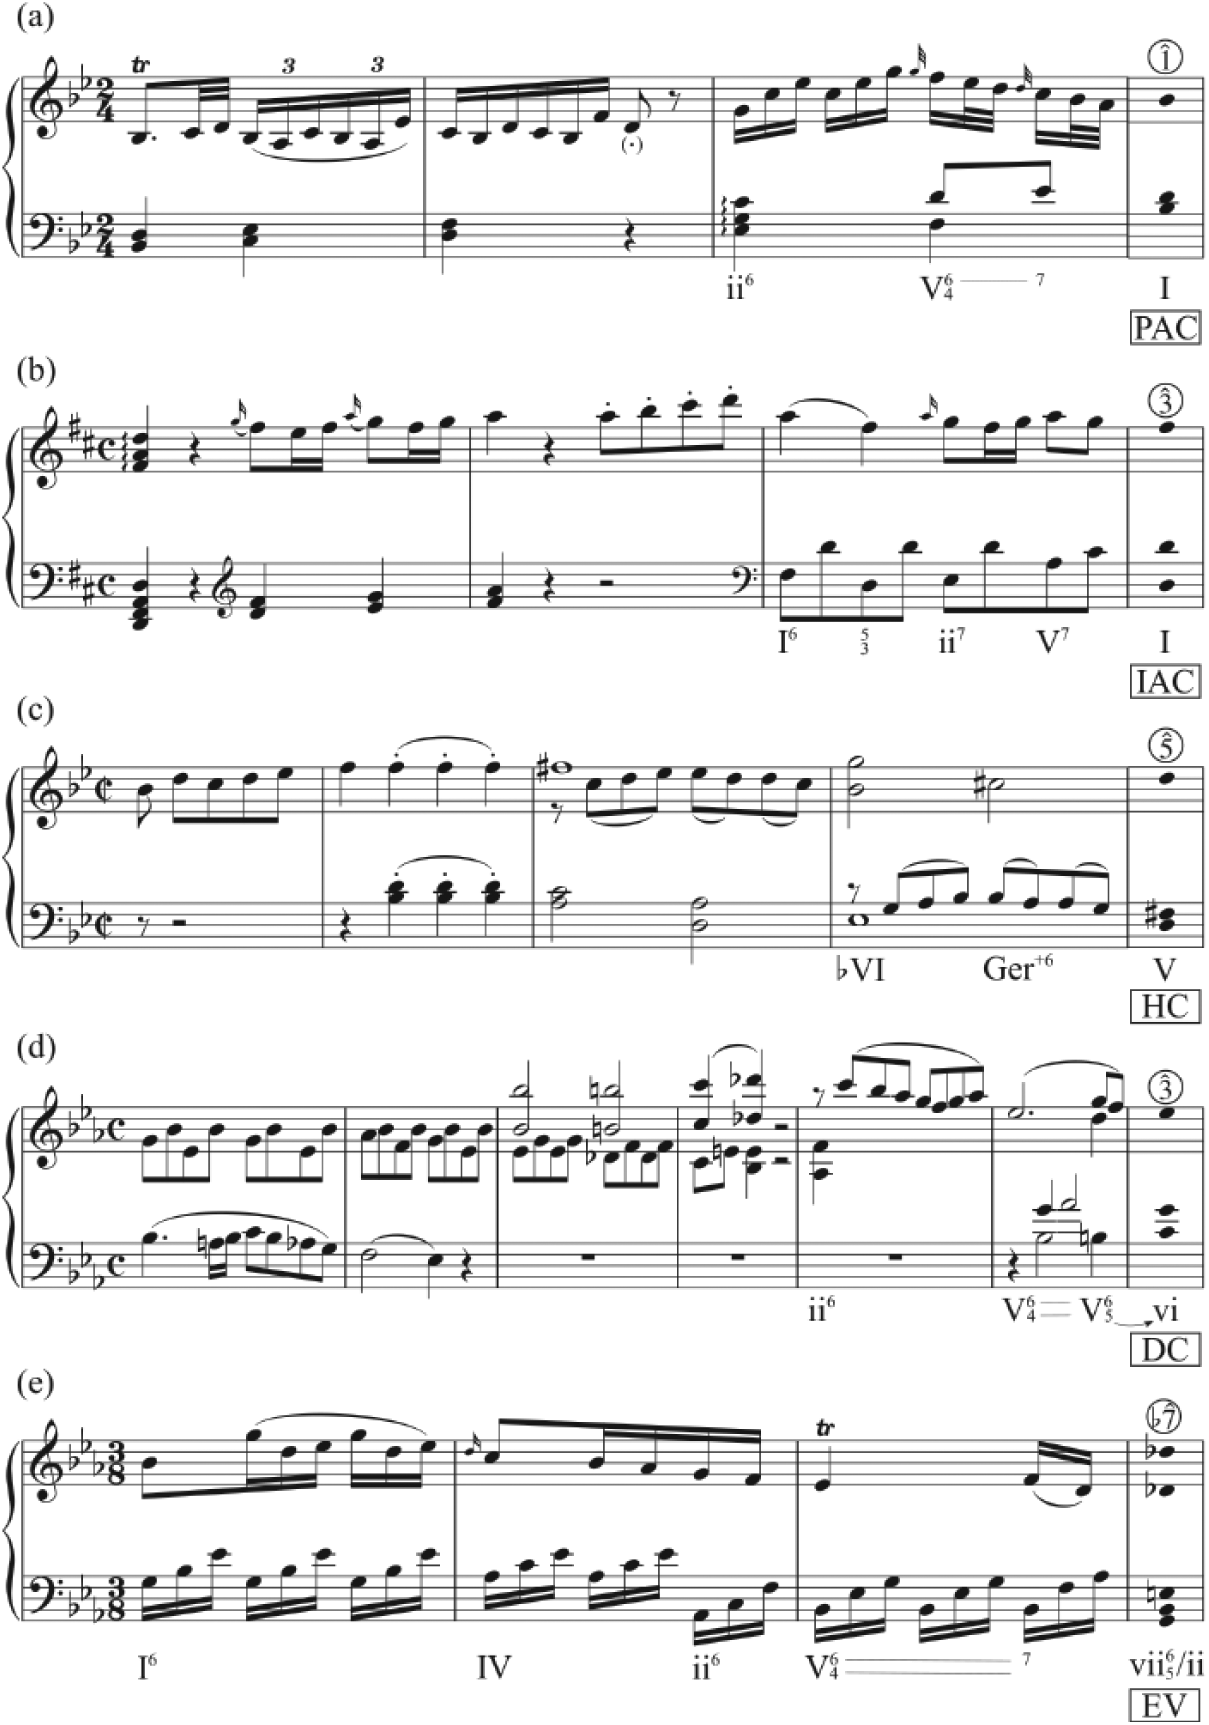
Five stimuli representing the five cadence categories. The target melodic tone and chord appear in the final measure. Circled numbers with caret symbols indicate each terminal scale-degree. Roman numeral annotations for the cadential harmonic progression appear below each staff. (a) PAC category: K. 281 (Köchel index), i (movement), mm. 5–8 (measures); (b) IAC category: K. 311, i, mm. 1–4; (c) HC category: K. 333, iii, mm. 60–64. (d) DC category: K. 457, i, mm. 42–48; (e) EV Category: K. 281, ii, mm. 96–99.
Using both explicit and implicit tasks, Sears et al. (2019) found that cadences terminating with stable tones and chords—the PAC and IAC categories—elicited the highest goodness-of-fit ratings and fastest and most accurate responses. What is more, model simulations for the observed priming effects supported a cognitive interpretation of tonal processing, in which listeners with exposure to tonal music generate expectations as a consequence of the frequent (co-)occurrence of events on the musical surface (see also Sears, Pearce, Caplin, & McAdams, 2018). Nevertheless, their study did not directly examine the formation of expectancies over time for the terminal events from these categories. Thus, this article presents the findings from a follow-up study that directly compares the formation of expectations for tonic and dominant harmony in real time using a continuous-rating paradigm. Recent examples of continuous expectancy tasks include continuous predictability judgments made during melodies (Eerola & Krumhansl, 2002), and continuous judgments of how well the musical context fit with a continuously sounding probe tone (Toiviainen & Krumhansl, 2003). In this study, however, participants continuously rate the strength of their expectations that the end of a musical excerpt is imminent.
Method
Participants
Participants were 40 members (20 female) of the Montreal community recruited through the Schulich School of Music and the McGill University classified ads. Ages ranged from 18 to 46 years (M = 24, SD = 6). Twenty participants with musical training equivalent or superior to second-year-university level formed the musician group, and twenty participants with less than one year of musical training comprised the “nonmusician” group. 1 To limit any effects caused by familiarity with the stimuli, no participant with more than two years of formal study on the piano was permitted to take part. All participants provided informed consent, and the study was certified for ethical compliance by the McGill University Research Ethics Board.
A questionnaire was administered to assess musical preferences and training. Musicians and nonmusicians reported listening to an average of 21 and 16 hours of music each week, respectively, and all but two participants self-identified as music lovers. The musicians practiced their primary instrument for an average of 20 hours each week, and had been playing their primary instrument for an average of 6 years. Musicians also averaged 5 years of ear training, 3 years of instruction in harmony, and 3 years of instruction in music analysis. All of the participants reported normal hearing, which was confirmed with a standard audiogram administered before the experiment (ISO 389-8, 2004; Martin & Champlin, 2000), and five musicians reported the ability to identify pitches absolutely.
Materials
The stimuli consisted of 40 excerpts selected from Mozart’s keyboard sonatas containing an equal number for each cadence category (8 each), and with an average duration of 11 s (SD = 2 s). Following the experimental design employed in Sears et al. (2014) and Sears et al. (2019), performance features (such as dynamics and rubato) were neutralized and the tempo of each stimulus was determined by convention. To ensure that unwanted differences concerning the terminal melodic and harmonic events would not affect expectancy ratings while preserving the stylistic integrity of each excerpt, the durations of the target melodic tone and chord were recomposed to 900 ms and any melodic dissonances were removed. These steps ensured an optimal balance between ecological validity on the one hand and stimulus control on the other (Sears, 2015). Each stimulus was first created with the notation software Sibelius (Avid Technologies, Burlington, MA) and then realized as a .wav sound file at a sampling rate of 44.1 kHz and 16-bit amplitude resolution using a piano physical model created by PianoTeq (Modartt S.A.S., Ramonville Saint Agne).
Design and procedure
Participants were presented with a randomized set of the stimuli and asked to continuously rate the strength of their expectation that the end of the excerpt was imminent on a one-dimensional analog scale. The term “imminent” was defined as “within the next one to two seconds,” and the left and right limits of the scale were labeled with “very weak” and “very strong,” respectively. Following the onset of the final chord, participants were told to move the slider back to the left limit of the scale as quickly as possible to indicate that the excerpt had ended.
The slider was connected to an Arduino-based USB interface (Arduino, Torino, Italy) that recorded the slider values on a continuous scale from 1 to 7 at a sampling rate of 100 Hz. The computer interface provided instructions on the screen and allowed the participant to advance through the trials by clicking the mouse on a button on-screen. At the beginning of each trial, the slider was set to the left limit of the scale, and participants were encouraged not to begin moving the slider until they started to expect that the end of the passage was imminent. To familiarize the participants with the experimental task, the session began with a practice phase consisting of five additional excerpts. Because the participants completed this experiment with the experiment reported in Sears et al. (2019) in the same session, the order of presentation for the two experiments was counterbalanced across participants. A main effect of order was not observed for either experiment.
Analysis
The continuous slider data were processed in MATLAB (The Mathworks, Inc., Natick, MA). To remove extraneous information and ensure a smooth time series in each trial, the data were low-pass filtered with a cutoff frequency of 4 Hz using a linear phase filter, which was based on the convolution of a first-order Butterworth filter impulse response that was also convolved with itself in time reverse to avoid phase shifting. To obtain a measure of the rate of change in the slider ratings (also referred to as rating velocity), each time series was first downsampled to 2 Hz using cubic spline interpolation, and first-order derivatives were then calculated from the resulting time series.
Data were analyzed with a linear (or generalized linear) mixed effects model (LMM or GLMM) approach (West, Welch, & Galecki, 2007), which controls for random sources of variance without the loss of statistical power resulting from data aggregation across subjects or stimuli (e.g., RM-ANOVA). Mixed effects models have become increasingly common because they can accommodate both continuous (Baayen, Davidson, & Bates, 2008; Baayen & Milin, 2010) and binary response data (Dixon, 2008), which regularly violate assumptions of normality and homogeneity of variance in repeated-measures designs (Dixon, 2008; Jaeger, 2008), and often lead to unbalanced datasets, as was the case here.
To examine how the slider ratings varied over time, means were calculated for 1 s epochs centered from 4 s before the onset of the cadential arrival to 0 s. LMMs of the untransformed and velocity-transformed ratings therefore included fixed factors of cadence category (5 levels), musical training (2 levels), and time (5 levels). We also included crossed random effects for participants and items (musical excerpts). All mixed-effects analyses were conducted with the software R (2.15) using the packages lme4 (Bates, Maechler, & Bolker, 2011) and languageR (Baayen, 2012). Following Barr, Levy, Scheepers, and Tily (2013), all models included a full random effects structure as specified by the design of the experiment, with intercepts for each participant and by-participant slopes for the within-subject fixed factors of cadence category (PAC, IAC, HC, DC, EV) and time (−4 s, −3 s, −2 s, −1 s, 0 s), and with intercepts for each musical stimulus and by-stimulus slopes for the between-subjects factor of musical training (musicians, nonmusicians).
To calculate omnibus tests and parameter estimates, models were fit using sum coding for the predictor variables so that levels of the fixed effects would represent deviations from the grand mean, as is the approach in traditional ANOVA pedagogy (Barr et al., 2013). Tests of main effects and interactions were calculated using the Anova function from the car package (Fox & Weisberg, 2011). 2 To examine more specific hypotheses about the potential differences between cadence categories or training groups, we also included planned comparisons using the lsmeans package (Lenth, 2014), corrected with Bonferroni adjustment.
Results
Cadence categories
For 178 of the 1600 trials (11%), participants either did not position the slider to the left limit of the expectancy scale when the trial began (2 trials), failed to move the slider throughout the trial (44 trials), or failed to move the slider until after the onset of the target melodic tone and chord of the excerpt (132 trials). McAdams, Vines, Vieillard, Smith, and Reynolds (2004) elected to exclude trials for these reasons, but it might be the case that the fixed factors included in this study (cadence category and musical training) influenced whether participants elected to move the slider at all. To examine this hypothesis, we analyzed the proportion of trials for which participants did not move the slider before the target events of the excerpt with a mixed effects logistic regression model (GLMM) using the glmer function. There was no effect of cadence category, χ2(4) = 2.09, p > .05, or musical training, χ2(1) = .04, p > .05, nor was there a significant interaction between the two factors, χ2(4) = 8.14, p > .05. As a result, we have excluded these trials in the analyses that follow.
To visualize the slider ratings for each cadence category, the grand mean time course for the untransformed and velocity-transformed slider ratings was calculated for musicians and nonmusicians using a time window from 5 s preceding to 3 s following the onset of the target melodic tone and chord. Shown in Figures 2 and 3, the dashed/dotted lines indicate the 95% confidence bounds around the grand mean time course for both training groups, with the bounds around the musician ratings shaded (in blue online). Table 1 presents the omnibus tests calculated from the LMMs of the untransformed and velocity-transformed slider ratings calculated for 1 s epochs centered from 4 s before the onset of the cadential arrival to 0 s.
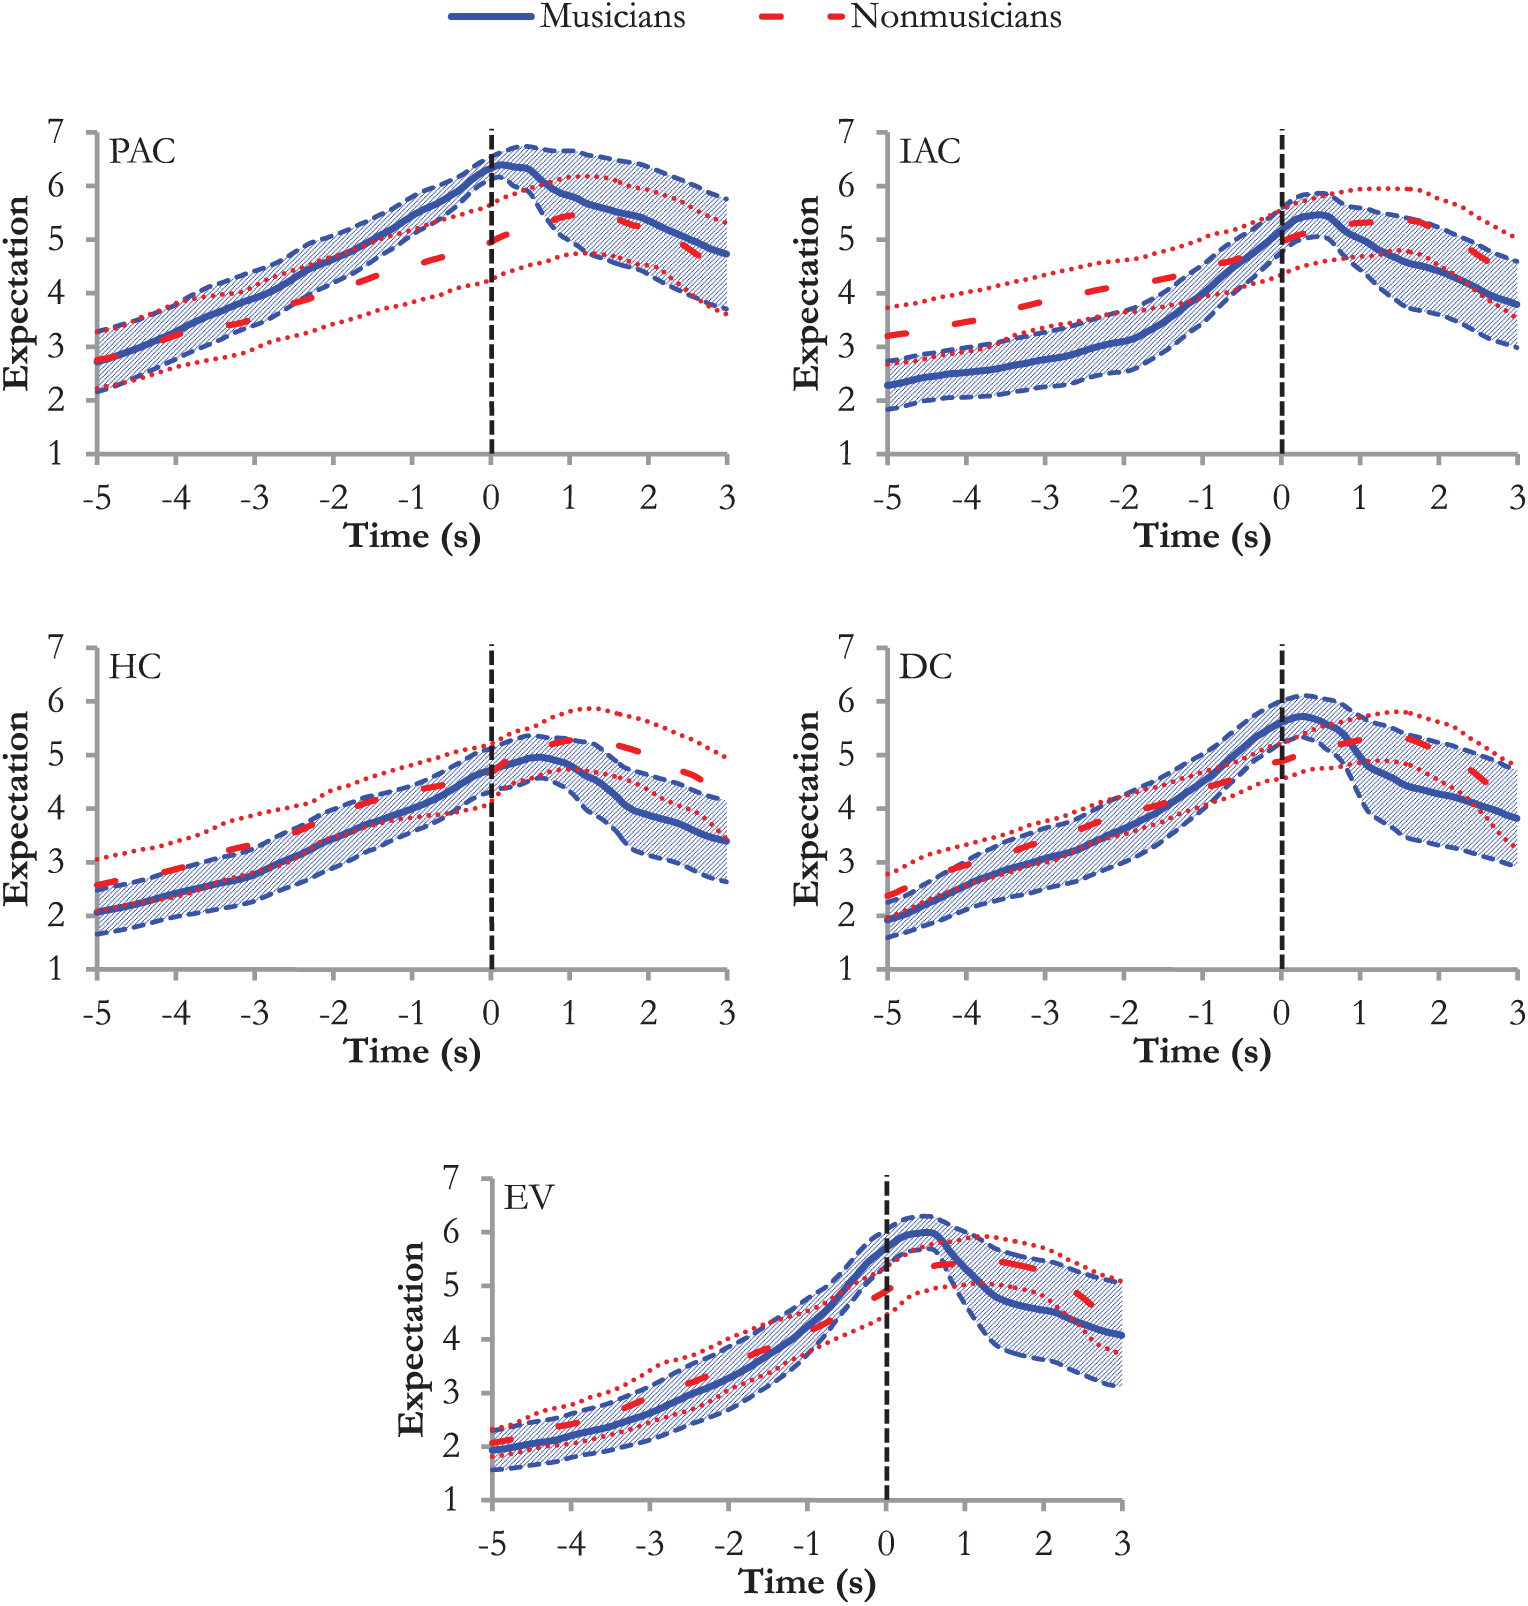
Grand mean time course for the slider ratings of musicians (solid line, in blue online) and nonmusicians in (wide-spaced dashed, in red online) for each cadential category. Equidistant dashed (blue)/dotted (red) lines either side of these indicate 95% confidence bounds around the mean ratings, with the confidence bounds around the musician ratings shaded (in blue online). The vertical dotted line indicates the onset of the target melodic tone and chord. The LMMs of these ratings were calculated for 1 s epochs centered from 4 s before the onset of the cadential arrival to 0 s.

Grand mean time course for the first derivative of the slider ratings of musicians (solid line, in blue online) and nonmusicians in (wide-spaced dashed, in red online) for each cadential category. Equidistant dashed (blue)/dotted (red) lines either side of these indicate 95% confidence bounds around the mean ratings, with the confidence bounds around the musician ratings shaded (in blue online). The vertical dotted line indicates the onset of the target melodic tone and chord. The LMMs of these ratings were calculated for 1 s epochs centered from 4 s before the onset of the cadential arrival to 0 s.
Analysis of deviance table for maximal linear mixed effects models predicting slider ratings and first-order derivatives of the slider ratings with cadence category, time, and training.
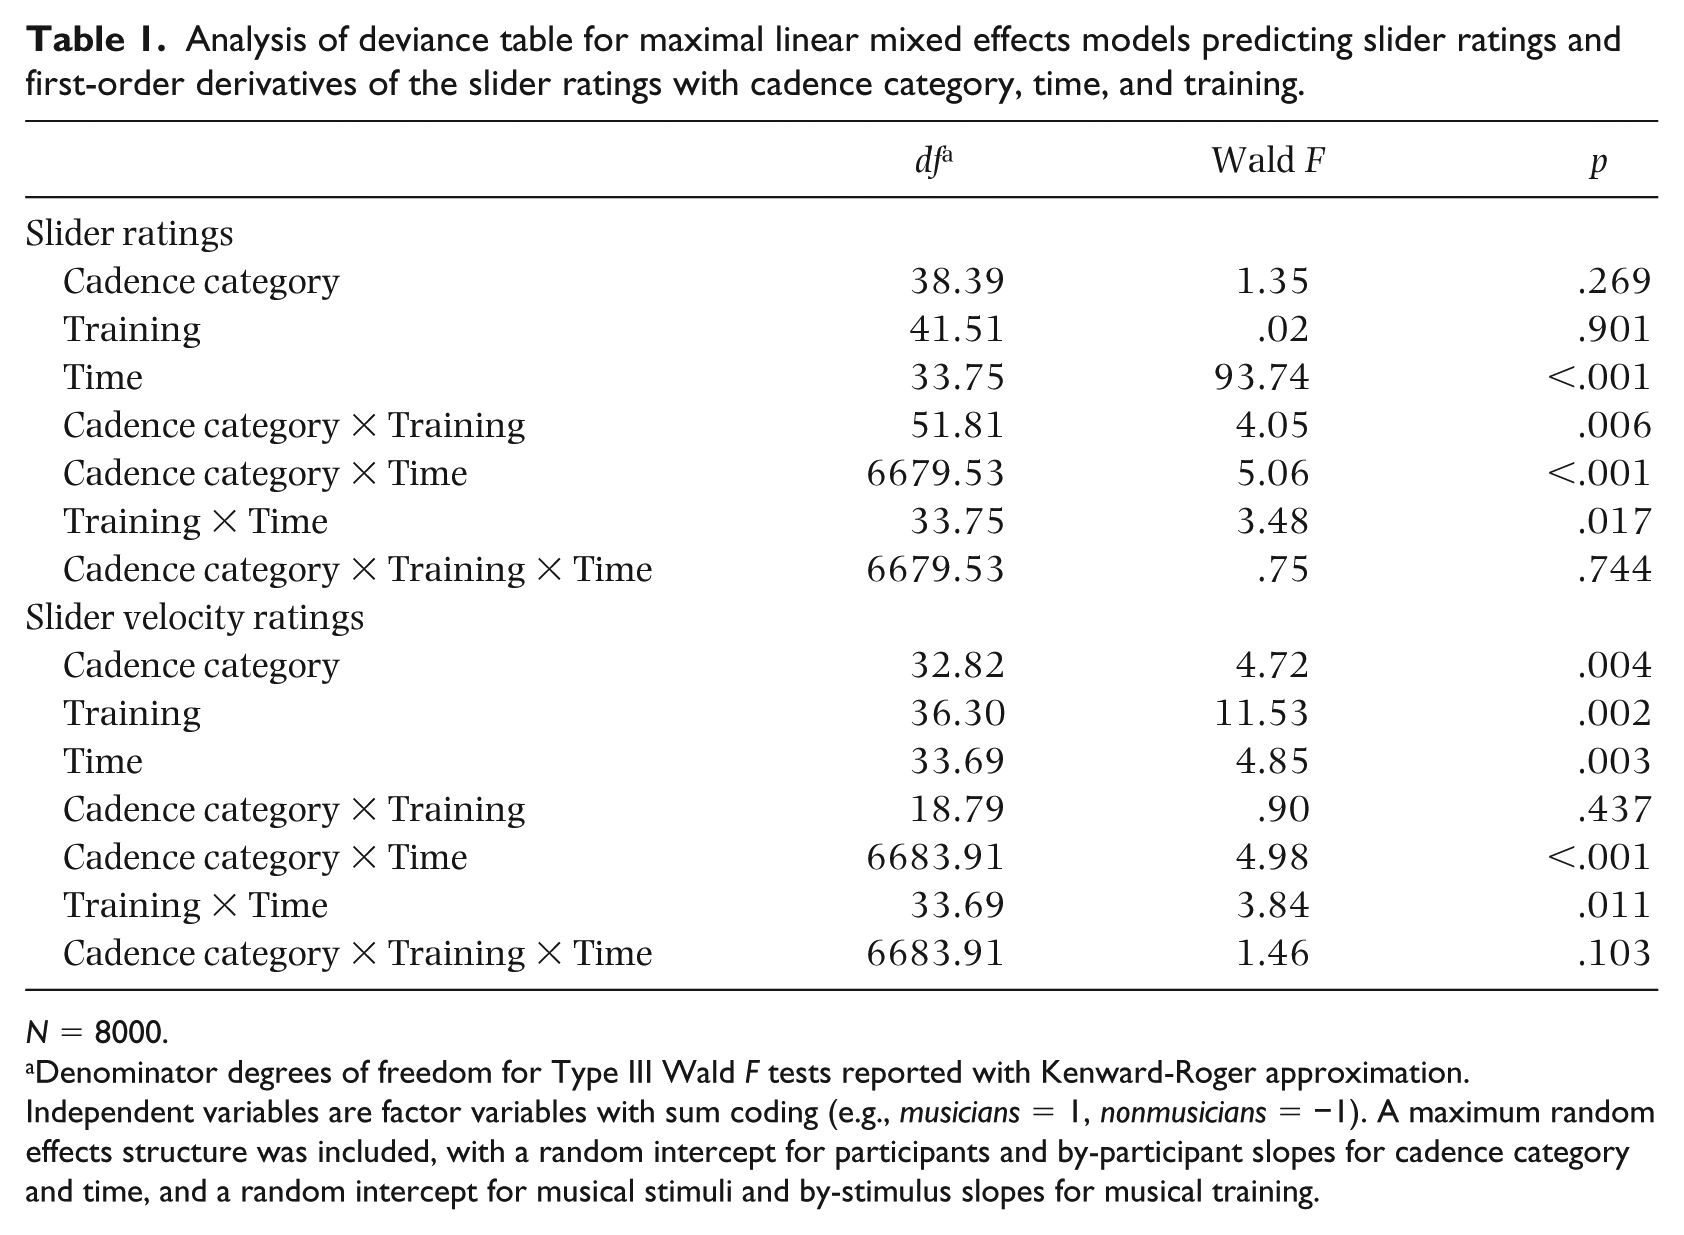
N = 8000.
Denominator degrees of freedom for Type III Wald F tests reported with Kenward-Roger approximation.
Independent variables are factor variables with sum coding (e.g., musicians = 1, nonmusicians = −1). A maximum random effects structure was included, with a random intercept for participants and by-participant slopes for cadence category and time, and a random intercept for musical stimuli and by-stimulus slopes for musical training.
Beginning with the untransformed slider ratings in Figure 2, Type III Wald F tests reported with Kenward-Roger approximation revealed a significant effect of time, F(4, 33.75) = 93.74, p < .001, with the mean time course increasing until the target melodic tone and chord for every cadence category and for both training groups. Overall, the PAC category received the highest ratings overall from both groups F(16, 6679.53) = 5.06, p < .001, although musicians provided significantly higher ratings than nonmusicians, F(4, 51.81) = 4.05, p = .006. The interaction between training and time was also significant, F(4, 33.75) = 3.48, p = .017, with nonmusicians starting at a lower point on the expectancy scale than musicians and increasing linearly (rather than exponentially) until the target events of the cadence. As a consequence, musicians’ mean ratings reached a higher point on the scale at the target events.
To verify the differences in these trends, we included polynomial contrasts of the ratings over time for each cadence category and for both training groups (i.e., 10 contrasts corrected with Bonferroni adjustment). The ratings for the PAC category demonstrated significant linear increasing trends across time for the ratings of both musicians, B = 7.37, t = 14.28, p < .001, and nonmusicians, B = 4.73, t = 8.72, p < .001. For the remaining categories for which the tonic was the goal harmony, musicians also demonstrated an exponential increasing trend across time (IAC, B = 2.25, t = 4.92, p < .001; DC, B = 1.30, t = 2.91, p = .040; EV, B = 2.21, t = 5.00, p < .001), with a relatively slower and more gradual rate of increase between a period of roughly 5 s and 2 s preceding a sudden and more steep increase in ratings within the final 2 s. This exponential increase suggests that musicians were less aware of the impending cadential arrival for the IAC, DC, and EV categories compared with the PAC category until approximately 2 s before the target, which is perhaps when the cadential dominant first appeared.
Shown in Figure 3, the velocity-transformed slider ratings capture this exponential rate of increase for the IAC, DC, and EV categories, and particularly for the IAC category, where a sharp increase in average velocity appears within the final 2 s before cadential arrival. The ratings of the nonmusician group did not demonstrate this exponential rate of increase, however, nor did their ratings differ significantly for any of the cadence categories in general; both the starting slider position and the rate of increase over time were nearly identical for every category.
Slider maxima
For the HC category, visual inspection of the musician time course in Figure 2 suggests that half cadences elicited the lowest peak ratings relative to the other cadence categories. Because participants were tasked with moving the slider to the bottom of the scale as quickly as possible following the terminal events of the cadence, the position and time index of the maximum rating represent the crucial moment in which the participants’ expectations are highest. Thus, if half cadences elicit significantly weaker expectations for the target melodic tone and chord compared with the other categories, participants should reach a lower peak on the expectancy scale at a later point in time.
In some trials across the experimental session, the peak rating appeared before the target events, suggesting that participants anticipated the end of the excerpt and so reached a plateau in their ratings. In other trials, the peak rating appeared after the target events, indicating that participants did not anticipate the impending end. To determine the average position and time index of the maximum slider rating in each trial, we calculated the maximum rating for a 4 s window surrounding the onset of the target melodic and harmonic events. Trials were excluded if the slider ratings did not reach a maximum during this window, resulting in a dataset of 1114 trials. Figure 4(a) presents the estimated mean rating of the slider maxima, and Figure 4(b) presents the estimated time indices for those maxima, with the horizontal dotted line indicating the onset of the target events. Thus, for the PAC category, musicians reached the slider maximum 300 ms before the target on average.
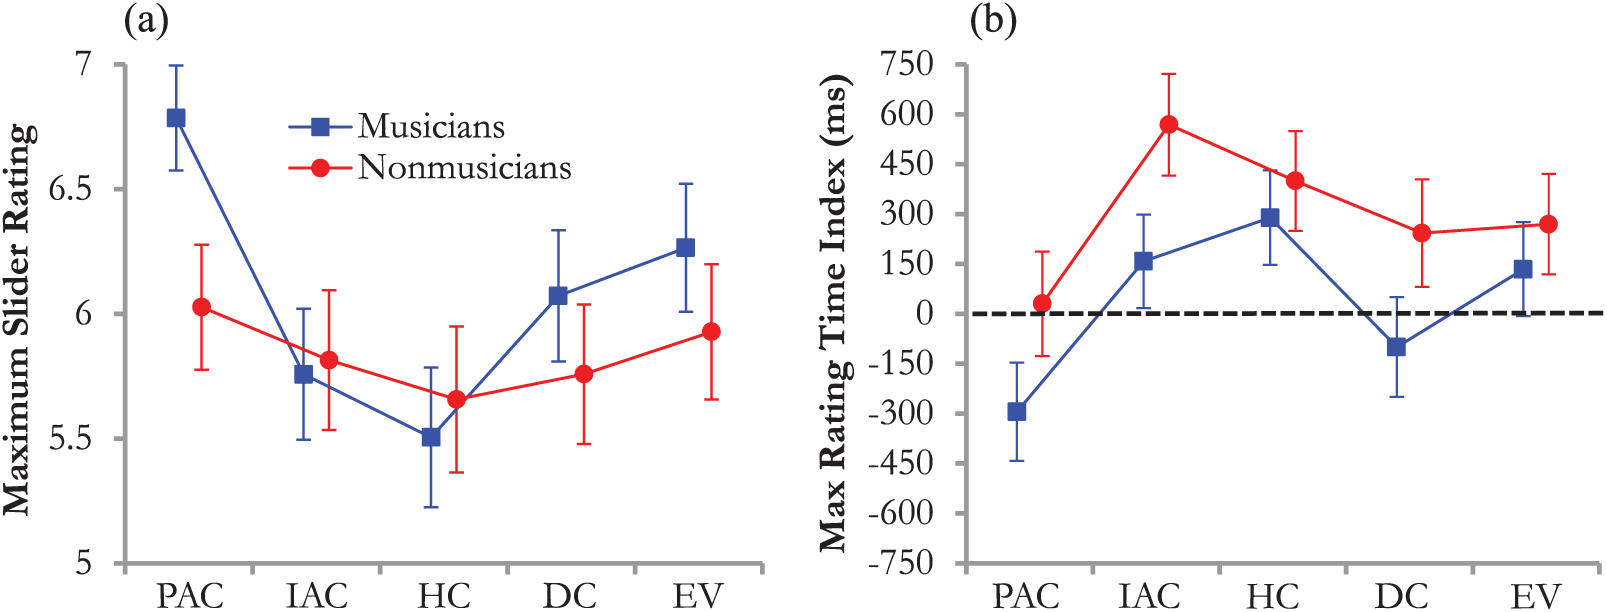
(a) Line plot of the estimated means of the slider rating maxima that occurred within a 4 s window surrounding the onset of the cadential arrival for musicians and nonmusicians for each cadence category (N = 1114). (b) Line plot of the estimated means of the time indices for the maximum slider ratings. The horizontal dotted line indicates the onset of the cadential arrival. Whiskers represent ± 1 standard error.
Type III Wald F tests of the fixed effects from the 5×2 LMM of the slider maxima revealed a significant effect of cadence category, F(4, 38.11) = 2.64, p = .049, and a significant interaction, F(4, 28.74) = 4.16, p =.009, but there was no main effect of training. As expected, the half cadence category received the lowest maximum rating on average, and polynomial contrasts revealed a quadratic trend in the ratings of musicians, B = 3.26, t = 4.28, p < .001, thereby replicating the U-shaped curves found in previous studies (Sears et al., 2019). Although the same U-shaped trend emerged in the ratings of the nonmusician group, the polynomial contrast was not significant.
Type III Wald F tests from the LMM of the time indices of the slider maxima revealed a significant effect of cadence category, F(4, 36.90) = 2.68, p = .047, with both groups reaching the slider maximum the most quickly for the PAC category, M = −130 ms, standard error (SE) = 130 ms. Musicians also reached the slider maximum more quickly than nonmusicians on average, F(1, 42.32) = 7.00, p = .011. The PAC category provided the only estimated mean time index in which musicians anticipated the cadential arrival, M = −290 ms, SE = 150 ms, which suggests that perfect authentic cadences elicited the strongest and most specific expectations for the terminal melodic and harmonic events. As predicted, participants from both groups reached the slider maximum for the HC category latest on average, M = 340 ms, SE = 130 ms, and a polynomial contrast revealed a significant quadratic trend across the cadence categories, B = –.96, t = −2.12, p = .041. Taken together, the estimated ratings and time indices for the slider maxima therefore suggest that the PAC and HC categories generated the strongest and weakest expectations, respectively, with the remaining cadence categories falling somewhere in the middle.
Cadential features
The preceding analyses identified significant differences between the cadence categories selected for this study. Slider ratings for the PAC category, for example, demonstrated an increasing linear trend up to the target events of the cadence, whereas slider ratings for the IAC, DC, and EV categories—categories for which tonic harmony is also the expected goal—exhibited a slower rate of increase from 5 s to 2 s, and then a much greater (exponential) rate of increase in the final 2 s. Any number of features may have contributed to this difference, such as the temporal duration of the cadential progression, the presence of a cadential trill in the melody, or a cadential six-four harmony. Thus, the following analysis considers the potential impact of eight cadential features on the average position and time index of the maximum slider ratings using a mixed effects regression model.
Following Sears et al. (2014), eight features were selected that characterize (1) the entire stimulus; or (2) the cadential formula (see Table 2):
(1) Four features characterize the entire stimulus: the tempo in beats per minute (Tempo), the total number of notes per second (Event Density), the median pitch height in MIDI note values (Median Pitch Height), and the duration of the stimulus in seconds (Stimulus Duration).
(2) Three dichotomous features and one continuous feature characterize the cadential formula: the presence of every harmonic function within the boundaries of the cadential progression (Complete), the presence of a cadential six-four harmony (Cadential Six-Four), a trill above the cadential dominant (Cadential Trill), and the duration of the cadential progression in seconds (Cadential Progression Duration).
Descriptive statistics for the eight cadential features.

Tempo refers to the number of quarter-note beats per minute.
Event Density refers to the number of note events per second.
Complete refers to an authentic cadential progression that includes an initial tonic, a pre-dominant, a dominant, and a final tonic, or to a half cadential progression that includes an initial tonic, a pre-dominant, and a dominant.
To examine the relationships between these predictors for each stimulus, correlations were calculated for each of the cadential features, along with the ratings from both groups. Shown in Table 3, intercorrelations between the cadential features displayed few notable results; of the 28 correlations between the eight cadential features, only three were significant. What is more, correlations with the mean time index for each excerpt indicated that musicians reached the maximum rating at a later point in time if the excerpt was shorter in duration or did not include a cadential trill or a cadential six-four. Similarly, nonmusicians reached the maximum slider rating at a later point in time if the excerpt was shorter in duration or featured fewer notes per second. The average position of the maximum slider ratings further demonstrated that musicians produced significantly higher ratings for excerpts featuring dense textures, longer temporal durations, a cadential six-four, or longer cadential progressions. Finally, the average position of the maximum slider ratings for the nonmusician group increased for excerpts consisting of dense textures or a cadential six-four.
Intercorrelations between cadential features and mean positions and time indices of slider maxima of musicians and nonmusicians.
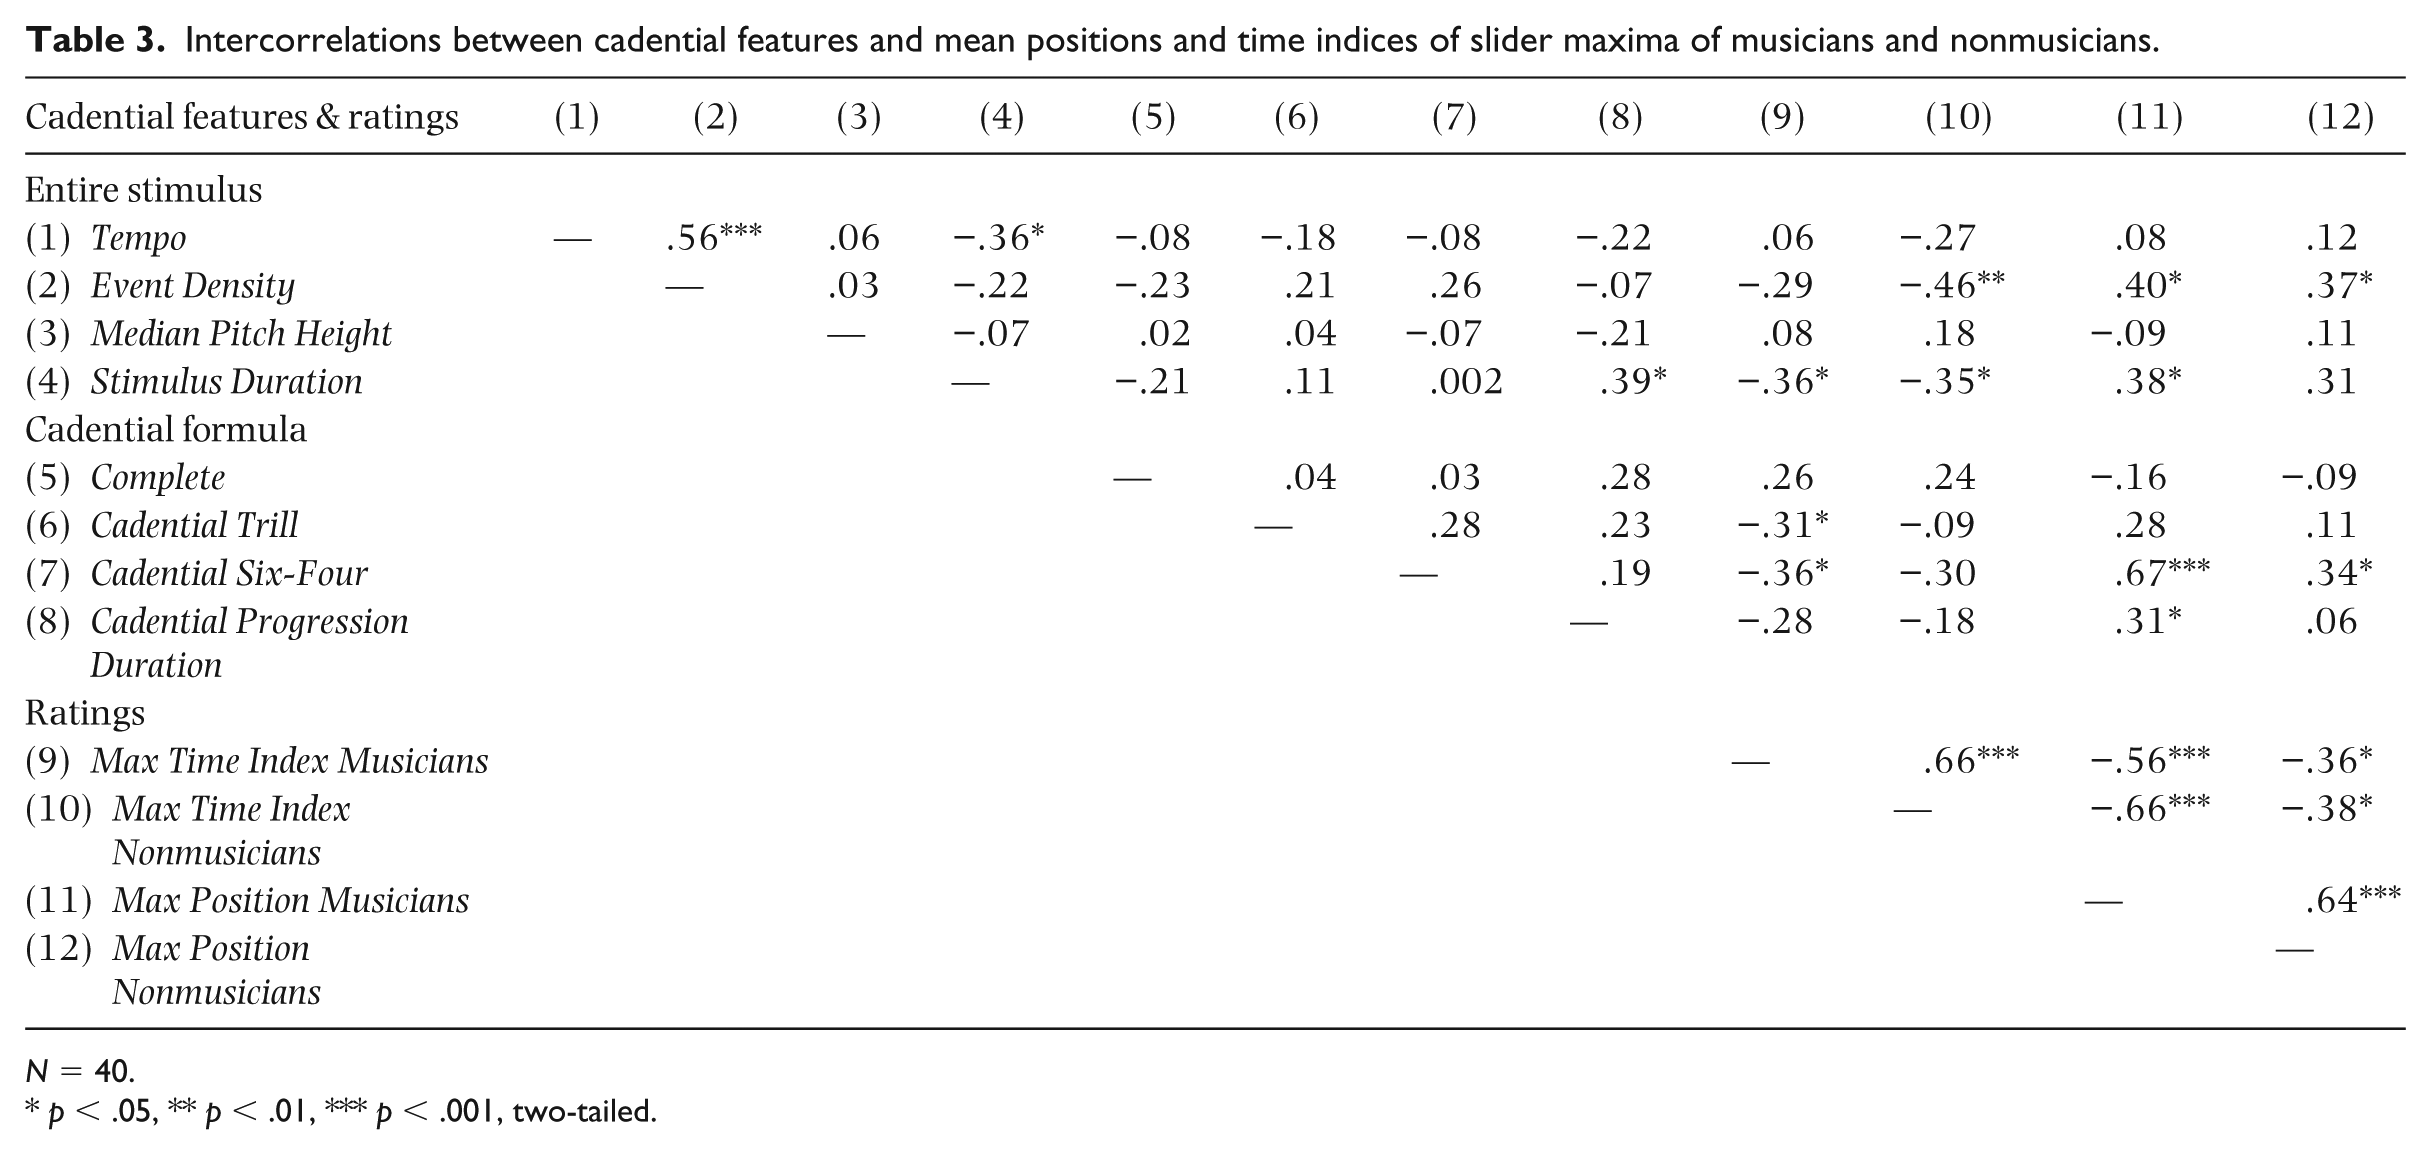
N = 40.
p < .05, ** p < .01, *** p < .001, two-tailed.
Given the weak multicollinearity displayed by the cadential features in Table 2, a mixed effects regression model was fitted for the positions and time indices of the maximum slider ratings for both musicians and nonmusicians. LMMs for all dependent variables included fixed factors for the eight cadential features and crossed random effects for participants and items (musical excerpts). Models were fit using backwards stepwise selection with the package lmerTest (Kuznetsova, Brockhoff, & Christensen, 2017), which retained the full random effects structure but incrementally eliminated cadential features (i.e., fixed effects) that did not significantly improve model fit. Finally, unstandardized parameter estimates were calculated using the package lme4 (Bates et al., 2011), and standardized beta coefficients (β) and estimates of model fit (R2) were calculated using the package sjstats (Lüdecke, 2018).
Shown in Table 4, LMMs of the time index of the maximum slider ratings included the same cadential features for both musicians and nonmusicians: Stimulus Duration and Event Density. Both models also produced similar coefficients for the fixed effects, suggesting that the temporal duration and event density of each excerpt played a similar role for both training groups. What is more, LMMs of the position of the maximum slider ratings included the same cadential features, but in this case also included Cadential Six-Four. This factor played a much greater role in the musician LMM, however, with a β of .27 for the musician group, compared with just .12 for the nonmusician group. Thus, musicians may have relied to a greater extent on the presence of a cadential six-four harmony when determining whether the end of the excerpt was imminent.
Summary of stepwise mixed effects regression analysis predicting positions and time indices of slider maxima with the cadential features from Table 2.
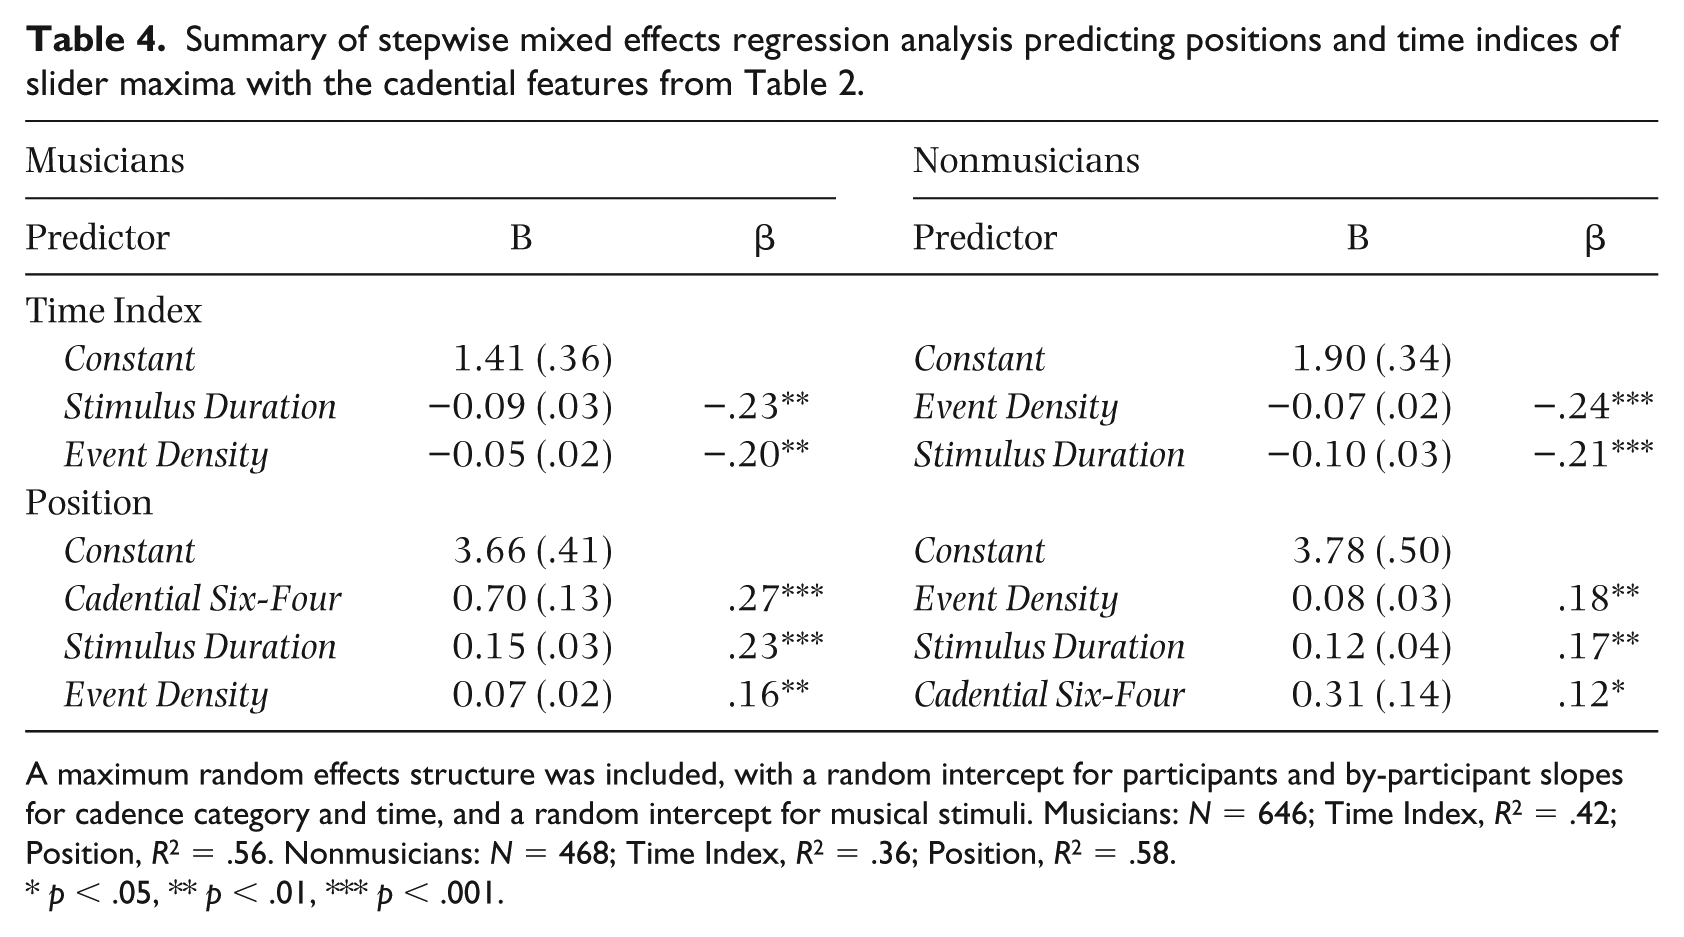
A maximum random effects structure was included, with a random intercept for participants and by-participant slopes for cadence category and time, and a random intercept for musical stimuli. Musicians: N = 646; Time Index, R2 = .42; Position, R2 = .56. Nonmusicians: N = 468; Time Index, R2 = .36; Position, R2 = .58.
p < .05, ** p < .01, *** p < .001.
Discussion
Expectations for closure increased over the course of each excerpt and then peaked at or near the target melodic tone and chord. For musicians, slider ratings demonstrated an increasing linear trend over time up to the target events for the PAC category. For the remaining cadence categories for which tonic harmony was the expected goal (IAC, DC, EV), however, expectations for closure increased exponentially over time, suggesting that musicians were less aware of the impending terminal melodic and harmonic events for these categories compared with the PAC category. This finding indicates that the PAC category features parameters within the cadential pattern—such as a cadential six-four harmony—that may have alerted the musician group to the impending terminal melodic and harmonic events far sooner relative to the other categories, resulting in a higher starting position and a generally linear (as opposed to exponential) increasing trend for the musician time course.
Closer inspection of the average ratings and time indices for the slider maxima from the musician group revealed the same U-shaped pattern observed in a previous study (Sears et al., 2019), with excerpts from the PAC and HC categories receiving the highest/earliest and lowest/latest maximum ratings, respectively. This finding provides converging evidence that half cadences elicit weaker expectations in prospect than the cadence categories for which tonic harmony serves as the expected cadential goal. The regression analysis also generally supported this view, with participants providing the highest/earliest ratings for excerpts featuring longer temporal durations, denser textures, and a cadential six-four harmony, all of which are more likely to occur in categories for which tonic harmony is the expected goal, and in the PAC category particularly. Indeed, according to Schmalfeldt (1992), the cadential six-four is the pre-eminent sign-post for cadential closure in music of the common-practice period.
For nonmusicians, the slider ratings did not differ for any of the cadence categories; the starting slider position and the rate of increase over time were nearly identical for every category, suggesting either that nonmusicians were simply unaffected by differences in the selected cadence categories—a hypothesis that seems unlikely given the pronounced differences observed in previous studies for these categories (Sears et al., 2014)—or that the task itself was too demanding for the nonmusician group. To be sure, the attentional and vigilance demands placed on participants in continuous ratings tasks may interfere with explicit processes related to the formation of expectations during music listening (McAdams et al., 2004; Schubert, 1999). Perhaps worse, these tasks may fail to tap into the largely unconscious, automatic expectancies resulting from implicit processes during auditory perception (Bigand, 2003).
To measure these sorts of expectancies for the events at cadential arrival, Sears et al. (2019) adopted a priming paradigm and used a competing secondary task to orient the participants’ attention to other features of the stimulus. Participants indicated as quickly as possible whether the target melodic tone and chord were in or out of tune, where out-of-tune foil trials were tuned 40 cents sharp relative to the preceding context. They found that the terminal events from the expected cadence categories elicited the fastest and most accurate responses for both musicians and nonmusicians, indicating that listeners with exposure to tonal music form long-term schematic representations for the most frequent events on the musical surface. Given the degree to which the musician/nonmusician dichotomy often fails to demonstrate significant differences in implicit tasks, future tonal priming studies might therefore consider alternative methods for assessing musicality in the general population (Müllensiefen, Gingras, Musil, & Stewart, 2014), which may allow researchers to disentangle effects of explicit training and implicit exposure on the formation of tonal expectancies.
Perhaps more importantly, these excerpts represent a stylistically narrow repertoire, so the findings observed here—and the characteristics that define expectations for closure—may be idiomatic to this genre and style period. Whether listeners internalize the conventional closing patterns from this or any other style period is thus an open question, so future studies should attempt to generalize these findings to the most recurrent temporal patterns in other repertories. What is more, given the exploratory nature of the regression analysis, the potential impact of the cadential features examined here would benefit from a more controlled experimental design. In this study, the presence of a cadential six-four harmony and the temporal duration and event density of each excerpt predicted the average position and time index of the maximum slider ratings. Future studies could adopt an experimental design using a subset of these features to provide more robust evidence that the presence of a cadential six-four or a trill above the cadential dominant activates a schematic representation of the cadential formula during perception and so alerts listeners to the impending end of the cadence.
To be sure, if expectations for closure depend in part on our ability to abstract the correlational structure of tonal music, listeners might acquire the harmonic-melodic prototypes associated with cadences and other recurrent temporal patterns over the course of exposure. Meyer (2000) has argued, for example, that it is precisely our ability to internalize statistical regularities in the external environment that explains the remarkable diversity of such patterns in both Western and non-Western musics. This is to say that although sensory principles have some part to play in determining the psychological stability of an individual harmonic-melodic event, such as a harmonic octave interval or a major triad, the replication of quite distinct closing patterns in Joplin’s rags, Du Fay’s chansons, or indeed, Mozart’s keyboard sonatas, testifies to their role as learned conventions within a particular historical and cultural context.
Conclusion
Using a continuous-rating paradigm, this study suggests that tonic harmony elicits stronger expectations in anticipation of its occurrence as an ending harmony than dominant harmony, particularly for listeners with explicit training. The PAC category appears to obtain privileged status among the categories for which tonic is the expected goal harmony, which presumably results from parameters appearing within the cadential pattern that alert listeners to the impending terminal events. Thus, the PAC category is likely a prime candidate for schematic representation in long-term memory, with the specificity of the representation reflected in the strength and specificity of the schematic expectations it generates (Sears, 2015, 2016). Dominant harmony appears to be a less expected goal in the HC category, however, since excerpts from this category received the lowest and latest maximum slider ratings on average. Thus the potentially active, unstable dominant that characterizes this category may only achieve the status of a terminal goal if (1) the preceding pattern emphasizes the dominant in some way using scale degrees or harmonies from the key of the dominant (e.g., tonicization or chromatic inflection), or (2) the dominant itself receives metrical, textural, and rhythmic reinforcement (e.g., appears in a strong metric position, features a comparatively longer duration, is followed by a caesura, etc.; Meyer, 1973). Consequently, the tonal and harmonic hierarchies—demonstrated in various experimental contexts over the past few decades—may help to explain the compositional strategies involved in the realization of these categories over the history of Western tonal music.
Footnotes
Funding
The author(s) disclosed receipt of the following financial support for the research, authorship, and/or publication of this article: A Richard H. Tomlinson fellowship and a Quebec doctoral fellowship from the Programme de bourses d’excellence pour étudiants étrangers was awarded to David R. W. Sears, a Canadian Social Sciences and Humanities Research Council grant (410-2010-1091) and James McGill Professorship was awarded to William E. Caplin, and grants from the Canadian Natural Sciences and Engineering Research Council (RGPIN 2015-05280), Social Sciences and Humanities Research Council (410-2009-2201) and Canada Research Chair (950-223484) were awarded to Stephen McAdams.