
Abstract
Groove is defined as wanting to move the body to music. Most empirical groove research has focused on rhythmic features like microtiming and syncopation, while research on musical liking has focused on pitch, form, and repetition. Here, we examine the effect of timbre on groove and liking ratings by applying audio filters to basslines in an electronic dance music (EDM) style. We also investigate via questionnaire the role of music and dance experience, preferred genre, and gender on groove and liking. Four brief EDM loops were created, each consisting of drum samples and a synthesized bassline. Each loop had four audio filter conditions (high-pass, band-pass, low-pass, no filter) applied to its bassline. The 102 participants heard all stimuli three times, rating them for groove and liking, and then completed the questionnaire. For both groove and liking, participants gave higher ratings to the filter conditions preserving low-frequency energy (low-pass and no filter). The relation of the questionnaire data to groove and liking was limited, meriting further investigation. Overall, the results suggest that people find groovier, and like more, basslines preserving low-frequency energy. The lack of loop-filter interaction suggests that timbre can determine groove and liking across different melodic and rhythmic contexts.
Moving the body to music—whether in the form of dancing, head-bobbing, or foot-tapping—is pervasive, and may even be biologically innate (Phillips-Silver & Trainor, 2005). Madison (2006) defines groove as “wanting to move some part of the body in relation to some aspect of the sound pattern” (p. 201). Janata, Tomic, and Haberman (2012) created a set of songs (exemplars) that were consistently rated by participants as more or less groovy; the reliability of these exemplars has been replicated in later studies (Stupacher, Hove, & Janata, 2016; Stupacher, Hove, Novembre, Schütz-Bosbach, & Keller, 2013). The replications suggest that, generally, Western listeners (in American and German cultures, at least) tend to agree about which music is more or less groovy.
Recent groove studies have primarily focused on rhythm, specifically syncopation and microtiming. Sioros, Miron, Davies, Gouyon, and Madison (2014) found that applying syncopation to simple melodies increased groove in participants. Specifically, they found that moderate syncopation was rated as groovier than heavy syncopation. Witek, Clarke, Wallentin, Kringelbach, and Vuust (2014) used funk drum breaks and found that medium degrees of syncopation were rated as the grooviest and most pleasurable, confirming Sioros et al.’s findings. In addition to syncopation, a number of studies have investigated the effect of microtiming on groove. Microtiming can be defined as “marginal adjustments in tempo and/or timing below the phrase or bar level” (Frühauf, Kopiez, & Platz, 2013, p. 247). Madison, Gouyon, Ullén, and Hörnström (2011) found that between-beat event density and beat salience were positively correlated with groove, but microtiming was not. Davies, Madison, Silva, and Gouyon (2013) used drum patterns (in samba, jazz, and funk styles) and found that the presence of microtiming actually lowered groove. Frühauf et al. (2013) used a rock drum pattern and again found that the quantized version, rather than the microtimed versions, was rated the grooviest. Madison and Sioros (2014) asked musicians to play melodies in a groovy and a non-groovy way, and found that while syncopation was used more for the groovy performances, microtiming was not. Kilchenmann and Senn (2015), however, did find an effect of microtiming on groove: presenting participants with recordings of a duo playing drums and bass in a funk and swing style, they found that microtiming manipulations affected head movement. However, the effect was small and it only appeared in expert listeners. In a follow-up study, Senn, Kilchenmann, von Georgi, and Bullerjahn (2016) found that the microtiming manipulations affected groove ratings for both experts and non-experts. However, a fully quantized version (no microtiming) was rated as equally groovy to the original performance. That the majority of studies have not found a strong positive correlation between microtiming and groove is counterintuitive to the testimonies of many professional musicians (Kilchenmann & Senn, 2015). The effect of microtiming on groove remains somewhat unclear.
Fewer groove studies have examined timbre. In a motion-capture study, Van Dyck et al. (2013) played newly composed electronic dance music (EDM) 1 songs in a club-like environment and found that the louder the bass drum, the more that participants moved their bodies. In another motion-capture study, Burger, Thompson, Luck, Saarikalio, and Toiviainen (2013) played existing songs in a variety of styles, and found that sub-band flux (a measure of energy within a frequency band) between 50 and 100 Hz (sub-band 2) was correlated with increased head movement in participants, demonstrating that spectro-temporal features can map onto the movement of body parts. In a follow-up study, Burger, Ahokas, Keipi, and Toiviainen (2013) used the same songs from the previous study, but this time they applied band-pass filters (BPFs) to the songs. The BPFs were so narrow that many of the songs were not even recognizable. They found that sub-band flux in sub-bands 2 (50–100 Hz) and 9 (6400–12800 Hz) were positively correlated with groove ratings. Solberg and Jensenius (2016) found a link between formal section and amount of participant movement in EDM songs, which they attributed to the sonic features of each section. In particular, the presence of “breakdowns” and “build-ups” led to increased motion during “drops.” Finally, Stupacher et al. (2016) did a spectral analysis of the Janata et al. (2012) groove exemplars, finding that the amount of sub-band flux in the frequency band below 100 Hz (sub-bands 1 and 2) had the strongest correlation with groove ratings. Stupacher et al. (2016) also used newly composed music played by session musicians on drums, bass, and synthesizers, and found that groove was higher when the bass and the kick drum were lower in frequency. Specifically, high sub-band flux between 50 and 100 Hz (sub-band 2) was groovier than high sub-band flux between 100 and 200 Hz (sub-band 3). The results of these studies suggest that the timbral “sweet spot” for groove consists of high sub-band flux between 50 and 100 Hz (sub-band 2), which is where kick drums and basslines dominate. Despite these recent discoveries, the impact of timbre on groove remains under-researched (relative to the impact of rhythm on groove) in the empirical literature.
We were also curious about the role of timbre in determining liking. Several studies have collected liking ratings in response to manipulations of musical parameters like form, repetition, and pitch structure; fewer studies, however, report liking ratings in response to timbral manipulations of musical stimuli. Presenting recorded instruments playing a single pitch (D#4), Eerola, Ferrer Flores, and Alluri (2012) found a significant negative correlation between high-frequency to low-frequency energy ratio and valence ratings; in this particular experiment, the correlation between valence (pleasant/unpleasant) and preference (like/dislike) ratings was so high (r = 0.97) as to warrant treating the two constructs synonymously. In a similar study, McAdams, Douglas, and Vampala (2017) found a significant correlation between instrument family and liking across multiple pitch registers. Finally, Wallmark, Iacoboni, Deblieck, and Kendall (2018) found a significant negative correlation between subjective ratings of “noisiness” and liking (referred to in the study as “valence”) in 400-ms excerpts of popular music. These findings align with several studies on timbre using non-musical stimuli, which have found that auditory roughness and “sharpness” (the latter meaning sounds with more high-frequency energy) are perceived as unpleasant (for a review, see McDermott 2011).
In short, timbre’s impact on groove and liking is under-researched. Our study used newly composed music in an EDM style, and we applied audio filters to the bassline only (not the drums). Previous groove studies that used timbre as an independent variable have changed the volume of the kick drum (Van Dyck et al., 2013), applied BPFs to the entire texture (Burger, Ahokas, et al., 2013), or changed the center frequency of the kick drum and bass by one octave (Stupacher et al., 2016). In our treatment of timbre as an independent variable, we applied four different audio filter conditions to the synthesized bass, which allowed us to include or exclude entire frequency bands, in the context of stimuli that were ecologically valid yet unfamiliar to participants.
Finally, we set out to investigate the role of musical genre preference, gender, and musical sophistication on groove and liking ratings. Using a questionnaire, we assessed whether people with more experience with dancing, movement, and EDM might have different timbral preferences than the general population. The questionnaire also gathered gender information, since work by McCown, Keiser, Mulhearn, and Williamson (1997) suggests that males prefer music with exaggerated bass.
Method
Participants
A total of 102 adult participants (75 females, 27 males) with an average age of 20.24 years (SD = 1.48) took part in the study. All participants were undergraduates at the University of Rochester; none were music majors. The age and gender makeup of our participants was due to the available students in the university psychology department’s research pool, which was a matter of convenience. Participants had an average of 4.5 years of formal training on a musical instrument (including voice). All participants asserted that they had normal hearing capacities. The experiment was approved by the Institutional Review Board at the university. As incentive, participants received course credit for participating.
Loops
Our aim was to manipulate the bassline timbre using audio filters, but we also wanted to test whether the effect of the filters was robust enough to withstand different pitch and rhythmic conditions. Therefore, four brief loops in an EDM style were composed by the first author in Ableton Live, a Digital Audio Workstation (DAW). Each loop consisted of drum samples (hi-hats, kick drum, and snare drum) and a synthesized bass. The drum samples consisted of the Ableton Live factory samples “Hihat-909-Open.aif,” “Kick-909-Open.aif,” and “Snare-909-Tune10-s.aif.” These samples are taken from the Roland TR-909, an extremely common drum machine in EDM. Using Audacity (an audio editor), the kick drum and snare drum were truncated to < 468 ms (one beat) long, while the hi-hats were truncated to < 234 ms (half a beat) long. The truncation was done to avoid “bleeding” across beats in order to cleanly do a spectral analysis of the individual beats. The bass was synthesized using Massive by Native Instruments as a plug-in inside Ableton; Massive was set to the square wave setting. The square wave setting was chosen because of its theoretical simplicity as a waveform (a series of sine waves at the frequency of every odd partial above the fundamental), and because its partials extend infinitely up the entire frequency range. All stimuli were normalized to equal intensity.
In order to make the four loops comparable, they shared compositional constraints: they were in the same key (E minor), at the same tempo (128 beats per minute), used durations no shorter than sixteenth-notes, were quantized (no microtiming was used), had a kick drum on every beat (making them all four-on-the-floor in style), used a four-measure AABA structure with a repeat (for a total duration of eight measures, or 15 seconds, for each loop), and used drum patterns that looped every two beats. Every attempt was made for all four loops to be, within these constraints, conceivable as real music. Figure 1 shows the notation of the four loops.
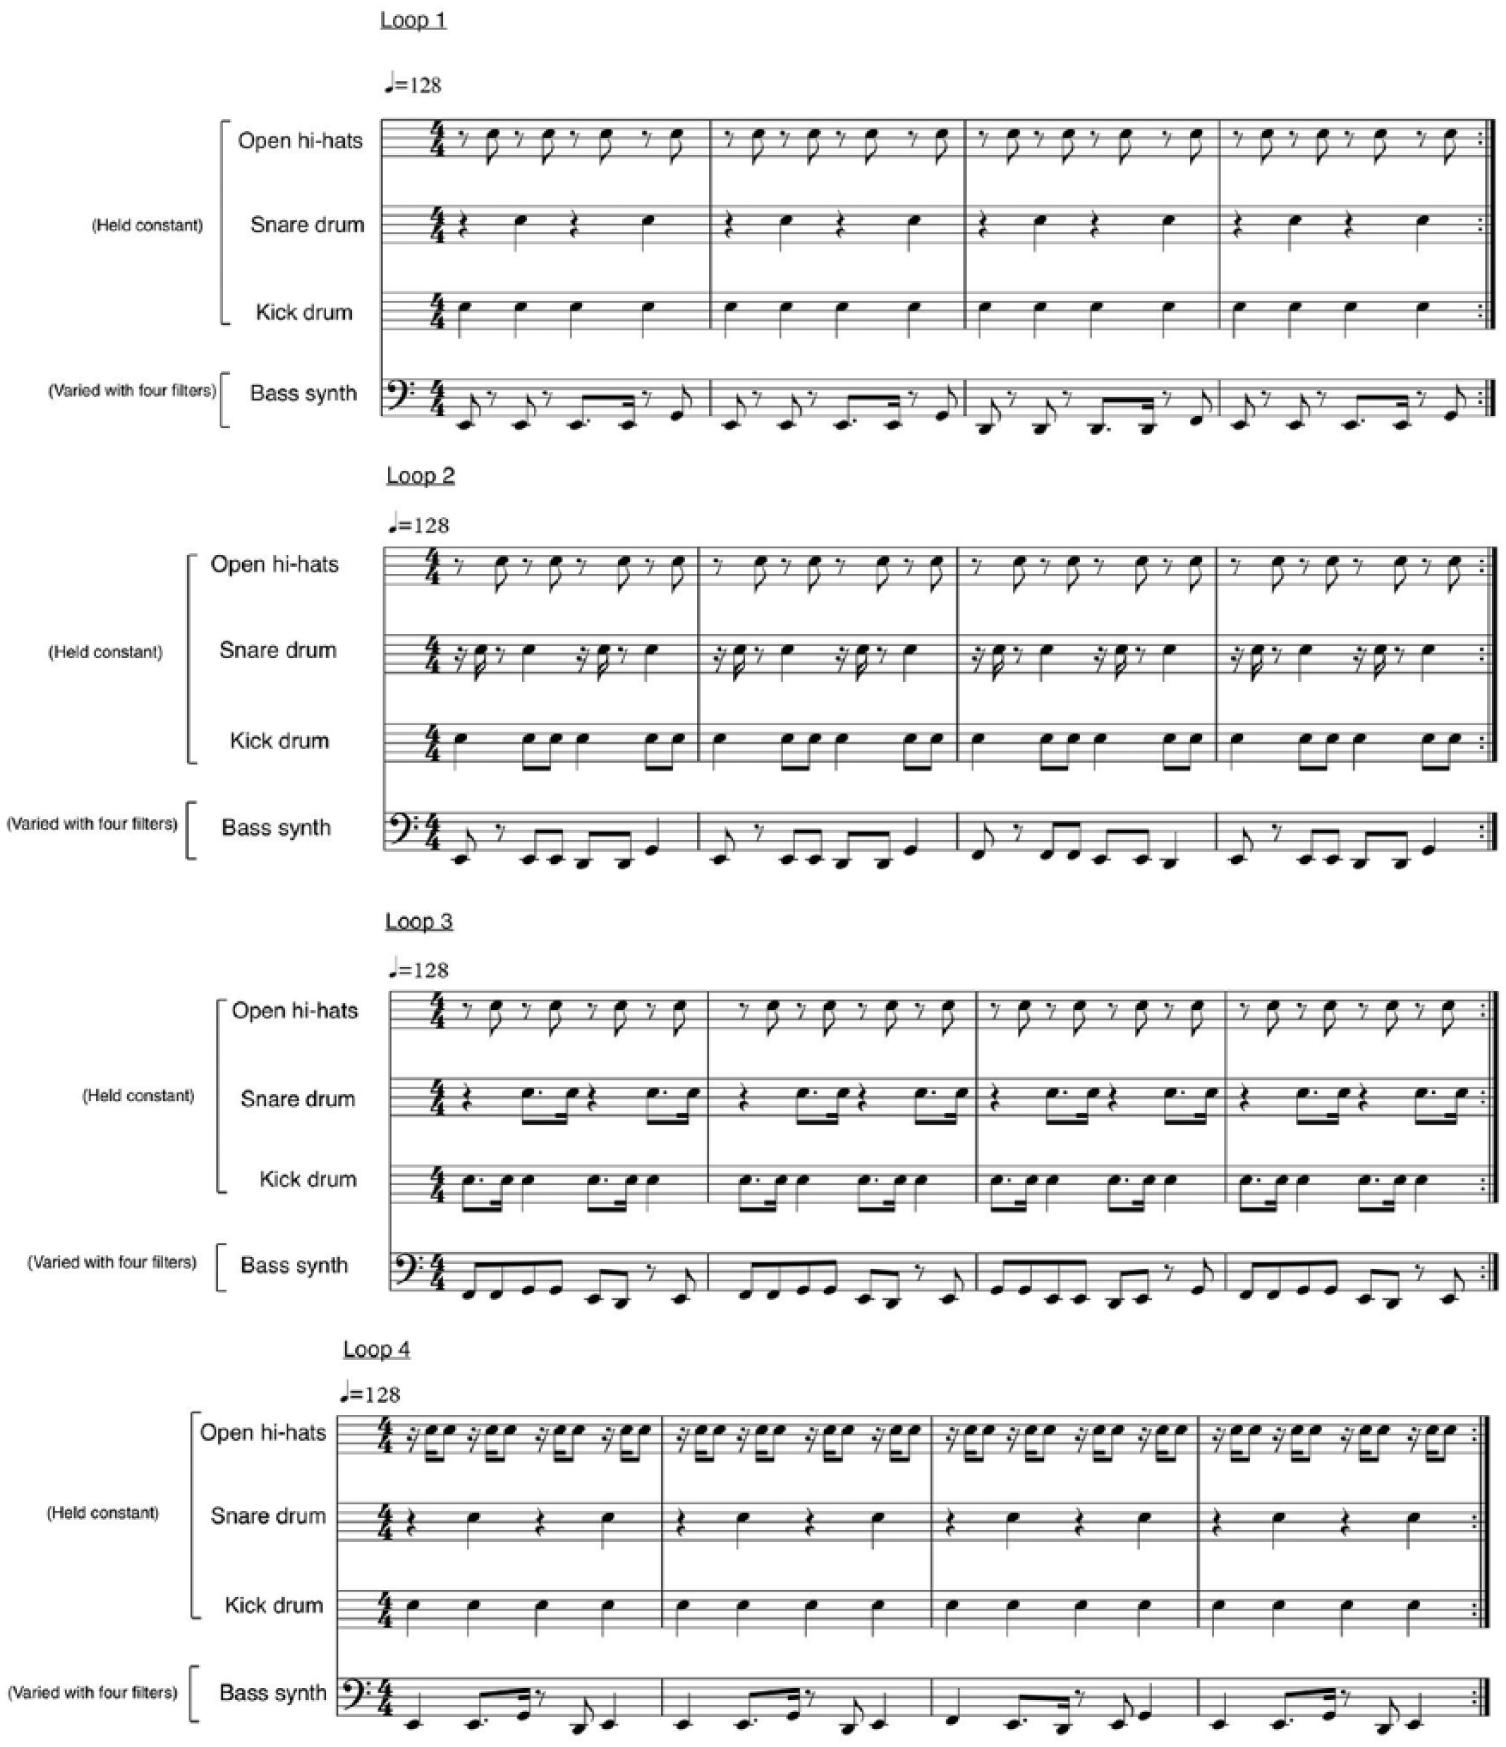
Notation of the loops.
Audio filter conditions
In a pilot study (N = 30) we applied six audio filter conditions (two high-pass filters [HPFs], two low-pass filters [LPFs], no filter, and one band-pass filter [BPF]) to the bass synthesizer. The filter cutoffs were chosen based on two criteria: that they sounded for participants like realistic possibilities for actual music in this style, and that they sounded maximally distinct from one another. In other words, the filters were chosen based on their sound rather than on theoretical priors. In the pilot results we found that two of the filters (a 300 Hz HPF and a 150 Hz LPF) were not significantly different from the other HPF and LPF. We eliminated these two redundant filters, leaving four audio filter conditions for the present experiment (see Table 1). Filters were applied using the EQ8 tool in Ableton Live (the resonance [Q] of the filters was .71, and the rolloff was × 4). Each of the four loops had the four audio filter conditions applied to its bass synthesizer, for a total of 16 different stimuli. (Hear Supplemental Files online: clips 1–4 play the four filter conditions for Loop 1; clips 5–8 play the four filter conditions for Loop 2; clips 9–12 play the four filter conditions for Loop 3; and clips 13–16 play the four filter conditions for Loop 4.)
Filter conditions.
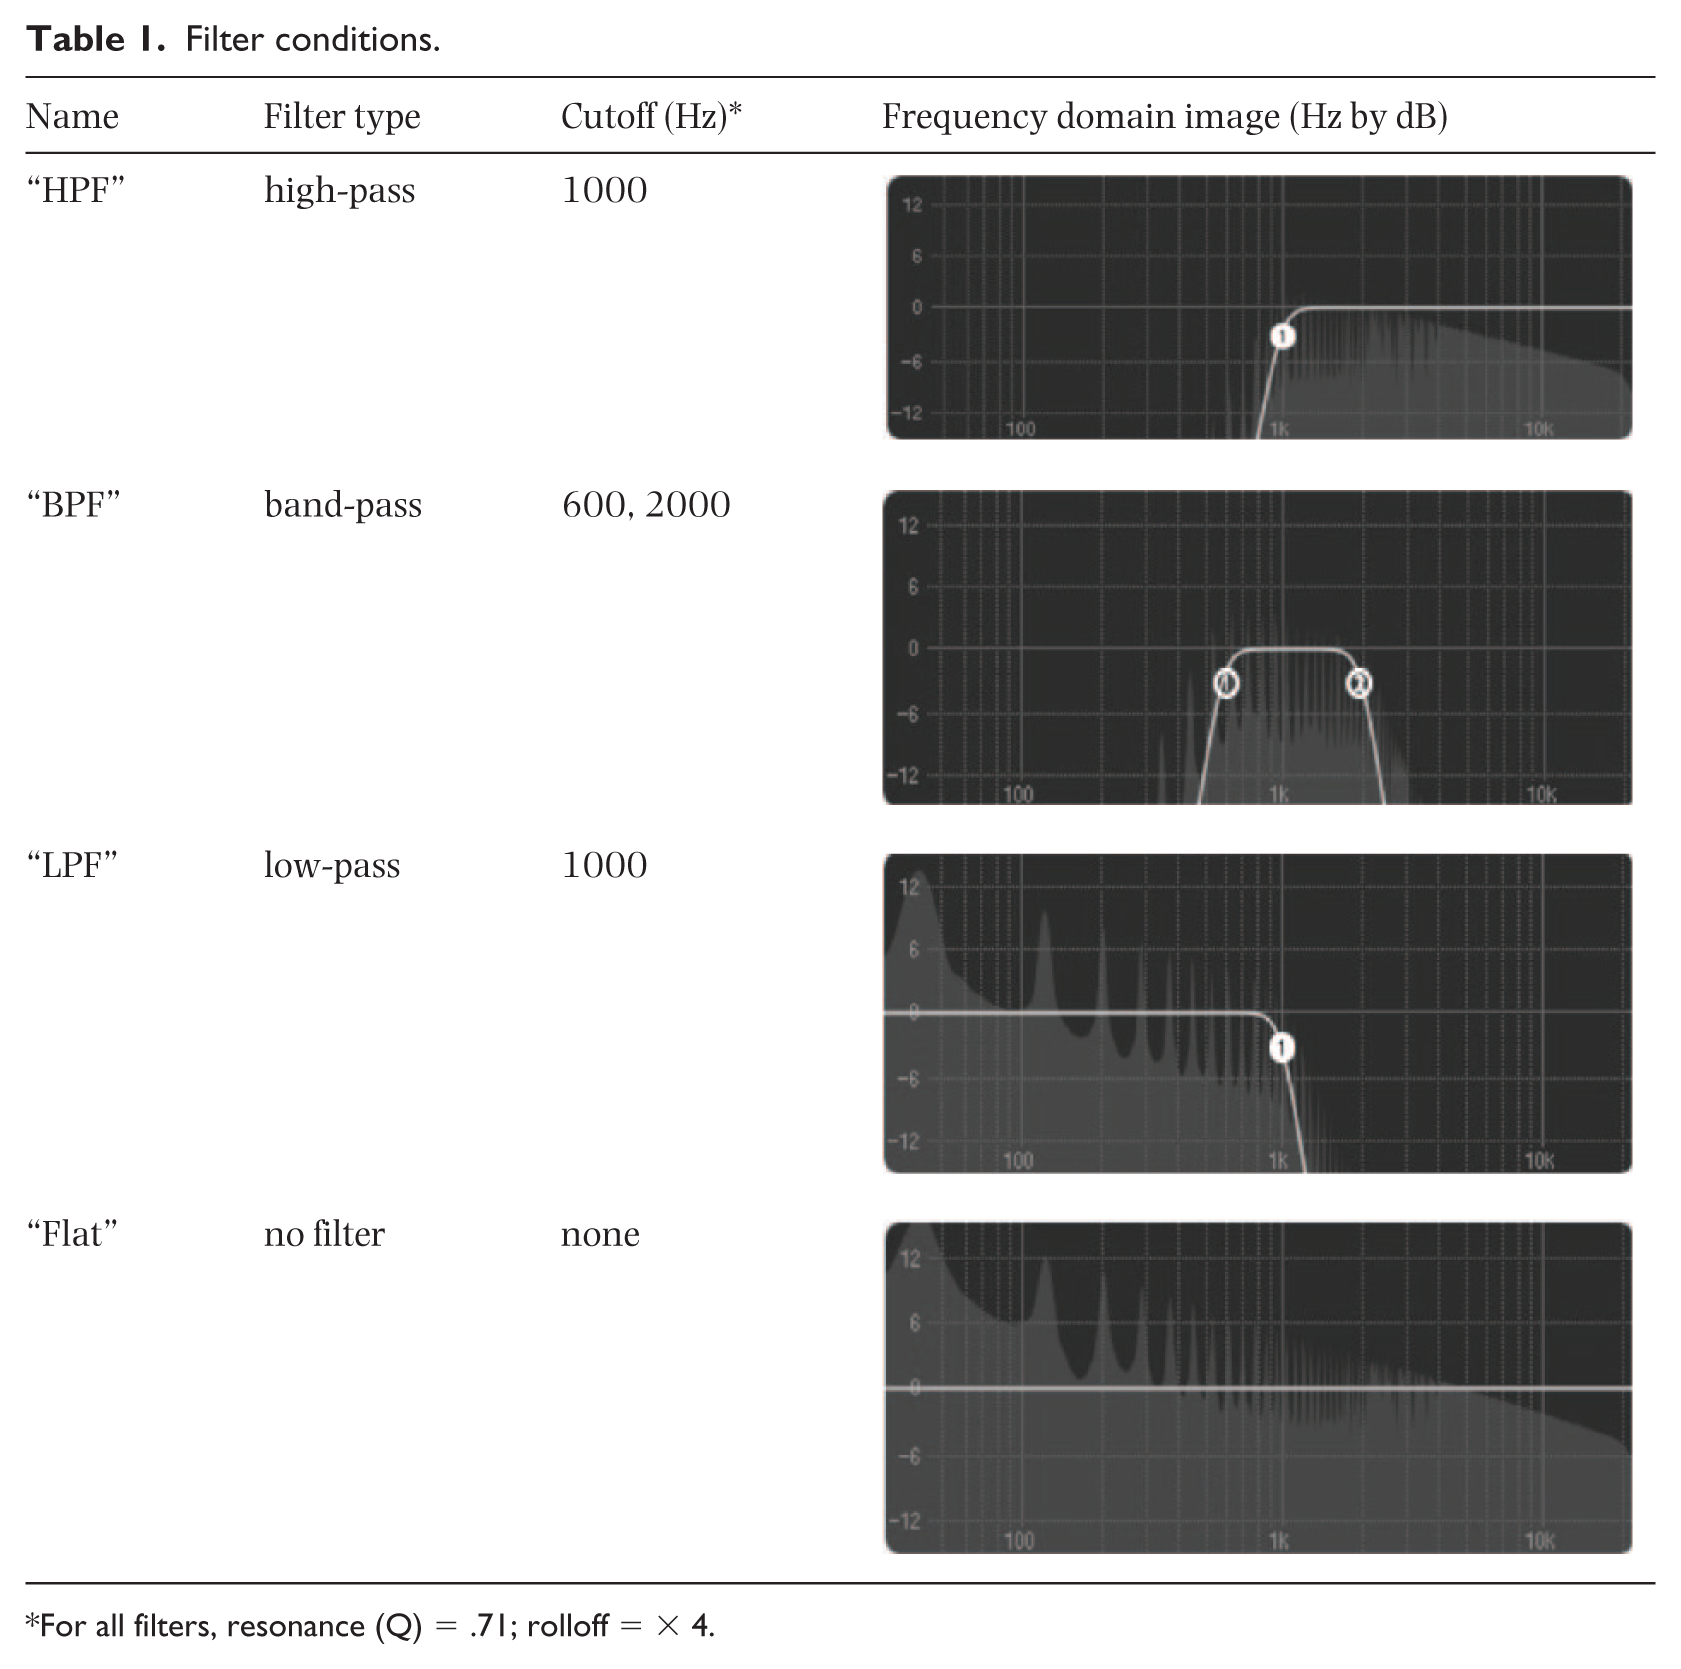
For all filters, resonance (Q) = .71; rolloff = × 4.
Procedure
Participants were tested individually in a sound-isolated booth using Sennheiser HD600 headphones with a Cambridge Audio Meridian Explorer DAC/amp. The stimuli and rating interface were presented in PsychoPy 1.83.03 on a Lenovo Y550 laptop running Windows 10. The experiment began with training screens and three practice trials, to familiarize participants with the rating interface and to allow them to adjust the volume to a comfortable level. Participants were told that for each stimulus they would answer two questions: “How much do you like this music?” and “How much does this music make you want to move?” (measuring the dependent variables of liking and groove respectively). Participants were told that “move” means moving your body, such as tapping your foot or bobbing your head, while “liking” was left undefined.
In the experimental trial, for each 15-second stimulus, participants chose one rating for liking and one rating for groove; both ratings were on a scale from 1 to 5 (integers only, 1 = low, 5 = high) and ratings could not be changed once selected. The rating window only appeared for the second half of each stimulus (the repeat), giving participants 7.5 seconds to make both ratings. A timer in the middle of the screen counted down from 15 seconds to 0 seconds for each stimulus. Figure 2 shows a screenshot of the rating interface. In the screenshot, the liking rating has been selected with the mouse and is gray. The groove rating has not yet been selected and is green. The timer in the middle of the screen shows that there are 5.1 seconds remaining in the stimulus as well as in the rating window.
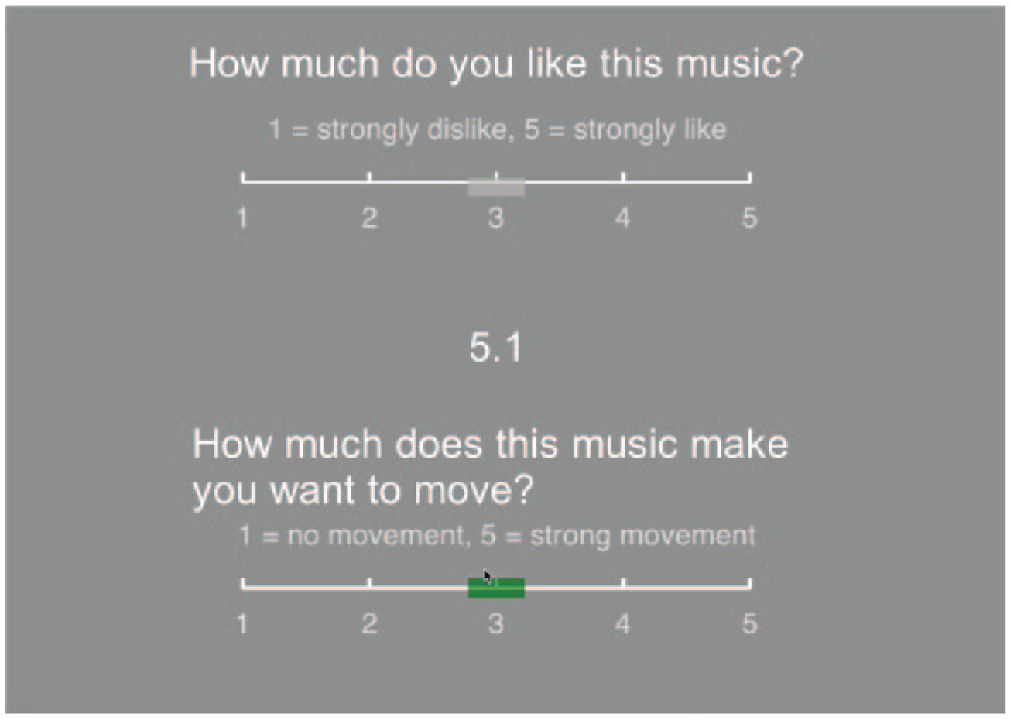
Screenshot of the rating interface.
Immediately following each stimulus, 5 seconds of white noise (amplitude = 0.25) were played, followed immediately by the next stimulus. Participants were presented with each of the 16 distinct stimuli (4 loops × 4 filters) three times over the course of the experiment (to test for reliability and potential repetition effects), for a total of 48 passages presented to each participant. The stimuli were presented in a semi-random sequence that avoided directly repeating the same filter or loop. A different semi-random sequence was generated for each participant. The 48 passages were broken into two 24-passage blocks, with a 2-minute ear break in between blocks to minimize ear fatigue.
Questionnaire
After rating the music passages, participants filled out a questionnaire on SurveyGizmo.com. The questionnaire was based on two existing scales: the STOMP-R (Rentfrow & Gosling, 2003) and the self-report portion of the GOLD-MSI v1.0 (Müllensiefen, Gingras, Stewart, & Musil, 2014). The STOMP-R asks about preference for 23 different music genres on a seven-point scale, and breaks the 23 genres into four personality dimensions (Reflective & Complex, Intense & Rebellious, Upbeat & Conventional, and Energetic & Rhythmic). The “Dance/Electronica” genre is found inside the Energetic & Rhythmic dimension of the STOMP-R. The self-report portion of the GOLD-MSI asks questions relating to six factors (active engagement, perceptual abilities, musical training, singing abilities, emotions, and general musical sophistication). To the existing 39 questions in the GOLD-MSI, we added seven more questions about dance and movement, randomly burying them inside the questionnaire:
- I often move my body when I listen to music.
- When I hear a catchy tune I find myself moving to the beat.
- I rarely tap or clap along when listening to music.
- I like to sit still and concentrate when I listen to music.
- I have had (0 to 10 or more) years of formal dance instruction during my lifetime.
- I have attended (0 to 11 or more) DJ shows in the past twelve months.
- I have gone dancing (0 to 11 or more) times in the past twelve months. 2
We hypothesized that the inter-item correlations between the dance/movement questions would be high, and that a stated preference for genres in the Energetic & Rhythmic dimension of the STOMP-R would also correlate well with the questions. Finally, we wanted to see if people who score highly on the dance/movement questions and who prefer Energetic & Rhythmic genres give distinct filter ratings, as they are likely to be more experienced with groove than the average participant.
Results and discussion
Questionnaire results
Of the seven dance/movement questions, three (“I often move my body when I listen to music”, “When I hear a catchy tune I find myself moving to the beat”, and “I rarely tap or clap along when listening to music”) had good inter-item correlations (Cronbach’s Alpha = .79) and were selected to form a “movement scale”, which we hypothesized to be predictive of groove and liking ratings, and used as a fixed-effect (see below). Surprisingly, the remaining four questions, concerning experience with dancing, DJ shows, and so forth, did not correlate well. Perhaps this result is due to a lack of experience with going out to dance clubs given the average age of our participants (20.24 years), which is below the legal drinking age (21) in the US.
Mixed-effects models
We constructed several linear mixed-effects models to determine the effect of multiple variables on groove and liking. Fixed effects were: loop, filter, movement scale score (“Scale”), repetition (“Rep”), and STOMP-R subscore on the Energetic/Rhythmic dimension (“Energetic”). Participants were modeled as random effects. The models were compared using the Akaike Information Criterion (AIC) and the Bayesian Information Criterion (BIC). For groove (Table 2[a]), the best models were Loop + Filter (BIC) and Loop + Filter * Rep + Scale (AIC). For liking (Table 2[b]), the best models were Loop + Filter (BIC) and Loop + Filter * Rep + Energetic (AIC). The results suggest that the most important predictors of groove and liking ratings were the loop and the filter (as shown by the BIC results). The AIC results suggest some secondary factors: a filter-repetition interaction predicted groove and liking (however, the role of repetition was small and limited to one filter—LPF); a high score on our movement scale predicted groove; a preference for Energetic genres predicted liking. General Musical Sophistication (as measured by the GOLD-MSI) did not improve the models. Gender also did not improve the models, meaning that there was no significant gender difference within the groove or liking ratings. This contradicts previous research that suggests that males should prefer bass-heavy music (McCown et al., 1997). However, our sample was more female than male (75 females, 27 males). Perhaps with a larger male sample, a significant effect would emerge.
Comparison of linear mixed-effects models for groove.
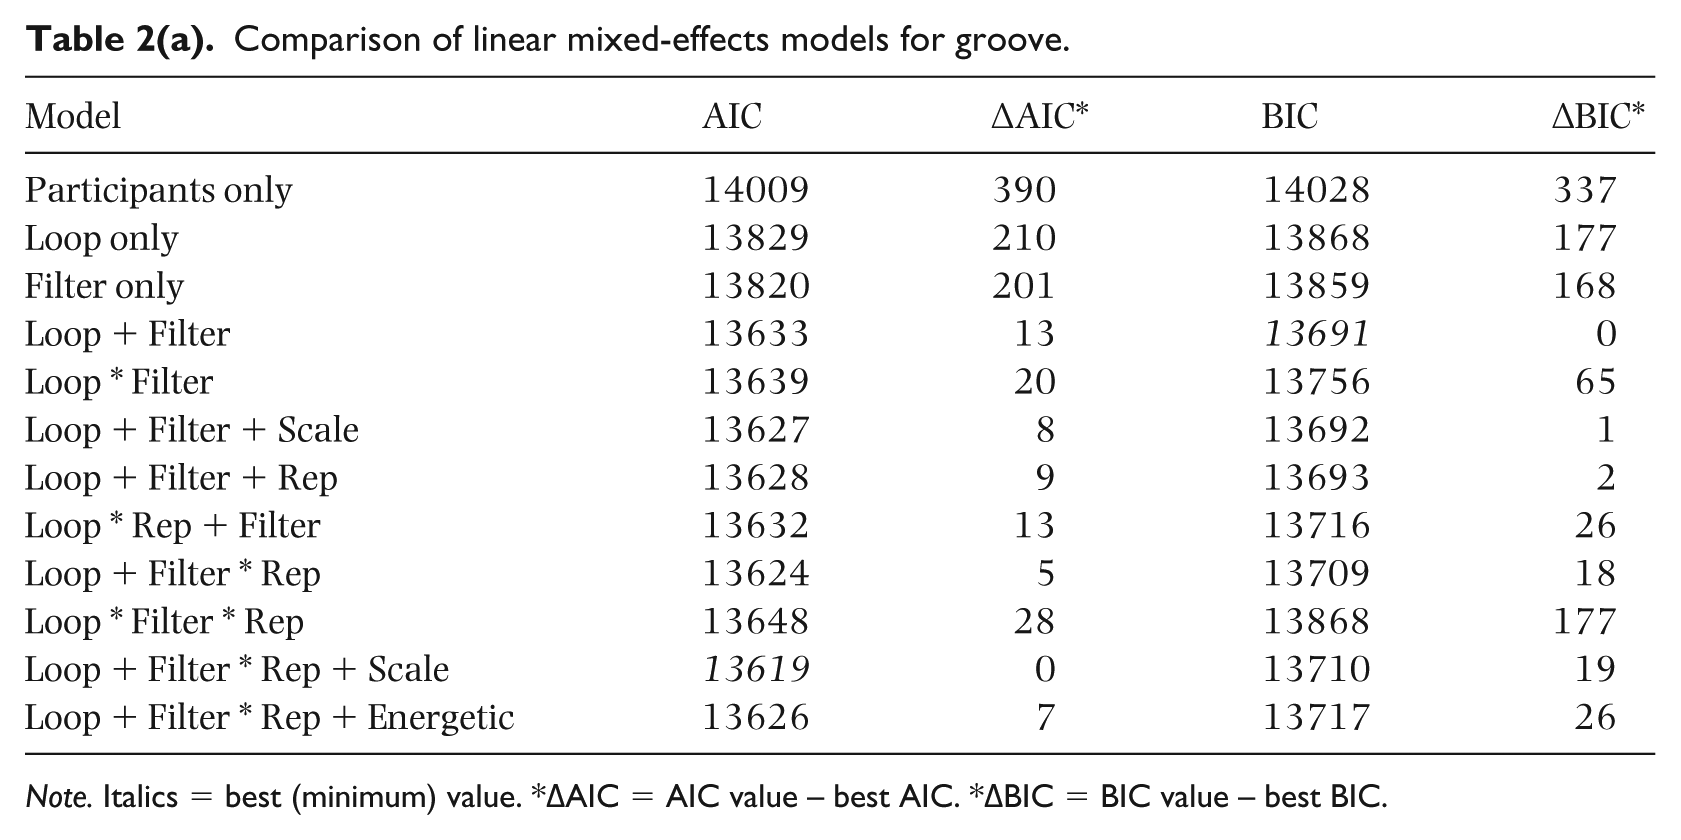
Note. Italics = best (minimum) value. *∆AIC = AIC value – best AIC. *∆BIC = BIC value – best BIC.
Comparison of linear mixed-effects models for liking.

Note. Italics = best (minimum) value. *∆AIC = AIC value – best AIC. *∆BIC = BIC value – best BIC.
In summary, the best predictors of groove and liking were the filter condition and the loop, as expected. It appears that our movement scale played a small role in predicting groove (but not liking), and a stated preference for genres in the Energetic/Rhythmic dimension played a small role in predicting liking (but not groove). Gender, musical sophistication, and repetition played little to no role (however, see “Effect of repetition” below).
Groove and liking ratings
Figures 3 and 4 show the means of the groove ratings and liking ratings, respectively, for the four filter conditions. Planned contrasts using Bonferroni correction found that the filter conditions which preserved lower frequencies (LPF and flat) were rated significantly higher (ps < .0001) on both groove and liking than the filter conditions which eliminated lower frequencies (HPF and BPF).

Mean groove ratings of the filter conditions.
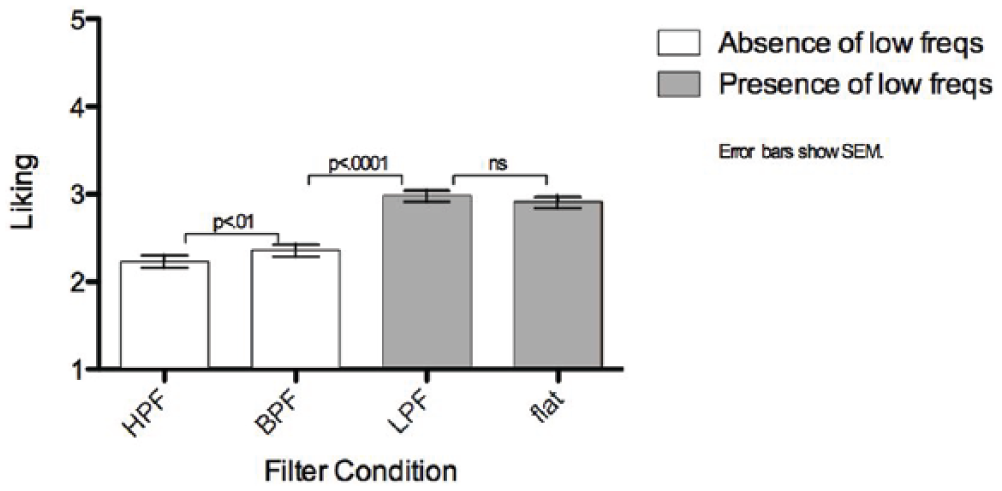
Mean liking ratings of the filter conditions.
Participants gave higher mean groove and liking ratings to the pair of filter conditions that preserves low frequencies, and they gave lower ratings to the pair of filter conditions that removes low frequencies. The two filter conditions that received lower ratings eliminate sound in the bassline below 600 and 1000 Hz, both of which are well above the desired groove “sweet spot” of high sub-band flux from 50 to 100 Hz. Our results suggest that the presence of low-frequency sound—at least with this particular type of synthesized bass in this particular style—increases liking and groove, confirming previous research (Stupacher et al., 2016). Our results also cohere with Eerola et al. 2012’s finding of a link between LF–HF (low frequency–high frequency) ratio and liking, despite their use of vastly different stimuli (isolated instrument samples). Finally, there was no significant loop–filter interaction, which suggests that timbre’s effect on groove and liking is robust enough to override the different melodic and rhythmic contexts provided by the loops.
Effect of repetition
The passages were presented randomly, such that each participant heard and rated each stimulus three times over the course of the experiment. We used Cronbach’s Alpha to test the consistency of participants’ groove and liking ratings across the three hearings of each stimulus; values ranged from 0.67 to 0.83 (depending on the Filter–Loop condition), suggesting a moderate level of consistency. Across loops, the effect of repetition was only significant within one filter condition: LPF. It appears that on the second hearing of the LPF version of the loops, participants liked and found it groovier than on the first hearing; this difference was highly significant (p < 0.001). Perhaps participants, growing tired of the other filter conditions (especially HPF and BPF), found LPF refreshing when they heard it for the second time. (However, the difference between the second and third hearings of LPF was not significant.) Aside from the anomaly of LPF, there was no repetition effect, which is not surprising: successive repetition appears to have a clearer effect on liking than random repetition (Stevens & Latimer, 1991), and presumably this is true for groove also.
Sub-band flux
Table 3 shows the mean sub-band flux of each filter condition within sub-bands 1, 2, 3, and 9. In line with previous research (Burger, Ahokas, et al., 2013; Burger, Thompson, et al., 2013; Stupacher et al., 2016), the filter conditions that were rated significantly higher on groove and liking (LPF and flat) contain higher sub-band flux in sub-bands 1 (0–50 Hz) and 2 (50–100 Hz), but not in sub-band 3 (100–200 Hz). Unlike the findings of Burger, Ahokas, et al. (2013), in our study, high flux in sub-band 9 (6400–12800 Hz) did not affect groove or liking; however, this is probably because we did not manipulate higher-frequency timbres such as the hi-hats, which no doubt affect groove. The results reinforce the notion that the “sweet spot” for groove (with respect to basslines) is to be found below 100 Hz.
Mean sub-band flux values by filter condition.

Cultural and biological hypotheses
Why are low frequencies groovy? We can think of two general hypotheses, which could coexist and reinforce each other. The first hypothesis is cultural. Grooviness might be learned from exposure to groove-based music: people become used to hearing large amounts of low frequencies when they go dancing in a club, and they become used to hearing groove-based popular music which uses prominent basslines. As a result, they form a learned association between groove and low frequencies. Although many of our participants reported limited experience with dancing, associations between low-frequency sounds and groove may persist even in contexts where dancing is less prevalent, or could be learned passively while listening to groove-based popular music.
The second hypothesis is biological, and suggests that low frequencies have an essentially rhythmic function. The human vestibular system (which is responsible for balance) shares space in the inner ear with the cochlea. Todd, Rosengren, and Colebatch (2008) found that the vestibular system is actually more sensitive to low frequencies than the cochlea is, especially to frequencies around 100 Hz. The vestibular system also influences metric perception: passive movement of the body—such as rocking a participant back and forth—can influence what meter they perceive an ambiguous rhythm to be in (Phillips-Silver & Trainor, 2005; Phillips-Silver & Trainor, 2008). Even stimulation of the vestibular system alone, which creates the illusion of head movement, can still influence what meter people perceive an ambiguous rhythm to be in (Trainor, Gao, Lei, Lehtovaara, & Harris, 2009). Given that low-frequency vibrations from a club’s sound system literally move the body, might these vibrations function to reinforce and clarify meter for dancers? One research team (Hove, Marie, Bruce, & Trainor, 2014) found that timing is superior when tracking the lower pitch of a dyad rather than the higher pitch. These findings have also been intuited by music theorists, such as Lerdahl and Jackendoff (1983) with their Metrical Preference Rule 6: “Prefer a metrically stable bass” (p. 88). If low frequencies serve a primarily rhythmic function, this would explain their connection with groove, given that moving the body to music is—like rhythm itself—a temporal phenomenon.
Meanwhile, it appears that high frequencies aid the listener in two tasks: pitch perception and musical recognizability. A number of studies have demonstrated a high-voice superiority effect with respect to pitch perception (Fujioka, Trainor, Ross, Kakigi, & Pantev, 2005; Fujioka, Trainor, & Ross, 2008; Marie, Fujioka, Herrington, & Trainor, 2012; Marie and Trainor, 2013; Marie and Trainor, 2014), in contrast to the low-voice superiority effect with respect to timing mentioned earlier. Using 100-ms excerpts, Schellenberg, Iverson, and McKinnon (1999) demonstrated that participants can recognize songs even with their lower frequencies removed (1000 Hz HPF); however, when they removed the high frequencies (1000 Hz LPF), participants could no longer recognize the songs. If high frequencies are essential to song identification, this makes intuitive sense, given that most people remember most songs by their melody, not by their bassline. Thus, we might hypothesize that while higher frequency sounds can play a role in creating groove (and certainly do play a role in liking), they are not as essential to groove as low-frequency sounds. EDM musicians have used this tendency in song creation to make tension: “build-up” sections often omit low frequencies and lead to a climactic “drop” that restores the ongoing “main groove” pattern (Peres, 2016; Solberg & Jensenius, 2016). (The “build-ups” that omit low frequencies create pleasure for dancers/listeners via the expectation that the main groove will be restored, and would be less successful as main grooves.)
Regarding the relationship between groove and liking ratings, our study aligns with Witek et al. 2014 in finding a strong correlation between the two response variables (r = 0.68, p < 0.001). Witek (2017) has argued that liking can be a manifestation of groove, as the tendency of listeners to “fill in” temporal gaps created by syncopation “affords a participatory pleasure” (p. 138). We suggest that the converse may also be true: that is, judgments of liking based on timbre alone can affect one’s ability to groove, such that the “sharper,” less liked stimuli (HPF and BPF) naturally lowered participants’ groove ratings. This could be another explanation for the affective significance of the “build-up/drop” structures described earlier—a relative emphasis on high-frequency bands during build-ups, followed by a restoration of the low frequencies during drops, could lead to increased pleasure due to “contrastive valence” (Huron 2006).
Limitations and directions for future research
In our experiment, participants were sitting down in a laboratory environment, listening to stimuli on headphones. This is hardly similar to a real-life dance environment. Self-report is a potentially limited way to try to measure groove, as it captures how much the participant wants to move, which is a different measure from how much the participant actually moves. While our experiment relied on self-report, we could increase validity by measuring physiological correlates of self-reported groove (Witek, 2009) and using motion-capture in a club-like environment (Van Dyck et al., 2013). For our synthesized bass, we used the square wave, a very simple timbre. In the future, it would be worthwhile to test more complex timbral combinations; instead of just varying the presence of frequencies in a certain band using audio filters, we might vary the ratios between the frequencies, or their amplitudes. It would also be worthwhile to include more varied styles of music and a greater number of loops. We normalized the stimuli to equal intensity, but we did not normalize them to equal loudness, meaning that the perceived loudnesses of the four different filter conditions may have differed. If so, a lack of equal loudness between stimuli could have introduced a confound into our design. EDM is typically played at loud volumes, which would suggest that loudness may correlate positively with groove. If this is true, equal loudness between stimuli becomes especially important. However, Stupacher et al. (2016) did not find that loudness had any effect on groove ratings, bringing the long-standing assumption that loudness affects groove into question. Nonetheless, their experiment was in a laboratory environment; we believe that more experiments in a dance-like environment are needed to further test the role of loudness on groove and liking.
Conclusion
In summary, our study applied audio filters to the basslines of EDM-style loops. Our results suggest that people (to the extent that our sample is generalizable) both like and find groovier the basslines whose audio filters do not eliminate low-frequency energy. A preference for genres in the Energetic/Rhythmic dimension (such as EDM) played a small role in predicting liking (but not groove) ratings, while a reported tendency to move to music played a small role in predicting groove (but not liking) ratings. Ratings for filter conditions were stable across the different loops (no loop–filter interaction), suggesting that the presence of bass frequencies is crucial for creating groove across different melodic and rhythmic contexts in EDM.
Supplemental Material
Stimuli – Supplemental material for All about that bass: Audio filters on basslines determine groove and liking in electronic dance music
Supplemental material, Stimuli for All about that bass: Audio filters on basslines determine groove and liking in electronic dance music by Ethan Lustig and Ivan Tan in Psychology of Music
Footnotes
Acknowledgements
Ethan Lustig acknowledges a doctoral fellowship from the Social Sciences and Humanities Research Council (SSHRC) of Canada.
Thanks to Elizabeth West Marvin, David Temperley, and Jeremy Jamieson for their help.
Ethical approval
Ethical approval for this project was given by the Research Subjects Review Board of the University of Rochester [case number 00060647].
Funding
The authors received no financial support for the research, authorship, and/or publication of this article.
Supplemental material
Supplemental material for this article is available online.
Notes
References
Supplementary Material
Please find the following supplemental material available below.
For Open Access articles published under a Creative Commons License, all supplemental material carries the same license as the article it is associated with.
For non-Open Access articles published, all supplemental material carries a non-exclusive license, and permission requests for re-use of supplemental material or any part of supplemental material shall be sent directly to the copyright owner as specified in the copyright notice associated with the article.