



Abstract
Influences of background music on consumer behavior have economic potential for businesses. However, the precise parameters for manipulating these effects have remained elusive. In this study, the impact of different genres of background music on consumer spending was examined in three branches each of both a Japanese-themed and a Mexican-themed restaurant chain in Singapore. Three music genre conditions (“pop,” “traditional,” “mix”) corresponding to the restaurants’ cultural theme, were played for a week in each restaurant. Data on total spending and spending per customer were collected and analyzed. While direct music genre effects were not statistically significant, results indicated certain trends where higher consumer expenditure was observed in conditions utilizing a mixture of pop and traditional music (“mix”). Specifically, spending per customer for the “mix” condition was 11.4% higher than for “pop” for the Japanese restaurant, whereas it was 6.3% higher for the “mix” condition than for “traditional” for the Mexican restaurant. The results suggest that music could be tailored to different days of the week to appeal to different customer profiles and that music can be parameterized to influence consumer behaviors.
Music can induce pleasure (Montag, Reuter, & Axmacher, 2011; Salimpoor, Benovoy, Larcher, Dagher, & Zatorre, 2011) and emotional moderation (Gan, Lim, & Haw, 2016). According to the Mehrabian–Russell model (Mehrabian & Russell, 1974), emotions are affected by environmental stimuli eliciting reactions that are then reflected in behavior. Background music could therefore be used as a controllable environmental stimulus to influence consumer behaviors in retail as well as in food and beverage environments (North & Hargreaves, 2008). In fact, the manipulation of music parameters, such as genre, valence, tempo, rhythm, and volume has been demonstrated to influence consumer expenditure (Caldwell & Hibbert, 2002; Garlin & Owen, 2006; Milliman, 1982; North & Hargreaves, 1998; North, Shilcock, & Hargreaves, 2003; Wilson, 2003), purchase choices (Areni & Kim, 1993; North, Hargreaves, & McKendrick, 1999; Yeoh & North, 2010), emotional responses to waiting times (Grewal, Baker, Levy, & Voss, 2003; Hui, Dube, & Chebat, 1997), overall evaluation of the establishment (Demoulin, 2011; Grewal et al., 2003; North & Hargreaves, 1996), and approach-avoidance behaviors (Demoulin, 2011; Liu & Jang, 2009).
However, the correlation between approach behaviors and actual spending remain undetermined (Donovan, Rossiter, Marcoolyn, & Nesdale, 1994; Garlin & Owen, 2006, compared to Andersson, Kristensson, Wästlund, & Gustafsson, 2012; Milliman, 1982). Andersson and colleagues (2012) reported that customers had counter-intuitively exhibited approach behaviors, such as increased duration of stay when there was no background music. With the added complexity that music preferences differ substantially across individuals (Andersson et al., 2012; McNamara & Ballard, 1999) and context (Kaltcheva & Weitz, 2006; North, Hargreaves, & McKendrick, 2000), there may not be a one-size-fits-all solution for retail background music (Andersson et al., 2012).
As the restaurant management can control certain components of the environment (such as the scent, background music, and seating arrangement), restaurateurs are constantly looking for ways to attract and increase customers expenditure (Milliman, 1986). Contextual cues from the environment or from the product itself can moderate the effects of music genre on consumer behavior. Congruent cues to music genre could reinforce the effect of the music genre and vice versa. For instance, North and colleagues (1999) found French music in a supermarket to lead to higher sales for French wine while playing German music led to higher sales for German wine.
Further research showed that playing classical background music in food and beverage environments could lead to increased spending (Caldwell & Hibbert, 2002; North & Hargreaves, 1998; North et al., 2003; Wilson, 2003) and induce pleasant perception of food (Fiegel, Meullenet, Harrington, Humble, & Seo, 2014). Particularly, North and Hargreaves (1998) reported 3.7%, 18.8%, and 20.5% higher expenditure in classical background music than pop music, easy listening music, and no music conditions, respectively.
To study these effects, we chose cuisines that differed from the predominant ethnic cuisine in Singapore. 1 As of October 2017, there were 36,423 Japanese nationals living in Singapore (Japan–Singapore Relations [Basic Data], 2019). Although there are Hispanic nationals living in Singapore, there is no official data to their numbers on the island. Nonetheless, the numbers of both nationals constitute as minorities in the island which would reduce direct ethnic-bias of food based on the customer profiles.
Theoretical background and conceptualization
Music genre and sales
Japan has many different genres of music given its diverse culture, making it difficult for clear distinctions within its music (Tokita & Hughes, 2008). Over the years, Japanese music genres continued to vary, resulting in the use of historical periods in the labeling of the music composed or made popular within each period.
Latin music is associated to the languages and cultures of Latin roots, such as Spanish, Portuguese, and, at times, French (Jacqueline, 2013). The music influence has roots in the Maya, Aztec, and Inca societies that once dominated Central and South America. By the 20th century, many of the styles in Latin music had significant influence from the United States, resulting in genres such as the Latin pop and reggaeton. For ease of operation, Latin music in this study was restricted to the Spanish language.
Restaurant payment models
Previous studies on anxiety suggested that music may require up to 30 min of listening time to elicit measurable physiological response in human subjects (Gan et al., 2016; Hamel, 2001). Given the exposure time, it is expected that the effectiveness of background music in restaurants may be affected by the payment models.
Background music may elicit a less pronounced effect in restaurants that operate on a pay-first model, where customers order, pay, and then consume their meal. This would contrast with restaurants that operate on a pay-later model, where customers order, consume, and then pay for their meals. Customers in the former payment model would have shorter exposure time to the music that may influence the amount of the orders before payment.
Day types
Many consumers report experiencing higher positive affect and lower negative affect in weekends and weekdays, respectively (Ryan, Bernstein, & Warren Brown, 2010). Given that many select music to match their optimum levels of arousal (Berlyne, 1971), especially when seeking mood regulation (DeNora, 2001; Juslin & Västfjäll, 2008), there could be more pronounced effects of background music at the weekends if customers tend to be more relaxed than during the weekdays.
Hypothesis formation
Singapore is a vibrant cosmopolitan city and a food paradise with cuisines from all over the world made commonly available. To complement the intended ambience, many restaurants play background music that correspond to the theme they represent. Within the theme, many restaurateurs face the challenge in selection of the music genre. Traditional music may better convey the perception of authenticity and class while playing pop music may better convey the perception of youth and modernity (North & Hargreaves, 1998). So far, there is a dearth of empirical studies performed locally that examine the effects of music genre on sales. As such, this study aims to investigate the effects of different background music genres on customer spending at restaurants of different cultural themes, taking into consideration payment models (pay-first vs. pay-later) and day types (weekdays vs. weekends). The hypotheses are as follows:
H1: The genre of background music can influence aggregate restaurant sales.
H2: The genre of background music can influence aggregate sales differently in each restaurant branch of the same cultural theme.
H3: The effect of background music is moderated by the payment models that the restaurants adopt.
H4: Background music can have differing effects on weekdays and weekends.
Method
Sampling and participants
Two restaurant chains: Japanese-themed (Jp) and Mexican-themed (Mx), each with three branches (A, B, C suffix) were recruited via convenience sampling by a call for interested restaurants. All restaurant branches in the study were situated near train stations with similar accessibility. The locations and customer profiles of all the restaurant branches are described in Tables 1 and 2. Independent music from music distributor Express Melody Pte Ltd was used as the musical stimuli with the song lists in the conditions determined by the company (see Online Supplemental Material Table S10 for the song lists in the various conditions). The patrons of the restaurants were expected to be regular customers or of those working nearby the restaurant locale. The customer profiles were observations made by both the respective restaurant branch managers and by the researchers during visits.
Location and customer profile descriptions for each Japanese restaurant branch.
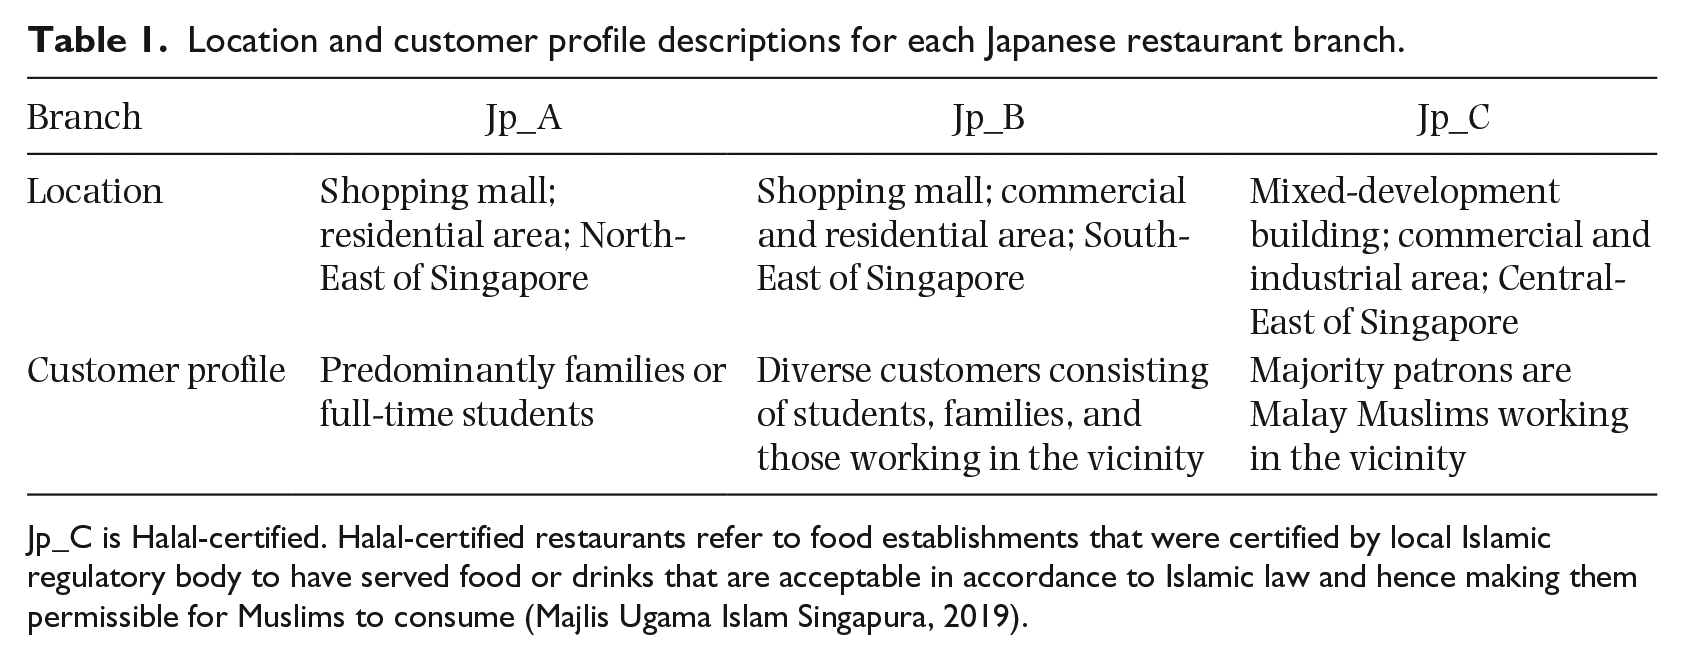
Jp_C is Halal-certified. Halal-certified restaurants refer to food establishments that were certified by local Islamic regulatory body to have served food or drinks that are acceptable in accordance to Islamic law and hence making them permissible for Muslims to consume (Majlis Ugama Islam Singapura, 2019).
Location and customer profile descriptions for each Mexican restaurant branch.

Mx_A is closed on weekends.
Japanese restaurants
The Jp restaurants served only Japanese food and beverages in all their branches (Jp_A, Jp_B, Jp_C). However, the Jp_C b ranch was Halal-certified and removed non-Halal items such as pork and alcohol from the menu. The Jp restaurants operated on the concept of kaitenzushi or conveyer-belt sushi where small portions of different food varieties are presented on color-coded serving plates, circulating on a carousel ready for diners to pick them off from the belt. The plates were in three pricing tiers, 1 to 3, with 1 being the least expensive and 3 as the most expensive. Diners would be charged at the end of their meals by the quantity and pricing of the plates they took (pay-later model). All three Jp restaurant branches had Japanese-inspired wall décor, crockery, and cutlery (chopsticks and spoon), with their staff (non-Japanese) dressed in traditional Japanese attires and greetings customers in Japanese.
Mexican restaurants
The Mx restaurants served only Mexican food and did not serve alcoholic beverages in any of the branches (Mx_A, Mx_B, Mx_C). Orders at the Mx restaurants are made over the counter and paid for prior as in fast food restaurants (pay-first) model. All three Mx restaurant branches had Mexican or Hispanic 2 décor. The staff were dressed in culturally neutral outfits. Mx_A branch operated only on weekdays while Mx_B and Mx_C branches operated throughout the week.
Materials, design, and procedure
Japanese pop and traditional genres were employed for the Jp restaurants to create three playlists that correspond to the three conditions: “pop,” “traditional,” and “mix.” Likewise, Latin pop and traditional genres were employed for the Mx restaurants. The “mix” condition is a control condition with equal numbers of pop and tradition music played at barely audible volumes since both restaurant chain operators refused a no music condition. Only instrumental-based music was employed for the Jp restaurant branches as requested by their operators to keep to regular customers’ familiarity, while music for Mx restaurants consisted of both vocal and instrumental songs. All the branches within the Jp and Mx restaurants would each share the same three music playlists each comprising of at least 40 songs with a total playtime of 100 min (see Online Supplemental Material Table S10 for the song titles in the various lists for both restaurant chains). A similarity between both Japanese and Latin music is the lack of distinction between folk and popular music (George, 2013). Given the lack of clear distinctions, the classifications used in this study followed album categories by the record companies where available. For songs that were ambiguous, the music in this study were classified as “traditional” by the company when they utilized obvious traditional instruments such as Japanese flute or Japanese string instruments for Japanese music classification. Songs that had clear obvious Western pop elements such as repeated chorus of two to three verses, were classified as pop. Instrumental versions of the music followed the musical elements of the original songs without vocals.
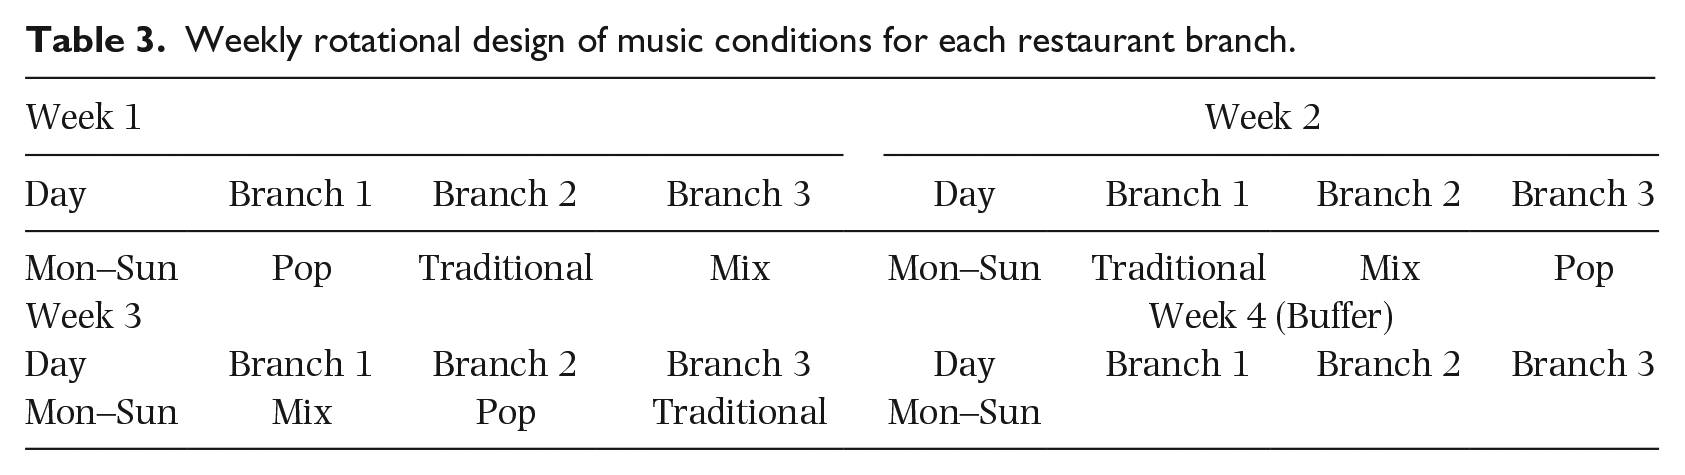
Each music genre condition was played in each restaurant branch for a whole week from Monday to Sunday. The experiments and data collection were performed over 3 weeks, with an additional fourth “buffer week” to provide contingent data for any missing day of the week. To counterbalance weather, seasonal, or festive effects, all restaurant branches played a different sequence of playlists concurrently, following a Latin Square design (see Table 3). All other aspects of the restaurant settings, such as lighting, temperature, and menu, remained unchanged within each restaurant. Although restaurants were asked to report any change in restaurant operations (such as large-scale functions) that may confound the experimental results, there were none reported in the study period. Restaurant operators agreed to operate normally, without in-house promotional offers during the period of study, and to refrain from informing their serving staff about the study.
Weekly rotational design of music conditions for each restaurant branch.
The restaurants were informed about the voluntary nature of the study with permission and non-disclosure agreements were signed. Random visits were made by the research team to ensure that conditions were consistent.
Measures
Daily expense data were collected by the respective restaurants through their point of sales systems. Jp restaurants provided daily data on the cups of tea sold, plates of the various tiers, and alcoholic drinks. Mx restaurants provided daily and hourly data on the number of transactions and total sales figures. Data collection took place in most of June and 3 days in early July 2019 for Jp restaurants, whereas it took place in July 2019 for Mx restaurants. Both restaurants supplied 3 weeks of historic data from April 2019 for baseline comparison.
Drink sales and transactions data were used to determine the headcount for Jp and Mx restaurants, respectively, and to derive the daily sales per customer (sales/pax) figures on top of daily total sales figures.
Results
The data were analyzed using RStudio Version 1.2.5001. All parametric assumption tests on the data indicated one or more violations. Thus, non-parametric analyses based on medians were conducted instead. All analyses on daily total sales figures were reported together with analyses on daily sales per customer figures.
H1: The genre of background music can influence aggregate restaurant sales
The highest daily total sales median for Jp restaurants (Figure 1) was observed for the “traditional” music condition, followed by “mix” and “pop.” The median for “traditional” was 19.6% and 35.6% higher than “mix” and “pop,” respectively, while it was 13.4% higher for “mix” than “pop.” The highest daily sales per customer median was observed for the “mix” music condition, followed by “traditional” and “pop.” The median for “mix” was 1.6% and 11.4% higher than “traditional” and “pop,” respectively, while it was 9.6% higher for “traditional” than “pop.”

Boxplots of Daily Total Sales (Left) and Daily Sales per Customer (Right) for Each Music Condition for Jp (Above) and Mx (Below) Restaurants.
For Mx restaurants (Figure 1), the highest daily total sales median was observed for the “mix” music condition, followed by “pop” and “traditional.” The median for “mix” was 6.2% and 8.2% higher than “pop” and “traditional,” respectively, while it was 1.9% higher for “pop” than “traditional.” The highest daily sales per customer median was observed for the “mix” music condition, followed by “pop” and “traditional.” The median for “mix” was 3.2% and 6.3% higher than “pop” and “traditional,” respectively, while it was 3.0% higher for “pop” than “traditional.”
Kruskal–Wallis analyses of variance (ANOVAs) were conducted to test for statistical differences in daily total sales and daily sales per customer between the “mix,” “pop,” and “traditional” music conditions for Jp restaurants as well as for Mx restaurants. We did not find significant differences, p > .05, for either of the restaurants (Table S1), thus H1 was rejected. Medians and interquartile ranges for these sales figures and their corresponding historic references are reflected in Tables S2 and S3 of Supplemental Materials online.
H2: The genre of background music can influence aggregate sales differently in each restaurant branch of the same cultural theme
Within the Jp restaurants (Figure 2), each branch largely had a different music condition where the daily total sales and daily sales per customer medians were the highest. Specifically, the music condition with the highest daily total sales median was “pop” for Jp_A, “traditional” for Jp_B, and “mix” for Jp_C, while the highest daily sales per customer median was observed for “mix” for Jp_A, and “traditional” for Jp_B as well as Jp_C. The Kruskal–Wallis ANOVA showed that the differences between the music conditions were not significant for daily total sales for Jp_A, χ2(2) = 0.36, p = .834; Jp_B, χ2(2) = 3.27, p = .195; and Jp_C, χ2(2) = 2.29, p = .318, as well as for daily sales per customer for Jp_A, χ2(2) = 1.49, p = .474; Jp_B, χ2(2) = 1.92, p = .383; and Jp_C, χ2(2) = 0.72, p = .698.

Boxplots of Daily Total Sales (Left) and Daily Sales per Customer (Right) for Each Music Condition for Jp Restaurant Branches A, B, and C (Above) and Mx Restaurant Branches A, B, and C (Below).
Within the Mx restaurants (Figure 2), each branch had a different music condition where the daily total sales and daily sales per customer medians were the highest. Specifically, the music condition with the highest daily total sales median was “mix” for Mx_A as well as Mx_B, and “traditional” for Mx_C, while the highest daily sales per customer median was observed for “mix” for Mx_A, “pop” for Mx_B, and “traditional” for Mx_C. The Kruskal–Wallis ANOVA showed the differences between the music conditions were not significant for daily total sales for Mx_A, χ2(2) = 2.16, p = .340; Mx_B, χ2(2) = 0.16, p = .925; and Mx_C, χ2(2) = 0.03, p = .985, as well as for daily sales per customer for Mx_A, χ2(2) = 2.54, p = .281; Mx_B, χ2(2) = 0.56, p = .754; and Mx_C, χ2(2) = 0.42, p = .809.
No signficant differences (p > .05) in daily total sales and daily sales per customer were observed for each branch for Jp and Mx restaurants when compared to their corresponding historic reference data.
Since no significant differences were observed for background music effects on daily total sales and daily sales per customer over all restaurants of the same cultural theme, or for any of the branches, H2 and H1 were rejected.
H3: The effect of background music is moderated by the payment models that the restaurants adopt
To test for H3, two-way aligned ranks transformation ANOVAs were conducted to compare the differences in standard deviations of percentage median deviations in daily total sales and daily sales per customer between the pay-first model (Mx restaurant) and the pay-later model (Jp restaurant), as well as between the “pop,” “mix,” and “traditional” music conditions. The standard deviation scores were first derived by normalizing all deviations in daily total sales and daily sales per customer into percentage deviations (percent median deviations) for each music condition for every restaurant branch. Standard deviations were then obtained based on the corresponding percent median deviations for each music condition for every restaurant branch (Figure 3).
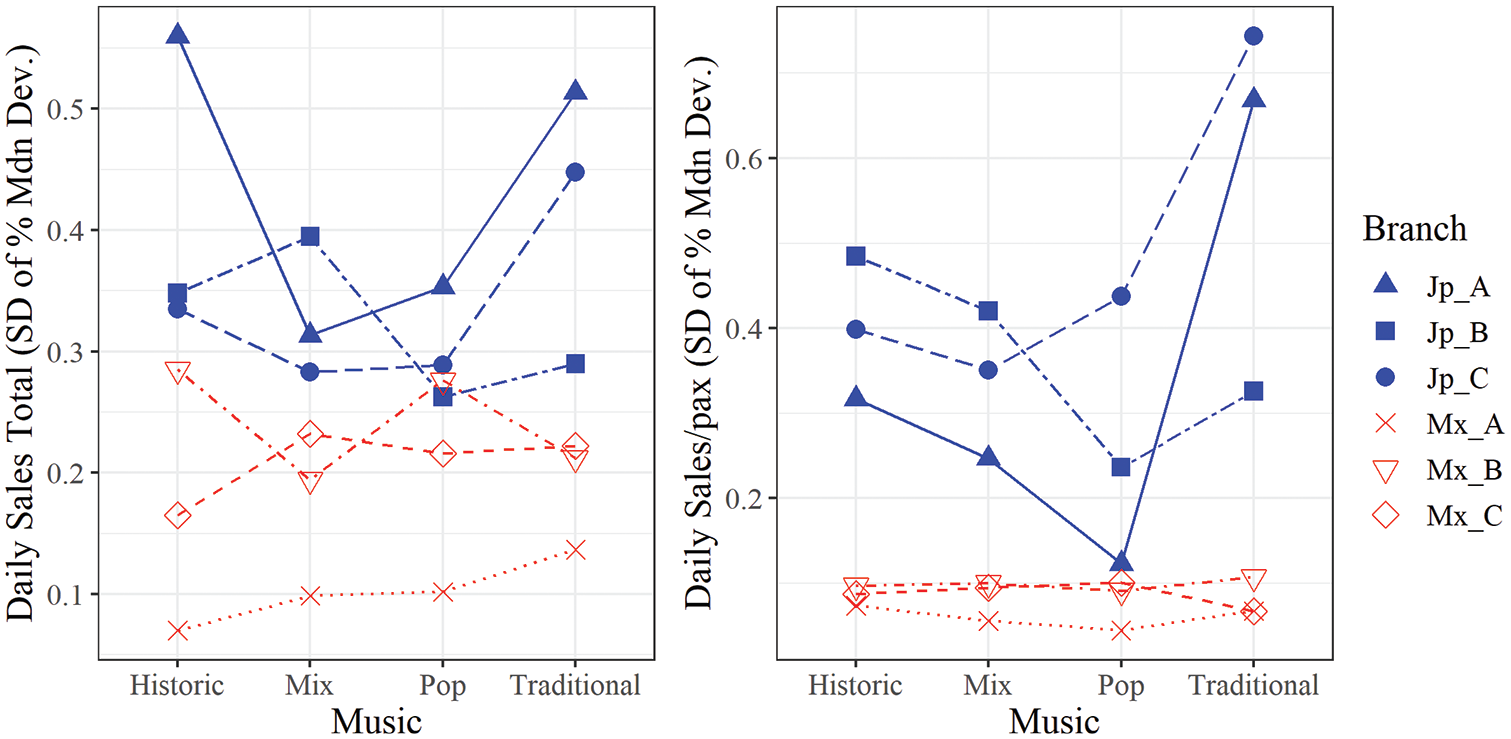
Standard Deviation of Percent Median Deviations in Daily Total Sales (Left) and Daily Sales per Customer (Right) for Each Music Condition for Pay-First Model (Mx_A, Mx_B, Mx_C Restaurant Branches; Red) and Pay-Later Model (Jp_A, Jp_B and Jp_C Restaurant Branches; Blue).
Results from the two-way aligned ranks transformation ANOVAs (Table 4) indicated that there were signficant main effects (p < .001***) for payment models in which the pay-first model (Jp resutraunts) had significantly higher standard deviations of percent median deviations in daily total sales and daily sales per customer than pay-later model (Mx resutraunts). However, no significant main effects (p > .05) for music conditions and no significant interaction effects (p > .05) between payment models and music conditions were observed.
Two-way aligned ranks transformation ANOVAs on standard deviations of percent median deviations in daily total sales and daily sales per costumer for music conditions and payment models.

Music Conditions refer to comparison between the “pop,” “mix,” and “traditional” music conditions. Payment Models refer to comparison between the pay-later model (Jp restaurant) and pay-first model (Mx restaurant). Music Conditions with Historic refer to comparisons between the music conditions and the corresponding historic reference.
p < .05. **p < .01. ***p < .001.
Comparisons between the music conditions as a single factor and its corresponding historic data were also conducted. Results from the two-way aligned ranks transformation ANOVAs (Table 4) on the standard deviations of percent median deviations indicated that significant main effects (p < .001) for payment models were observed for daily total sales and daily sales per customer. However, no significant main effects (p > .05) for music conditions and no significant interaction effects (p > .05) between the payment models and music conditions were observed.
Since no significant main effects for music conditions and interaction effects between payment models and music conditions were observed, H3 was thus rejected.
H4: Background music can have differing effects on weekdays and weekends
For Jp restaurants on weekdays (Figure 4), the highest daily total sales median was observed for “traditional” music condition, followed by “pop” and “mix.” The median for “traditional” was 17.0% and 18.6% higher than “mix” and “pop,” respectively. On weekends, the highest daily total sales median was observed for the “mix” music condition, followed by “traditional” and “pop.” The median for “mix” was 3.3% and 83.7% higher than “traditional” and “pop,” respectively.

Boxplots of Daily Total Sales (Left) and Daily Sales per Customer (Right) for Each Music Condition on Weekdays and Weekends for Jp Restaurants (Above) and Mx Restaurants (Below).
The highest daily sales per customer median for Jp restaurants on weekdays was observed for “pop” music condition, followed by “mix” and “traditional.” The median for “pop” was 0.4% and 9.3% higher than “mix” and “traditional,” respectively. On weekends, the highest daily sales per customer median was observed for “traditional” music condition, followed by “mix” and “pop.” The median for “traditional” was 48.3% and 72.2% higher than “mix” and “pop.”
For Mx restaurants on weekdays (Figure 4), the highest daily total sales median was observed for the “mix” music condition, followed by “pop” and “traditional.” The median for “mix” was 0.1% and 0.8% higher than “pop” and “traditional,” respectively. On weekends, the highest daily total sales median was observed for “pop” music condition, followed by “traditional” and “mix.” The median for “mix” condition were 2.8% and 3.4% higher than “traditional” and “pop,” respectively.
The highest daily sales per customer median for Jp restaurants on weekdays was observed for “traditional” music condition, followed by “pop” and “mix.” The median for “traditional” was 0.1% and 1.4% higher than “pop” and “mix,” respectively. On weekends, the highest daily sales per customer median was observed for “pop,” followed by “mix” and “traditional.” The median for “pop” was 1.7% and 6.2% higher than “mix” and “traditional,” respectively.
Two-way aligned ranks transformation ANOVAs were conducted to determine for any statistical differences in daily total sales and daily sales per customer between weekdays and weekends as well as between the “pop,” “mix,” and “traditional” music conditions.
The results on daily total sales (Table 5) indicated that there were no significant main effects (p > .05) for day types as well as music conditions for Jp restaurants and Mx restaurants. Also, no significant interaction effect (p > .05) between day types and music conditions was observed. Finally, when compared to the corresponding historic reference data, no significant differences (p > .05) were observed. The results on daily sales per customer indicated that although there were no significant main effects (p > .05) for day types as well as music conditions for Jp restaurants, significant interaction effect between day types and music conditions, F(2, 57) = 4.84, p = .011*, was observed. However, post hoc Tukey contrasts did not show any significant diferences (p > .05) between each music condition and day type pairs. There was significant main effect for day types, F(1, 51) = 23.30, p < .001***, for Mx restaurants with signficantly higher daily sales per customer observed on the weekend than on weekdays. However, no significant main effect (p > .05) for music conditions and no significant interaction effect (p > .05) between day type and music conditions were observed. This suggests that daily sales per customer was generally higher on weekends regardless of the music conditions (Figures 4 and 6). When compared to the corresponding historic reference data, no significant differences (p > .05) were observed.
Two-way aligned ranks transformation ANOVAs on daily total sales and daily sales per customer for music conditions and day types for Japanese restaurants and Mexican restaurants.

Music conditions refer to the comparison between the “pop,” “mix,” and “traditional” music conditions. Day types refer to the comparison between weekdays and weekends. Day types analysis for Mx restaurants exclude Mx_A as it was closed on weekends.
p < .05. **p < .01. ***p < .001.
Since no significant main effects for music conditions and interaction effects between day types and music conditions were observed, H4 was thus rejected. Other observations are shown in Online Supplemental Material Tables S4 to S7.
Exploratory analyses
Kruskal–Wallis ANOVAs were conducted on daily total sales and daily sales per customer for “food only,” individual tiers of plates, and alcohol for Jp restaurants, as well as on lunch and dinner sales for Mx restaurants. The results indicated no significant differences for the various music conditions on the aforementioned variables for Jp restaurants and Mx restaurants (Supplemental Material Table S1 online), as well as for each restaurant branch (Supplemental Material Table S8 online).
Results from two-way aligned ranks ANOVA on music conditions and meal times (lunch vs. dinner) for Mx restaurants indicated that lunch total sales were significantly higher than dinner total sales, F(1, 108) = 5.55, p = .020, whereas lunch sales per customer were significantly lower than dinner sales per customer, F(1, 108) = 38.67, p < .001. These observations were consistent with further two-way aligned ranks ANOVAs conducted with the historic reference data on total sales, F(1, 220) = 6.87, p = .009, and sales per customer, F(1, 220) = 84.74, p < .001. However, no significant main effects for music conditions and interaction effects between music conditions and meal times were observed (p < .05).
Weekly sales patterns
Across the Jp restaurant branches, there were increments in total sales on Thursdays, especially for the “traditional” music condition, and increments in sales per customer for “traditional” condition on weekends (Figure 5). Generally, total sales were higher on Wednesday and Thursday across all music conditions, compared to historical baseline data, and higher on Friday for “traditional” condition only. Median sales figures and percentage comparisons between music conditions are reflected in Table S9 of Supplemental Materials online.

Daily Total Sales (Above) and Daily Sales per Customer (Below) in a Week for Each Music Condition for Jp_A, Jp_B, and Jp_C Restaurant Branches.
For Jp_A restaurant branch, alcohol total sales were higher for the “traditional” music condition than “pop” and “mix” on Tuesday, Thursday as well as Friday (Figure 6). For Jp_B restaurant branch, alcohol total sales were higher for the “traditional” music condition than “mix” and “pop” on Tuesday as well as Wednesday. However, alcohol total sales were higher for the “pop” music condition than “traditional” and “mix” on Thursday (Figure 6).
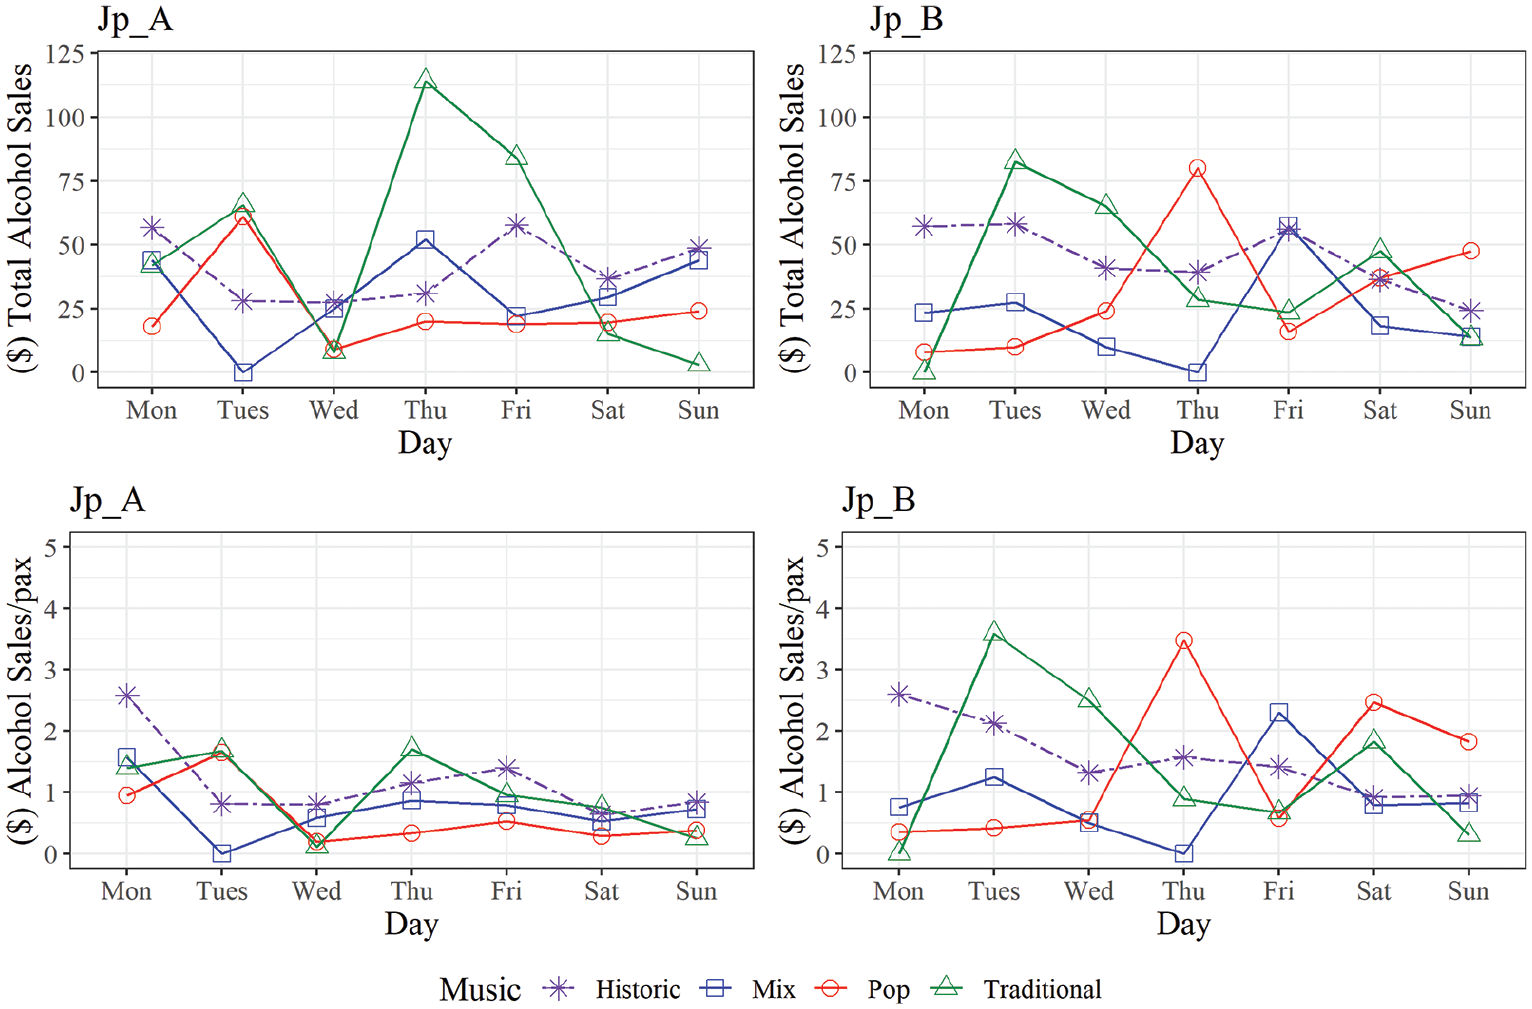
Daily Total Alcohol Sales (Above) and Daily Alcohol Sales per Customer (Below) in a Week for Each Music Condition for Jp_A and Jp_B Restaurant Branches. No Alcohol Sales Data Available for Jp_C Restaurant Branch as It Did Not Serve Alcohol.
Across the Mx restaurant branches, sales per customer were consistently higher on weekends. Also, it was generally higher for Mx_B and lower for Mx_C than Mx_A (Figure 7).
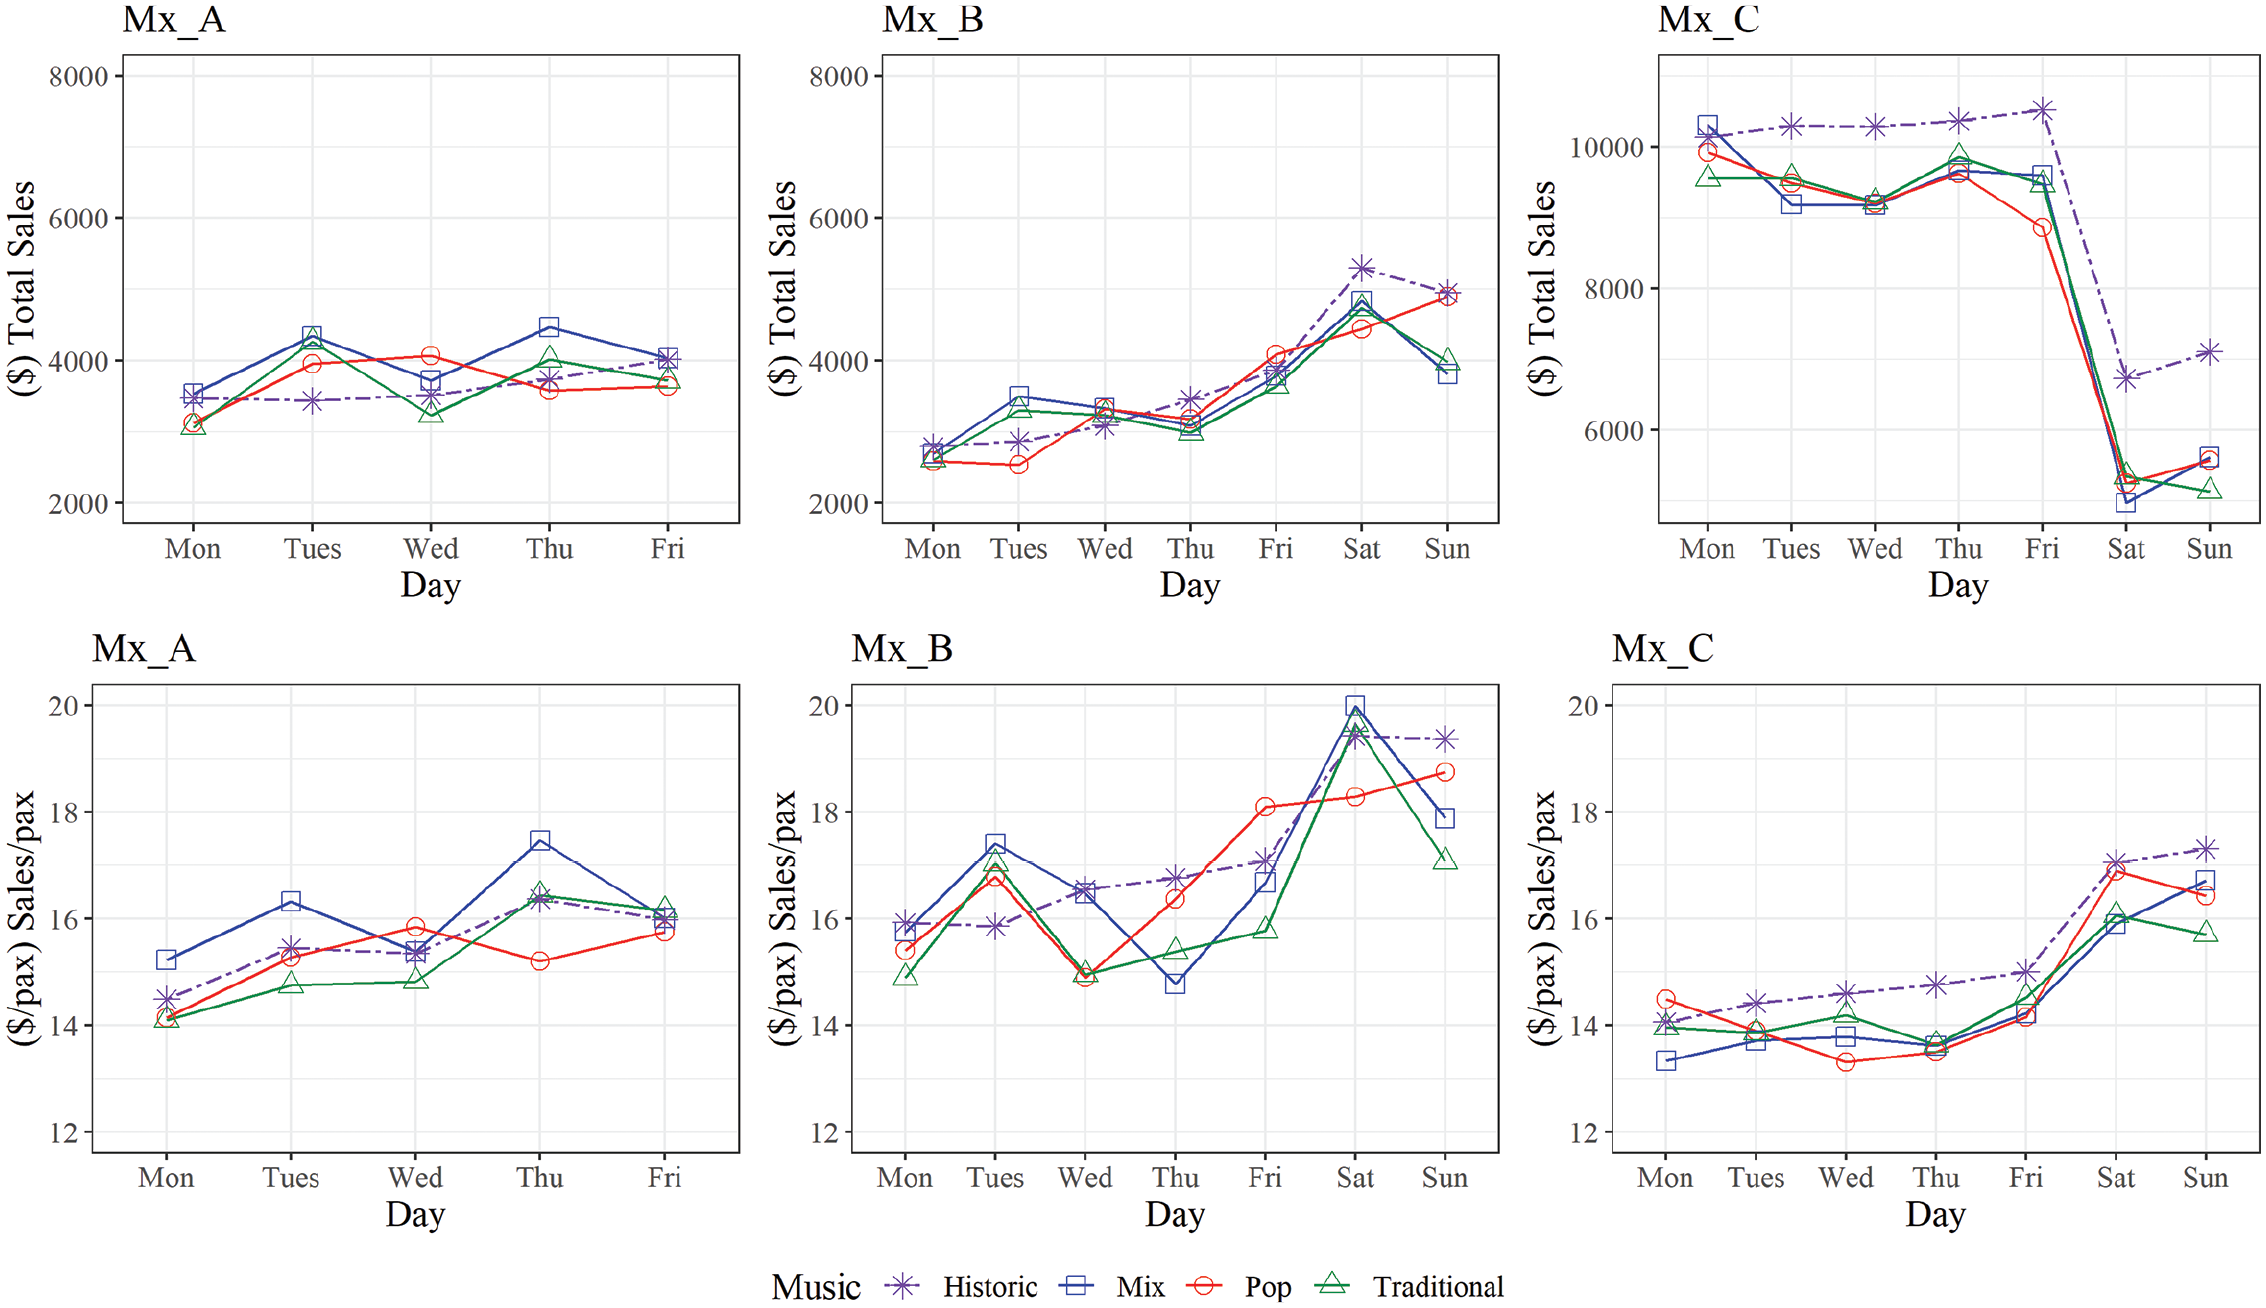
Daily Total Sales (Above) and Daily Sales per Customer (Below) in a Week for Each Music Condition for Mx_A, Mx_B, and Mx_C Restaurant Branches.
For the Mx_A restaurant branch, sales per customer were higher for the “mix” condition and was lower on Thursday for the “pop” condition. For the Mx_B restaurant branch, total sales were lower on Sunday for “mix” and “traditional” conditions, and lower on Tuesday for “pop” music condition. Sales per customer were comparatively lower on Wednesday and Saturday for “pop” music condition, lower on Thursday for “mix” music condition, and lower on Wednesday, Thursday, Friday, and Sunday for “traditional” music condition. For the Mx_C restaurant branch, there were decrements in total sales across all music conditions from the weekdays to the weekends despite increased sales per customer.
Discussion
In this study, the effects of background music on sales were examined in Jp and Mx restaurant branches. There were no significant effects of background music genre on aggregate sales by restaurants (H1), their branches (H2), payment models (H3), as well as day types (H4).
The sales per customer was highest in both Jp and Mx restaurants for the “mix” music condition suggesting that customers ordered more food per pax when the background music was softer, given that the volume was lower for “mix” rather than in the other two conditions. It is possible that customers stayed longer or ate more in quieter conditions. As a densely populated urban country (Worldometers, 2019), with 92% of the working population reporting high stress (8% higher than the global average; Cigna, 2019), lower volumes may appeal Singapore-based customers reflecting a desire for conversation facilitated by lower background music volumes (Michel, Baumann, & Gayer, 2017).
There were no unanimous sales patterns among the restaurant branches. While the effects of music were not significant, we noticed trends where daily total sales and sales per customer were higher for “traditional” music condition than for “pop” in Jp_A and Jp_B but not in Jp_C restaurant branches (Figure 2). This suggest preferences and effects due to customer profile differences as Jp_C was the only branch distinct from the other two branches (Table 1). The different customer profiles may appraise Japanese music differently. Jp_A and Jp_B customers (comprising of majority Singaporeans of ethnic Chinese origin) were likely to be more familiar with Chinese language, appreciating it differently from Jp_C patrons, given the similarities between learning the Chinese and Japanese languages (Wharton, 2005).
Given the payment model, the design of Mx restaurant might not allow for sufficient exposure to music. Since music may require up to 30 min to take effect (Gan et al., 2016; Hamel, 2001), the Jp restaurant sales may be more influenced by background music than Mx restaurants (Figure 2).
In relation to H2 for both Jp and Mx restaurants, the differences in sales magnitude could only be attributed to the restaurant type and not background music effects or interactions between background music and restaurant type. The higher consistency in sales for Mx restaurant is likely to be due to their customers’ consumption consistency, where re-queuing (less frequent in fast food models) would be registered as a new customer.
In relation to H3, the music conditions had no significant interaction with day types for Jp restaurant on sales per customer. Nonetheless, trends from Figures 4 and 5 indicated that sales per customer for the “traditional” condition were much higher than for the “pop” and “mix” conditions only on the weekends. However, this pattern was different from Figures 1 and 2, possibly accounted by variation in spending per customer (Figure 3). It is possible that the high expenditure occurred for “traditional” condition only on the weekends within Jp_A and Jp_C and not Jp_B (Figure 5). This may be due to the patrons seeking congruent conditions during the more stressed workdays. Another possibility is that the “traditional” music might be associated with reduced orders of Japanese tea, inflating the expenditures per customer since tea orders were used as indicators of headcount in our analysis. The latter is more likely as inspection of the raw data showed lower customer headcounts on the days of interest.
For Mx restaurants, sales per customer differed only between weekdays and weekends (Figures 4 and 7) with no notable music interaction effect. This difference is possibly due to the customer profile differences between weekdays and weekends. Spending per transaction is higher on weekends when in a fast food chain model, a single person makes purchases on behalf of a group, whereas single patrons or smaller groups are the observed dominant patrons during weekday lunch breaks. This proposal lends support from our findings that lunch total sales were higher than dinner total sales, but lunch sales per pax transaction was lower than dinner sales per pax transaction.
The drop in total median sales for Mx_C on the weekends compared to weekdays (Figure 7) did not significantly affect aggregate daily total sales (Figure 4). However, the difference in sales for Mx_C highlights the importance of differentiating weekday and weekend sales, which can also be explained by customer profiles (Table 2). Business would thrive on workdays in a commercial area with a main customer base consisting of employees in the vicinity. While Mx_A and Mx_C had similar environments, Mx_A was not open on weekends.
Apart from the rejected hypotheses, there were notable observations such as the different sales patterns across restaurants over each week. For Jp restaurants (Figure 5), both Jp_A and Jp_C restaurant branches had lower total sales in the “traditional” music condition on weekends but generally high sales per customer. Jp_A and Jp_B did report higher sales per customer on weekdays for “mix” condition, probably because the lower background music volume appealed to customers on a busy workday. On Thursday, all three restaurant branches shared a surge in total sales, but sales per customer only surged on Thursday for Jp_B and Jp_C for unknown reasons.
On alcohol sales, we did not find any sales patterns due to music effects (Figure 6) contrary to previous reports where low tempo instrumental background music increased staying duration and alcoholic consumption (Milliman, 1986). While tempo correlates with arousal (Berlyne, 1971), and arousal negatively correlates with pleasure (Demoulin, 2011), people tend to stay longer when lower tempo music is played because it is less arousing and more pleasurable (for review, see North, Hargreaves, & Krause, 2009). As pleasure does not necessarily predict sales (Andersson et al., 2012), this may explain our lack of observed effect in our study. Given that the songs in each playlists were played randomly, there are also unlikely effects from stretches of slow or fast tempo songs being a major factor in our study.
Limitations and future directions
The study aimed to be minimally disruptive and yet ecologically valid, using observation data in volunteering restaurants. As a result, many parameters such as tempo of music, emotion elicited by the music, lyrics (the Japanese restaurant requested instrumental only), and even the customer profiles could be investigated in future studies. For the Japanese restaurants, the patron headcounts were approximated, and observations of outliers on sales per customer for Jp restaurants probably reflected tea being refused, resulting in inflated sales. Also, data collection was restricted to the conveyer plates, and did not include food and drink orders through the à la carte menu, which could result in bias. For Mx restaurants, delivery sales were included in their recorded data and could not be easily separated even though the delivery orders were consistent among the branches.
We were unable to capture effects over a longer period for each condition or establish customers’ enjoyment, congruency, arousal, and spending intentions. Future studies would aim to include these variables.
In this study, the volume of music emerged as a possible factor, and this may be investigated, especially in the light of where previous research found that low volume background music/noise (as compared to no music or high volume) increased healthy food sales, whereas high volume background music/noise increased unhealthy food sales (Biswas, Lund, & Szocs, 2019). Since the above results suggest that softer background music increased spending, confirming its effects would be of interest to those in the retail industry.
Conclusion
This study sought to investigate background music genre effects on food sales but found no significant effects on the Japanese and the Mexican restaurants. Detailed analysis suggest that the use of a low volume music of mixed pop and traditional music may support customer expenditures in certain restaurant branches. Also, sales patterns were different between weekdays and weekends, suggesting that tailoring the environment to specific customer profiles would be required for sales optimization.
Supplemental Material
Supplemental_material – Supplemental material for The sound of music on the pocket: A study of background music in retail
Supplemental material, Supplemental_material for The sound of music on the pocket: A study of background music in retail by Bryan Jun-Keat Choo, Thai-Shawn Cheok, David Gunasegaran, Kum-Seong Wan, Yuan-Sheng Quek, Clare Shu-Lin Tan, Boon-Kiat Quek and Samuel Ken-En Gan in Psychology of Music
Footnotes
Acknowledgements
This work was partially supported by the Science & Engineering Research Council (SERC) Strategic Funds from the Agency for Science, Technology, and Research (A*STAR), Singapore. We thank Express Melody Pte Ltd for providing the background music free of charge. We thank the restaurants that provided the data for this study.
Author contributions
B.J.-K.C. drafted the manuscript. B.J.-K.C. and T.-S.C. drafted the ethics exemption document and executed the experimental procedures. T.-S.C. and Y.-S.Q. laid the groundwork for the project. D.G. performed the statistics. K.-S.W., C.S.-L.T., and B.-K.Q. cross-checked the statistics and provided guidance and suggestions in writing and analysis. S.K.-E.G. conceived the idea and supervised all aspects of the project and writing. All authors read and approved the final manuscript.
Declaration of conflicting interests
The author(s) declared no potential conflicts of interest with respect to the research, authorship, and/or publication of this article.
Funding
The author(s) disclosed receipt of the following financial support for the research, authorship, and/or publication of this article: This work was partially supported by the Science & Engineering Research Council (SERC) Strategic Funds from the Agency for Science, Technology, and Research (A*STAR), Singapore.
Ethics approval
We obtained exemption by the Institutional Review Board for the Agency of Science, Technology and Research (A*STAR IRB; reference number: 2018-004).

Supplemental material
Supplemental material for this article is available online.
Notes
References
Supplementary Material
Please find the following supplemental material available below.
For Open Access articles published under a Creative Commons License, all supplemental material carries the same license as the article it is associated with.
For non-Open Access articles published, all supplemental material carries a non-exclusive license, and permission requests for re-use of supplemental material or any part of supplemental material shall be sent directly to the copyright owner as specified in the copyright notice associated with the article.
