



Abstract
The present research seeks to develop a scale that can measure attitudes toward different musical expressions representative of different social groups, such as the Andean and Afro-Peruvian groups. The participants were 312 individuals between 18 and 83 years of age (M = 32.42, SD = 14.97), and the majority had no professional musical knowledge. First, Exploratory Factor Analysis was performed using the Unweighted Least Squares as the extraction method and using Oblimin rotation for the Andean and Afro-Peruvian musical genres. An identical factorial structure with two dimensions was found for both musical genres, obtaining optimal reliability according to Cronbach’s alpha coefficients. This similarity was verified by performing an invariance analysis, obtaining evidence that the proposed scale can be used regardless of the musical genre. Furthermore, correlation analyses were performed between the dimensions of the attitudes scale and variables such as stereotypes (toward the Andean and Afro-Peruvian social groups) and conservative ideology; the results provided evidence of discriminant validity. Finally, comparisons were made between musicians and non-musicians using the same dimensions of the attitude scale as evidence for criterion validity. The results are discussed based on scale’s optimal psychometric functioning, as well as its implications at the level of intergroup dynamics.
Keywords
Music as a cultural expression is an element present in people’s everyday lives, and psychology has attempted to study its effects on those producing it, those who are playing it, and those who consume it. However, studies addressing the appreciation of music based on psychosocial criteria such as its origin (groups that produce it) or the identification it elicits (groups that consume it) are scarce. In this sense, the objective of this study is to construct and develop a scale that measures attitudes toward different musical genres representative of different social groups.
In social psychology, attitude is understood as the disposition of the individual to value a particular entity in a certain way (Albarracin & Shavitt, 2018). This disposition results from the evaluation of the stimulus moving along a continuum of agreement (in favor) or disagreement (rejection; Ajzen, 1989). In this way, attitude can be conceptualized as the experience of thoughts and/or negative or positive feelings (generalized and lasting) of an individual toward some object, event, or person (attitudinal object; Maio et al., 2003). Different models seek to explain this construct, one of the best known being the three-component model. Specifically, this model is composed of the emotional aspect (feelings associated with the attitudinal object), the cognitive aspect (beliefs or information that the person has about that object), and the behavioral aspect (which involves the person’s intention to perform some behavior specifically associated with the object; Maio et al., 2019).
This psychological construct has various functions in people’s lives, with the following three being the most relevant in their study: (1) knowledge, (2) instrumentality, and (3) expression of values (Ajzen, 1989; Maio et al., 2019; Wood, 2000). The knowledge function refers to the fact that attitudes help in organizing and structuring information that we have, thus satisfying the need to have a clear and meaningful view of the world. For its part, the instrumental function seeks to satisfy a hedonic need where one wants to fulfill the desired objectives (obtain rewards) and avoid the undesired (avoid punishment). Finally, the third function, value-expressive, seeks to express elements important to the person’s identity. Being able to manifest attitudes allows people to show who and how they are and thus be able to identify with those people and/or groups with whom they share similar attitudes. The latter is relevant since this function of attitudes would contribute to satisfying the basic need for group acceptance and belonging (Hogg & Vaughan, 2018). Based on the above, attitudes toward different objects and, in this case, toward music could have an important role in the way people relate and how they construct their identity.
Music can be understood in different ways depending on the discipline or subject of study. Within psychology, the conceptualizations of the term revolve around three major areas: cognitive, emotional, and social (Hargreaves & North, 1999; North & Hargreaves, 2008). Regarding the first area, studies seek to understand how music can influence processes such as memory and learning (Ferreri & Verga, 2016). In the second case, they focus on how this artistic element can have an impact at the affective level, that is, which emotions and moods are caused by different types of music and how these are related to emotional regulation (Swaminathan & Schellenberg, 2015). Finally, the last area focuses on studies associated with identity aspects and interpersonal and intergroup relations (Bodner & Gilboa, 2009) that are the focus of interest of this research.
Although there are already several studies that provide information on the topics presented earlier, there are two elements that have received little attention: the study of “non-musicians” and the perception or assessment of musical stimuli as an element related to a social group. In the case of the first aspect, most studies focus on researching people who dedicate themselves to the music profession, either in composing or performing music, music teachers, or music students. There is empirical evidence that indicates that the attitude toward an object can be influenced by one’s information on the object, either in terms of emotional valence or intensity (Davidson, 1995; Fabrigar et al., 2006). Thus, some factors may contribute to the construction of musical preferences. Some of these are the exposure or familiarity of the musical stimulus, the complexity of the music (elements such as tempo, tonality, etc.), as well as musical training (Kuhn, 1980). Under this premise, musicians may form their impression or evaluation of a musical stimulus from information that people without musical training would not have. For example, there is evidence that the aesthetic response to different musical genres is different between musicians and non-musicians, causing the evaluation of music to be different (Dekaney et al., 2010). Therefore, it is possible to think that each person (musician or non-musician) develops his or her attitudes toward the musical genre based on different elements.
For this, it is important to have a measurement scale that can identify the degree of liking/disliking musical genres representing different social groups, as well as the components that characterize these levels of liking/disliking. The first component to consider is directly related to what we understand every day as taste and interest. In this sense, a person could perceive a musical genre positively if it is attractive and if they enjoy it in different listening settings (North & Hargreaves, 2007; Pacheco et al., 2017). A second component to consider, called “relative consumer status,” is whether the musical genre evaluated is socially accepted or appreciated by different people insofar as it represents musical “good taste” defined based on socially regulated criteria (e.g., the status of the group that produces the music and/or status of the people who consume it; Hargreaves, 1982; Harwood, 2017). Finally, the third component to consider is whether the musical genre could represent the image of a social group (ethnic or national) while inducing feelings of pride and identification in the consumer (Bodner & Bergman, 2017; Pacheco et al., 2017). This last criterion may not be directly associated with why people may or may not like certain music on a day-to-day basis, but some studies relate it to various elements of group representation and national pride (Pacheco, 2019; Pacheco et al., 2017; Tedesco, 2011).
In general, the inclusion of these components is relevant since there are musical genres that are socially or culturally more accepted and valued than others (Hargreaves et al., 2002; Tekman & Hortaçsu, 2002). This differentiation in acceptance may be occurring due to the association between the musical genre and the group that composes, performs, and/or consumes it. For example, if people of high-class social status tend to listen to a certain musical style, this genre is probably more valued and generally accepted by society. In contrast, if a musical genre is listened to by socially marginalized or low-status people, those musical styles could be devalued by being associated with that particular group (Pacheco et al., 2017; Tekman & Hortaçsu, 2002).
However, an inverse process could also occur where the positive characteristics and qualities of the musical genre are recognized, which could help reduce the negative stereotype and prejudice toward the groups that this music represents (Bodner & Gilboa, 2009; Miranda & Gaudreau, 2018). The processes described could be understood as forms of intergroup contact indirectly mediated by music. Regarding this, several studies explain how listening to music associated with a social group different from one’s own (music from another ethnic group or another country) may be an element that helps to minimize negative stereotypes and hostile intergroup emotions that are the basis of conflicts; however, music could also expand the level of tolerance and empathy toward the outgroup (Bodner & Bergman, 2017; Bodner & Gilboa, 2009; Harwood, 2017; Miranda & Gaudreau, 2018). In this context, knowing how certain musical genres are appreciated could help to better understand the study of intergroup relationships through music in contexts of social and cultural diversity such as Peru.
In Peru, there are various musical genres, many of which are related to specific sociocultural groups. For this study, two genres of interest are Andean music and Afro-Peruvian music. Both musical genres are considered representative of Peruvian “national” music but historically have not always been positively valued due to the status of the social groups they represent (Pineau & Mora, 2011; Rohner, 2013). It is only recently that this music is going through a process of renewed appreciation through various sociocultural projects promoted by different institutions in the country. Interestingly, the appreciation of these musical genres could be more linked to the characteristics of Andean and Afro-Peruvian social groups rather than to the properties of the music itself (Pacheco, 2019; Pacheco et al., 2017). Research on intergroup relations shows evidence that both groups are perceived as having negative attributes linked to low-social status (Espinosa et al., 2007; Pancorbo et al., 2011); therefore, taking into account the above, the attitude toward the musical genres produced by these groups could also be negative.
For these reasons, having a psychometric instrument that is capable of measuring attitudes toward different musical genres could be very useful to continue investigating intergroup processes and dynamics. There are only a few scales designed to measure attitudes toward music genres between non-musicians (Bonneville-Roussy et al., 2017; Kristen & Shevy, 2013; Shevy, 2008), so the development of new instruments remains relevant to capture different components of music genres attitudes and the growth of the psychology of music (Shevy, 2008). Within the literature, most studies focus only on the preference of certain music genres. Although to a lesser extent, there is a group of studies focused on developing instruments centered on the image of the group associated with the musical genre as an attitudinal component. For example, Shevy’s (2008) research focuses on the image projected by the preference for the musical genre. However, there are a few instruments focused on capturing, in addition to the taste and preference for the musical genre, the image that the musical genre projects of broader groups such as the national group.
Thus, the present research seeks to develop and construct a scale that measures attitudes toward different musical genres representative of different social groups in Peru and to review their psychometric properties. In this sense, the following specific objectives are proposed: (1) to carry out an Exploratory Factor Analysis (EFA) to review the construct validity, (2) to perform a relationship analysis of variables between the dimensions found in the factorial solution and indicators of intergroup processes such as stereotyping and ideology as evidence of discriminant validity, and (3) to compare the dimensions of attitudes between those who are musicians and non-musicians as evidence of criterion validity.
Method
Participants
The sample was composed of 312 people between 18 and 83 years of age (M = 32.42, SD = 14.97), comprising 37.8% men and 62.2% women. The participants, in their majority, had university education (70.2%) and postgraduate studies (15.1%). Likewise, the majority were from a socioeconomic status self-perceived as medium (53.8%), followed by a medium-high (24.7%) and medium-low (16.3%). Additionally, the sample was also divided into two groups: musicians (20.2%) and non-musicians (79.8%).
Ethical considerations
This study is part of a project on music, dance, and empathy approved under decision No. 027-2018/CEI-PUCP by the Ethics Committee for Research of the Pontifical Catholic University of Peru (Pontificia Universidad Católica del Perú). Procedurally, the contents evaluated by the questionnaires do not address sensitive issues that may pose a risk to the health and physical and mental well-being of the participants. Before administering the questionnaires, the participants signed the informed consent of this study, where they were told that the information collected would be anonymous, used confidentially, and only for academic purposes. Likewise, they were informed that they could stop completing the questionnaires at any time, for any reason. Finally, it was emphasized that no individual results could be returned but that general information about the study could be provided when it has been completed.
Measurement
Datasheet
Sociodemographic information was collected from the participants, such as their age, sex, educational level, perceived socioeconomic level, and questions associated with their musical training.
Stereotypes about ethnic groups in Peru
The scale used measures the stereotypes associated with different ethnic groups (Espinosa, 2011). This instrument presents a list of 24 adjectives divided into two dimensions: positive stereotypes (e.g., honest, hardworking, supportive) and negative stereotypes (e.g., dishonest, idle, selfish). These adjectives are presented to the participants, and they are asked to mark those that, according to popular belief, best describe each of the following social groups: Peruvians of Andean origin and Afro-Peruvians. The response options range from 1 to 4, where 1 is completely disagree and 4 is completely agree. Optimal reliability was found for the positive and negative factors of Andean stereotypes (α = .88 and α = .84) and similarly for Afro-Peruvians (α = .90 and α = .89).
Social dominance orientation (SDO)
The scale identifies the level of agreement with hierarchical, asymmetric, and unequal relationships between different groups belonging to society (e.g., “Some people are inferior to others,” “The difference between social groups is natural and should be maintained”). This scale was constructed by Pratto et al. (1994), and for this study, a version translated and adapted to Spanish was used (Cárdenas et al., 2010). The response options range from 1 to 6, where 1 is completely disagree and 6 is completely agree with the proposed statements. Reliability was adequate for this sample (α = .86).
Attitudes toward musical genres
For this study, an ad hoc instrument was developed, which has 20 items that allow evaluating the appreciation of musical genres concerning three dimensions proposed by Pacheco et al. (2017) previously: (1) positive national image, (2) relative status of the consumer, and (3) taste and interest. The response options are on a Likert scale from 1 to 6, where 1 is completely disagree and 6 is completely agree with the proposed statements. Specifically, two musical genres were evaluated: Andean music and Afro-Peruvian music.
Procedure
First, for the construction of the scale of attitudes toward musical genres, a theoretical and empirical review was carried out to prepare the proposed items. These statements were reviewed by experts in the field (both psychology and music research) on topics of content and linguistic aspects. Cohen’s Kappa was run to determine interjudge reliability and there was a good agreement between experts (κ = .78). Thereafter, a pilot study was conducted with 12 people with characteristics similar to those of the population of this research. The results of this first approximation helped to have a better and more complete understanding of the items of the scale where minor modifications were made due to some problems in phrasing and wording but maintaining the semantic content of the item.
Subsequently, the final version of the scale of attitudes toward musical genres was digitized, as well as the rest of the instruments (stereotypes and SDO) through Google Forms to be disseminated through email and social networks. Each participant had to fill out the scale of attitudes toward music twice, each associated with one of the two musical genres previously indicated (Andean and Afro-Peruvian). It should be noted that the participants were not exposed to any type of musical stimulus, so the responses to each scale are based exclusively on their previous experience with the specific musical genre. In the same way, the scale of stereotypes was also completed twice, asking about each social group indicated above (Andean and Afro-Peruvian). The presentation of the scales of attitudes toward music and stereotypes was counterbalanced to avoid biases of the order of conditions.
Data analysis
The statistical analyses were performed with IBM SPSS Statistics version 26 software. First, the database was cleaned (e.g., missing cases or cases with out-of-range responses were eliminated), and then atypical cases (outliers) and normality of the distributions were analyzed. For this, the Shapiro–Wilk test is used, as well as the asymmetry and kurtosis coefficients, finding a relatively normal univariate distribution. However, at a multivariate level, several outliers were found using the Mahalanobis distance, so nonparametric statistical techniques were used.
Having done this first analysis, and based on the first specific objective related to construct validity, EFA using oblique rotations and Unweighted Least Squares (ULS) was performed for the scale of attitudes toward musical genres, finding correlated underlying factors for both genres of music. For this analysis, it is expected that the communalities and factor loadings values will be above 0.5 (Field, 2017; Goretzko et al., 2021) for assignment to the factors (in addition to analyzing item content). The observed factorial solution in each musical genre is compared with the theoretically constructed dimensions. With this first model developed, an invariance model is performed to verify that the scale measures the same regardless of the musical genre.
Once the dimensions of the scale were determined, and for the second specific objective, Pearson correlation analysis (due to univariate normality) was performed between the dimensions of the scale and the scores of the stereotype and SDO questionnaires to verify the discriminant validity. Finally, to achieve objective three, comparisons of means were performed through Student’s t test in the dimensions of attitudes toward music among those who are not musicians compared to those who are to examine criterion validity.
Results
EFA was performed for each of the musical genres studied (Andean and Afro-Peruvian). Specifically, the ULS extraction method was used because the sample did not fit a multivariate normal distribution and because it is one of the most recommended methods for its statistical robustness (Flora et al., 2012). Likewise, an oblique rotation with the oblimin statistic was initially used to verify the possible relationship between the underlying factors.
In the first case of Andean music, the data indicate good sample adequacy to continue the analysis, KMO = 0.913, χ2(190) = 4,351.21, p < .001. Four dimensions were found that explained 60.09% of the variance in attitudes toward musical genres. However, some problematic items did not load in any factor (they had loads below 0.5, and their communalities were also small). After eliminating these six items, the analysis was performed again, obtaining a solid factorial structure. As a final result, two factors were obtained that explain 63.94% of the variance, which is consistent with that indicated by the parallel analysis and the screen plot, KMO = .914, χ2(91) = 3,627.29, p < .001.
A review of the eliminated items shows that they were associated with the dimension “Relative consumer status.” In contrast to this, the rest of the items were indeed grouped in each of the other two factors (“Taste and interest” and “Positive national image”) as had been proposed in the theoretical review and previous studies (see Pacheco et al., 2017).
The same statistical procedure was performed with the Afro-Peruvian musical genre. Similarly, good sample adequacy was found, KMO = 0.919, χ2(190) = 4,841.51, p < .001, with the same number of factors and a percentage of variance that explained 64.72%. The same six problematic items were identified, finding a good factorial solution, KMO = 0.924, χ2(91) = 4,002.01, p < .001. The result obtained shows the same factorial structure of attitudes toward the Andean musical genre, with two correlated factors that explain 66.30% of the variance.
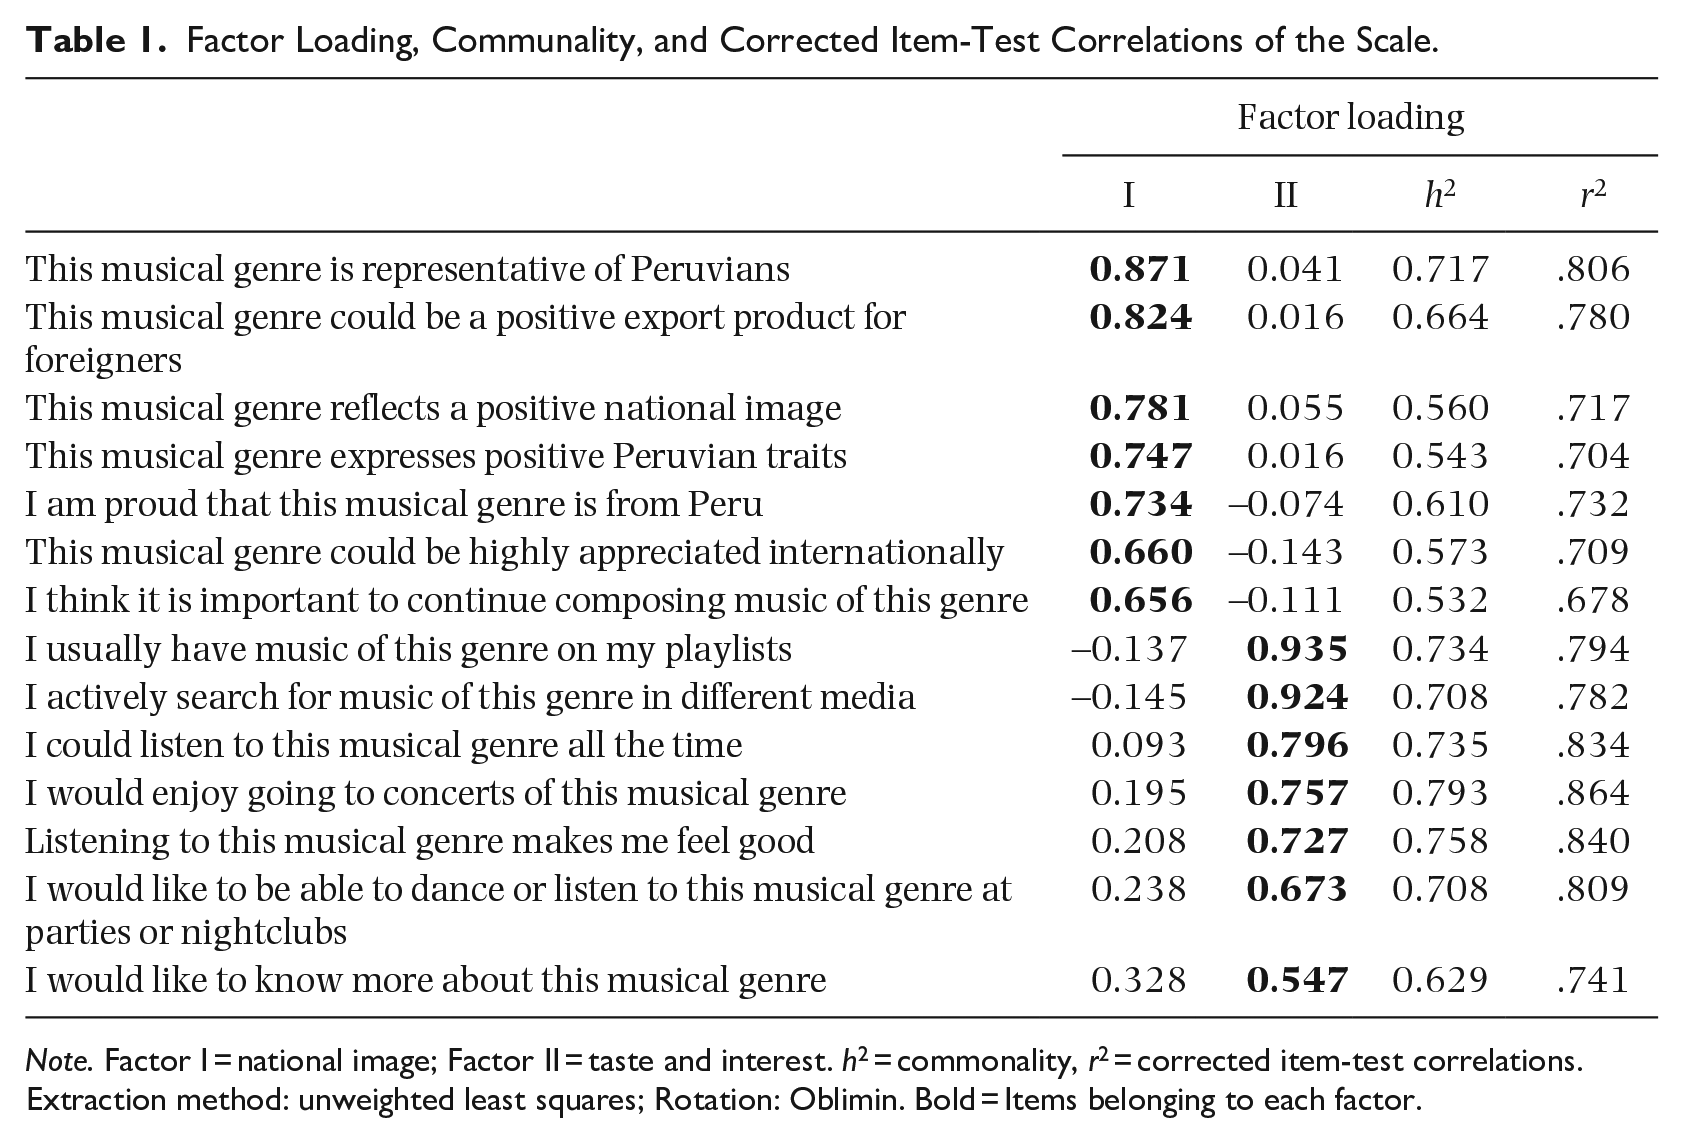
In addition, it was decided to pool the scores of the responses to the items of the scale for each musical genre. Thus, a third EFA was performed with the total measurements (624). The procedure performed was similar to the previous two, finding results that allow us to conclude that the factorial structure is maintained regardless of gender. The final analysis indicates fairly good sample adequacy, KMO = 0.926, χ2(91) = 7,607.58, p < .001, with two related factors (the same mentioned above) with an explained variance of 66.18% and with high factor loadings (see Table 1).
Factor Loading, Communality, and Corrected Item-Test Correlations of the Scale.
Note. Factor I = national image; Factor II = taste and interest. h2 = commonality, r2 = corrected item-test correlations. Extraction method: unweighted least squares; Rotation: Oblimin. Bold = Items belonging to each factor.
The factors obtained in these previous analyses were called “Positive national image” and “Taste and Interest.” The first seeks to know the national image projected by a specific musical genre (in this case, Peru), and the second factor seeks to know how a musical genre is rated according to the characteristics of its music, as well as the motivation and/or willingness to familiarize with or get to know this genre better. For each of the dimensions, good internal consistency indicators were obtained for each factor (α = .911 and α = .941, respectively), as well as for the total score of the test (α = .942), so it can also be concluded that reliability is optimal.
With the above definition, it was decided to perform an invariance analysis using a Multi-Group Confirmatory Factor Analysis to review whether the instrument is measuring the same way regardless of the musical genre. While it is true that the measurements of both genres had already been combined because they have a similar factorial structure, it is not known with certainty if it would be good to use it interchangeably between genres since the instrument may not be measuring the same for both genres. This analysis was performed using the two-factor model with seven items each found in the EFA, finding an acceptable level of fit in the model without constraints, χ2(152) = 8.638, CFI = 0.847, NFI = 0.831, RMR = 0.122, RMSEA = 0.111 [0.105, 0.116] (90% CI).
The invariance can be analyzed at three levels: metric (focuses on the items and factor loading of the observed variables), scalar (reviews the latent variables or factors), and residual (analyzes the residuals of the measurements; Milfont & Fischer, 2010). It should be noted that it is necessary to examine the invariance progressively. As an example, to have scalar invariance, it would first be necessary to have metric invariance. The results of all levels of invariance are presented in Table 2.
Fit Indexes of the Models Through the Analysis of Invariance.

First, the metric level is not significant, which indicates that there would be no differences at the item level and factor loadings in the two musical genre groups (Andean and Afro-Peruvian), complying with the invariance model at this first level. Second, the scalar model is reviewed, and it is not significant, which suggests that there would be no differences at the level of latent variables between the genres, complying with the invariance model in this second level. Finally, the third level of invariance (or residual model) is reviewed, showing differences between the measures. Although the latter is needed for complete invariance, it is not a requirement to evaluate mean differences because the residuals are not part of the latent variables (Vandenberg & Lance, 2000); their use is even sometimes omitted in these models (Putnick & Bornstein, 2016). Thus, it is concluded that the invariance model is complied with up to the scalar level and that this instrument can be used to make comparisons between musical genres with valid interpretations.
It is important to mention that the model fit indicators do not meet the minimum requirements (CFI > 0.90, RSMEA < 0.10) to analyze a good fit of the factor structure (Hu & Bentler, 1999). However, some authors warn of an over-dependence on the cut-off points of the indicators normally used in these statistical procedures (Marsh et al., 2004). This is explained by the fact that many multigroup analyses fail to reach these standards; there is even evidence that in single samples, it is difficult to achieve this (Vignoles et al., 2016). In that sense, it is suggested to look beyond these criteria and review the final fit of the model in comparison with previous ones where some indicators would be expected to be maintained or improved (Marsh et al., 2004). In this particular case, the following two important aspects are observed: (1) the indicators are quite close to the cut-off points usually used and (2) most indicators remain similar, where even the RMSEA improves between the unconstrained model and the scalar model. For these reasons, the model is considered to have an adequate fit.
Subsequently, to review the discriminant validity of the evaluated scale, the scores of the two factors (Positive National Image and Taste and Interest) are correlated with the scale of stereotypes about ethnic groups in Peru (positive and negative), as well as with the Social Dominance Orientation (SDO) scale. It is important to emphasize that these correlations are made with the dimensions according to musical genre (Andean and Afro-Peruvian) as well as by ethnic group (Andean and Afro-Peruvian) independently.
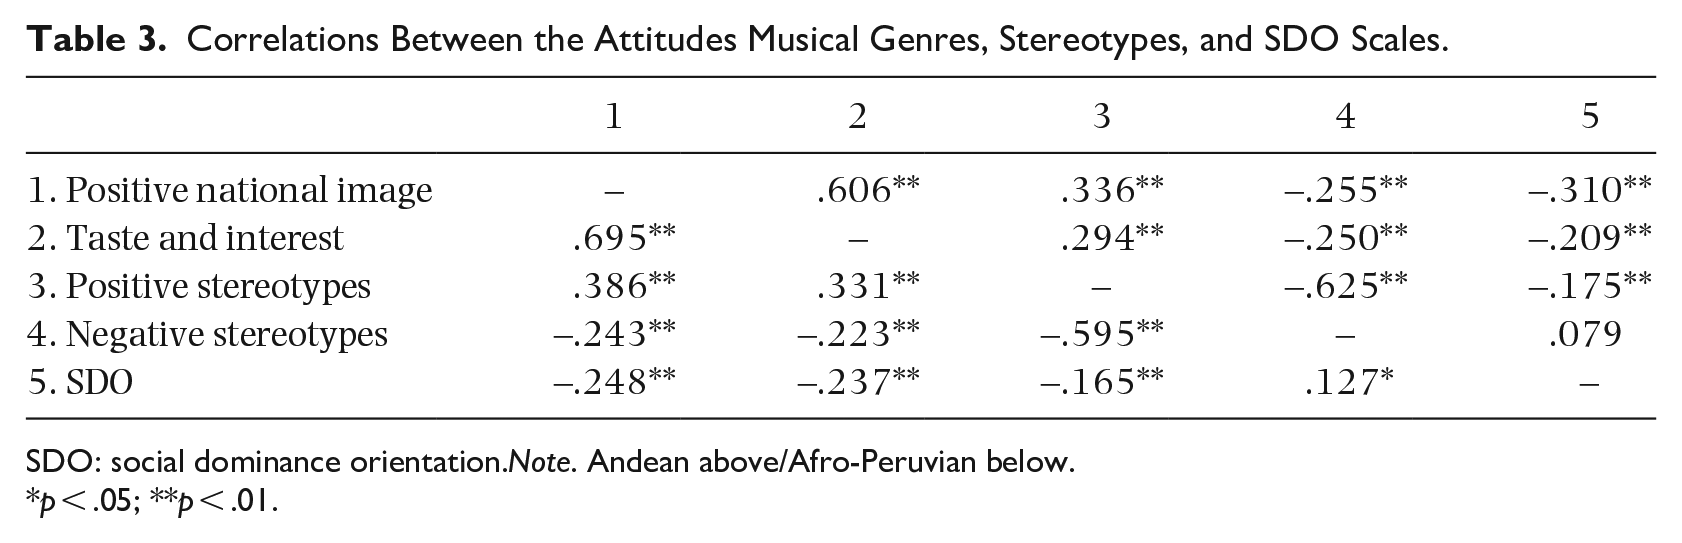
As shown in Table 3, both dimensions of the scale of attitudes toward music are positively related to the positive stereotypes of both social groups. This means that the greater the positive perception of the Andean and Afro-Peruvian social groups, the greater the positive attitude toward the Andean and Afro-Peruvian musical genres; as expected, the opposite occurs with negative stereotypes. Finally, the SDO also negatively correlates with both dimensions of the attitude toward music for the two musical genres, which means that people with lower scores in this ideological component could perceive Andean and Afro-Peruvian music as more positive and vice versa. It is important to note that the coefficients of these correlations are not high. In fact, they are much lower than the correlation coefficient between the two factors of the scale of attitudes toward music. In this way, it can be concluded that there is discriminant validity of the scale of attitudes toward musical genres linked to social groups such as the Andean and Afro-Peruvian (Pacheco et al., 2017).
Correlations Between the Attitudes Musical Genres, Stereotypes, and SDO Scales.
SDO: social dominance orientation.Note. Andean above/Afro-Peruvian below.
p < .05; **p < .01.
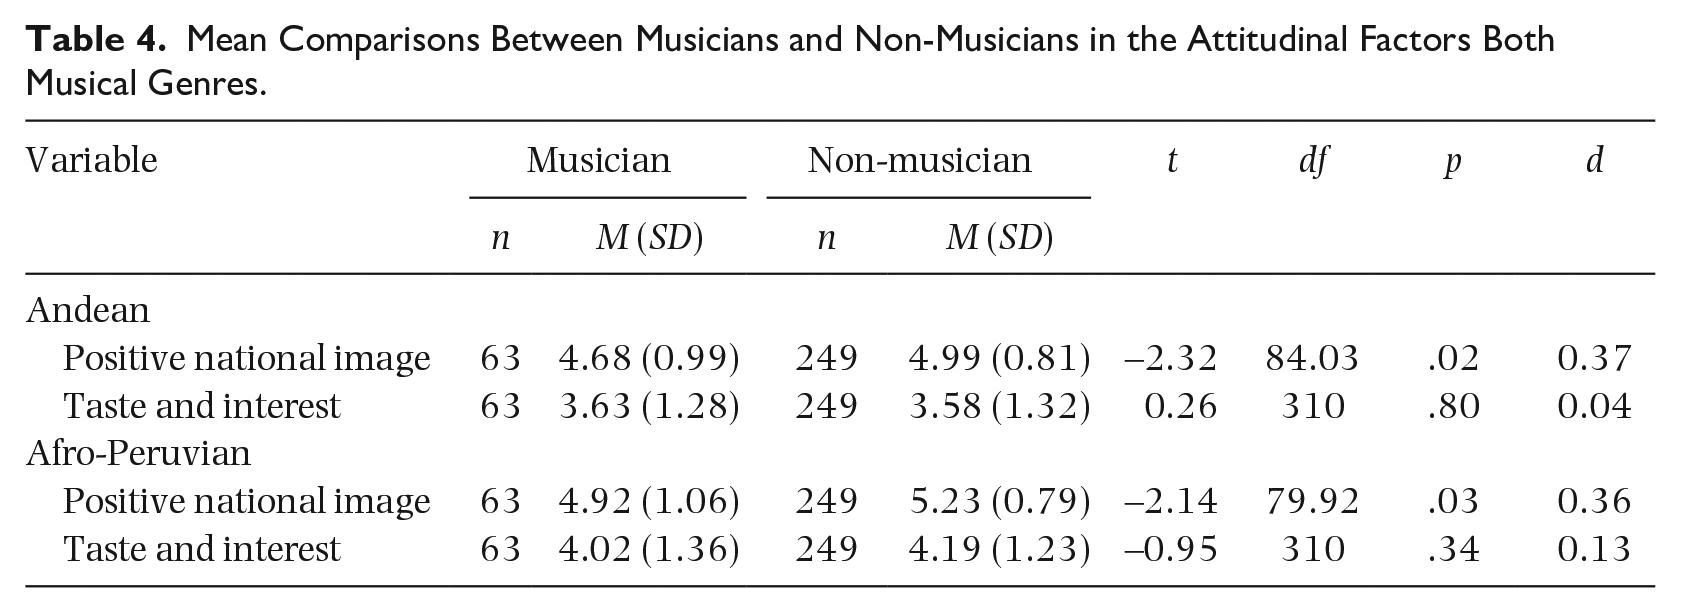
Finally, in the third specific objective of the study, comparisons of means are made through Student’s t test on attitudes toward both genders with those who are musicians and those who are not. The latter aims to evaluate criterion validity where it is expected that the results toward attitudes were different between both groups (Davidson, 1995; Fabrigar et al., 2006). Thus, it is observed that the expectation is confirmed, where non-musicians have stronger positive attitudes than musicians (see Table 4).
Mean Comparisons Between Musicians and Non-Musicians in the Attitudinal Factors Both Musical Genres.
Discussion
The general objective of this study was to build and validate a scale that measures attitudes toward various Peruvian musical genres. At the level of construct validity, a structure with two correlated dimensions was found: the first is aimed at measuring the perception that the person has about the national image projected by that musical genre, and the second is associated with taste and interest that music generates. Although the hypothesized structure does not completely correspond to the results previously found (Pacheco et al., 2017), the factorial structure of the scale obtained in this study presents evidence of different types of validity (content, construct, discriminant, and criterion) constituting a quality psychometric instrument to evaluate music associated with specific social groups. This evaluation toward music could be made based on a single scale on the general attitude toward the musical genre (taking into account that the correlation between both factors is high), but a more specific analysis could also be carried out, based on the score obtained for each factor, which would allow a better understanding of the different aspects that make up the attitude toward the object in question.
Initially, it was expected that the items on the scale would be grouped into three dimensions. However, of these three dimensions, only two dimensions yield a robust statistical structure. The items of the proposed third dimension corresponding to “relative consumer status” did not fit adequately to the general structure of the scale. This may be because the phrasing of the items may not have been clear due to the possible ambiguity that some terms could generate. Thus, it may be easier to recognize someone’s taste for a musical genre (dimension 1) or whether this genre represents positive aspects of a social group (dimension 2), rather than to wonder if the genre is associated with anyone having good or bad musical taste due to their social characteristics (Frith, 1996; Kenyon, 1991).
The proposed scale emphasizes the participants’ perception of how a certain musical genre represents a social group and presents evidence that shows how the representation of certain musical genres can be associated with a high- or low-class social group (e.g., Shevy & Kristen, 2011), although it will be relative depending on who evaluates the music (Bodner & Bergman, 2017; Lajosi, 2014; Pacheco et al., 2017). In this line, it is worth mentioning that the two factors obtained directly correlated with the positive stereotypes of the groups evaluated, inversely correlated with the negative stereotypes of these groups, and inversely with the SDO as a measure that influences prejudice. This provides evidence, not only at the level of validity but also of the link that exists between music, its origin, and how it is appreciated (Bodner & Bergman, 2017; Harwood, 2017; Pacheco et al., 2017). In this sense, the greater the appreciation of Andean music, the more positive the judgment of the social group of Andean Peruvians; the same thing happening with Afro-Peruvian music. All this opens an interesting field to continue investigating stereotyping and prejudice and their links with music.
Additionally, and as indicated in the conceptual framework, it was expected that the scale could discriminate between people who could have different attitudes according to their professional musical background. Thus, in this case, evidence of criterion validity was demonstrated since differences were found in the “Positive National image” dimension of the scale between musicians and non-musicians. Specifically, those people who are not musicians score higher than those who are. This could be explained by the level of musical training between both groups when evaluating a specific artistic product. Thus, musicians may focus more on the musical properties themselves (rhythm, harmony, melody), and non-musicians give higher priority to the association that exists between the musical genre and the social or ethnic group that this genre would represent (Madsen & Geringer, 1990). From this also emerges a line of research to know and understand the possible differences between people depending on their knowledge or familiarity with a musical genre.
In sum, the scale presents optimal psychometric functioning, correlates with predictors of stereotype and prejudice, adequately discriminates between attitudes toward music based on musical experience, and, in addition, can be used regardless of the musical genre. The latter is demonstrated by the following two results in particular: (1) the factorial structure is identical for the Andean or Afro-Peruvian genre (even when all the scores are grouped) and (2) the invariance analysis shows that the test measures are the same at the level of items and factors regardless of musical genre. In other words, it is hypothesized that the scale could function without problems (it will continue to be valid) even when one wants to work with other genres. In this regard, it is important to note that this study conducts more thorough testing of the attitude scales than was conducted on scales in the prior research.
With all of the above, it can be seen that the scale allows a relevant analysis of the relationship between the musical genre and the appreciation of the social groups that produce that music associated with the representation of a national category. Thus, unlike other instruments, this scale, in addition to contemplating musical taste and interest, allows capturing the participant’s perception of the image that the musical genre gives to a certain social group, in this particular case, the national social group. Also, important to highlight, this study measures participants’ memory of genres without listening to the music in contrast to other studies like Shevy (2008) and Kristen and Shevy (2013) that used musical stimuli. This reinforces Shevy’s (2008) idea of musical genres as cognitive schemas loaded with information that can be transmitted not only through musical expression but also through musical memory.
This instrument adds to the body of measures on attitudes toward musical genres in a context where the development of a variety of scales allows future researchers to triangulate their measures or choose scales that best fit the nuances of their research. However, the items used to measure national image are framed specifically from an in-group perspective. Therefore, future researchers who wish to use this instrument should consider that it has been created to refer to dynamics that imply the recognition of the participant as part of a social group.
Finally, some future recommendations for this line of research are proposed. A first aspect to consider is that people, when evaluating their attitude to a particular musical genre, only considered their previous experience with that type of music. Although this idea of musical schemas as cognitive structures has worked well in the process of developing the psychometric scale, it would be interesting to evaluate whether it would work in the same way if the participants had access to musical stimuli representative of the social group. For this purpose, it is suggested that another complementary study be conducted to review and confirm the factorial structure of the scale, but in this case, the participants should listen to the musical stimuli of each genre, similar to other studies (Bonneville-Roussy et al., 2017; Kristen & Shevy, 2013; Shevy, 2008). If this objective is achieved, the scale could have even greater evidence of theoretical validity and statistical robustness.
A second aspect takes into account that the comparisons between musicians and non-musicians are disproportionate in the sample. It would be wise to look for samples of a similar size. In this line, an invariance analysis could also be performed to compare the scores in the aforementioned levels (metric, scalar, and residual). Finally, and as a third aspect, it is suggested to review the factorial solution found through a CFA and using other musical genres. Although a CFA was indeed used as part of the invariance analysis, it was not the main objective. In this sense, being able to evaluate the scale with this statistical procedure could be useful for confirming the model. Likewise, using other musical genres could be relevant to verify the structure found in this work. This could provide greater evidence of validity to the instrument and thus have a higher level of statistical robustness than that obtained in this study.
