



Abstract
This study analyzes whether firms face a tradeoff in responding to pressures of shareholders versus stakeholders in their quest for supply chain management excellence. Are firms that are recognized and rewarded for their supply chain management practices less likely than other firms to have a strong record in community relations, product qualities, employee relations, environmental sustainability and diversity measures? To answer this question, the study utilizes event study, OLS regression and panel data analyses of firms receiving a Gartner Supply Chain Top 25 ranking and a comparative sample of these same firms in non-ranked years. The findings indicate that shareholders react positively to a Gartner ranking, suggesting that ranked firms receive significant incentives to pursue recognition. Additionally, positive stakeholder practices are significantly stronger for firms ranked versus those not ranked. These findings suggest that firms can successfully navigate the pressures congruent with both shareholder and stakeholder priorities through supply chain excellence.
Introduction
Companies face increasing internal and external pressure to pursue innovations in supply chain management (SCM). The increasing global nature of production and distribution means that supply chain management is vital not only for a firm’s profitability but also for a firm’s relationship to a broad range of stakeholders, including workers, communities and consumers around the world (Freeman et al., 2004; Hutchins and Sutherland, 2008). The ability to improve financial performance and profitability through supply chain management initiatives has been demonstrated to benefit organizational shareholders (D’avanzo et al., 2003; Ellinger et al., 2011, 2012; Losbichler et al., 2008; Singh, 2021). Unfortunately, this pressure can also encourage firms to avoid regulation, cut labor costs and increase price competition among suppliers (Locke et al., 2013). Global labor and human rights organizations have sought to mobilize policy makers, consumers and other stakeholders to hold companies responsible for supply chain management practices that harm workers, communities and/or the environment (Donaghey et al., 2014; Wright et al., 2007). Given these competing pressures, do firms face a tradeoff between meeting the coercive pressures of shareholders versus stakeholders in their quest for recognition in supply chain management excellence and organizational legitimacy?
This is an important question to address as corporate scandals in numerous industries suggest that companies’ failure to respond to stakeholder concerns may result in long-term damage to a firm’s reputation and profitability (Hendricks and Singhal, 2005; Sin, 2016; Yardley, 2013). Further, the diffusion of a version of supply chain excellence supportive of both shareholder and stakeholder concerns can lead to better products, better relations and greater levels of sustainability. The ability of the Gartner award to disseminate supply chain excellence through the institutionalization of best practices and the professionalization of supply management practices may lead to more robust, sustainable and profitable organizations.
Institutional theory suggests that the pressures exerted by stakeholders, shareholders, regulatory requirements and professionals within the field contribute to homogenization amongst organizations (DiMaggio and Powell, 1983; Meyer and Rowan, 1977; Scott, 1998). These formal and informal pressures exerted upon the organization force homogeneity through competing pressures. These pressures include coercive pressure related to governmental regulations and social expectations for organizational performance and legitimacy, mimetic pressure to conform to or adopt industry standards or best practices in order to mitigate uncertainty, and normative pressures placed on organizations through professionalization diffused through professional education and associations (DiMaggio and Powell, 1983; Mizruchi and Fein, 1999). A number of scholars have sought to demonstrate the emergence of institutional isomorphism within the field of operations management through the adoption of practices and techniques such as total quality management (Westphal et al., 1997), supplier development (Rogers et al., 2007) and green supply chain management (Zhu et al., 2013; Zhu and Sarkis, 2007). However, very little research to date has analyzed mechanisms beyond the firm level that perpetuate homogeneity within the field. This study contributes to this body of work by examining supply chain excellence as it relates to coercive isomorphic pressure, but with implications for all three types of isomorphic pressure. The authors examine the potential tradeoff between the coercive pressures of stakeholders and shareholders, along with the ability of the Gartner award to establish mimetic pressures for enacting Gartner recommended best practices in the supply chain. This leads to the professionalization of supply chain excellence and the homogenization of Gartner standards throughout the field of supply chain management.
Extant research has affirmed the business case for supply chain efficiency. For example, Spekman et al. (2001) note that supply chain capability will inevitably “separate the winners from the losers” in terms of competitiveness in today’s market. And indeed there is a strong empirical relationship between SCM capability, firm financial performance and shareholder value (Christopher and Ryals, 1999; Daugherty et al., 1998; Lambert and Burduroglu, 2000). The relationship between SCM and profitability is perhaps not surprising given that effective SCM is typically evaluated in terms of resulting financial metrics and shareholder value (Ellinger et al., 2011). These coercive pressures exerted externally by shareholders and internally through top management have inextricably linked supply chain efficiency with financial performance. When viewed from an institutional perspective the financial metrics from which a corporate supply chain is judged have become a means of organizational legitimacy within a homogeneous field. In recognition of this relationship, various professional societies now provide “best practices” training and tout the benefits of implementing supply chain best practices in order to realize financial gains. For example, the Supply Chain Operations Reference (SCOR) model training benefits are touted to include “average operating sales income improvement of 3% (ASCM, 2021).” This type of standardization of professional training causes normative institutional pressures for conformity (DiMaggio and Powell, 1983), leading to mimetic pressures in which organizations increasingly seek to emulate top supply chains for their own financial gains (Aronow et al., 2015). In this way, coercive, normative and mimetic pressures work together to perpetuate a vision of supply chain efficiency and excellence that serve to legitimize corporate supply chain management practices.
While the link between SCM and financial performance is well-established, less understood is how firms navigate coercive regulatory and stakeholder pressures and whether firms’ pursuit of SCM industry “best practices” places them at greater risk for negative publicity or public scandal due to failures to incorporate the needs and interests of stakeholders beyond shareholders. Recent corporate scandals rooted in supply chain (mis)management may provide evidence that, in some instances, firms tradeoff safety and social responsibility for profitability. For instance, global auto manufacturers have recalled approximately 42 million vehicles due to defective airbags made by the global supplier Takata (Associated Press, 2017). Several major automakers had pursued contracts with Takata as a single-source global supplier of airbags for their vehicles (Kubota and Klayman, 2013). Internal quality issues at Takata, including failed tests, were not shared with supply chain partners and instead reports were manipulated and fabricated in order to keep supplies of the faulty airbags flowing and profits high (Dolmetsch, 2017; Etienne, 2020). Three executives of Takata have been indicted within the United States on fraud charges and Takata has agreed to a one billion dollar settlement with the U.S. National Traffic Highway Safety Administration (Dolmetsch, 2017). Coercive shareholder pressures for profit maximization and normative pressures within supply chain management of cost savings and supplier consolidation diffused and legitimated the use of Takata airbags (Tabuchi, 2016) and has caused a global crisis within the automotive supply chain.
This study seeks to analyze the mechanisms of institutional isomorphism within supply chain management through analyzing the interplay between supply chain rankings, shareholder pressures and stakeholder management. Specifically, it analyzes the conditions under which organizational supply chains achieve a top “excellence” ranking and explain the impact on firms, including shareholder reaction and organizational legitimacy, the diffusion of normative isomorphism through the ranking criteria and coercive pressure for stakeholder considerations. An event study methodology is used to determine if shareholders place value on a Gartner Top 25 Supply Chain ranking. Further analysis is also conducted on the stakeholder management outcomes for the firm leading up to the supply chain ranking in order to understand the social considerations of ranked organizations. The Gartner Top 25 Supply Chain ranking contains a peer and industry reputation element and firm financial measures. It does not include, however, measures related to broader stakeholder concerns, including indicators of community relations, diversity, employee relations, environmental sustainability and product qualities. This study contributes to scholarly work in supply chain management by applying an institutional framework to understand whether firms face a tradeoff between SCM recognition, shareholder and stakeholder concerns. The authors situate supply chain decision making within a broader social context to examine the pressures that all firms face in making strategic supply chain decisions.
Theory and hypotheses
SCM and the gartner supply chain top 25
Supply chain management (SCM) is defined by the ASCM/APICS Supply Chain Council as “the design, planning, execution, control, and monitoring of supply chain activities with the objective of creating net value, building a competitive infrastructure, leveraging worldwide logistics, synchronizing supply with demand, and measuring performance globally” (Blackstone, 2010). Gartner (formerly AMR) originated supply chain rankings in 2004 and has been publishing the Supply Chain Top 25 ranking each year in order to recognize excellence in supply chain management (Gilmore, 2015). The rankings identify organizations who are leaders within the field of SCM and highlight the importance of the supply chain function for corporate executives and the investment community (Aronow et al., 2015). The Gartner Top 25 list is the foremost source for identifying supply chain competency (Ellinger et al., 2011). Thus, prior research has used the Gartner Top 25 Supply Chain list to identify firms to examine in relation to financial performance (Ellinger et al., 2011; Hong and Najmi, 2020), customer satisfaction (Ellinger et al., 2012), sustainability (Bîzoi, 2016), and supplier relationships (Schwieterman et al., 2020). According to Gartner (2021a), the business practices related to SCM of the Gartner Top 25 organizations are considered some of the best in the world and emulation of these business practices is encouraged. Organizations ranked by Gartner have been carefully watched and highlighted as model supply chains that may help others emerge from issues related to the COVID-19 pandemic (Ethier, 2020).
Signaling SCM excellence
The Gartner ranking serves as a mechanism to institutionalize and define supply chain excellence. A Gartner award serves to diffuse Gartner standards of excellence through the professionalization of supply chain management best practices. When a firm receives a Gartner Top 25 Supply Chain ranking it sends the message that the organization buys-in to Gartner’s supply chain best practices. Signaling theory asserts that organizations send signals about their values and intentions through their organizational actions or actions associated with the organization (Prabhu and Stewart, 2001). Sauder and Lancaster (2006) posit that “rankings act as signals” that represent quality, or in this case excellence, in what is being represented. Further, rankings are especially powerful when assessing areas that are hard to measure or where outsiders are blocked from information (Sauder and Lancaster, 2006). The black box of the corporation, specifically when it comes to a firm’s supply chain management practices, hinders comparative quantitative study. The Gartner Top 25 SCM ranking is “the best we’ve got” for determining the top supply chains in the world due to the complexity involved with examining corporate supply chains (Gilmore, 2015). Therefore, achieving a spot on the Gartner Top 25 rankings sends a powerful signal to the market the firm pursues business practices that prioritize financial performance.
Scholars suggest that organizations that win awards, or in this case receive a top ranking, receive increased visibility and favorable press (Fombrun, 1996). The signal and corresponding positive visibility realized from the Gartner Top 25 ranking provides investors with accessible information that they can use to assess investment opportunities (Hannon and Milkovich, 1996). Previous studies also suggest that the achievement of awards may have a positive effect on share price (Arthur and Cook, 2009; Hannon and Milkovich, 1996; Wright et al., 1995), which can be extended to include the esteem of being ranked in the Gartner Top 25 SCM ranking. The enhanced visibility and press coverage also increase the pool of potential investors due the breadth of the audience receiving the information. The positive signal sent by the ranking motivates investment in the organization’s stock, which increases demand for the stock and drives the share price higher. One would expect that higher placement on the Gartner ranking sends an even stronger signal that the organization is incorporating the supply chain performance practices touted by Gartner into their organization. Therefore, the following hypotheses are made:
A Gartner ranking sends the message to the market that an organization is committed to the “demand-driven ideal” and the metrics to measure the demand driven supply chain (Gartner, 2015). Research shows that the impact of a corporate event, such as the Gartner ranking, on share performance is reliant upon the interpretation of the signal by the signal receiver (Fombrun, 1996; Prabhu and Stewart, 2001). How the signal is received is a function of the receiver’s interpretation of signal, how well it aligns with the receiver’s values and how those values align with what the signal represents (Fombrun, 1996). The signal of adherence to the Gartner supply chain ideal serves as a mechanism not only of adherence to normative pressure, but as a means of further diffusing normative isomorphic institutional pressure throughout the field. The ranking legitimates not only the supply chain practices of the ranked organizations, but of the Gartner award itself in a self-reinforcing manner. The company practices are rewarded by Gartner, reinforcing the practices as “best practices,” which serve to reinforce the Gartner ranking criteria and outcomes. This is likely why there are organizations ranked in multiple years. However, once an initial ranking is achieved and legitimacy conferred, the impact of subsequent ranking will likely diminish. Previous work by Arthur and Cook (2004, 2009) demonstrates that company announcements and awards concerning work-family policies become less salient with subsequent announcements and awards. Meaning, the original signal is what confers legitimacy on the firm and subsequent rankings only serve to maintain the reputation and legitimacy of the firm and the ranking. This leads to the following hypothesis:
Stakeholder management
Businesses face increasing coercive pressure from various stakeholders to move beyond a focus on profits and to adopt strategies and values that address broader societal needs. Recent criticism has pointed to the large profits made by businesses at the expense of society (Reich, 2015; Stiglitz, 2012). For instance, the recent corporate scandals and massive recalls at General Motors and Volkswagen have resulted in scrutiny of the corporate cultures at both companies that enabled profit seeking behavior to undermine environmental and safety concerns (Blau, 2016; Gates et al., 2017). Both scandals are expected to result in substantial reductions in both companies’ market share over the short, medium, and long term. In recognition of these risks, Porter and Kramer (2011) argue that business must take responsibility to bridge the gap between business and society through aligning “the company’s goals and the needs of the community in which it operates.”
Parsons (1960: 60–65) theorizes the organization at the institutional level as being embedded within the social context of the firm’s environment. It is at this institutional level that meaning and legitimation are uncovered and firm strategy is carried out (Parsons 1960: 63–64). Stakeholders assert their own unique coercive pressures onto organizations at this institutional level, coming from various places such as government regulation, employee relations, or social activism. Stakeholder theory expands upon this connection to assert that organizational performance and survival are predicated on the relationship between the firm and its various stakeholders (Freeman, 2010; Freeman et al., 2010). Freeman (2010: 46) defined stakeholders as “any group or individual who can affect or is affected by the achievement of the organization’s objectives.” Clarkson (1995) provided a narrower definition in which stakeholders are those with some type of capital at risk and something to gain or lose based on the firm’s behavior. A category of stakeholders defined as “primary stakeholders” is adopted that includes employees, customers, suppliers, community, and the environment as well as shareholders and investors (Clarkson, 1995). Calls to satisfy a set of stakeholders beyond the shareholder are becoming more difficult for organizations to ignore (Hemphill et al., 2021; Pagell and Shevchenko, 2014; Pagell and Wu, 2009; Seuring and Müller, 2008). However, institutional pressures due to shareholder concerns continue to shape corporate policies (Jung, 2015). Corporate stock options tied to executive compensation as well as rewards for financial performance help to maintain a focus on shareholder concerns (Carpenter and Yermack, 2013), which serves to legitimate those organizations responding to coercive shareholder pressures.
Recent research provides promise in resolving the tension between firm financial performance and stakeholder management. Studies show that investment in stakeholder management may complement financial performance and provide competitive advantage to firms (Freeman et al., 2010; Hillman and Keim, 2001). Further, inclusion of stakeholder values within corporate strategy may also result in increased shareholder wealth (Hillman and Keim, 2001). Indeed, Cheng et al. (2014) find that firms with stronger records in corporate social responsibility are not only more profitable but also enjoy greater access to financial support and lower capital constraints. While the benefits of stakeholder consideration have received ample attention within literature, the context surrounding the adoption of a stakeholder focus warrant further consideration.
Competing pressures
The Gartner Top 25 SCM ranking has a strong focus on financial measures combined with an element of supply chain reputation. Part of Gartner’s focus is to raise awareness of supply chain management as a profession by demonstrating a link between their appraisal of supply chain excellence and economic value (Aronow et al., 2015). Meaning, the Gartner ranking is both a product and outcome of isomorphic institutional pressures, serving to create and reinforce supply chain norms. Unfortunately, while increased supply chain efficiency and the corresponding financial performance may benefit shareholders and appease the coercive pressure from this constituency, it may come at the expense of stakeholders, which manifests in many ways including deficiencies in areas such as worker safety and working conditions (Donaghey et al., 2014).
Shareholder wealth maximization is accepted as the prevailing view in most business and academic contexts within the United States (Friedman, 1970; Roe, 2001). Thus, the coercive institutional pressures exerted by shareholders emphasize corporate profit above all else. Social initiatives addressing stakeholder concerns have been criticized as a management perk that detracts from what should be the ultimate organizational goal, namely maximizing shareholder returns (Friedman, 1970; Minow, 1999). The organizational response to these competing pressures manifest within the Gartner Top 25 Supply Chain ranking criteria, where the emphasis on financial metrics is likely achieved at the expense of stakeholder concerns. Thus, the following is suggested:
However, prior studies demonstrate that stakeholder values and firm profitability are not mutually exclusive (Freeman, 2010; Hillman and Keim, 2001). In fact, sustainability has been highlighted as a key component of outcome based, or demand driven, supply chain effectiveness (Melnyk et al., 2010). CSR initiatives within the supply chain have also been found to reduce supply chain risk and to insulate corporate reputations (Singh, 2021). Given the need for organizations to respond to coercive pressures from both shareholders and stakeholders in order to achieve legitimacy this competing hypothesis is suggested:
Methods
Procedure and data
Multiple sources of secondary data were compiled in order to examine the research questions. All sources of data were complementary with no concerns in merging the data. There were 25 companies ranked as a Gartner Top 25 Supply Chain for each of the 9 years studied. This resulted in a total of 225 company observations. Observations were removed if publicly available measures were not available for the firm. Additionally, observations were removed for significant confounding events (discussed below). This resulted in a sample of 138 firm observations.
Gartner supply chain top 25
The ranked firms and the day of the announcement of the Gartner Top 25 Supply Chain rankings were collected from the Gartner (formerly AMR) website. The years examined in the study were 2005 and 2007–2014, which encompass all years with available data in which the Gartner Top 25 Supply Chain rankings were published. Data were unavailable for the year 2006.
The following steps detail the methodology for the Gartner ranking. The Gartner analysts begin their rankings with a list of the Fortune 500 companies. They remove companies from certain industries that do not have physical supply chains, such as those in the financial industry (Gartner, 2021b). The Gartner analysts then review public financial data about the firms to develop measures for return on assets (net income/total assets), inventory turns (cost of goods sold/inventory levels) and revenue growth (change in revenue from prior year). A 3 year weighted average is used for return on assets (ROA) and revenue growth. Their inventory turns measure uses the quarterly average from the prior year, which accounts for any seasonal variation (Gilmore, 2015). The three financial metrics are combined and weighted to contribute 50% of the score (Gilmore, 2015).
The remaining 50% of the Gartner score is comprised of votes based on reputation from the Gartner analysts (25%) and industry peers (25%). Gartner uses a Delphi-style polling method that is designed to leverage the specific knowledge of each participant (Ellinger et al., 2012). Eligibility to participate in the peer review is restricted to professionals working in SCM within the manufacturing and retail sectors, along with academic researchers focusing on SCM. Gartner limits participation to one person per organization (Gartner, 2015). Peer voting is completed through a four-stage web process, which culminates in the reviewers’ force-ranking their top 25 (1–25) organizations. Previous research indicates between 20 and 27 Gartner analysts and 154–170 peer reviewers complete the ranking process (Ellinger et al., 2012). Gartner assigns a point score to the rankings with the highest score going to the top ranked company, which is then added to the financial metric score and the highest scores are ranked accordingly.
Financial data
The firms’ stock market performance data were collected from the Center for Research in Security Prices (CRSP) at the University of Chicago. The CompuStat database, which is available through Wharton Research Data Services (WRDS), was used to capture firm-level information such as industry codes, number of employees and total assets. ExecuComp, also available through WRDS, provided the additional firm level financial information, such as return on equity and operating income before depreciation (OIBD). All financial data is publicly available through stock market information, corporate annual reports and security filings.
Stakeholder data
The dataset used for the stakeholder variable is the Kinder, Lydenberg, Domini, Inc. (KLD) dataset. The KLD Stats dataset, also accessed through WRDS, provides annual ratings on social responsibility issues for publicly traded firms. The KLD measures are commonly used measures of corporate social performance (Doh et al., 2010; Glass et al., 2016; Hillman and Keim, 2001; Sharfman, 1996). KLD data are compiled by an independent rating service and used for investor analysis (Walls et al., 2012), which minimizes social desirability bias (Glass et al., 2016). The KLD ratings have been found to be one of the best measures of corporate social performance and have been tested in multiple studies against other CSR measures to determine construct validity by means of convergence (Semenova and Hassel, 2015; Sharfman, 1996).
Comparative sample
All variables were collected and recorded for all firms ranked as a Gartner Top 25 Supply Chain during the study period. This novel approach allowed a comparison the performance of the same firms based upon when they received a Gartner Top 25 Supply Chain ranking and when they did not. Comparing the same companies between ranked and unranked years eliminates most of the concerns present when attempting to provide a match to similar companies.
Endogeneity
This analysis examines the likelihood of an organization being ranked in the Gartner Supply Chain Top 25 in relation to stakeholder management strengths, stakeholder management concerns and firm characteristics from the year prior to the Gartner ranking. By using independent and control variables from the years prior to the Gartner ranking, potential issues of endogeneity due to simultaneity is reduced (Rose and Bielby, 2011). Specifically, by assessing predictor variables for the year prior to the examination of the dependent variable, the questionable link of causality (endogeneity) is reduced. Though cautious to assert causality, the lagged variables provide a stronger test as opposed to measures all in the same year. Hence, all predictor and control variables were collected from 2004 to 2013 and the outcome variables were collected from 2005 to 2014.
Measures
Dependent variable
A rank order variable was created to test for the effects of a higher or lower Garter Top 25 ranking. The dependent variable was coded as 100 for the top ranked Gartner firms, 99 for the second ranked Gartner firm, and so on. The comparative sample of non-ranked firms was coded as 0.
Independent variables
Stakeholder management as a variable has been quantified in previous research through the use of KLD data (Hillman and Keim 2001; Waddock and Graves 1997a). The KLD Stats database provides measures related to both the strengths and concerns of approximately 650 firms, which include the Standard & Poor’s 500 (S&P 500) Index. KLD Stats measures firm social performance within 80 indicators covering seven major areas including community relations, corporate governance, diversity, employee relations, environment, human rights and product. For further information regarding the indicators and outcome variables, refer to Getting
Started an Introduction to KLD Stats
Prior research has selected the five categories of employee relations, diversity, product, community relations and environment from the KLD measures in order to address stakeholder management (Glass et al., 2016; Hillman and Keim, 2001; Waddock and Graves, 1997). The five categories selected are representative of the primary stakeholder groups (Hillman and Keim, 2001). Following upon prior research by Hillman and Keim (2001:131), this study adapts the KLD measures to create a variable for stakeholder management. Each of the five stakeholder related measures were standardized in order to provide equal weighting for the composite measure and then summed to create the stakeholder management variables for each firm, which is the total strengths and total concerns for each firm for the year. Specifically, the strengths and concerns for community, diversity, employee relations, product, and environment are standardized, which sets each mean to zero with a standard deviation of 1. Then those five standardized measures are added together to create the total strengths and concerns for each firm. So, although KLD provides count data starting at 0, the means reported have the possibility to be negative given the standardized approach taken to provide a more balanced weighting of each item. The study departs from Hillman and Keim’s operationalization of the stakeholder management variable by keeping the strengths and concerns as separate variables. Prior research suggests that KLD strengths and concerns are distinct categories and should be assessed independently (Walls et al., 2012). KLD strengths dimensions focus on corporate strategic initiatives and policies that enhance the firm awareness and response to social issues. Whereas, the KLD concerns measures assess issues, responses and violations, not the plans or policies of the organization. The distinct focus related to each of the KLD strengths and the KLD concerns measures is highlighted through the following statement by Walls and her colleagues: “KLD strengths and concerns measures are theoretically and empirically distinct and represent two independent constructs” (Walls et al., 2012:892).
A rank order variable was included in order to test for the effects of a higher or lower Gartner Top 25 ranking. This variable allowed an examination asking if firms realize a significant benefit from being ranked higher, or if just achieving a Gartner ranking is sufficient. Additionally, a count variable indicating the number of times a firm had been ranked within the Top 25 by Gartner was also employed in order to determine the impact of multiple rankings.
Control variables
Several control variables were included in the logistic regression analysis. Firm-level controls included firm size and firm performance. Firm size was measured by the natural log of total assets reported in millions. Firm performance was measured by return on equity reported as actual percentages for the firm. Additional firm performance related variables account for profitability via operating income before depreciation (OIBD), liquidity using the current ratio, income growth rate over a 3-year period and inventory turns. Using stakeholder measures as predictor variables, it is important to control firm aspects such as size and performance. As a firm increases in size, it is arguably more visible to the media and public and may have enhanced pressures to appease multiple stakeholders (Arthur and Cook, 2009). Likewise, if a firm has positive firm performance, that performance may enable the firm to provide resources to various stakeholders such as the community or the environment that otherwise may be considered a luxury (Cook and Glass, 2011). The industry in which the firm operates and the year of the Gartner announcement were also controlled (dummy coded within the analysis) to account for any industry specific or societal pressures that may exists. The industry of the firm was specified by a 4-digit SIC (Standard Industrial Classification) code and followed the groupings suggested by Waddock and Graves (1997b).
Within the event study analysis, the methodology serves as a control. By modeling the returns of the firm for the full year prior to the event, the relationship between the firm’s returns and the benchmark index are much more accurately represented. Through estimating this relationship, external factors and movements in the stock market are largely controlled (Cook and Glass, 2014).
Analyses
Event study
In the first phase of analyses, event study methodology is used to test for shareholder reaction to the Gartner Top 25 Supply Chain ranking. The event study measures the impact of an event on the value of the firm (MacKinlay, 1997). Investors will adjust their perceptions of the firm’s future value or stock risk based upon new public information (Fama, 1970). The change in investor perception related to new information will increase or decrease the stock value of the firm (Fama, 1970) and create an “abnormal” return. The event study is commonly used to calculate “abnormal” stock price returns associated with specific events (Zajac and Westphal, 2004). The event study method first predicts the normal stock price return for a firm based upon the prior year’s trading compared to a benchmark index. The stock price is then compared against the actual stock price return in order to determine the “abnormal” return (Bartley and Child, 2011). One would expect a Gartner Top 25 Supply Chain ranking to increase the positive investor perception for future firm value, thus leading to an increase in the stock price of the firm.
Event studies generally follow a four step procedure, which include identification of the event date, modeling the normal or expected share price return, calculating the abnormal or excess share price return, and analysis of the cumulative measures for abnormal excess return (Arthur and Cook, 2009; Brown and Warner, 1985). The period, or window, over which the “abnormal” returns are calculated is an important aspect of the event study design (McWilliams and Siegel, 1997; Zajac and Westphal, 2004). This study examines multiple windows around the event in order to account for potential leakage prior to the announcement and to provide enough time for the ranking information to disseminate through information channels. Multiple studies examine a 2 days–11 days window within their event study (Bartley and Child, 2011; King and Soule, 2007; Zajac and Westphal, 2004). Research also recommends analyzing shorter windows surrounding the event in order to minimize confounding events that could cause a market reaction. Further, stock prices have been shown to react quickly to corporate announcements (McWilliams and Siegel, 1997; Zajac and Westphal, 2004). Presented is a maximum window length of 7 days and minimum window length of 1 day from the Gartner Top 25 Supply Chain ranking announcement. The event study windows were carefully considered to ensure that results were not obscured by confounding events, to account for possible leakage of information, and to allow time for shareholders to receive and absorb the information.
Confounding events within the study period were examined and removed for all firms in both the Gartner ranked sample and the comparative non-ranked sample. A search of each firm was conducted within the Proquest Newsstand database, the Business Source Complete database, the Edgar SEC filings database and on each corporate website in order to find other announcements or impactful news within the examined windows that could skew the results of the study. Common corporate announcements which would exclude firms from the sample include earnings reports, shareholder meetings and acquisitions. Impactful news articles, such as the June 4, 2011 Wall Street Journal article discussing Johnson & Johnson’s $327 million dollar judgment due to hiding drug risks, were also used to determine a confounding event that would warrant removal from the sample. For reliability purposes, events were coded and reviewed by two separate individuals with 96% inter-rater agreement.
The event study analysis was performed by using the Eventus Basic Event Study available through WRDS. The Eventus program directly reads the daily share price return from the CRSP database. A “market model” is used to model the daily normal rates of return, which is consistent with previous research (Arthur and Cook, 2009; Bartley and Child, 2011; King and Soule, 2007; Zajac and Westphal, 2004). This study uses the standard Eventus estimation period examining a 255 trading-day period ending 46 days prior to the event. A stock’s expected return (as illustrated in Wright et al., 1995) is as follows

Expected = risk-free return + (beta x market return) Where expected is the expected daily rate of return for the stock, risk-free return is the return on a riskless asset like a government bond, beta is the firm’s systematic risk, and market return is the expected return on the market portfolio (a weighted index comprised of the American Stock Exchange, the New York Stock Exchange and the NASDAQ Stock Market) on that day. This equation demonstrates the relationship between the firm and the indexed portfolio over the last 255 days of trading, or roughly the last year. Basically, the equation tells us that if a firm has a beta (β) of 1.5 and the market increases 1% then the share price of the firm would increase by 1.5%. In this case, the firm outperforms the market.
The abnormal excess share price returns are calculated through the difference between the market model return (as illustrated above) and the actual share price return for each day of analysis. Using the previous example of a share price increase of 1.50% for the stock and 1% for the reference index, if the actual market return for the share price is 5% then one would see an excess return of 3.5% (3.5 = 5–(1.50)).
The average excess return (AER) for all firms is calculated through the sum of the excess returns divided by the number of events (N) for day (t), represented by the equation
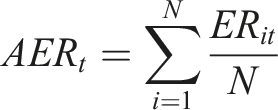
The AERs are summed over the analysis window in order to generate the cumulative abnormal excess returns (CAER) for all firms. Where
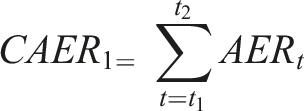
OLS regression
OLS regression was employed as a second analysis to test the impact of a higher or lower ranking within the Supply Chain Top 25. The effect of being ranked multiple times within the study period was also tested through OLS regression. Fit statistics were analyzed for both OLS and the fixed-effects model discussed below. The r-squared statistic was analyzed to ensure fit of the OLS regression and a Hausman test was conducted to ensure the correct specification of the fixed effects model. What is presented provides the most efficient models for both analyses.
Fixed-effects linear panel data analyses
The third part of the study uses fixed-effects linear panel data analyses to examine the relationship between a Gartner Top 25 Supply Chain ranking and stakeholder management measures. The panel data analyses allows testing of the effects of stakeholder management for the strengths and concerns variables on Gartner ranked firms for repeated observations, while controlling for industry and firm level variables. The fixed effects model examines and explains within firm variation through the independent variables where between firm differences are removed by the model. In this model, the coefficients are not biased by unchanging firm differences for both observed and unobserved differences (Allison, 1994). By removing these variables from the analysis, the fixed-effects model provides a more accurate picture of the predictor variable’s true effect (Allison, 2009). The fixed effects model is particularly appropriate for this analyses where the interest lies in the effect of a Gartner Top 25 Supply Chain ranking and the cases are not created through a random sample (Hsiao, 1985). As previously discussed, independent and control variables were lagged 1 year in order to address potential issues of endogeneity.
Results
Correlations.

*p < .05 ** p < .01.
Descriptives of the gartner ranked firms and the comparative non-ranked firms (same firms, but examined during years they were ranked compared to years they were not ranked).

Hypothesis 1 predicts that investors will positively react to a Gartner ranking, and through that positive reaction, demand for the stock will increase resulting in a higher share price. Hypothesis 1 was tested using event study analysis. Additionally, a comparative group of firms was tested in order to offer a more robust analysis of this hypothesis. For the comparative group, the full set of firms that were ranked during the study period were examined. The analysis compares the firms’ returns in the years they were ranked to the same firms’ returns in years they were not ranked. The abnormal excess return (AER) were determined for the day of the event (announcement of the ranking) and cumulative abnormal excess returns (CAERs) for the 3, 5, and 7-day windows described above. The results offer support for the hypothesis in that three of the four examined windows experienced significant and positive returns (refer to Table 3). Specifically, the 3-day window examining the day before the announcement to the day following the announcement had a cumulative abnormal return of .41% (p < . 05), the 5-day window examining the day before the announcement to 3 days following the announcement had a cumulative abnormal return of .59% (p < .05), and the 7-day window examining the day before the announcement to 5 days following the announcement had a cumulative abnormal return of .73% (p < .01). The results are further supported when looking at the abnormal returns for the comparative group during the same windows. Both positive and negative returns were present, and only one window reached a level of significance and it was negative at p < .05 on the day of the announcement with an abnormal return of −.12% (refer to Table 3). When discussing the abnormal returns, it is helpful to put the percentages in actual dollars. Given the average share price for the Gartner awarded firms is $75.33 and the average number of shares outstanding is 1.66 billion (putting the average firm value at roughly 125 billion), the .41% increase translates to just less than a half percent increase in share price resulting in increased firm value of over 500 million dollars. The .59% increase translates to an increased firm value of almost 750 million dollars. And the .73% increase translates to an increased firm value of almost one billion dollars. These findings clearly suggest that investors react positively to companies being ranked within the Gartner Top 25. In Hypothesis 2, it is suggested that investors will react more positively for higher ranked firms than for lower ranked firms. And Hypothesis 3, suggests that investors will react more for the initial ranking of a firm than for subsequent rankings of the same firm. These hypotheses were tested using OLS regression. Specifically, the individual firm returns were regressed on the rank order of the firm and on the number of times previously ranked. The year of the ranking was controlled as well as the industry in which the firm operates. As is illustrated in Table 4, Hypothesis 2 is not supported, though a slight positive trend is present with coefficients of .07, .10, .08, and .09 when examining the four different windows. It may be suggestive of the potential for higher ranked firms to gain greater share price benefits, but nothing reaches the level of significance. The findings affirm that the ranking in itself is what matters to investors, not the particular rank achieved. Results of Hypothesis 3 are similar in that a negative trend is present with coefficients of .05, −.03, −.10, and −.06 for the four examined windows. It may show that successive rankings do not receive the same benefits as the initial ranking, but again, none of the windows examined reach the level of significance (refer to Table 4). Thus, it suggests that all level of rankings and number of times being ranked provide positive benefits to the firm. And Hypothesis 4a and 4b, set up as competing hypotheses, examine whether ranked firms are less responsive (4a) or more responsive (4b) to stakeholders than non-ranked firms. The hypotheses were tested by conducting panel data analysis with firm and time fixed effects. Specifically, the variable of the Gartner ranking was regressed on the predictor variables of stakeholder strengths and stakeholder concerns while controlling firm size, firm performance, firm profitability, inventory turns, liquidity, and income growth rate. The predictor and control variables were lagged so they are from the year prior to the assessment of the Gartner ranking. The year of the ranking and the industry in which the firm operates were also dummy coded and controlled. For space purposes, the year and industry were not reported in the table. Nine years and 10 different industries were represented. Findings suggest support of Hypothesis 4b with a coefficient of 3.72 which is significant at p < .01. As shown in Table 5, the years in which the firms score high in stakeholder strengths, they are more likely to be ranked by Gartner the following year than in the years the firm scored low in stakeholder strengths. Given Gartner uses prior measures to award their rankings, using lagged predictor and control variables is appropriate. Stakeholder concerns, though suggestive of a negative relationship (coefficient of −.90) with the Gartner ranking, does not reach the level of significance. As an additional analysis, the above was conducted with only Gartner-ranked firms to assess if higher ranked firms were significantly more likely to be related to stakeholder strengths than lower ranked firms. Findings affirm the connection between stakeholder strengths and being awarded a Gartner ranking, but findings do not support the idea that greater stakeholder strengths translate to a higher Gartner ranking. Consistent with the earlier analysis, the order in the ranking is not as important as achieving the ranking with regard to the other examined variables. This suggests that Gartner-ranked firms are achieving supply-chain efficiencies in conjunction with benefiting broader stakeholders.
Event study results.

aSignificance for the generalized sign hypothesis test is denoted by <,<<, <<< at the .05, .01, and .001 levels, respectively.
bAll coefficients are expressed as percentages.
*p < .05 ** p < .01 *** p < .001
Regression analysis of abnormal excess returns.

Note: The year of the award and the industry in which the firm operates are dummy coded. For space purposes, the values are not reported.
N = 138.
Panel data analysis with firm and time fixed effects. Test of stakeholder strengths and concerns. Ranking of firm by gartner.

Note: Industry of operation and year of announcement are dummy coded. For space purposes, the values are not reported
(There are 10 different industries represented and 9 different years).
N = 34 examined units; 257 firm observations * p < .05 ** p < .01
Discussion
Bridging the shareholder and stakeholder divide
In today’s global economy, a firm’s competitive advantage increasingly lies in its ability to effectively manage its supply chains. While shareholders exert tremendous pressure on supply chain management practices to increase profitability, stakeholders also expect firms to manage supply chains in a sustainable manner (Zhu and Sarkis, 2007). Recent corporate scandals in the apparel, electronic and auto industries suggest that companies’ failure to respond to stakeholders beyond shareholders may result in long-term damage to a firm’s reputation and profitability (Hendricks and Singhal, 2005; Sin, 2016; Yardley, 2013). The supply chain failures experienced with the COVID-19 pandemic further served to highlight the unique position of the supply chain within the world economy (Bhaskar et al., 2020; Chenarides et al., 2021). The purpose of the current study is to understand how mechanisms of institutional isomorphism work within the supply chain and how firms navigate potentially competing coercive pressures from shareholders and stakeholders. Do firms face a tradeoff between achieving recognition for excellence in supply chain management and in pursuing social responsibility initiatives? The results indicate that firms do not face a trade-off and that the benefits of the recognition for supply chain excellence provide a host of benefits for all stakeholders, including the economically motivated.
Theoretical implications
The results of this study suggest that the diffusion of supply chain excellence through institutional isomorphic pressures and as signified through the practices of Gartner ranked organizations will lead to better products, better relations and greater levels of sustainability. Coercive pressures in the form of market pressure for shareholder profitability and government regulatory pressures have been demonstrated to result in increased supply chain environmental performance (Zhu and Sarkis, 2007). Institutional theory posits that firms gain legitimacy through responding to these coercive pressures (DiMaggio and Powell, 1983). Additionally, the study suggest that mimetic and normative institutional isomorphic pressures can work in tandem with coercive pressures to increase the benefit not only in financial and social outcomes, but also to increase legitimacy. Hemphill et al. (2021), discuss stakeholder capitalism in terms of a bounded rationality model where organizations satisfice in meeting competing requirements. Hemphill et al. (2021) argue that a commitment from the organization, carried out within the bounds of legal, economic, and political constraints, is necessary in order to address stakeholder concerns. Contrary to the bounded rationality decision-making model, institutional theory provides a differing view on how isomorphic pressures can lead to the adoption of a stakeholder perspective. Organizational legitimacy lies at the heart of institutional theory. The outcomes of decisions are removed from the core objective of gaining greater organizational legitimacy within this model (Gopal and Gao, 2009). Businesses implement practices and initiatives in order to gain greater legitimacy (DiMaggio and Powell, 1983).
Achieving a Gartner Top 25 Supply Chain ranking is a signal and means of gaining legitimacy. The organizations on this list gain both a stakeholder and shareholder competitive advantage through the signal sent by the ranking, as evidenced in the findings of this study. The normative and mimetic pressures at play in this scenario are of particular interest. Gartner itself is an instrument of normative pressure that markets the supply chain rankings as worthy of emulation (Gartner, 2021a). The publications and conferences hosted by Gartner often feature leaders of ranked firms or highlights of the firm’s practices. This serves to further legitimize both Gartner as an expert and the ranked firms.
Academics can also serve as a means of normative pressure (Kauppi, 2013). Here, normative pressure is generated by academics using Gartner rankings as a means of valuing organizational supply chains. Both Gartner and academics serve to disseminate the legitimacy of Gartner rankings, which pushes non-ranked firms to emulate Gartner ranked firms and creates mimetic pressure.
Managerial implications
The findings of this study confirm and advance prior research by Wheeler et al. (2003) by suggesting that shareholder profitability and stakeholder interests are not mutually exclusive. Firm’s achieving a Gartner Top 25 Supply Chain ranking have responded to coercive pressures from both shareholders and stakeholders. Thus, firms do not necessarily face a tradeoff in responding to coercive institutional pressures, and these pressures may be aligned within the supply chain context. In other words, organizations that implement a demand driven supply chain according to Gartner’s standards account for profitability and social responsibility.
As the Takata airbag scandal demonstrates, firms that fail to attend to broader concerns regarding public safety and environmental sustainability may face steep long-term costs in terms of reputation and profit loss. Companies that embrace a stakeholder perspective tend to outperform peer organizations (Wheeler and Davies, 2004). Specifically, firms that embrace CSR as a best practice can mitigate supply chain risk and insulate their reputation during times of disruption (Singh, 2021). The legitimation of the supply chain practices of Gartner ranked firms can help insulate organizations from perceptions of risk and scandal within the supply chain. Gartner ranked firms, while still facing difficulties, have emerged from the COVID-19 pandemic in strong positions (Ethier, 2020).
Other benefits realized through the normative and mimetic isomorphic pressures include disseminating and embedding the norms of values, or culture, underlying the best practices of Gartner ranked organizations. Prior research suggests that the socialization of culture both within and between organizations can improve organizational performance (Cadden et al., 2010). As companies emulate Gartner ranked firms, cultures may become more compatible between organizations, leading to stronger strategic relationships and stronger organizational performance. This may open the door to new types of beneficial relationships between organizations, such as limited life consortia arrangements.
Finally, Companies today must balance their financial needs within the social context of globalized trade. However, the incentives created by—and the rewards resulting from—the Gartner rankings engage with institutional pressures to expand investments to areas beyond mere profitability. By explicitly including stakeholder measures in its evaluation and ranking of firms “best practices” in supply chain management, the Gartner rankings could promote and legitimate stronger requirements for social responsibility. A broadening of the criteria for inclusion in the ranking could further normalize addressing broader stakeholder concerns with an understanding that reputation, recognition or investor reward will not be sacrificed.
Limitations and future research
While the current study advances understanding of how companies can bridge tradeoffs through supply chain management practices, future research could address some of the limitations of the current analysis. First, although we lag variables to cautiously suggest causality, without a more in-depth longitudinal study we cannot fully assert it. For example, rather than firms proactively leading in supply chain best practices and having those practices benefit stakeholders, it may be that they are reacting to stakeholder concerns and then implementing certain practices. Second, the current study focuses on companies ranked according to the Gartner Supply Chain Top 25, future research could broaden the scope of the analysis to consider if smaller organizations can still bridge the shareholder/stakeholder divide. The Gartner ranked organizations include many of the world’s largest organizations, which have generous resources. Smaller organizations may not have the same ability to meet all needs, given scarcer resources. Examining CSR policies and market performance in small to mid-cap companies could offer additional insights. Also, examination of specific supply chain practices and their resultant impacts on shareholder value and stakeholder management within and outside of the Gartner context could also elucidate how and in what context institutional isomorphic pressures influence the supply chain. Next, future research could include interviews with supply chain personnel to reveal the ways in which institutional pressures are felt and understood by practitioners. How do supply chain managers make sense of the pressures they and their firms face in terms of meeting the diverse needs of investors and other stakeholders? Finally, what factors contribute to an organization falling out of the Gartner ranking? Examining the conditions under which supply chain practices deteriorate or take a back seat to other drivers could uncover the mechanisms responsible for changing the organizational norms and institutional pressures within organizations.
Footnotes
Declaration of conflicting interests
The author(s) declared no potential conflicts of interest with respect to the research, authorship, and/or publication of this article.
Funding
The author(s) received no financial support for the research, authorship, and/or publication of this article.
