
Abstract
This ethnographic study, based on fieldwork at the Computational and Systems Medicine laboratory at Imperial College London, shows how researchers in the field of metabolomics – the post-genomic study of the molecules and processes that make up metabolism – enact and coproduce complex views of biology with multivariate statistics. From this data-driven science, metabolism emerges as a multiple, informational and statistical object, which is both produced by and also necessitates particular forms of data production and analysis. Multivariate statistics emerge as ‘natural’ and ‘correct’ ways of engaging with a metabolism that is made up of many variables. In this sense, multivariate statistics allow researchers to engage with and conceptualize metabolism, and also disease and processes of life, as complex entities. Consequently, this article builds on studies of scientific practice and visualization to examine data as material objects rather than black-boxed representations. Data practices are not merely the technological components of experimentation, but are simultaneously technologies and methods and are intertwined with ways of seeing and enacting the biological world. Ultimately, this article questions the increasing invocation and role of complexity within biology, suggesting that discourses of complexity are often imbued with reductionist and determinist ways of thinking about biology, as scientists engage with complexity in calculated and controlled, but also limited, ways.
Introduction
We are living in an era of data. Biomedical research is increasingly carried out with computerized tools and databases, as knowledge is generated through the management, analysis, and interpretation of large volumes of data. Alongside such developments, the biomedical sciences are increasingly concerned with notions of biological complexity. Researchers are seeking to map the connections between the body’s molecular components (Loscalzo et al., 2007), and to move beyond linear notions of causation and the genetic determinants of disease (Mazzocchi, 2008). Biology and technology are inextricably linked: just as techniques for culturing cells are entangled with notions of life and time (Landecker, 2007), so are techniques for handling data entangled with notions of complexity. Consequently, this article asks: how should social scientists begin to theorize what it means to produce, interact with, and negotiate data, and how do the practices that surround data enable biomedical researchers to generate new understandings of biology and life?
This article takes as its starting point the field of ‘metabolomics’, 1 the post-genomic study of the molecules and processes that make up metabolism. My observations throughout this article are based on ethnographic research in the Computational and Systems Medicine (CSM) laboratory at Imperial College London, a leading research group in metabolic science, as well as on interviews with members of the broader metabolomics community in the United Kingdom. The activities of the CSM, which consists of more than 75 researchers conducting work on nutrition, toxicology, surgery and cancer, epidemiology, and data analysis techniques, are spread out across several laboratory facilities and research hospitals operated by Imperial College London. As one of the fastest growing fields of post-genomic science (Dutton, 2013) – which also include genomics, proteomics, and epigenetics (Blow, 2008) – metabolomics represents a key site for data-intensive and data-driven research. Its research is dedicated to working with large volumes of biological information, and to using computational and statistical practices to understand the dynamic and complex entity that is metabolism.
To learn about the data practices that characterize the field of metabolomics, I interview Jacob, a statistics-savvy researcher, in the atrium of the laboratory’s main building at Imperial College London. Jacob is one of many people in the laboratory attempting to measure and model ‘metabolites’ – small biochemical compounds – and the ‘metabolome’ – the sum of an organism’s metabolites and metabolic reactions – by conducting experiments on bodily fluids like urine and blood (Hunter, 2009; Nicholson et al., 1999; Nicholson and Lindon, 2008; Pearson, 2007). The goal of metabolomics research, explains Jacob, is to determine biomarkers, the measurable and quantifiable biological entities that can be statistically determined in relation to health and disease (Beger and Colatsky, 2012; Holmes et al., 2008; Metzler, 2010). Although biomarkers can technically correspond to any physiological or anatomic measurement, like height or weight, their molecular forms speak to the ways in which metabolism is intertwined with specific biochemical and statistical practices.
In our interview, Jacob describes his work on the development of statistical tools to analyze, visualize, and model metabolism. These tools allow him to make sense of the myriad of information – in the form of thousands of data points – generated in metabolomics experiments. The highly customizable computer programs that Jacob uses to write code and algorithms for the analysis of these data ‘let me get [my] hands dirty’, he says. They allow him to see and interact with his metabolic data in novel and situated ways, such that urine and blood samples exist as highly complex sets of computerized information, which, after statistical manipulation, can be transformed into biochemical molecules and metabolic pathways. Taking me over to his computer workstation to show me the process of data analysis, Jacob moves back and forth between data matrices and the graphs that represent them as I watch, writing line after line of code in the computing environment MATLAB, looking for those aspects of the data that are responsible for variation or errors.
The statistical tools that Jacob uses to transform biochemical data into understandings of metabolism highlight the centrality of data practices and quantification to the modern life sciences. Jacob, along with other researchers in the metabolomics laboratory, is participating in a shift from science practiced at the bench to science practiced at the computer. Metabolomics is one of many fields of ‘data-centric science’, in which laboratories function as centers for the storage and analysis of biological data (Moody, 2004; Swedlow et al., 2011). As scholars in both the natural and social sciences have argued, developments in computing and biomedical research co-evolved between the 1970s and 1990s, causing biology to converge with the informational sciences (Chow-White and Garcia-Sancho, 2012; Mackenzie, 2003; November, 2012; Thacker, 2005). Statistical practices, in particular, those that grapple with the large amounts of information created in the ‘data deluge’ of post-genomic research (Pollack, 2011), are integral to modern biomedical research.
As Jacob discusses the statistical practices he uses to understand and analyze metabolomics data, he describes metabolism as something that is inherently and utterly complex. The many pathways, biochemicals, and data points that make up metabolism, says Jacob, evade linear interpretations or explanations. Metabolism is a complicated internal process that is the result of multiple pathways, organ systems, and timescales, and also multiple genes, proteins, and metabolites. Within this worldview of metabolic complexity, biomarkers exist not as single entities, but rather as groups of biochemical compounds. Jacob explains, For biomarkers, for me, you can understand why I don’t consider a single molecule as a biomarker, for me it doesn’t make sense anymore. Not just with the data, but also with a biological process. For example, I don’t think a biological process is related to one enzyme or one metabolite … And if you extend that to the whole pathway, then you realize that characterizing one single biomarker is ridiculous … All of the [metabolites] which are in a network, they are connected, they cannot be on their own taken as a biomarker. It’s the combination that’s a biomarker.
Jacob’s statement crystallizes the overall focus of this article. Jacob’s approach to data analysis informs his understanding of the biological processes that underpin metabolomics experiments. His work is dependent on ‘multivariate statistics’, a broad domain of statistics involving the observation and analysis of many variables simultaneously. Multivariate techniques, which are used in ‘pattern recognition’ or ‘machine learning’ algorithms, emerged in the mid-20th century, and are used in forms of analysis such as principal components analysis, cluster analysis, and neural networks. 2 Multivariate statistics represent – or so researchers argue – a qualitatively different way of engaging with and seeing the biological world. By engaging with a multivariate analysis of biological information, Jacob views metabolic processes as similar to statistical data: as complex patterns of information that cannot be seen in isolation (see Figure 1). Metabolism is multiple and dynamic, and exists as the combined effect of multiple metabolites. But metabolism is also informational and statistical, in that it is comprised of interconnected patterns of data.
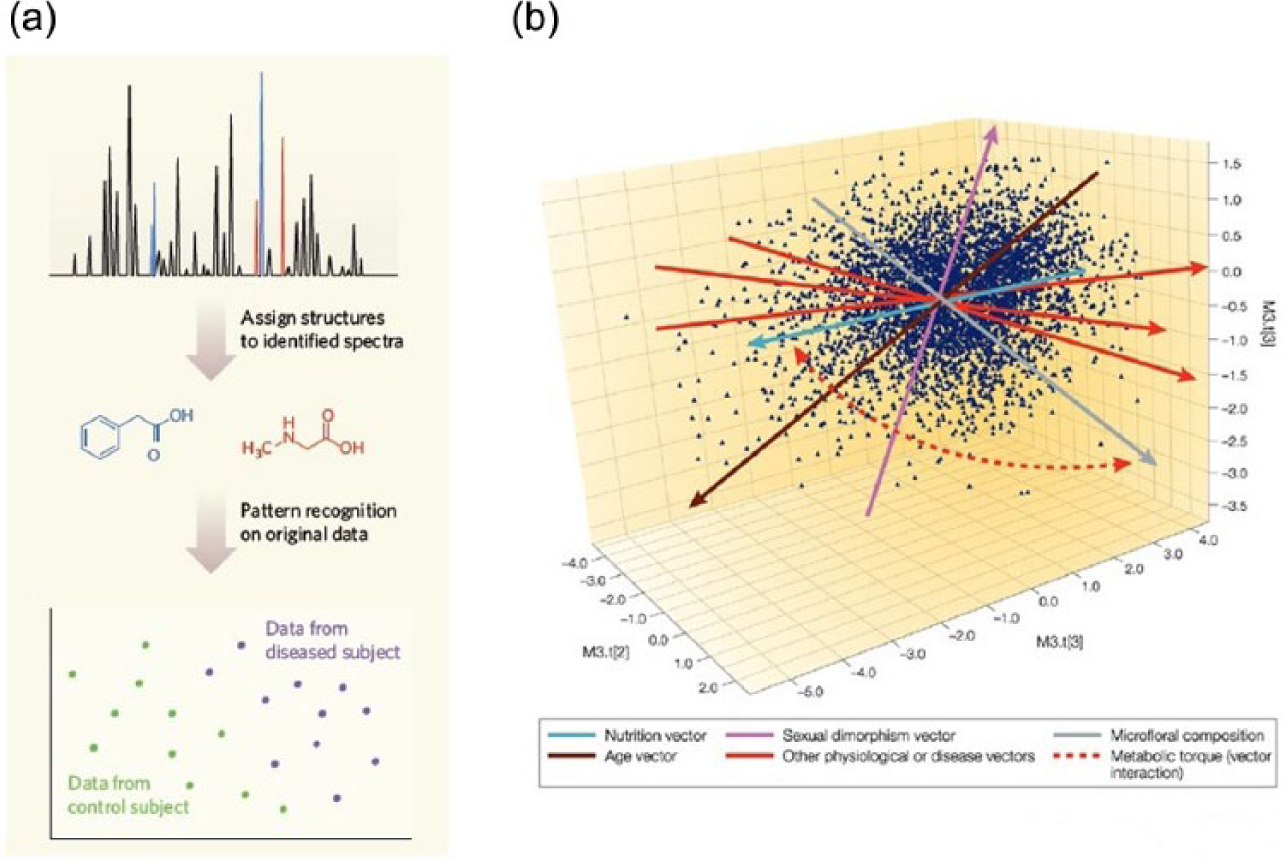
Metabolism as envisioned by metabolomics researchers: (a) a diagram showing the transformation of biochemical information (top) into understandings of specific biochemicals (middle) and consequently different metabolisms (bottom) (Nicholson and Lindon, 2008) and (b) a three-dimensional multivariate statistical diagram showing a cluster of different metabolisms, as well as the influences that determine their position in the diagram. Each dot on the diagram corresponds to the metabolism of an individual rat (Nicholson and Wilson, 2003).
Consequently, this article argues that through the everyday practices of data production and analysis, metabolism has come to be conceptualized and enacted as something inherently complex. It argues, in other words, that data practices are intertwined with ways of seeing and enacting the biological world, such that multivariate statistics both depend on and reproduce the notion that metabolism is complex. To begin, I combine approaches in anthropology and science and technology studies (STS) to emphasize the centrality of data practices to post-genomic research, and to argue that they must be considered as performative and material things. Drawing on my fieldwork, I show that multivariate statistics have emerged as the natural and obvious tools of metabolomics research. I then show how complex, statistical views of metabolism are made real and come to have meaning through the daily actions and negotiations of materials, technologies, and people. Ultimately, I discuss the meaning of ‘biological complexity’ in post-genomic research, and question its implications and uses in biomedical practice.
STS and statistical practices
This article aims to foreground the roles of data and statistical practices in biomedical research. In the era of post-genomic research and bioinformatics, much STS scholarship has focused on the visual graphs, charts, models, maps, and representations that are produced through computerized interfaces and statistical algorithms, and come to form the end products of science. These end products of data analysis are integral to making data meaningful in that they summarize relationships and communicate meanings within data and also enable particular modes of understanding and seeing data (Carusi, 2012; Dumit, 2003). To this end, STS and anthropological studies of visualization have examined the use and production of visual images, exploring how scientific objects become ‘visible’ through embodied practices of production (Alač, 2008; Myers, 2008; Prentice, 2005), and how seemingly pre-given visual objects are brought into being – and become meaningful – through historically and culturally specific practices and ideologies (Daston and Galison, 2007; Dumit, 2003; Myers, 2008). Such scholarship has shown how the visual does not merely represent an objective reality, but rather intervenes in nature to create such a reality (Coopmans et al., 2013; Lynch and Woolgar, 1990), privileging particular ways of seeing and interacting with the world (Haraway, 1997).
While much social scientific work has explored practices of visualization, comparatively little work has critically examined the practices and performative dimensions of data, information, and statistics that give rise to such visualizations. Scholars have examined the historical and social development of statistics (Hacking, 1990; MacKenzie, 1981; Porter, 1988), as well as the historical evolution of particular data techniques in relation to the development of computing and genetics (Chow-White and Garcia-Sancho, 2012; November, 2012). STS researchers have more recently begun to explore the dense relationships and challenges that surround data practices (Edwards et al., 2011; Fujimura and Rajagopalan, 2011; Gitelman, 2013; Mackenzie, 2003; McNally et al., 2012; Räsänen and Nyce, 2013; Stevens, 2011). A number of scholars, particularly in the history and philosophy of biology, have studied the organization, movement, and reuse of data with databases (Ankeny and Leonelli, 2011; Bauer, 2008; Borgman, 2012; Hine, 2006; Leonelli, 2012, 2013a). In addition, scholars have examined the regulatory and institutional configurations in which the use and value of data develop (Jasanoff, 2002; Keating and Cambrosio, 2012) – increasingly in relation to the open data and open science movements (Borgman, 2012; Leonelli, 2013b; Lezaun, 2013) – as well as the standards and forms of objectivity that enable such uses and values (Beaulieu, 2001, 2004; Frow, 2012; Mackenzie et al., 2013; Porter, 1995).
Taken together, these studies exhibit attempts to grasp the complex effects and materialities of data practices. This article draws on such scholarship in order to engage with the ways that data and statistics are practiced, performed, and negotiated in everyday settings. Data practices are no different from other forms of scientific practice: they appear as objective and natural, but are caught up in sociocultural, economic, and political networks. Although data are technically defined in information sciences as ‘facts, numbers, letters, and symbols that describe an object, idea, condition, situation’ (Borgman, 2012; National Research Council, 1999), I see data in a broader sense as technologies and practices which exist in various material and immaterial forms, and which also entail constellations of people, objects, ideas, and values. This deliberately all-encompassing notion directs attention away from the technical aspects of data, and toward the social and creative processes through which data are created, manipulated, and made to have meaning.
Following in the footsteps of proponents of ontological approaches to science (Barad, 2003; Haraway, 1988; Pickering, 1992; Woolgar and Lezaun, 2013), this article shows how data and statistics are enacted in metabolomics practices. Building on the laboratory studies made famous in the last several decades (Knorr-Cetina, 1999; Latour and Woolgar, 1986; Shapin and Schaffer, 1985), this article thus views data practices alongside other material practices – such as the biochemical analysis of metabolic samples or the writing of research reports – of the laboratory. Data are more than pre-given, immaterial, or cognitive representations: they emerge through diverse material and discursive practices, and are imbued with qualities, capacities, and values (Coopmans, 2011: 156). But moving beyond these earlier laboratory studies, this article also engages with the ways in which everyday practices are coproduced – or are in ‘looping effects’ (Hacking, 1990, 2007) – with situated understandings of biology. In other words, it explores how the practices of the laboratory not only become implicated in understandings of biology, but also how these understandings of biology shape the practices of the laboratory. Data practices play a pivotal role in the enactment of biology and metabolism in the metabolomics laboratory, as researchers learn to see metabolism and other concepts as ‘technologically mediated vision[s]’ (Coopmans, 2011: 158).
Multivariate statistics in practice
Although metabolomics is overarchingly concerned with the production, manipulation, and analysis of data, one of the primary aims of metabolomics research is to discover biomarkers that can be used to investigate the metabolic processes involved in health and disease (Beger and Colatsky, 2012: 3). Biomarkers are quantifiable molecular entities whose presence is correlated with – but not the causative agents of – conditions of health and disease (Frank and Hargreaves, 2003). 3 To investigate the biomarkers involved in metabolism, metabolomics researchers use technologies like nuclear magnetic resonance (NMR) and mass spectroscopy (MS) to measure the metabolites that underpin metabolic processes. This is similar to how genomics researchers use gene sequencing and microarray technologies to determine the molecular components of DNA and RNA. In the end, these metabolomics technologies transform biological samples into biochemical information, rendering urine and blood samples into chemical signals (Barton, 2011; Lindon and Nicholson, 2008). This is the ‘wet’ part of the experimentation, which has been the core of laboratory work in ‘traditional’ fields such as cellular biology and physiology, but takes up relatively little time and effort in metabolomics experiments (Stevens, 2011: 3).
Despite the importance of biomarkers and biochemical technologies, a large portion of metabolomics research is spent developing and using multivariate statistical technologies and techniques, which take the biochemical data generated in NMR and MS experiments and convert them into mathematical information. This information is analyzed with advanced computer tools: it is put into enormous data tables, standardized and processed, and analyzed by specialized algorithms and computer programming tools. Although a diverse array of computational methods and technologies is used during this data handling, metabolomics researchers use multivariate statistical practices to make sense of and interpret biochemical data. This type of statistics, as I examine in this section, measures hundreds of variables at once, rather than individual variables in isolation.
Within metabolomics, researchers make the broad distinction between univariate and multivariate forms of statistics. Univariate statistics are defined as those methods that measure single variables at a time. Multivariate statistics, in contrast, are defined as those methods that make sense of combinations of variables, or in other words, highly-dimensional data. Multivariate statistics, researchers claim, allow them to cope with large volumes of information (Esbensen and Geladi, 1990: 390), and to interact with biological data in new ways. However, the historical distinction between univariate and multivariate types of statistics is not so clear-cut, due in part to their entanglement with the development of other informational practices such as bioinformatics (Stevens, 2013) or biological computing (November, 2012). Although the histories of statistical techniques such as principal components analysis (PCA) and partial least squares (PLS) regression can be traced to specific individuals and historical moments, 4 the history of multivariate statistics as a whole relates broadly the rise of computing, and to the development of mathematical techniques that generated increased volumes of complex data, after the Second World War. As researchers were faced with increasing ‘numerical and quantitative complexity’ (Esbensen and Geladi, 1990: 390) – generated in the life sciences, for example, by the movement from test-tube reactions to NMR spectra – they turned to computing techniques that enabled them to tackle such problems with increased scale and power (Edwards, 2010: 171–172).
The multivariate statistical methods used in the metabolomics laboratory are, in practice, made up of a broad set of techniques and tools (see Figure 2), which are also used in other post-genomic fields like proteomics and genomics (Lee et al., 2008; Nicholson et al., 1999). Some form the core of laboratory work, while others are custom-made by those researchers who are more adept at computer programming. Broadly speaking, researchers carry out two types of statistical analysis: supervised, or ‘hypothesis testing’, analysis, or unsupervised, or ‘hypothesis generating’, analysis (Keating and Cambrosio, 2012). These approaches are exemplified in two common statistical methods, the unsupervised technique, PCA, and the supervised technique, PLS regression, respectively. Researchers use many other statistical methods, however, including self-organizing maps and cluster analysis (unsupervised), and nonlinear methods like orthogonal partial least squares regression (supervised) (Harris, 2001; Varmuza and Filzmoser, 2009). As one researcher commented, ‘Because the datasets are so complex, different [methods] focus on different aspects of the data. And it’s like looking at a three-dimensional object from different two-dimensional perspectives’.
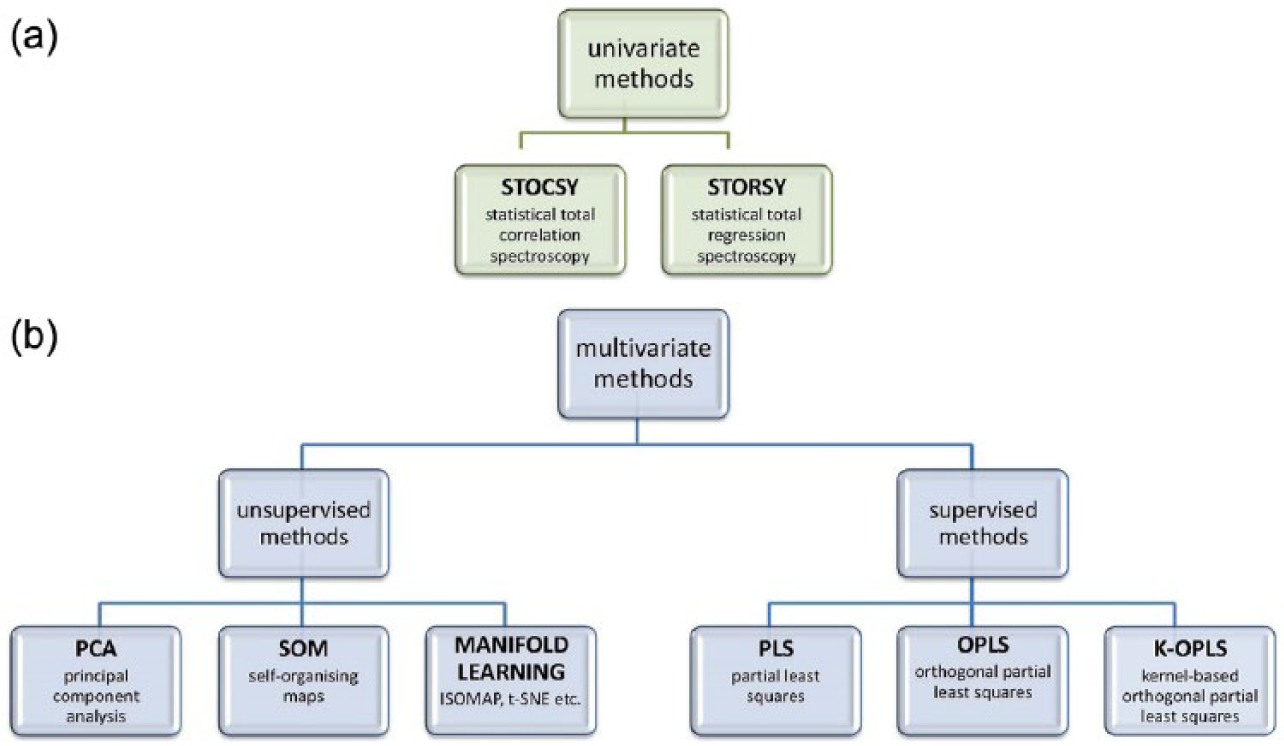
Diagram depicting the variety and hierarchy of statistical methods used to analyze metabonomics data. The methods are divided into (a) univariate statistics and (b) multivariate statistics, and are further divided into unsupervised (left) and supervised methods (right).
In practice, multivariate statistics are strange and mystifying: they are challenging subjects of research not only for social scientists, but also for many classically trained biologists. Much time and effort in the CSM was devoted to teaching students and researchers the theoretical basis for multivariate statistics, and also to familiarizing them with the variety of computational tools and software packages that could aid them in conducting multivariate statistical analysis. As Henry, one of the lecturers from the laboratory, described during an introductory lecture to graduate students, multivariate statistics can be understood by analogy to a supermarket. He said to the students, ‘Let’s imagine we’re gathering data from a supermarket, right? In the land of, I don’t know, metabolomia or something like that. There are some very strange behaviors going on in this supermarket that people want to analyze’.
Alternating between highly technical explanations and easy-to-follow analogies, Henry asked his students to imagine an experimental scenario in which individual customers were buying apples, oranges, carrots, and cabbages – which are referred to as ‘variables’ in statistics terminology – in a supermarket. He described how in this particular supermarket, some customers only bought apples and oranges, while other customers only bought carrots and cabbages. He then asked students to consider the pattern or relationship that was occurring among customers in the imaginary supermarket. Drawing diagrams on a white board, Henry described how this supermarket scenario was ideal for understanding multivariate approaches to data analysis. A univariate approach – which looks at single variables in isolation – would graph each customer’s purchases on four different axes, noting the various numbers of apples, oranges, carrots, and cabbages. But a multivariate approach – which looks at multiple variables in combination – would graph the customers’ purchases in terms of the categories of ‘fruits’ and ‘vegetables’. This approach invents two new variables – which are referred to as ‘factors’ – and graphs each person’s purchases along two new axes, instead of the original four.
Using this supermarket analogy, Henry emphasized that multivariate approaches to statistics simplified data analysis by taking four variables (apples/oranges/carrots/cabbages) and swapping them for two factors (fruits/vegetables) (see Figure 3), allowing researchers to capture complex relationships within data. Multivariate statistics, therefore, allowed researchers to cope with the large volumes of information generated in metabolomics experiments. They allowed researchers – in a term that is formally referred to as ‘dimensionality reduction’ – to examine the combined properties and relationships between multiple variables and samples. Looking at ‘tens or hundreds or thousands of [things] at the same time’ was incredibly difficult with univariate statistics. Concluding his seminar, Henry proclaimed, ‘To me, [multivariate statistics] does something so different from univariate analysis that you can’t really compare it’.
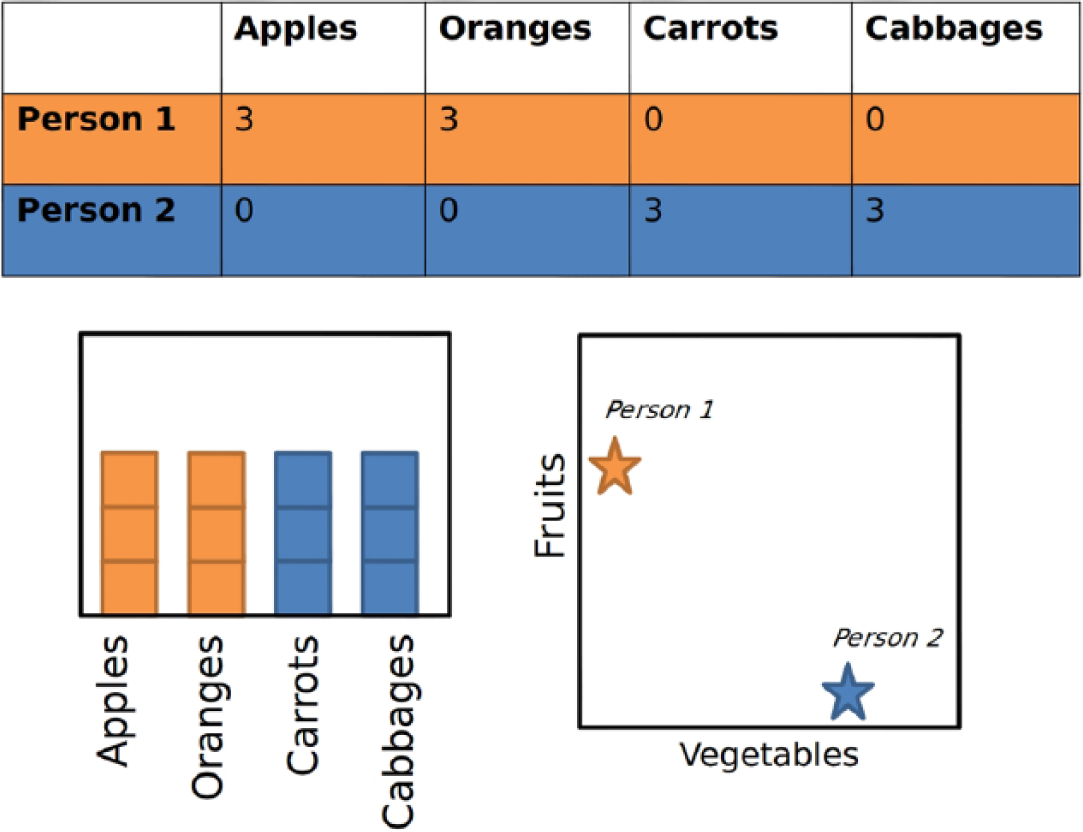
A diagram showing how multivariate statistics can be understood in terms of a grocery store analogy. The data from two people presented in the table (top) can be visualized as a univariate graph (left) with four variables, or a multivariate graph (right) with two factors.
Metabolomics experiments, however, typically involve many times this number of variables, and therefore entail complicated calculations and visualizations. Because it is impossible to track hundreds of variables on an individual basis – in the same way that it would be impossible to visualize a graph in which each variable corresponded to each of 100 axes or dimensions – researchers must find inventive ways of engaging with this form of data analysis. With the help of computers, metabolomics researchers reduce the complexity of their multivariate data to two- and three-dimensional graphs, in which each point on the graph corresponds to a sample rather than a variable. Multivariate statistical methods allow metabolomics researchers to grapple and cope with the otherwise unimaginable complexity of metabolism, and to track the meanings underlying the changes happening concurrently across hundreds of biochemicals or chemical pathways. Generating iterative multivariate statistical models of biochemical data, metabolomics researchers identify molecular signals and patterns that are statistically linked to differences between experimental groups of samples, and which correspond to combinations of specific biochemicals such as lactate, hippurate, and glucose.
But the question remains, what is the point of these statistical techniques, and why do they merit such an in-depth discussion? Ultimately, in metabolomics, multivariate statistics represent new forms of and practices for investigating health and disease. To this end, researchers in the CSM sought to generate biomarkers for complex diseases like obesity and colon cancer. However, they were also playfully interested in finding biomarkers for the best tasting cheeses or the geographical origin of juices (Bruker Biospin, 2013). In doing so, they drew on a range of metabolomics research devoted to assuring the quality of commercially produced food products (Cajka et al., 2011; Gougeon et al., 2009; Skogerson et al., 2009), and also described their interest in finding biomarkers for embodied perceptions like ‘gastronomical pleasure’ and ‘tastiness’. Such comments, although not altogether serious, reflect the ways in which metabolomics research gives rise to new, technologically mediated ways of investigating – and finding statistical correlations for – the complexity of metabolism, biology, and life.
Normalizing multivariate approaches to biology
Multivariate statistical practices, as I discussed in the previous section, form the core focus and productive effort of research in the metabolomics laboratory. Scientists use multivariate statistics to grapple with complex biochemical information, looking for patterns and differences among their data. Multivariate statistics, however, represent one of many approaches to data analysis. Researchers in the field of metabolomics deliberately choose to carry out statistical practices that are multivariate rather than univariate in nature, as these are deemed capable of accounting for multiple biological processes and endpoints. 5 Ultimately, this ‘decision’ to conduct multivariate statistics is reflective of the data and claims with which researchers work. Multivariate statistical practices, therefore, carry epistemological status: they are technologies not only associated with but also integral to the functioning and identity of metabolomics as a field.
During my fieldwork, I attended a scientific presentation given by a biochemist named Margaret, who was involved in a project trying to characterize the molecular composition of breath samples. Working with a machine that carried out selected ion flow tube mass spectrometry (SIFT-MS), Margaret analyzed the biochemicals present in various gases, including breath condensate. She worked on experiments that would typically fall under the realm of metabolomics, but because she was employed by a separate department within the Imperial College hospital network, she was not considered to be a metabolomics researcher by other members of the CSM. As a result, Margaret belonged to a different ‘epistemic culture’ (Knorr-Cetina, 1999) than did metabolomics researchers in the CSM. She did not have access to the customized programs and algorithms used to analyze data in the CSM, and instead interpreted her SIFT-MS data using the instrument manufacturer’s black-boxed commercial software, which included a database of pre-given standards and compounds.
As Margaret gave her presentation, the metabolomics researchers in the room became increasingly agitated and asked a number of challenging questions. I watched as Margaret showed slide after slide of bar graphs, with which she attempted to explain health and disease in terms of two or three biochemical compounds. According to the metabolomics researchers from the CSM, the research that Margaret described reflected generally poor scientific practice. She had taken the experimental apparatus that produced her results for granted, and had not sought to probe how the various parameters of the SIFT-MS machine had influenced her data. This was not standard practice in the CSM, where researchers tended not to trust pre-given machine standards, and instead sought to develop customized ways of verifying the accuracy and precision of their metabolomics data. More prominently in this episode, however, the research Margaret described reflected a set of experimental practices that conflicted with the CSM’s values about the correct forms of data and biological thinking. Margaret had presented her data as univariate, as involving a limited number of biochemicals in isolation. In response, the metabolomics researchers in the room asked her why she had not used multivariate statistics to analyze her data, which, to them, obviously involved complex pathways and multiple biological endpoints.
Several days later, I asked a postdoctoral researcher Sarah what she had thought of the presentation. Without hesitation, she said that she had been shocked by how Margaret had presented and explained her data. Sarah was surprised that Margaret had not sought a more in-depth understanding of the instruments that she had used or of the mechanisms underlying her work. Margaret had made too many assumptions, Sarah said, modeling only one or two compounds at a time. In order to evaluate the significance of Margaret’s work, Sarah needed more details: she needed to see all of the chemicals present, the timescales on which they were being detected, and the accuracy of the signals produced by the machine. She said to me, ‘I want to see the masses, I don’t just want to see things going up and down [on graphs]!’
Sarah was also appalled that Margaret had analyzed her data using univariate statistics. Approaching biochemical data in this way was unheard of among metabolomics researchers. It provided a view of the data that, Sarah felt, was not true to the complex biological processes that the research was trying to describe. Compelled to address this fundamental flaw in Margaret’s research, Sarah met with Margaret for several hours after her presentation to go over her data analysis, and to show her how she could improve her work by using the multivariate statistical models that were common to researchers in the CSM. Sarah explained to me that it was imperative that Margaret learn to determine the full range of biochemicals contained within her samples and to conduct multivariate statistics on her data. Otherwise, she said, ‘If [the head of the lab] saw this research, he would fire Margaret on the spot’. Multivariate analysis, according to Sarah and other researchers in the laboratory, was a ‘good’ and ‘correct’ type of analysis.
As this example shows, univariate statistics are seen as inappropriate methods and technologies for metabolomics research. On the one hand, the rejection of univariate methods reflects the ways in which metabolomics researchers are indoctrinated into the ‘correct’ ways of doing metabolomics research. Although metabolomics researchers enter the laboratory from a variety of disciplines – microbiology, analytical chemistry, statistical methods, veterinary medicine, to name a few – they are taught to think about and practice biological research in particular ways. In seminars, workshops, interactions with peers, and meetings with supervisors, they are introduced to particular technologies and techniques, all of which emphasize the importance of viewing metabolism in terms of multivariate biochemical information. As such, multivariate statistical practices invoke ‘previous dealing and cumulative practical know-how’ (Alač, 2008: 503), as well as notions of authority and control that come with understandings of the ‘right’ ways of doing and performing experiments (Shapin and Schaffer, 1985). These highly regarded ways of seeing, therefore, are the result of laboratory values and standards that operate within distinct sociotechnical networks.
Researchers’ use of multivariate statistics, however, is not just a product of formalized and institutionalized methods for analyzing data. Rather, their embrace of multivariate over univariate methods is also an indication of the complex nature of metabolomics data and of the ways researchers feel they must engage with the complexity of metabolism. As Jane Calvert has documented in her work with systems and synthetic biologists, many researchers recognize that biological complexity ‘is inescapable’ (Calvert, 2008: 393), and that, rather than being reduced, it should entail the development of new methods to embrace this complexity. In a similar way, metabolomics researchers’ insistence on using multivariate statistics could be seen as the desire to engage with and capture – rather than reduce or trivialize – metabolic complexity.
To this end, I spoke with Judy, a chemometrician who was finishing her PhD on the entanglements between multivariate statistics and metabolomics at the time I was doing my fieldwork. As Judy explained her research, she reminisced about the initial project she had been given when she arrived at the CSM. Its goal was to explore how molecular techniques could better establish the biological mechanisms of obesity, revealing whether people were ‘fat on the inside or fat on the outside’. To do so, the project examined whether magnetic resonance imaging (MRI) data could be used to determine the fat composition of inner bodily tissues, and whether these molecular measures would correspond to external indicators of fatness such as body mass index (BMI) or waist-to-hip ratio.
As part of the project, Judy had been tasked with using multivariate statistical methods to examine the data generated by MRI scans. MRI scans are commonly used to examine injuries in tissues, understand the physiology underlying bodily conditions, or produce images of internal tissues and structures. Beyond their imaging capabilities, MRI scans can also be used to generate low-resolution NMR spectra of the tissues they are scanning. Their relatively low field strength – the resolution of the signals that an NMR spectrometer can show – makes them suitable for identifying macromolecules like water and fat, but less useful for identifying the typical number and range of biochemicals seen in metabolomics experiments. Judy’s work sought to test whether MRI data could theoretically and practically be analyzed with metabolomics methods or used in metabolomics experiments.
Judy recounted to me that after one year of research, she had been forced to abandon the project and find another focus for her PhD. While MRI scans generated biochemical data in the form of information about the fat and water content of various tissues, they were not suited to analysis with multivariate statistical tools. According to Judy, the MRI data were of too low resolution, in that they did not show the multitude of biochemicals that metabolomics researchers were used to working with. Judy said, ‘So the data about the fat, basically you have two peaks, a fat and a water peak. So doing multivariate statistics on two peaks is a little bit silly … you can [just] use a classical statistics type thing’. The complexity of the methods Judy used to analyze data did not correspond with the complexity of the MRI data she was attempting to manipulate.
Despite her interest in working with MRI technology, Judy had abandoned the project because of these challenges. It was not worth her time to work with the data that could be analyzed with univariate statistics – with a simple correlation between levels of fat and water among different people – in an Excel spreadsheet. Thus, the MRI data were not suitable for use in metabolomics experiments, in which researchers used advanced multivariate statistical methods and complex ‘handmade’ computer algorithms. Although the MRI data contained useful and biologically relevant data, they did not fit with the methods and goals of metabolomics research. Judy’s decision to focus on other research projects, therefore, was intricately tied to her desire to focus on data that espoused the complexity of metabolism.
The examples of Margaret and Judy highlight the value that metabolomics researchers place on the use of multivariate statistics in metabolomics experiments. Multivariate statistics, although they represent one of many approaches to the analysis of metabolic data, are highly normalized – and to a certain extent institutionalized – methods for the analysis of multifactorial biochemical data. In the juxtaposition between univariate and multivariate statistics, those statistical practices that are deemed ‘correct’ can be seen to be imbued with and reflective of scientific values and qualities in relation to data and complexity. Thus, the value placed on multivariate statistical practice can be understood in relation to particular ways of seeing and understanding biology that are situated within networks of materials, people, and standards. Multivariate statistics are not simply a technology or method for coping with large amounts of data, but rather are intrinsic to the methods, ideas, and values of metabolomics as a field.
Enacting metabolic complexity
Multivariate statistical practices, as I have argued, entail particular ways of understanding and engaging with metabolism. However, it is not only that multivariate statistical practices create new understandings of metabolism, but also that these visions of metabolism drive the creation and use of complex and multifactorial informational practices. To this end, metabolomics researchers simultaneously draw upon and produce multivariate statistical practices, and with them complex biological meanings. Complexity and multivariate statistical practices are coproduced, such that multivariate statistics do not just represent a biological reality of molecular complexity, but rather intervene in and create one. Particular ways of visualizing and understanding metabolism must be understood in relation to the data practices that enable metabolomics researchers to investigate metabolic complexity.
I worked closely with Natalie, a former immunologist turned metabolomics researcher, conducting experiments and learning about the practices common to metabolomics research. Natalie’s project examined the relationship between the metabolism and immune function of pigs, and was situated within a growing arena of biomedical research that seeks to understand how the bacteria that live inside of our gut influence our health (Nicholson, 2006; Nicholson et al., 2005). In her experiments, which involved analyzing urine, blood, and liver samples from pigs, Natalie was trying to identify biomarkers that corresponded to ‘healthy’ gut bacteria. These experiments were built on the idea, long established in biology and recently popular with food companies, that positive changes in gut bacteria can be induced by the ingestion of probiotics. As a result of her experiments, Natalie was detecting, measuring, and modeling several biochemicals – hippurate, lactate, and p-cresol – in urine, which were produced by the combined metabolism of pigs and bacteria.
To determine the biochemicals involved in the biomarkers for ‘healthy’ gut bacteria, Natalie spent many hours in front of her computer. To investigate potentially important biochemicals, she generated a series of multivariate statistical models – using, for example, PCA – that took the myriad numbers from her experiments and transformed them into meaningful information. Such unsupervised methods were ‘hypothesis generating’, in the sense that they sought to generate or discover meanings rather than to prove preconceived relationships. In essence, Natalie used these statistical tools and techniques to investigate which factors were responsible for the differences among the samples. She wanted to see whether the differences corresponded to experimental factors like the sex or age of the pigs, or to particular biochemicals.
One afternoon, as Natalie sat at her computer flicking back and forth between multivariate algorithms and the two-dimensional graphs they produced, she discussed the contrasting use of statistics in the more ‘classic’ field of immunology versus the ‘newer’ field of metabolomics. Due to a collaboration with another university, Natalie was analyzing not only metabolic data but also immunological data in the form of cytokine assays. Because these assays measured the levels of only 10 different immunological molecules, in contrast to the hundreds of biochemicals detected during metabolomics experiments, Natalie could use simple, univariate statistical calculations, such as the t-test or analysis of variance (ANOVA), to make sense of her immunological data (Genser et al., 2007).
Univariate statistics, Natalie explained, were used to confirm relationships and meanings that were visually apparent in data. In other words, univariate statistics were used to verify that the patterns observed via other experimental means were statistically significant. Remembering my 4 years of experience as an undergraduate in an immunology laboratory, the researchers in my laboratory had also used univariate statistics in this way. We had conducted statistics on our experimental data, which showed obvious visual differences between experimental and control groups, to prove that our findings were significant and had not occurred by chance. As such, univariate statistics had been a tool to confirm, rather than explore, the meanings that were otherwise obvious in the immunological data.
In her discussion of univariate statistics and immunological data, Natalie illuminated the nature of the multivariate statistics in metabolomics research. She said, All you’re doing [in immunology] is using [statistics] to confirm something that you can see visually. Whereas when you go into metabolomics [data], you can’t often see visually what’s happening. So you have to use the statistics to then be able to see what it is to look for.
Multivariate statistics not only allowed her to process large datasets, but also gave her the ability to make sense of data that were too complex, and held too many data points and patterns, to be interpreted by eye. Without advanced multivariate statistical tools, Natalie would have been drowning in her data, unable to interpret the immense amount of biochemical information she had generated in her metabolomics experiments. Even with the aid of sophisticated multivariate statistics, Natalie labored to understand how to interpret – and translate into biomarkers – the biochemicals going up and down over time in complex patterns. In engaging with huge quantities of data, she struggled to understand what information was meaningful.
Natalie’s understanding of her data required significant effort: it was an active process in which she developed an understanding by working through statistical and computerized approaches to data. Like many other researchers in the laboratory, Natalie used multivariate statistics to explore and create the meanings contained within her metabolomics data. As another researcher commented, multivariate methods could ‘extract’ or ‘reveal hidden differences’ within data, differences which might otherwise be obscured by visual or manual data analysis. Because of the multitude of statistical associations and relationships that could exist within complex datasets, the relationships Natalie found between healthy gut bacteria and biomarkers were not literally ‘given’ or waiting to be ‘discovered’. Instead, they were enacted through the multivariate statistical practices of the metabolomics laboratory. As Natasha Myers has similarly noted in her work on protein modeling, researchers use their experiences developing computer models to shape their understandings of biology (Myers, 2006). She writes, ‘X-ray crystallographers’ extensive assemblage of machines – including metaphors and interactive digital visualization media – [are] collectively geared to produce and interpret atomic resolution models of proteins as molecules’ (Myers, 2006: 11). Natalie’s ability to find biomarkers – to glean meaning and value from her data – was intricately tied to multivariate statistical practices and technologies.
Natalie’s active involvement in the process of statistical analysis and the production of biomarkers also highlights the dynamic elements of play and craft involved in metabolomics research (Leahey, 2008; Roosth, 2013; Wilf, 2013). Researchers like Natalie develop and forge understandings of their data by producing, amending, and revising statistical analyses and visualizations. As researchers engage with the material-semiotic reality of the laboratory, they participate in ‘a dynamic interaction between trying to … generate an image that best fits what is being expected, and discovering an image that in some sense tells its own story’ (Cohn, 2007: 99). But this process is also governed by the standards and protocols that pervade metabolomics research, which direct researchers to use some methods – and to produce some images – over others (Mackenzie et al., 2013; Moreira, 2012; Timmermans and Berg, 1997, 2003). In this way, the production of biomarkers through multivariate statistical practices involves both play and standardization, both improvization and protocols.
Thus, Natalie used multivariate statistics to enact a view of metabolism that was dynamic, multiple, and interconnected. She viewed metabolism as the combined effect of not only genes and environment, but also gut bacteria. As Natalie commented, It’s the result of the fact that biological processes are multivariate in nature. You can never take something in isolation, really … when you look in biological systems, everything is dependent on each other … It’s like saying my leg hurts, and somebody saying did you eat a banana this morning, and then not looking at the fact that they’re actually trapped under a rock. It’s just, if you only look at one thing, you’re limiting yourself by the information you’ve got.
Accordingly, the metabolites she detected in her experiments had resulted not only from the metabolic processes under the control of the pig genome, but also the metabolic processes under the control of the diverse colony of bacteria occupying the large intestines of pigs. Moreover, these metabolic processes were interdependent rather than independent: they acted in unison to coordinate the digestive and overall health of pigs, and to regulate the metabolism of the organism as a whole.
Natalie’s example highlights how metabolomics researchers use the active process of working through multivariate statistical analyses to develop multifactorial understandings of metabolism. In this process, multivariate statistics emerge as the normalized and obvious tools for understanding health and disease: researchers use, need, and reproduce multivariate statistics to make sense of a biological world that is viewed in terms of complex systems instead of single genes or isolated pathways. Their practices allow researchers to explore the complex relationships in metabolic pathways, but their practices also enact an interconnected and multiple view of metabolism. Multivariate statistics are central to metabolomics not only because of institutional norms and practices, but also because the notions of complexity espoused by metabolomics cannot function independently of multivariate statistics.
Discussion: complexity and the biomedical sciences
Multivariate statistical practices entail new ways of interacting with and enacting metabolism. This article draws attention to the ways in which biological meanings and values are dynamically entangled with technological – in particular, statistical – practices. I argue that researchers both draw upon and produce multifactorial, complex understandings of metabolism through biochemical and statistical practices, such that biology and statistics interact and reciprocally shape each other.
In particular, this article highlights the conceptual centrality of multivariate statistics to biomedical laboratory practices. Data practices have remained undertheorized in STS scholarship on the biomedical sciences, and yet play an increasingly large role in the way that biological information is explored, reasoned, produced, and translated into clinical settings. This article advances scholarship in STS to show how entities considered to be in the cognitive and representational domain of reasoning are material, contingent, and enacted in practice. Moreover, many of the statistical methods and techniques that are discussed in this article are not specific to the field of metabolomics, but rather apply more generally to post-genomic research in fields such as proteomics, epigenetics, and systems biology. The entanglement of data practices and complex understandings of biology can therefore be generalized more broadly to other areas of research in which multivariate statistical practices are also central.
On the whole, multivariate statistical techniques allow researchers to cope with the increasing amount – and therefore the increasing complexity – of data produced through metabolomics research. But at the same time, these statistical techniques are integral to the ideas and identities of metabolomics research. They are normalized ways of investigating and making sense of biology, and are supported by historical narratives and institutionalized practices. Thus, multivariate statistics exist as both a tool and an endpoint in and of themselves. They cannot be bracketed as the ‘technological’ component of metabolomics research, but must instead be seen as an intrinsic amalgamation of material techniques, ideas, and values.
Multivariate statistical practices showcase metabolomics’ conceptual, methodological, and epistemological commitment to biological complexity. This article, therefore, foregrounds how data practices shape and are shaped by biology, giving rise to new ways of conceptualizing and intervening in biology. Metabolomics researchers are investing in this multivariate view of the biological world as something new and exciting. In doing so, they not only carry out multivariate practices and produce multivariate facts, but also propagate multivariate values about what constitutes the best ways of enacting the biological world. As such, a notion of metabolism as a multiple and complex process is not waiting to be discovered, but instead. Instead, it is actively created and enacted by scientists, and in specific, situated ways.
Thus, the question remains: ‘what is this complexity with which metabolomics researchers are grappling?’. As a conclusion to this article, I argue that multivariate statistical practices enact a world in which biology is not seen as a linear, one-dimensional, or ‘flat’ set of information, code or text (Kay, 2000, as cited in Myers, 2008). In contrast, multivariate statistical practices give life to metabolism by generating nonlinear, multivariate, and dynamic ways of engaging with the molecular biological world. It might seem, even, that through these practices ‘life itself’ is construed as something emergent, temporal, multiple, and dynamic (Rose, 2013). Emerging practices shift away from a linear and univariate view of biology, to embrace the ‘multi-dimensional structures’ and dynamic nature of biological data. In doing so, they allow researchers to grapple with complex metabolic pathways and meanings. With multivariate statistical practices, ‘the objects of molecular biology are becoming tangible and workable in new ways’ (Myers, 2008: 164). Metabolism emerges as something multiple and interconnected, but still fundamentally informational and statistical.
Although multivariate statistical practices allow metabolomics researchers to enact biological complexity, they do so in controlled and calculated ways (Rheinberger, 1997). Metabolic complexity calls for new tools, technologies, and practices, such that complexity is ‘continually encountered; but then also seamlessly bracketed’ (Wynne, 2005: 69). Thus, metabolomics engages with complexity, but on specific – statistical and biochemical – terms, and within the controlled environment of the laboratory. Echoing Hannah Landecker’s (2011) observations about epigenetics, environmental factors such as age and diet, and bodily conditions such as kidney functioning or fat absorption, are quantified and inserted into mathematical equations. Metabolomics researchers’ use of multivariate statistics represents attempts to engage with and enact complexity in pragmatic ways. Despite invocations to complexity, nature and culture remain separate (Throsby and Roberts, 2010), while biomedical knowledge continues to focus on the molecular and metabolic – rather than environmental or social – aspects of disease.
Metabolomics recognizes and engages with what philosopher Georges Canguilhem (1989) referred to as the ‘vitality’ of living systems, but in controlled and standardizable ways, and with the aid of particular laboratory tools, techniques, and practices. What is at stake, then, is the extent to which emerging biomedical research projects like metabolomics can capture the inherent complexity and vitality of life – the essence of what makes us human – through advanced multivariate statistics. While biochemical measurements can capture and model the physical interactions between the molecules and cells within our bodies, it is unclear whether they can capture the social relationships, embodied reactions and emotions, and dynamic relationships with the environment that make us human.
Given the importance and ubiquity of multivariate statistical practices in the post-genomic sciences, how far does the complex thinking espoused by metabolomics research extend, and what are its potential consequences for medical practice? Although biomedical fields like metabolomics represent potentially new and improved ways of engaging with health and disease, they also raise fundamental concerns about how the increasingly technological nature of biomedicine might have negative effects on medical diagnosis, treatment, and care. For example, what aspects of metabolism, health, or individuality are multivariate statistics able or not able to quantify? How do the quantitative capacities of multivariate statistics compare to the interpretive abilities and judgment of trained biomedical professionals? Such questions are increasingly important in light of the rise of ‘big data’ approaches to biology, as researchers seek – through paradigms like personalized, systems, and precision medicine – to address health problems through the combined analysis of multiple types, scales, and timelines of data. In the end, we must evaluate how technological engagements with complexity not only advance scientific knowledge of biological processes, but also portend the increased disciplining, regulation, and commodification of bodies.
Footnotes
Acknowledgements
An earlier draft of this article was awarded the 2013 Nicholas C Mullins Award for outstanding graduate scholarship in the field of science and technology studies by the Society for Social Studies of Science (4S). First and foremost, I would like to thank the metabolomics researchers at Imperial College London for providing me with the insight and knowledge that made this work possible. I would also like to thank my supervisors Simon Cohn and Stanley Ulijaszek for their help and support with my research, as well as Hannah Landecker, Kaushik Sunder Rajan, Sabina Leonelli, Tanja Schneider, Beth Morrissey, Donald Chambers, Amy Hinterberger, and Andrew Symington for their insightful feedback.
Funding
This research was supported by the Biosocial Society and the PEO Sisterhood.