
Abstract
This article reports a survey of workplace violence in Hong Kong. A sizable number of the 1,198 organizations that were questioned reported that they had experienced such violence over the 2 years preceding the study, but the problem was not prevalent. In both the private and government sectors, nonphysical violence happened more frequently than physical violence, and there was a reported lack of preparedness of many organizations to deal with the violence. Compared with private organizations, government organizations experienced more coworker and customer violence, but more private than government organizations believed that workplace violence caused the loss of key employees and clients. Correlation analysis found that a subculture of workplace violence appears to emerge over time, such that the more customer violence is experienced, the more is coworker violence, and the more the nonphysical violence, the more the physical violence. These findings are discussed with reference to international findings.
Introduction
It is now widely acknowledged that aggressive and violent behavior in the workplace is an occupational health and safety hazard experienced by millions of workers around the globe (Chappell & Di Martino, 2006). Definitions and descriptions of workplace or occupational violence, as it is commonly termed, tend to differ somewhat from place to place, but at the international level, the most commonly cited and authoritative statements about such violence are those issued by the International Labor Organization (ILO) and World Health Organization (WHO). According to a Code of Practice on workplace violence in the services sector adopted by the ILO in 2003 (ILO Sectoral Activities Program, 2003), this form of violence is defined as: “Any action, incident or behavior that departs from reasonable conduct in which a person is assaulted, threatened, harmed, injured in the course of, or as a direct result of, his or her work. Internal workplace violence is that which takes place between workers, including managers and supervisors. External workplace violence is that which takes place between workers (and managers and supervisors) and any other person present at the workplace” (ILO Sectoral Activities Program, 2003, Clause 1.3.1). The WHO definition of workplace violence is more succinct: “Incidents where staff are abused, threatened or assaulted in circumstances related to their work, including commuting to and from work, involving an explicit or implicit challenge to their safety, well-being or health” (ILO, International Council of Nurses, WHO, and Public Service International, 2002, p. 3). Overall, workplace violence ranges from homicide, at one extreme, to physical violence, threats, stalking, verbal abuse, and other conduct that is likely to have a psychological impact on the victim (Chappell & Di Martino, 2006; Flannery, 1996; Mayhew, 2000).
Literature Review
Workplace violence has become the subject of extensive research and policy analysis at the international level (Chappell & Di Martino, 2006; Hahn et al., 2008; Hatch-Maillette & Scalora, 2002). In the United Kingdom, for example, where a range of national data sources exist concerning the nature and prevalence of workplace violence, the British Crime Survey 2006-2007 indicated that there were approximately 397,000 threats of violence and 288,000 physical assaults by members of the British public on workers during the 12 months prior to the interviews (Health and Safety Executive, 2008). Male workers (1.9%) were more at risk of being victims of this violence than women (1.3%). Protective service occupations, such as security guards, experienced the highest risk of assaults, with a rate of 5 times that of any other submajor occupational group. The British Crime Survey also estimated that in 40% of assaults at work, the offender was under the influence of alcohol in the opinion of the victim, whereas an estimated 31% of threats at work were made by someone affected by alcohol. In an estimated 16% of cases of assault, the victim believed that the offender was under the influence of drugs. An estimated 56% of assaults were perpetrated by a stranger; the next highest group (17%) being clients or members of the public known to the victim through work (Health and Safety Executive, 2008).
The European Working Conditions Survey undertaken in 2000 found that physical violence was experienced most in the health care and educational sectors throughout the European Union. It was also reported that physical violence was much more likely to have been inflicted by people who were not fellow employees and most typically by customers or clients. About 4% of respondents across the European Union said that they had experienced such physical violence. A country-by-country analysis showed that the prevalence of physical violence of this type was highest in those nations with the largest welfare service sectors, such as the Scandinavian countries, and especially in health and social care agencies (European Foundation for the Improvement of Living and Working Conditions, 2005).
In the United States, it was found that nationally nearly 5% of all organizations, including state and local governments, had experienced a violent workplace incident within the 12 months preceding the study (U.S. Bureau of Labor Statistics, 2005). State government organizations had more violence than city government organizations and private enterprises (32% vs. 15% and 5%). Manufacturing industries (40%) experienced more coworker violence than service industries (31%), whereas service industries experienced more violence against staff committed by criminals (18% vs. 5%) and customers (31% vs. 4%) compared with manufacturing industries. Over 70% of workplaces had no formal program or policy that prevented violence, and such programs were more prevalent among governments and larger private organizations.
Agencies such as the ILO and WHO have, for instance, issued guidelines regarding the most effective ways to prevent and respond to such violence (ILO Sectoral Activities Program, 2003; ILO, International Council of Nurses, WHO, and Public Service International, 2002; WHO, 2008), whereas the European Union has offered extensive advice to member states about measures they should take to minimize the threat posed by both physical and psychological violence occurring in the workplace (Chappell & Di Martino, 2006). In some health care settings in Australia and England, the favored strategy adopted has been that of a zero tolerance approach in response to the serious problem of patient and visitor violence in general hospitals (Ayranci, Yenilmez, Balci, & Kaptanoglu, 2006; Benveniste, Hibbert, & Runciman, 2005; Hahn et al., 2008; Hatch-Maillette & Scalora, 2002; Holmes, 2006). Despite international awareness of the nature, scope, and gravity of the problems created by workplace violence growing exponentially during the past decade or more, scant attention has been given to this issue in Hong Kong. It is within this general context that we report in this article on the findings from a study of workplace violence conducted in Hong Kong, a part of China that has been governed as a Special Administrative Region since 1997. The study is the first of its kind to be attempted anywhere in China. It provides an initial glimpse into the problems associated with workplace violence and ways of responding to them.
The Context of Hong Kong
In Hong Kong, the Occupational Safety and Health Ordinance sets out responsibilities for the safety and health of employees at work. Section 6 of the ordinance requires that “every employer must, so far as reasonably practicable, ensure the safety and health at work of all the employer’s employees”. Failure to comply with this provision may result in financial penalties or imprisonment, depending on the gravity of the breach (see the ordinance: S.6(3) and (4)). For the purposes of reporting, “occupational injury” accidents are cases arising from work accidents resulting in death or incapacity of work for more than three consecutive days and reported as such under the Employees’ Compensation Ordinance of Hong Kong (Labor Department, 2008, p. 5).
According to official statistics, 610 persons were reported to be injured in accidents involving workplace violence in 1998 in Hong Kong (Table 1). In 2007, the number of injuries of this type had risen to more than 1,000 (all nonfatal), representing 0.39 injuries per 1,000 employees. The official statistics show that although the rates of all occupational injuries in Hong Kong were in decline over the last 10 years, the injury rates of workplace violence rose for much of the same time, reaching a peak in 2004. Workplace violence injuries per 1,000 employees rose from about 0.33 in the turn of the century to 0.46 in 2004 and remained steady at 0.43 in 2005 and 2006. A more detailed breakdown is provided of these 2006 and 2007 statistics, showing the major industries affected. It is seen that in both years the seven industries that experienced the greatest number of reported incidents were in the following order: medical and related health services, business services, import and export trade, welfare institutions, transport and related services, catering, education services, and retail trade (Labor Department, 2008). Research on workplace violence has been lacking in Hong Kong, but the findings support the above trend. For instance, a study of workplace violence experienced by more than 400 nurses in Hong Kong found that about three quarters reported abuse of some kind, including verbal abuse (73%), bullying (45%), physical abuse (18%), and sexual harassment (12%; Kwok et al., 2006). Another study found that workplace violence was not uncommon in the emergency departments of hospitals in Hong Kong but most of this violence was of an abusive verbal form, expressed by patients and their relatives (Chung, 2003).
Injuries from Workplace Violence 1998-2007
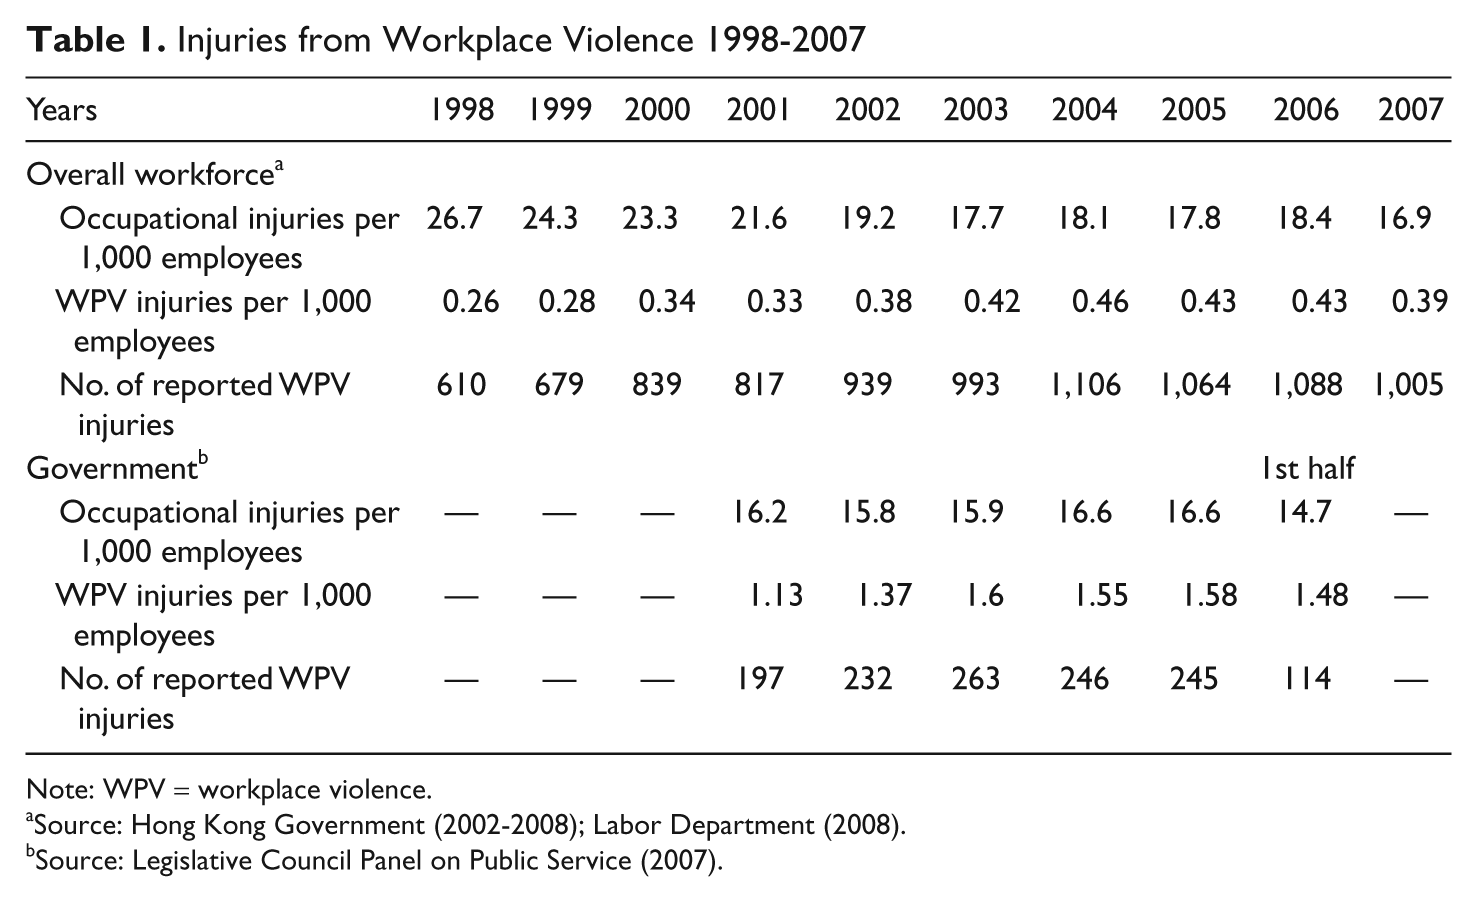
Note: WPV = workplace violence.
The situation in the government is even worse. When compared with their counterparts in the private sector, government workers suffered more. Figures between 2001 and 2006 indicate that although the government had less occupational injuries per 1,000 government employees (ranging from 14.7 to 16.6) than the overall workforce of Hong Kong (17.7-21.6), injuries in workplace violence per 1,000 government employees (1.13-1.6) were about 3 times higher than that of the overall workforce (0.33-0.46; see Table 1).
Study Design and Methodology
Sampling
This study was commissioned by the Occupational Safety and Health Council of Hong Kong. The research team conducted a cross-sectional Hong Kong–wide survey of companies in different industries and government departments in 2006. As the government is the body that has the most up-to-date information, the research team paid the census and statistics department to conduct a simple random sampling and generate a list of 15,621 sampled units for the study. In the private sector, the samples were companies or nongovernment organizations. In the government, the samples were service units. The government has a number of departments that render public services. Each department has various service units located in different districts to contact citizens and handle the day-to-day service delivery. It is at this “unit” level that the samples were drawn.
A self-administered questionnaire, available in both Chinese and English and together with an invitation letter and a self-addressed return envelope, was mailed to the human resources manager of the sampled companies. For government service units, the invitation was sent to the unit head. They were asked to return the completed questionnaire within 3 weeks. Eventually, a total of 1,198 valid questionnaires were collected, with a response rate of 7.7%, which was similar to the response rate of other local studies using a mailed questionnaire. The majority (87% or 1,042) of the responding organizations were companies and nongovernment organizations, and 13% (or 156) were government service units.
Almost one third (31.3%) of the companies were engaged in wholesale, retail, import/export trades, restaurants, and hotels; 20% in financing, insurance, real estate, and business services; 19% in community, social, and personal services; 8% in manufacturing; 4%, respectively, in transport, construction, storage, and communication; and less than 1%, respectively, in electricity, gas, water, agriculture, and fishing. In terms of size, 85.8% of the companies were small (with less than 50 employees); 9.9% were large (with a staff force of 100 or more); and 4.3% were of medium size (with 50 to less than 100 employees).
The sampled government service units came from 40 departments—12% from social welfare; 6%, respectively, from health and home affairs; 5%, respectively, from fire services, the police force, architectural services, lands, and water supplies; 3%, respectively, from drainage services, housing, marine, information services, inland revenue as well as agriculture, fisheries, and conservation. The remaining 26 departments represented had one to three units responding, accounting in total for 26.9% of the government respondents. Thus the overall samples were representative. All the responding government units provided some kind of direct services to the general public in service situations that might make them vulnerable to assault and other forms of violence.
Questionnaire Construction
The survey aimed to study the nature, impact, and preparedness of workplace violence in Hong Kong. To maintain cultural relevance in the construction of questionnaire, we took reference from the only two existing local studies on workplace violence (Chung, 2003; Kwok et al., 2006). Because both studies were conducted in hospitals, the researchers modified their questionnaires to suit the government and other sectors. Kwok et al.’s (2006) questionnaire was adapted from the one used by WHO, and the other used by Chung (2003) was self-constructed. From these two studies, we identified a number of acts that were regarded as violence, such as verbal abuse, use of foul languages, insult, sniggering, threatening or intimidation, physical assault, slapping, kicking, damaging or attempt to damage property, sexual harassment, and other forms of physical damage. We also referred to the guidelines of the U.S. National Institute for Occupational Safety and Health (2006), which defines workplace violence as any type of physical assault, threatening behavior, or verbal abuse. Examples include beating, stabbing, rape, threats, obscene phone calls, intimidation, swearing, and shouting. Based on these behaviors, we constructed two scales. The “physical violence scale” has 6 items (see Table 2) and its Cronbach’s αs are .739 for coworker violence and .799 for customer violence. The nonphysical violence scale has 8 items (see Table 2) and its Cronbach’s αs are .857 for coworker violence and .874 for customer violence. This suggests that the internal consistency of the two scales is high.
Occurrence of WPV in Private and Government Organizations

Note: WPV = workplace violence.
Responses were made on a 4-point scale and coded as 1 = never, 2 = seldom, 3 = sometimes, and 4 = always. Percentages reported in this table were computed from a collapsed frequency count on the last three categories.
p < .05. **p < .01. ***p < .001.
In our questionnaire, a 4-point Likert-type scale was used, with 1 = never, 2 = seldom, 3 = sometimes, and 4 = always as well as 1 = strongly disagree, 2 = disagree, 3 = agree, and 4 = strongly agree. In the questionnaire, respondents were requested to answer whether the 14 acts outlined in Table 2 had occurred within their respective organizations over the 2 years preceding the study. For those organizations that had experienced such acts, further information on the impacts of violence on the organization was sought. All the organizations were also asked how they addressed workplace violence, including whether they had comprehensive measures to prevent workplace violence, whether they had effective procedures to handle reported violence, whether they provided sufficient staff training, and whether they conducted drills for staff. The questionnaire did not seek information about individual incidents of violence nor did it seek to define or categorize occupational violence. Because it is essential to differentiate internally orientated and externally orientated violence (Howard & Voss, 1996), the questionnaire also addressed whether the violence experienced was between workers or between customers of the organization and workers. Information on the age and size of the companies and nongovernment organizations was also collected.
The questionnaire was further scrutinized by inviting 15 midlevel managers of various trades (who were previously students of our evening Master of Social Sciences programs) to complete the questionnaire on two occasions, which were 2 weeks apart. We compared the responses to confirm its consistency over time. In addition, a pilot test with a sample size of 80 organizations was conducted in July 2006 to test its appropriateness and the outcome was promising. The respondents involved in the pilot test were not included in the main survey.
Data Analysis
Apart from descriptive statistics, Pearson’s correlation coefficient was used to evaluate the extent to which two variables, for example, coworker physical violence and staff morale, are associated. To examine whether there were differences in the nature, impact, and management of violence between the government and private sectors, item means were computed separately for each of these two sectors. In addition, independent sample t tests were conducted to test whether differences between means by sector were significant statistically. Chi-square tests were also conducted to examine possible associations of violence management variables with violence nature variables. As it is very likely that violence variables were interrelated, hierarchical multiple regressions were used to identify the unique contributions of individual violence variables to outcome variables.
Findings
Physical and Nonphysical Violence
Overall, quite a sizable number of government and private organizations had experienced workplace violence over the 2 years preceding the study, but the frequency was not high (Table 2). Categorization of violence as either physical or nonphysical was undertaken by the researchers after the data were collected. Murder, rape, sexual assault, physical assault, shoving or pushing, and hitting were all classified as physical violence, whereas sexual harassment, verbal or written threats, threatening by shaking fists, being sworn or shouted at, disturbing phone calls, being stalked, throwing of objects or vandalizing property to threaten staff, and other threatening behaviors were classified as nonphysical violence. It was found that in the government, both coworker and customer nonphysical violence (42.2% and 65%) happened more frequently than coworker and customer physical violence (18.1% and 24.8%). A similar trend was observed in the private sector although government departments experienced far more customer physical violence (24.8%) than private organizations (8.5%).
Coworker Violence
Violence among workers, when it occurred, consisted mainly of verbal abuse with fewer respondents reporting any experience of physical violence (Table 2). In the private sector, workers being sworn or shouted at by other workers was most commonly seen (29.3%, M = 1.45), followed by other forms of threatening behaviors (12.5%, M = 1.18) and verbal or written threats (12.2%, M = 1.18). In the government sector, coworker violence was more common than in the private sector. About 41.7% (M = 1.55) of the responding organizations had experienced workers being sworn or shouted at by other workers or encountered other forms of threatening behaviors (27.1%, M = 1.37) and verbal or written threats (25.7%, M = 1.33).
Comparing coworker violence in the two sectors, the government units experienced far more incidents of such violence in general than did the private sector. More specifically, the use of other forms of threatening behaviors (1.37 vs. 1.18, p < .01), verbal or written threats (1.33 vs. 1.18, p < .01), and sexual harassment (1.29 vs. 1.11, p < .001) was significantly higher in the government sector. This was also the case with the throwing of objects or vandalizing property to threaten staff (1.22 vs. 1.11, p < .05) as well as physical assault (1.10 vs. 1.04, p < .05). Comparing different industries, more coworker violence occurred in the construction industry (M = 1.26, n = 43) within the private sector. In the government sector, coworker violence happened more in the Security Bureau (comprising police and other justice agencies; M = 1.32, n = 22), followed by the Health, Welfare and Food Bureau (M = 1.28, n = 33).
Customer Violence
The term client or customer is used here in the same way as it is in the ILO Code of Practice referred to above, namely, relating to “an individual who receives a personalized service, as opposed to the general public,” and includes “patients, passengers, users or audiences” (ILO Sectoral Activities Program, 2003, Clause 1.3.3). In the private sector, the most frequent types of customer violence were verbal violence, such as staff being sworn or shouted at (36.4%, M = 1.56), receiving disturbing phone calls (24.5%, M = 1.37), and verbal or written threats (22.5%, M = 1.32). In the government sector, 62.3% of responding units revealed that their workers had been sworn or shouted at (M = 2.11), faced verbal or written threats (41.1%, M = 1.74), received disturbing phone calls (38.7%, M = 1.69), and experienced other forms of threatening behaviors (37.6%, M = 1.65).
Comparing the two sectors, it is apparent from Table 2 that the government units experienced far more incidents of customer violence than did the private sector. Government workers were more likely to be sworn or shouted at, receive verbal or written threats and disturbing phone calls, experience threatening behaviors, be shoved or pushed, be threatened by clients’ shaking fists, throwing objects or vandalizing, or be physically assaulted, hit, and stalked after work. All the differences are statistically significant at p < .01. Comparing different industries, within the government sector more incidents of customer violence were found in the Security Bureau (M = 1.81, n = 22), the Health, Welfare, and Food Bureau (M = 1.66, n = 33), and the Housing, Planning and Lands Bureau (M = 1.43, n = 16). Within the private sector, the industries most affected by customer violence were the community, social, and personal services (M = 1.24, n = 208) as well as financing, insurance, real estate, and business services (M = 1.23, n = 220).
Impact and Management of Workplace Violence
Out of 1,198 responding organizations, a total of 574 organizations reported that they had experienced workplace violence over the 2 years preceding the study and also were willing to give their views on the impact of the violence (see Table 3). They reported that the violence they had experienced had led to the loss of key employees (30.6%) and customers (30.5%); reduced employees’ job satisfaction (56.2%), work morale (56.7%), and productivity (48.6%); damaged relationships among employees (49.4%); and increased compensation to employees (26.4%), together with administrative costs (45.0%). In the private sector, most companies disclosed that occupational violence had lowered the morale of workers (M = 2.71), reduced their job satisfaction (M = 2.68), and damaged staff relationships (M = 2.61). In the government sector, the respondents thought such violence had reduced workers’ job satisfaction (M = 2.75), increased administrative costs (M = 2.67), and lowered staff morale (M = 2.65).
Impact and Management of WPV in Private and Government Organizations

Note: WPV = workplace violence.
Out of 1,198 responding organizations, a total of 574 organizations reported that they had experienced violence over the 2 years preceding the study and also were willing to give their views on the impact of the violence.
Responses were made on a 4-point scale and coded as 1 = strongly disagree, 2 = disagree, 3 = agree,and 4 = strongly agree. Percentages reported in this table computed from a collapsed frequency counts on the last two categories (i.e., agree and strongly agree).
Respondents were asked to choose between “yes” and “no” for each item. Percentages reported in this column were computed from the frequency counts of the “yes” category.
p < .001.
Statistically, no significant differences were found in these impacts among different industries and government departments nor between the government and private sector, except in two situations, namely, more companies than government units believed that workplace violence had led to the loss of key employees (M = 2.30 vs. 1.65, p < .001) and clients/customers (M = 2.37 vs. 1.47, p < .001). This particular finding may well be explained by the fact that public servants are not as mobile in their career profiles as their counterparts in the private sector. Public servants are therefore less likely to quit their jobs, even if frustrated by the effects of workplace violence. Equally, government units usually provide essential services to the general public, who cannot readily terminate using these services because of a lack of choice. For clients in the private sector, who do have a choice in selecting their own service providers, companies with harmonious customer or client relationships are likely to be favored.
With respect to the management of workplace violence, 71.6% of responding units in the government said that they had effective procedures in place for their workers to follow in handling reported incidents of workplace violence, compared with just 29.6% of respondents in the private sector (p < .001). In addition, 51% of government units had comprehensive policies or measures to prevent workplace violence but just 28.4% in the private sector had such measures (p < .001). The government units also tended to provide more staff training on this topic than the companies (45.2% vs. 23.2%). However, both government units and companies reported that they rarely conducted training drills (13.5% and 9.5%, respectively).
Government units were reported to have taken more prevention efforts than the private sector organizations (see Table 3), but they were also confronted with more workplace violence than their counterparts in the private sector (see Table 2). To check whether prevention efforts had been associated with the occurrence of violence, cross-tabulation tables (with each of 4 management measures of workplace violence as row variables and each of 28 violence acts as column variables) were compiled. Chi-square tests indicated that most of these associations were statistically nonsignificant (p > .05), and their effect sizes (computed by φ) were generally small (<.20). Very similar findings were observed when the same analyses were applied to subsamples of government units and private sector organizations. As such, to safeguard against overinterpretation, we prefer to be conservative and not to conclude whether more violence in government units was due to design failure or implementation failure.
Compared with companies, government units have more resources (money and authority), larger size (more employees), and better organization (more established rules and guidelines for employees). They put more resources into violence prevention, not only necessarily because they experience more workplace violence but also as a gesture to the society that “we are a caring government” to promote its public image.
The services provided by the government units are indispensable and irreplaceable, even angry clients have to visit these units to ask for services. However, for companies, dissatisfied customers can go away. As such, more reported workplace violence in government units is not unexpected and might not necessarily be related to whether they have more prevention efforts or not. However, due to the cross-sectional nature of the data collected in this study, it is impossible to ascertain the causal relationship between the intensity of workplace violence and amount of prevention efforts of government units. Our speculation on plausible linkage between more prevention efforts made by the Hong Kong government but encountering more cases of workplace violence as observed in this study needs further investigation using a longitudinal research design.
Workplace Violence by the Age and Size of Organization in the Private Sector
Large private organizations tended to have more coworker violence (M = 1.33) than medium-sized (M = 1.21) and small organizations (M = 1.11, p < .001). Similarly, large organizations tended to have more customer violence (M = 1.50) than medium-sized (M = 1.22) and small organizations (M = 1.15, p < .001). In relation to the stated impact of occupational violence on organizations, no significant differences were discerned among them according to their size. However, differences were found in their prevention and handling of this violence. More large (51.6%) and medium-sized organizations (42.5%) reported that they had effective procedures in handling reported incidents, compared with only 26.4% of the small organizations (p < .01). Furthermore, the large organizations tended to have more comprehensive workplace violence policies and measures in place than the medium-sized and small ones (46.3% compared with 24.4% and 26.4%, p < .01). They also tended to provide more training for their workers (41.1% compared with 24.4% and 21.7%, p < .01), although very few of the three groups of organizations had provided drills for staff.
In addition, no significant relationships were found between the age of the organizations and the perceived incidence of coworker violence, on the impact of workplace violence, or on management measures taken to deal with this violence. However, older companies (those with more than 10 years of longevity) were found to have experienced more violent incidents than younger companies (p > .05).
Correlations Between the Nature, Impact, and Management of Workplace Violence
In the government sector, very strong and significant correlations were found between coworker physical violence and nonphysical violence (r = .75) as well as customer physical violence and nonphysical violence (r = .84). A similar tendency was observed in the private sector (rs = .70 and .60; Table 4). Moderate but significant correlations (r = .37-.66) were found between the physical violence and nonphysical violence committed by coworkers and customers in both government and private sectors. These findings at large suggest that a subculture of workplace violence appears to emerge over time among respondent organizations such that the more customer violence is experienced, the more coworker violence occurs, and the more the nonphysical violence, the more the physical violence. This trend was consistent in both the government and private sectors.
Correlation Between Coworker/Customer Physical/Nonphysical Violence and Other Variables (Pearson’s r)

Note: WPV = workplace violence.
p < .05 (two-tailed).** p < .01 (two-tailed).
Regarding the impact of workplace violence, there are some interesting differences between government and private sectors. In the private sector, weak but significant correlations were found between coworker violence (both physical and nonphysical) in 15 out of the 16 impact items of workplace violence outlined in Table 4 (i.e., all except staff morale). In the government sector, such significant correlations were found in just three of the impact items (e.g., staff compensation and administration costs). This suggests that coworker violence was not a serious concern in the private sector. On the contrary, more significant correlations were found between customer violence (both physical and nonphysical) and the impacts of violence in the government sector than in the private sector, suggesting that customer violence was more of a concern for government workers.
As regards the management of workplace violence, we found no significant correlation between the variables, except that the more physical violence (both coworker and customer) is experienced in the government units, the more violence drills for staff are conducted (rs = .23 and .47). In the private sector, we found weak but significant correlations between customer physical violence and the procedures for handling violence reports (r = .15), the provision of preventive measures (r = .12), and staff training (r = .13), suggesting that the companies that faced more workplace violence would tend to put more procedures, measures, and training in place.
Hierarchical Multiple Regressions of Impact of Workplace Violence on Coworker and Customer Violence
The preceding analyses show that coworker and customer violence could have an impact on certain outcome variables (such as staff compensation and administrative costs) for both government and private sectors. However, as there are moderate to strong correlations among violence variables, analyzing the data via hierarchical multiple regressions would provide further assessment of unique contributions of individual violence variables to the outcome variables. Moreover, in view of a variation in the age and size of organization in the private sector, these two variables were further controlled in the analyses for that sector.
For the government sector, the first set of hierarchical linear regressions was conducted by entering each of the eight outcome measures as a dependent variable and sequential entry of coworker (in Step 1) and customer violence variables (in Step 2). Similarly, a second set of hierarchical linear regressions was conducted by interchanging the order of entry of coworker and customer violence variables. Models with either loss of clients or damaged staff relationships as dependent variable were not statistically significant at model level (p >.05), which indicated that even both coworker and customer violence variables taken together might not have much impact on these two outcome variables. For other models involving one of the six remaining outcome variables as dependent variable, both coworker and customer violence variables taken together could explain a considerable amount of variance in the model (R2 = .15-.25). Apart from that, based on the regression weights (the standardized betas), the customer violence variables were more powerful predictors than the coworker violence variables.
For the private sector, similar regression models were built. In addition, to make a further control on the variation in age and size of organization under study, these two variables were included in the analyses and were entered before the entry of violence variables as independent variables. However, the results showed that these two variables could explain away only a very minimal amount of variance for the outcome variables (accounting for around 1% of the total variance at each tested model). At model level, though statistical significance (p < .05) was found on all tested models except those involving staff compensation as dependent variable, the explained variances accounted for by entering all violence variables were not very substantial as compared with those for the government sector (the amount of explained variance ranged from 5% to 10% of the total variance). At parameter level, the coworker violence variables were more powerful predictors than the customer violence variables in predicting loss of key staff, loss of clients, damaged staff relationships, and lowering staff productivity, whereas the reverse was found in predicting reduced job satisfaction, lowering staff morale, and increasing administrative costs.
Discussion
The survey results show that workplace violence in Hong Kong was not as prevalent as has been found in western jurisdictions. Of the violence that was experienced by respondents, most seemed to involve verbal abuse or threats rather than physical assault of the type that might result in an official report of an occupational injury accident. This finding is in line with previous studies on this issue over the last two decades (Baron & Neuman, 1996; Chappell & Di Martino, 2006; Hahn et al., 2008; Lord, 1998). The study reveals significant differences in the nature of workplace violence between organizations in the private and public sectors, with the latter experiencing both more worker-on-worker and more customer-on-worker violence. These findings may be reflective of a number of factors, including the nature and complexity of the service or function being performed by public or private sector organizations. According to Baron and Neuman (1996), government agencies, such as those engaged in the delivery of welfare services, are often working under tight budgetary and organizational constraints such as downsizing and increased workforce diversity, with little ability to be flexible in their internal staffing arrangements or their external relations with customers. Working environments such as this are more likely to create the stresses and strains, which lead to verbal and related abuse between staff and between staff and customers. This is in line with Tobin’s (2001) workplace violence continuum: moving “from frustration to conflict to aggression to violence” (p. 101). Equally private sector organizations may be able to adapt more readily to customer needs and demands, ameliorating the risks of both types of workplace violence occurring.
In Hong Kong, the turn of the century saw an introduction of civil service reform by the government in response to fiscal deficit after the Asian financial crisis. The purpose was to reduce the size of civil service by various means; such as implementing a general recruitment freeze, introducing contract employment and early retirement schemes, and outsourcing selected government services to the private sector, with a target to reduce about 15% of the total civil service establishment (Brewer, 2003; Legislative Council Panel on Public Service, 2004). Such measures have made the civil service “less permanent and secure” (Cheung, 2002, p. 175) and created anxieties on job security among government employees. In addition to the downsizing of civil service, the government’s attempt to enhance its efficiency through “re-engineering, re-organization and re-prioritization of service delivery” ( Legislative Council Panel on Public Service, 2004, p. 2) produced tremendous stress on its employees. Furthermore, tensions emerged when new employees were hired on contract with terms and conditions inferior to those of permanent staff, but both groups had to complete the same tasks with the same responsibilities. The differentiated treatment between the two groups created staff conflicts (Brewer, 2003).
There are further reasons why more workplace violence may have been found to occur in Hong Kong’s public rather than private sector. Many of the risk factors, such as working with people in distress, working alone, working in contact with the public, and working at night tend to be associated with public sector employment. As noted above, within the government sector, the most customer violence was reported in the Security Bureau, the Health, Welfare and Food Bureau, and the Housing Planning and Lands Bureau—all agencies having to deal with distressed and often angry persons seeking assistance or involved in disputes of various kinds, all of which could lead to customer violence if not properly managed or controlled. The general patterns of violence revealed by this study are not so dissimilar from those reported elsewhere, at least in regard to the lower frequency of physical violence in contrast with verbal abuse or threats and to the association of violence with the risk factors mentioned (Chappell & Di Martino, 2006; Health and Safety Executive, 2008; Scalora et al., 2003).
One finding that stands out in this study is the reported lack of preparedness of many organizations to deal with workplace violence should it occur. This finding is not unique—similar situations have been found to exist, for example, in the United Kingdom and in the United States (Health and Safety Executive, 2006; U.S. Bureau of Labor Statistics, 2005). The study findings do indicate that public sector agencies are far more likely than those in the private sector to have adopted workplace violence policies and procedures, and the small and medium-sized private sector companies are least likely to possess appropriate measures to prevent and respond to workplace violence. The impact of such violence is said to have included significant losses of employee morale, in some cases associated with staff resignations as well as financial and allied consequences.
Social commentators have drawn attention in recent times to a new emphasis on customer service among government and private sector bodies alike, which may account in part for the increasing demands made by clients on staff. In the past, many Hong Kong businesses and government agencies were criticized for their failure to provide a high quality of service to customers. As a result, around 2000, the government instituted a concerted advertising campaign to change such attitudes. The Association for Customer Service Excellence was formed in 2000 to promote a new culture of quality service. A famous actor–singer participated in the campaign, making a TV commercial in which his message that “such [bad] servicing attitude is not acceptable today” rapidly became an accepted and popular slogan among the citizens of Hong Kong. However, despite the success of the campaign, the new culture has brought with it “tremendous pressure and psychological pain to workers in the service and retail industry” (Sing Tao Daily, 2008, p. A19). A sociologist, K.M. Chan, described this as the commercialization of human feelings, commenting that workers in contemporary Hong Kong society have changed from the sale of labor to the sale of affection, which requires them to keep their emotions completely under control and even keep their smile in place when being insulted (Ming Pao Daily News, 2006, p. A06). Our postsurvey meetings with personnel from hospitals, welfare agencies, schools, security, and bus companies confirmed that clients, patients and their families had become very demanding in recent years, that many of the demands were completely unreasonable, and were associated with bullying and verbal violence.
There were a couple of limitations in this study. The study used key informants within organizations to provide the relevant data. Although this is a speedy way to collect territory-wide information, one drawback could be their bias in presenting their organizations in a negative light. To resolve this, the study did not require respondents to name themselves and their companies. Another limitation is that one representative can hardly be aware of and report accurately about all the acts of violence in the organization; however, this negative effect might be reduced because 85.8% of the responding companies were small and had less than 50 staff. One major limitation is the impossibility of ascertaining the causal relationship between the amount of prevention efforts of government units and the intensity of workplace violence because of the cross-sectional design of this study. Other limitations include the challenge in retrospective reconstruction of events by the respondents as well as the variation in respondents’ ability to report the breadth of incidents within various organizations. Readers should take note of these limitations while reading the findings. In addition, to meet the purposes of this study and to suit the local context of Hong Kong, a self-constructed questionnaire rather than some Western-invented measures, such as the Revised Conflict Tactics Scales (Straus, Hamby, Boney-McCoy, & Sugarman, 1996), was used for data collection. Such a localized approach might hinder a direct comparison of findings across studies and culture.
Conclusions
Similarities in the problem and management of workplace violence are observed between Hong Kong and the western world. For instance, in both places, there is more customer violence than coworker violence, more verbal violence than physical violence, and more violence in government organizations than private enterprises. Violence happens more frequently in the health, social care, and educational sectors as well as the security industry. Many organizations do not have comprehensive measures or effective procedures for managing and preventing violence in the workplace, especially the smaller private organizations.
One major difference between Hong Kong and the Western world is the weak and fragmented trade union movement in Hong Kong (Fosh, 1997), which makes it less likely for employers to respond rapidly and positively to deal with workplace violence. Elsewhere, the union movement has been at the forefront of much of the extensive and still ongoing activity to publicize and respond to the threats to workers’ health and safety posed by occupational violence. Unison (2008), the union for U.K. public service workers, has campaigned for better protection of workers from aggressive and violent clients under the slogan: “It’s Not Part of the Job.” The campaign has stressed that employers are not only required by law to develop policies to prevent violence but also that there is a cost involved in failing to do so. The costs of violence can include increased absenteeism because workers are hurt, stressed, or afraid; the loss of investment in training and experience when workers leave their job; and bad publicity, low morale, and even long-term psychological and health effects (Flannery, 1996; Hahn et al., 2008).
Another difference is the methods used to gather data. The British Crime Survey, for instance, is an excellent example of best practice in regard to the systematic collection over a number of years of information about workplace violence. The level of detail and analysis it presents to policy makers concerned with the management and prevention of workplace violence is obviously much greater than is possible with a single survey of the type conducted in Hong Kong. Thus, great caution needs to be exercised when making any international comparisons between the Western findings and those obtained in a Chinese society.
There are numbers of Western sources of best practice models for tackling workplace violence in a variety of settings (see, for example, Canadian Center for Occupational Health and Safety, 2007; Kaufer & Mattman, 2001; Schneid, 1998; WorkSafeBC, 2000), although it is always important to remember that no workplace is the same and that an effective strategy for the prevention of workplace violence must be based on a risk assessment process linked to a specific workplace (Rogers & Chappell, 2003). Within Hong Kong, there is still much that could be done to enhance the level of understanding of the dimensions of workplace violence and the measures that can be taken to prevent and respond to such violence. Although large organizations, such as the Hospital Authority, have bylaws to tackle violence committed by customers who could be prosecuted in court, the postsurvey meetings with the personnel from various industries found that these bylaws were rarely enforced. As the power of enforcement is vested in management rather than any formal regulatory bodies, the management prompts to use compliance approach (e.g., using mediation to resolve conflicts), rather than enforcement by strict command and control. Moreover, the management is restrained from enforcing bylaws due to the rise of consumerism and hence tends to place customers’ interest before the employees’ rights. The widespread adoption of new public management further fosters the consumer-first culture. Because customer satisfaction is one of the important indicators in evaluating employees’ performance, employees tend to have a higher tolerance on verbal violence and rarely report such incidents to the management.
Furthermore, the survey findings show that the greatest need for proactive interventions on the formulation of antiviolence policy and practice arises in small and medium-sized industries, where resources are scarce and no bylaws exist to protect them. In this respect, the Occupational Safety and Health Council commissioned the research team to develop a workplace violence coping program, which had been tried out in 20 large, medium, and small organizations representative of different sectors. A manual was developed to assist the parties concerned to understand the definition, risk factors, categories, and consequences of workplace violence. Because a risk situation could escalate into a violent incident if it is not handled in the appropriate manner, the manual also describes different stages of violence escalation and related tackling methods and 16 techniques of deescalation are introduced to help employees minimize the harm to be brought about by workplace violence. A risk management model is outlined, including the responsibilities of employers and employees, overall preventive strategies, and how to remedy and repair the harm incurred to the organization and its employees after the occurrence of a violent incident. These include an investigation of the incident, redeployment of staff, providing support to victims and other staff concerned, and inspection of security measures. The manual, available in both Chinese and English languages, was designed as a do-it-yourself kit for small and medium enterprises (Occupational Safety and Health Council, 2010).
For social science researchers, an immediate challenge must be to expand the scope and reach of the survey conducted for this study to incorporate data regarding individual experiences of workplace violence, both physical and psychological, across a wide range of industries in Chinese societies, as such violence may result in psychological distress or even trauma.
Footnotes
Declaration of Conflicting Interests
The author(s) declared no potential conflicts of interest with respect to the research, authorship, and/or publication of this article.
Funding
The study was funded by the Occupational Safety and Health Council of Hong Kong.