




Abstract
The current research produces regression models with sample sizes from 127 to 131 by initially employing a data set of 170 nations. The current study finds that ethnic heterogeneity and linguistic heterogeneity lead to higher homicide rates. However, religious heterogeneity has no impact on homicide rates. The present article also tests an interaction effect between population heterogeneity and income inequality. Unlike J. R. Blau and Blau (1982) and Avision and Loring (1986) proposition, the interaction term is not related to national homicide rates. The current study also discusses the theoretical implications of those findings.
Keywords
Previous cross-national researchers have focused on income inequality, which indicates vertical social differentiation as an explanation of variation in homicide rates. However, many prior cross-national studies failed to pay attention to population heterogeneity as a measure of horizontal social differentiation (Avison & Loring, 1986). Originally, the studies on the size of American Blacks and its relationship with the homicide rate provided insights for cross-national studies on population heterogeneity and violence. Some of those U.S.-specific explorations reported that a large Black population was associated with an elevated level of violence (J. R. Blau & Blau, 1982; Maume & Lee, 2003; Messner, 1983; Sampson, 1985, 1986).
Inspired by the research on Blacks in the United States, Hansmann and Quigley (1982) called for a cross-national research designed to investigate the influence of population heterogeneity on homicide rates. Cross-national data are appropriate to examine the impact of population heterogeneity because the variation of population heterogeneity among nations may be greater than that in areas within a nation. Some of the previous cross-national studies tested the link between population heterogeneity and the homicide rate. However, those studies are subject to some limitations. First, there have been inconsistent findings. Some of these previous studies found a significant and positive relationship between ethnic diversity and the homicide rate in a nation (Altheimer, 2007, 2008; Avison & Loring, 1986; Braithwaite & Braithwaite, 1980; Gartner, 1990; Hoskin, 2001). However, others failed to find such a relationship (Hansmann & Quigley, 1982; Krahn, Hartnagel, & Gartrell, 1986; Messner, 1989). Thus, no consistent findings on the effect of population heterogeneity on homicide exist.
Second, a majority of previous studies have used limited theoretical perspectives. They have been based either on Sellin’s (1938) cultural conflict theory (Hansmann & Quigley, 1982) or Shaw and McKay’s (1942) social disorganization theory (Miethe, Hughes, & McDowall, 1991). Grounded on J. R. Blau and Blau’s (1982) U.S.-specific research, Avison and Loring (1986) presented another thesis that economic discrimination against ethnic minorities increased homicide rates in a nation. Avison and Loring’s arguments imply the possibility of an interaction between population heterogeneity and income inequality. Thus, the interaction effect between population fragmentation and income inequality warrants further analyses. Third, many previous studies did not include all three measures of population diversity such as ethnic, linguistic, and religious heterogeneities. The limitations within prior research call for further investigations by using all three dimensions of population heterogeneity.
The current study makes the following efforts to overcome the limitations of previous studies. First, the current analysis uses a much larger international data set of 170 nations than most previous studies did. The use of a large initial sample size of 170 makes it possible to run regression models with sample sizes from 127 to 131. The use of large international data allows the inclusion of many developing countries, which previous studies had ignored. Second, the current research takes advantage of sophisticated population heterogeneity indices developed by Alesina, Devleeschauwer, Easterly, Kurlat, and Wacziarg (2003). The use of Alesina et al. heterogeneity grants the introduction of linguistic and religious heterogeneity for regression analyses as well as ethnic heterogeneity. Finally, the current research tests an interaction effect between population heterogeneity and income inequality.
For further discussion, one needs to clarify the use of terms. The current study uses such terminologies as population heterogeneity, population diversity, and population fragmentation interchangeably. These all refer to the number of divergent ethnic, linguistic, and religious groups in a nation.
Literature Review
This section discusses prior research on the relationship between population heterogeneity and homicide rates. The first part introduces empirical research findings, and the second section discusses theoretical backgrounds. The last one reviews measurement issues of population heterogeneity.
Empirical Research Findings
U.S.-specific studies
Originally, the research regarding the association between population heterogeneity and violence, including homicide, had been based on Black population size and its relationship to violence in the United States. For example, J. R. Blau and Blau (1982) reported that a proportion of the Black population in a city was positively related to violent crime rates, including murder. However, Black population size alone did not influence a degree of violence. J. R. Blau and Blau suggested that the percentage of the Black population in interaction with income inequality was positively related to the homicide rate in a city. However, Braithwaite (1979) found no association between racial inequality and homicide rates. Others also supported Braithwaite’s research (Messner & Golden, 1985). Thus, there was a lack of consistent findings on connections among population heterogeneity, income inequality, and homicide rates. Another weakness of U.S.-specific research is that most prior studies have targeted only Blacks while ignoring other ethnic minorities. There was a positive and a significant effect of income inequality on homicide rates when one took into account multiple ethnic groups in Standard Metropolitan Statistical Areas (SMSAs) in the United States (Balkwell, 1990).
Cross-national studies
Some other studies extended population heterogeneity issues to a cross-national approach. Some of those studies reported a significant and a positive relationship between ethnic diversity and the homicide rate in a nation (Altheimer, 2007, 2008; Avison & Loring, 1986; Cole & Gramajo, 2009; Gartner, 1990; Hoskin, 2001). For example, Hoskin (2001) suggested that a significant and a positive nexus existed between ethnic heterogeneity and homicide rates in his analyses of homicide rates for 36 nations. Stamatel (2009) also put forth the same conclusion. Between 1990 and 2003, she investigated a pooled time-series analysis of homicide rates for East-Central European countries. Stamatel suggested that ethnic heterogeneity was positively associated with homicide rates in those countries. However, others failed to find a significant relationship between ethnic diversity and homicide rates when they controlled competing variables (Hansmann & Quigley, 1982; Krahn et al., 1986; Messner, 1989).
A few studies used linguistic and religious diversity as well as ethnic heterogeneity (Cole & Gramajo, 2009; Hansmann & Quigley, 1982; Neapolitan, 1997). However, Cole and Gramajo (2009) found no significant relationship between national religious diversity and homicide rates even if they detected a significant and an inverse association between ethnic diversity and homicide rates.
Theoretical Background
Prior cross-national examination of population diversity and its effect on homicide rates have used three major theoretical frames. They include Sellin’s (1938) cultural conflict theory, Shaw and McKay’s (1942) social disorganization theory, and J. R. Blau and Blau’s (1982) ethnic economic inequality theory. First, Sellin suggested that there are conflicts of norms among different cultural groups in a society, which in turn lead to violence. The cultural conflict theory assumes that an individual is hostile to other ethnic groups because different ethnic groups compete for limited resources such as money, education, and employment (Hansmann & Quigley, 1982). In other words, Sellin saw that an individual acts to maintain or maximize the interest of his or her cultural group. Thus, a likelihood of cultural conflict increases when a society becomes more heterogeneous. In addition to that, population diversity may lead to political conflicts among various ethnic groups to gain hegemony of a nation, including a public policy benefit such as welfare (Alesina et al., 2003; Carment, James, & Taydas, 2009; Cole & Gramajo, 2009; Unnever & Cullen, 2010).
Second, Shaw and McKay (1942) posited that population heterogeneity is conducive to social disorganization. In explanation, a constant exposure to other ethnic cultures may weaken one’s ability to reinforce his or her cultural values to the members of his or her own ethnic group (Hansmann & Quigley, 1982). At the same time, ethnic diversity limits the communication capability among different ethnic groups (Gartner, 1990; Graif & Sampson, 2009). The weakened social bonds and shared values among the members of an ethnic group in turn impede an effective social control. Social researchers associated the weakened social control with a high level of crime and violence (Avison & Loring, 1986; P. M. Blau, 1977; Hansmann & Quigley, 1982).
Third, there has been good empirical support for the thesis that income inequality is conducive to higher homicide rates (Braithwaite & Braithwaite, 1980; Messner, 1982, 1989; Neapolitan, 1994; Wilkinson & Pickett, 2005). Income inequality and ethnic heterogeneity are two different phenomena. However, J. R. Blau and Blau (1982) saw race as “inborn inequality” (p. 118) or “ascriptive socioeconomic inequality” (p. 119). They stated, “Racial socioeconomic inequalities are a major source of much criminal violence” (p. 126). J. R. Blau and Blau pointed out that an intensified economic inequality among minority ethnic groups brought social conflicts. The explanatory power of racial inequality for the homicide rate was stronger than that of general economic inequality. Following J. R. Blau and Blau’s research, Avison and Loring (1986) regarded income inequality as a “vertical social differentiation” and population heterogeneity as a “horizontal social differentiation” (p. 733). Avison and Loring suggested an interaction effect between income inequality and ethnic heterogeneity. They argued that ethnic heterogeneity intensifies income inequality among dissimilar ethnic groups.
There have been some efforts to explain how ethnic income inequality affects homicide rates. Ethnic minority groups are likely to experience hopelessness and frustration because of their economic disadvantages. The frustration resulting from relative deprivation leads to aggression (J. R. Blau & Blau, 1982; Carment et al., 2009). However, minority members do not possess the power to overthrow the majority. Instead, they display “diffused violence” (J. R. Blau & Blau, 1982, p. 119). Therefore, members of minority groups frequently aim their aggression at an easily available target, which is commonly members of their own ethnic group (Balkwell, 1990). Xie and McDowall (2010) indicated that racial and economic inequality force American Blacks to live in crime-prone areas. Thus, Blacks become a common target of violent crimes perpetrated by other Blacks who are also living in poor conditions.
Culture conflict theory, social disorganization, and ethnic income inequality theory may not be mutually exclusive. Instead, they may be closely related to one another. The existence of culture conflict may lead to weakened cultural integration or social disorganization. Also, economic ethnic inequality may cause culture conflicts and social disorganization (J. R. Blau & Blau, 1982). In other words, those three theories may share common elements.
Measurement Issues of Population Heterogeneity
An inspection of existing literature demonstrates that researchers used varying operational definitions of ethnic heterogeneity. A Soviet scholar, Narodov Mira, developed the ethno-linguistic fractionalization (ELF) index in 1964, and it was updated in the 1980s. The equation for the heterogeneity index is
Others used a simple measure of ethnic fragmentation. For example, a group of researchers used the percentage of Blacks (Balkwell, 1990; J. R. Blau & Blau, 1982; McCall & Parker, 2005; Messner & South, 1992; Miethe et al., 1991) and the percentage of Protestants (Messner, 1982) in the United States. However, in his cross-national study, McDonald (1976) created a dummy variable where a nation with high ethnic heterogeneity has a value of “1” and all other nations have “0.”
To overcome the weakness of previous research, Alesina et al. (2003) developed more sophisticated and updated measures of the population heterogeneity index for a large number of countries. They provided religious heterogeneity as well as ethnic and linguistic heterogeneity for between 190 and 205 nations. The next section includes the discussion on detailed information on Alesina et al. population heterogeneity indices.
Current Study
The previous examinations were subject to certain limitations. First, the sample sizes were relatively small. Among all prior studies, Cole and Gramajo (2009) used the largest sample size. They initially collected information about 187 nations from the World Health Organization (WHO). However, they could run regression analyses for only 91 countries because some data were missing. Altheimer (2007) employed the next largest cross-national data of 53 nations for his study. A majority of all other research had smaller sample sizes than Altheimer’s (2007). Second, many of the existing cross-national studies were conducted during the 1980s or earlier, with the exception of Altheimer’s (2007, 2008) and Cole and Gramajo’s.
The current investigation possesses some strength over existing research. First, the present study initially selects 170 nations from the WHO and conducts regression analyses from 127 to 131 nations by creating different regression models. By employing Alesina et al. (2003) indices, it is possible to analyze such a large sample because they provide population heterogeneity data for 190 to 215 countries. “Thus, our data allows for a much more serious grounding of empirical work in theoretical models” (Alesina et al., 2003, p. 164). The formula for Alesina et al. heterogeneity indices will be discussed later. Second, this article updates the homicide information source by using the data surveyed in 2002. Third, the present analysis employs sophisticated measures of population diversity developed by Alesina et al. The current regression models investigate the effects of linguistic and religious diversity as well as ethnic heterogeneity, as each may relate to homicide rates. Prior research has failed to find a uniform effect of different dimensions of population diversity such as ethnic, linguistic, and religious dissimilarities. For instance, Hansmann and Quigley (1982) have suggested the possibility that ethnic heterogeneity may be related to the homicide rate from a different direction than linguistic heterogeneity and religious heterogeneity are. Thus, researchers need to separately test the impact of each type of heterogeneity. Finally, the present regression analysis tests for interaction effects between population heterogeneity and economic inequality as Avison and Loring (1986) have proposed.
Data and Method
Study Group and Dependent Variable
The present analyses initially select 170 nations from the WHO’s database (2004). The WHO calculates annual homicide rates per 100,000 individuals (WHO, 2004). The WHO defines homicide as death by injury purposely inflicted by others (excluding in wars). Among all types of international crime statistics, homicide data are the most reliable and valid (LaFree & Drass, 2002). The WHO data are based on death certificates. For a jurisdiction to issue a death certificate, many countries require that physicians or medical attendants examine a decedent. Authorities must also obtain witness statements regarding the cause of death (The United Nations, 2003-2005). An alternative data source on international homicide rate is International Criminal Police Organization’s [Interpol] International Criminal Statistics (1995). However, the current study does not use the Interpol data because they have some issues. Interpol data are mostly grounded on citizens’ calls to the police, not on an actual count of dead bodies. Another problem with Interpol’s homicide statistics is that some Interpol member countries report “attempts” as well “completed” murders while disregarding what portion of attempted murders comprise the total count of murders. Those nations that included “attempts” display exaggerated murder rates (Huang & Wellford, 1989; Neapolitan, 1997). In this aspect, homicide data from the WHO may be more valid than Interpol’s data (Lee & Bankston, 1999; Neapolitan, 1994).
Some cross-national investigations have employed an average homicide rate through the use of multiple-year data to address a possible spike in homicide rates (e.g., Archer & Gartner, 1984; Avison & Loring, 1986; Braithwaite & Braithwaite, 1980; Chon, 2002; Krahn et al., 1986: Lee & Bankston, 1999; McDonald, 1976; Messner, 1989; Neapolitan, 1994). However, irregular reports by some member countries make it hard to calculate an average homicide rate. If one includes only those nations that report its homicide statistics regularly, he or she has to sacrifice a sample size. Thus, the present analysis uses a single-year data to maximize sample size. The present study employs the data from 2002 because the largest sample was available in that year. The WHO accumulated the data in 2002 and published the statistics in 2004. As discussed above, some member nations are guilty of irregular reporting because participating in WHO data reporting is voluntary. Therefore, data consistency presents an issue in cross-national research (Chon, 2002). Thus, the WHO had to collect the most recent available data when the statistics for a designated year were not listed.
Independent Variables
The statistics on ethnic, linguistic, and religious heterogeneity come from the indices Alesina et al. (2003) developed. Alesina et al. developed the following formula to estimate ethnic, linguistic, and religious heterogeneity:
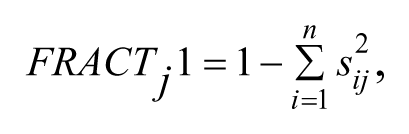
where s ij is the share of group i (i = 1 . . . N) in country j.
The formula offers the probability that two randomly selected individuals in a nation belong to two different groups (Alesina et al., 2003). Theoretically, it ranges from 0 to 1. A zero probability suggests a zero chance that two individuals are affiliated with two different groups. In other words, they always belong to the same group. However, a value of one indicates that two individuals will always belong to two different groups. In practice, the population fragmentation value falls somewhere between zero and one.
The indices for linguistic and religious heterogeneity developed by Alesina et al. (2003) primarily came from Encyclopedia Britannica (2001). However, Alesina et al. used additional sources, such as Central Intelligence Agency’s World Factbook and the Ethnologue Project, when the information was not available from Encyclopedia Britannica. Most of those data sources were based on national censuses (Alesina et al., 2003). However, for ethnic heterogeneity, Alesina et al. made painstaking efforts to accumulate data. They employed various information sources such as Encyclopedia Britannica (2001), World Directory of Minority (Minority Rights Group International, 1997), Ethnic Groups World Wide (Levinson, 1998), World Factbook (Central Intelligence Agency, 2000), and national census data.
The data on ethnicity are based on a multiple-year frame. The data for many nations are approximately for the year 2001. However, for some countries, the data come from earlier years. The change in ethnic composition may occur as the result of adjustments to the size of ethnic groups and the classifications of ethnicity. However, Alesina et al. (2003) tested the issue, and they concluded that ethnic and linguistic affiliation is not likely to rapidly change over 20 to 30 years (Alesina et al., 2003).
A concern for regression model specification is that ethnic, linguistic, and religious heterogeneity may be significantly correlated to one another (Hansmann & Quigley, 1982). Especially, ethnic and linguistic heterogeneity indices may be highly correlated with each other because anthropologists consider language to divide ethnic groups, such as tribes in African nations (Alesina et al., 2003). Thus, researchers cannot include those three measures in the same regression model. In other words, one needs to run a separate regression model for each of the three different heterogeneity measures.
Relying on Avison and Loring’s (1986) ethnic inequality thesis, the present examination introduces another independent variable, the Gini-coefficient of income inequality (GINI). The GINI is a well-known measure for income inequality (Messner, Raffalovich, & Shrock, 2002). The GINI represents a nation’s level of relative deprivation. It ranges from 0% (perfectly equal distribution of income across a population) to 100% (perfectly unequal distribution of income). The data on the GINI come from the United Nations Development Program (UNDP)’s website (2001-2004). Finally, as discussed earlier, Avison and Loring (1986) suggested an interaction effect between population heterogeneity and an income inequality measure. Thus, the current examination includes interaction terms. However, to address a possible collinearity issue between an original variable and its interaction term, the present study follows Aiken and West’s (1991) recommendation. To create an interaction term, I centered both population heterogeneity measures and GINI by subtracting a mean from each of those variables. And then, centered GINI is multiplied by centered population heterogeneity measures (see also Jaccard & Turrisi, 2003).
Control Variables
The control variables included in this study are economic and demographic variables such as gross domestic product (GDP) per capita, urbanization (URBAN), the percentage of the age group between 20 and 34 among a total population (AGE 20-34), and the percentage of females among a total national population (Female%). Two variables require further explanation. GDP per capita is recalculated into U.S. dollars by considering purchasing power (Butchart & Engstrom, 2002). However, urbanization is the percentage of people who live in cities as opposed to rural areas.
Control variables in this research come from databases on the World Health Organization, World Bank, and UNDP websites (United Nations, 2003-2005; World Health Organization, 2003; World Bank, 2003). However, international statistics have limitations. Some international member nations do not regularly report their statistics. Thus, researchers need to use a multiple-year frame, instead of that of a single year. Most data on independent variables come from between 1998 and 2002. The current study uses the most recent data from within this time frame, when a nation’s statistics are available for 2 or more years.
Results
Descriptive Statistics
Inspection of Alesina et al. (2003) population heterogeneity indices showed a high level of international variation in population heterogeneity. The most ethnically and linguistically heterogeneous country is Uganda (0.93) and many other sub-Saharan African nations. The most homogeneous nations include South Korea (0.01), Japan (0.01), and North Korea (0.03). In terms of religious diversity, South Africa (0.86), the United States (0.82), and Australia (0.82) are the most heterogeneous, whereas Yemen (0.01), Somalia (0.01), Morocco (0.01), Turkey (0.01), and Algeria (0.01) are the least diverse.
The descriptive statistics in Table 1 show the availability of each variable. The GINI is the least available. Only 132 out of a total of 170 nations display GINI data. Some other variables are also not fully available: ethnic (164), linguistic (159), religious (167), and GDP (168). The current study excludes missing data by using a listwise deletion technique for regression analysis. The listwise deletion technique removes observations that have missing data on any variable in a regression model. Even if statisticians have developed a few other techniques to handle missing data, they are clearly not superior to the listwise deletion technique (Allison, 2001). However, the listwise deletion technique requires the reduction of sample size. Thus, the number of nations included in different regression models slightly varies. The number of sample nations ranges from 127 to 131 in different regression models.
Descriptive Statistics

Note: GDP = gross domestic product; GINI = Gini-coefficient of income inequality; URBAN = urbanization; AGE 20-34 = percentage of the age group between 20 and 34 among a total population; Female% = the percentage of females among a total national population.
Next, one of the reasons for data transformation is to address nonnormality. Natural log transformation of the homicide rates relieves the violation of normality assumption. This result is consistent with prior studies that also have employed transformed homicide rates (Gartner, 1990; Messner, 1989).
Bivariate Analyses
The bivariate analysis in Table 2 indicates that the homicide rate is significantly and positively related to both ethnic heterogeneity (r = .47) and linguistic heterogeneity (r = .38). On the other hand, the homicide rate has no significant association with religious heterogeneity. Additionally, the homicide rate displays a significant and a negalink to economic development (GDP), whereas it has a strong and a positive relationship with GINI and URBAN. Finally, ethnic heterogeneity is strongly associated with linguistic heterogeneity (r = .68) as expected.
Zero-Order Correlation Matrix
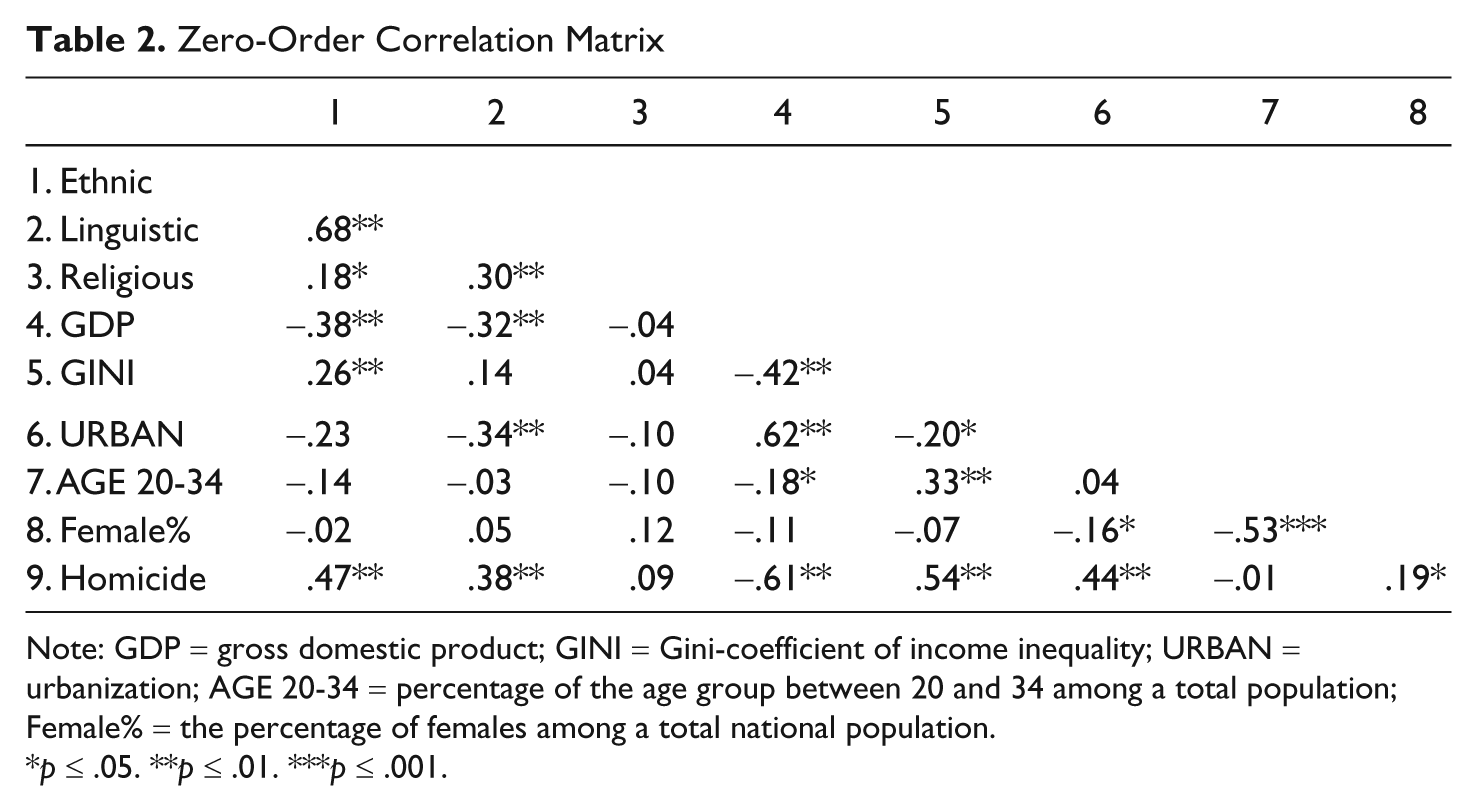
Note: GDP = gross domestic product; GINI = Gini-coefficient of income inequality; URBAN = urbanization; AGE 20-34 = percentage of the age group between 20 and 34 among a total population; Female% = the percentage of females among a total national population.
p ≤ .05. **p ≤ .01. ***p ≤ .001.
Multivariate Analyses
Table 3 shows the results of multiple regression analyses. Ethnic, linguistic, and religious heterogeneity measures are entered one at a time for each of those five regression models. First of all, Table 3 indicates that multicollinearity is not a serious problem for all five regression models. The values of Variation Inflation Factor (VIF) for all variables in the five regression models are 2.5 or lower. The VIF values are much smaller than the value of 10, which is considered as a usual threshold for a worrisome multicollinearity problem (Fox, 1991). Second, the values of the adjusted R2 are somewhat consistent for all five models. The introduced variables explain from 53% to 57% of variation in homicide rates in this sample.
Regression Analyses for Homicide Rates (Log Transformed)

Note: B = stadardized regression coefficient; VIF = variation inflation factor; GINI = Gini-coefficient of income inequality; GDP = gross domestic product; URBAN = urbanization; AGE 20-34 = percentage of the age group between 20 and 34 among a total population; Female% = the percentage of females among a total national population.
p ≤ .05. **p ≤ .01. *** p ≤ .001.
The first three models exhibit the relationship between population heterogeneity and the homicide rate. Ethnic heterogeneity behaves strongly in Model 1. Ethnic heterogeneity increases the homicide rate as anticipated. Linguistic heterogeneity also presents a significant and a positive association with the homicide rate in Model 2. However, religious heterogeneity has no nexus to the homicide rate in Model 3.
The GINI has a significant and a positive impact on a national homicide rate for the first three models. Based on Avison and Loring’s (1986) proposition, the Regression Model 4 employs a variable that indicates an interaction between ethnic heterogeneity and income inequality. By the same token, the Regression Model 5 tests an interaction effect between linguistic heterogeneity and income inequality. Ethnic heterogeneity in Model 4 and linguistic heterogeneity in Model 5 are still very strong predictors for the homicide rate. GINI also performs very strongly both in Model 4 and Model 5. However, both interaction terms of Ethnic-GINI and Linguistic-GINI are not significantly related to homicide rates.
One of the control variables has a significant impact on homicide rates. GDP per capita has a significant and a negative impact on homicide rates. However, other control variables such as urbanization, age structure, and sex distribution behave weakly. The only exception is the percentage of females for Regression Model 3. The next section will discuss these results.
Discussion and Conclusion
There are several noticeable results of the current study. First, one of the purposes of the current research is to test the impact of three different dimensions of population heterogeneity on national homicide rates, while controlling competing variables. The outcomes of the present regression analyses suggest that both ethnic and linguistic heterogeneity produce a high rate of homicide in a nation. These findings are consistent both with Sellin’s (1938) cultural conflict theory and Shaw and McKay’s (1942) social disorganization theory. Sellin argued that an individual has a tendency to behave for the interest of his or her cultural group. Thus, ethnic competition for limited resources is high in a heterogeneous society. In addition to that, population diversity may bring a political strife among various ethnic groups for their public policy benefits (Alesina et al., 2003; Carment et al., 2009; Cole & Gramajo, 2009; Unnever & Cullen, 2010). On the other hand, Shaw and McKay theorized that ethnic diversity in a certain community is one of the contributing factors of social disorganization in a community. One loses a capability to reinforce his or her cultural values and norms to other members of his or her own ethnic groups when an ethnic group is continuously exposed to other ethnic cultures (Hansmann & Quigley, 1982). The weakened social bonds and shared values among members of an ethnic group in turn impede an effective social control. An individual is free to commit a crime without effective social control by others (Avison & Loring, 1986; P. M. Blau, 1977; Gartner, 1990; Hansmann & Quigley, 1982; Stamatel, 2009).
Second, the GINI has a significant and a positive impact on national homicide rates. The result confirms Messner et al.’s (2002) study that income inequality is one of the more robust predictors of homicide rates in cross-national research. The finding also lends support to Marxist criminological theory that frustration resulting from economic inequality is conducive to a high level of homicide (Avison & Loring, 1986; J. R. Blau & Blau, 1982; Braithwaite & Braithwaite, 1980; Krahn et al., 1986; Messner, 1982, 1986, 1989; Neapolitan, 1994). For example, Krahn et al. (1986) wrote,
It could be argued, as an extension to this frustration-aggression interpretation of collective violence, that the resentment and sense of injustice felt by the relatively deprived could spill over into interpersonal violence displaced onto those who are in close proximity. (p. 270)
Third, another goal of the present examination is to check the interaction effect between economic inequality and population heterogeneity. The current regression analyses find that the interaction term between population heterogeneity (both ethnic and linguistic) and income inequality is weak. This finding suggests that population heterogeneity and income inequality independently affect national homicide rates, rather than interaction. In other words, this finding confirms that income inequality and ethnic heterogeneity are two different phenomena. At the same time, the result weakens J. R. Blau and Blau’s (1982) and Avison and Loring’s (1986) arguments that in interaction with horizontal social differentiation indicated by ethnic heterogeneity, vertical social differentiation measured by income inequality displays a significant and a positive effect on the homicide rate.
Fourth, unlike ethnic and linguistic heterogeneity, religious heterogeneity has no relationship with homicide rate. However, this is not a very surprising result. The probability of conflicts among different religious groups may be low when a democratic society guarantees free exercise of religion for all denominations, like in many Western countries. Instead, religious conflicts are likely to occur when two dominating religions in a country, such as Christianity and Islam, compete for dominance. However, the study does not test the competition between two dominating religious groups in a country. Future studies need to delve into this issue.
The findings on control variables deserve a brief discussion here. First of all, GDP per capita, the proxy for economic development and modernization, has a significant and a negative impact on homicide rate. The result is consistent with many previous cross-national studies (Avison & Loring, 1986; Braithwaite & Braithwaite, 1980; Hansmann & Quigley, 1982; Neapolitan, 1994). Based on his longitudinal study on violence from the Middle Ages to the 17th century, Elias (1978) implied that less civilized people were much more violent than civilized ones. He found that violence rates in Europe shrank gradually over time during that period. Relying on such a finding, Elias presented the theory of civilization process. He cited two important elements of the civilization process, which were external control and self-control. Up to the Medieval Ages, an individual had an exaggerated sense of honor or one’s reputation among males (see also Eisner, 2003). The use of violence was generally accepted as a means of restoring honor during the Middle Ages. In other words, society tolerated the violence to a certain degree. Retributive violence or personal revenge was a legitimate tool for seeking justice or “self-help.” However, a civilized society was not likely to tolerate the use of violence against others (see also Eisner, 2003; Hall, 2006; Lacour, 2001).
However, another modernization indicator, urbanization, has no significant repercussion on homicide rates. These results have failed to support a group of researchers’ proposition that advanced urbanization is related to low homicide rates (Eisner, 2001; Gillis, 1994; Whitt, 2010). However, Cole and Gramajo (2009) theorized a whole different way. They argued that advancement of urbanization may be associated with a high rate of homicide and that it may be due to the fact that poverty and unemployment are common problems in a city and they lead to intense competitions for limited resources. Unlike Cole and Gramajo’s suggestion, urban life may not be related to a high homicide rate. Other unknown factors cancel out urbanization’s aggravating effects on homicide rates, although city life may be conducive to a high level of overall violence (Hansmann & Quigley, 1982). For instance, a well-developed medical care system in a city increases the chance of saving a violence victim’s life. Once a victim is saved, his or her case is recorded as either aggravated assault or attempted murder, not homicide. That may explain why medical resources are related to low homicide rates (see Doerner, 1988).
Second, the distribution of sex and age groups perform weakly. The percentage of females shows no impact on homicide rates. This is counterintuitive because males may be more prone to committing homicide than females. Also, the age group between 20 and 34 is not significant for the prediction of homicide rates. This is inconsistent with the argument that the size of the young adult age group is positively connected to homicide rates because an individual from that age group is most likely to commit homicide or become a homicide victim (Center for Disease Control and Prevention, 2004; O’Brien & Stockard, 2006; Pampel & Williamson, 2001; Reza, Mercy, & Krug, 2001). However, the insignificance of the young adult age group size is not a new finding. Many others also failed to find a correlation between age structure and homicide rates (Gartner, 1990; Lee, Maume, & Ousey, 2003; Reid, Weiss, Adelman, & Jaret, 2005; Rosenfeld, Messner, & Baumer, 2001). For instance, Gartner (1995) suggested that the effect of age distribution on homicide rates may be country specific. The United States display the strongest impact of the size of young adults on homicide rate. However, the same age group distribution for other nations has no strong repercussion on homicide rates. It is also possible that a peak age group for homicide may vary from one country to another. Stamatel (2009) argued that the leading age group for homicide in Eastern European nations is more likely to be the middle-aged group rather than young adult group. Thus, sex and age distribution require further cross-national investigation.
Some limitations of the current article require attention. First, cross-national studies are not able to capture the complex nature of conflict among different social groups in a nation. Thus, one must take a close look at an individual nation (Alesina et al., 2003). For example, some U.S.-specific studies found no significant nexus between ethnic diversity and violence. Immigration increases ethnic heterogeneity. However, the increase in immigration did not lead to a higher homicide rate in San Diego between 1980 and 2000. Instead, the increased number of foreign-born immigrants corresponded to a low homicide rate. “Immigration in the modern era paradoxically has strengthened institutions of social control, fostered economic development, and sparked a revival of previously high-crime, inner-city neighborhoods” (Martinez, Stowell, & Lee, 2010, p. 799). Thus, immigration does not necessarily intensify crime problems (Graif & Sampson, 2009). Given the same token, some nations such as Hungary, Czech Republic, Poland, and Slovenia experienced culture and political conflicts among different ethnic groups (Carment et al., 2009). However, their ethnic diversity did not automatically lead to ethnic inequality. In other words, even though some societies exhibit a high level of heterogeneity, they enjoy equality among various ethnic groups (Balkwell, 1990).
Second, researchers are aware that most criminal homicide occurs within a same ethnic group (Avison & Loring, 1986; Hansmann & Quigley, 1982). Intraracial homicide comprises 88% to 97% of all homicide occurring in the United States (Messner & South, 1992). For example, Wolfgang and Ferracuti (1967) asserted that 94% of homicide incidents in Philadelphia were committed within a same ethnic context. However, it may be because of the fact that residential segregation reduced contact opportunities between different ethnic groups (Messner & Golden, 1992). In other words, a member of a minority group is looking for a substitute target that is easily accessible. As a result, a minority member may use his or her ethnic group as an outlet for aggression (Balkwell, 1990). Hansmann and Quigley (1982, p. 218) called this phenomenon “displaced aggression.” In other words, a frustrated member of an ethnic minority expresses irrational and diffused aggression (Gartner, 1990).
Third, population heterogeneity, or fractionalization, may not be the same event as population polarization. A high level of population fractionalization indicates an existence of several small groups in a society. In contrast, an elevated population polarization means that two dominant groups compete. For instance, there may be two ethnic groups each of which comprise 50% of a total population. They may struggle for the hegemony of political and economic power (Alesina et al., 2003). In Sri Lanka, for example, the Sinhalese is the dominant ethnic group and its rival group is the Tamil who fight for the control of the central government (Carment et al., 2009). Thus, population polarization may be a more serious problem than population fragmentation. However, the present study did not examine the influence of population polarization on the homicide rate.
Finally, the present study has to resort to a multiple-year frame because the data for some nations are not available for a targeted year. This may be unavoidable for cross-national analyses, especially when one employs a comparatively large data set as in the current investigation. However, the use of multiple-year frames may cause reliability issues in a cross-national investigation.
In spite of the limitations as discussed previously, one of the important implications of the current study for future cross-studies is that population heterogeneity and income inequality independently have an aggravating influence on homicide rates. Given the research as a result, a harmonious relationship among diverse ethnic groups is an important factor for the reduction of violent crimes, including homicide. Also, income inequality in general is a strong explanatory variable on homicide rates. Thus, the reduction of income inequality is also important for the prevention of violence.
Footnotes
Declaration of Conflicting Interests
The author declared no potential conflicts of interest with respect to the research, authorship, and/or publication of this article.
Funding
The author received no financial support for the research, authorship, and/or publication of this article.