



Abstract
The purpose of this article is to explore factors contributing to perceptions about electronic monitoring policies governing sex offenders. Guided by Tannenbaum’s theory of attribution and Shaw and McKay’s theory of social disorganization, the authors examine the influence of demographic characteristics, victimization experiences, and neighborhood characteristics on perceptions about policies regarding the electronic monitoring of sex offenders. Ordinary least squares regression and logistic regression analyses of stratified telephone survey data reveal that factors associated with favorable views on the use of global positioning satellite monitoring for registered sex offenders appear to stem primarily from individuals’ demographic characteristics. Experiential and neighborhood factors do provide some influence over individuals’ views of electronic monitoring policies for sex offenders. Theoretical and policy implications are discussed.
Keywords
Introduction
Sex crimes provoke fear and anger among citizens, and scholars argue that a great deal of legislation geared toward sex offenders is a political response to public fear (Durling, 2006). Sensationalized media coverage of the most egregious cases strengthens public concerns. Politicians respond with a slur of legislation, despite a lack of empirical evidence on the efficacy of laws, policies, and programs for sex offenders (Andrew, 2006; Lieb, Quinsy, & Berliner, 1998). Existing research on the perceptions of sex offenders indicates that the public holds harsh opinions of sex offenders, and a majority of citizens support the use of registries and community notifications, residency restrictions, and the incarceration of convicted sex offenders (Mears, Mancini, Gertz, & Bratton, 2008). However, no known information exists on the public’s views of controlling sex offenders with electronic monitoring. As well, current research concerning public perceptions of sex offender policies tends to be descriptive and largely atheoretical.
The purpose of this article is to explore factors contributing to perceptions about electronic monitoring policies governing sex offenders. Due to the role that public fear plays in the legal and political response to sex offenders, we use fear of crime literature to guide our study. Specifically, we examine the role of demographic characteristics, victimization experiences, and the influence of social disorganization on residents’ support for the electronic monitoring of sex offenders. We expect that the factors that predict fear of crime also help explain support for laws geared toward controlling sex offenders. While several variables affect an individual’s level of fear, particularly influential factors include demographic characteristics (Austin, Furr, & Spine, 2002; Haynie, 1998; Jennings, Gover, & Pudrzynskas, 2007; Meyer & Post, 2006; Nasar & Jones, 1997), experiences with victimization (Garofalo, 1977, 1979; May & Dunaway, 2000; Mesch, 2000; Parker & Ray, 1990), and neighborhood social disorganization (Gibson, Zhao, Lovrich, & Gaffney, 2002; Markowitz, Bellair, Liska, & Liu, 2001; Wells, Schaer, Varano, & Bynum, 2006). A larger goal of our work is to add to the empirical work on perceptions of crime control policies as well as incorporate a theoretical basis using attribution theory and social disorganization theory in the exploration of public opinions and sanctioning. After conducting several searches on academic databases (e.g., Criminal Justice Abstracts, PsychINFO, Web of Science), we conclude that no known research has been conducted on perceptions of electronic monitoring to control sex offenders. As such, we draw from the literature on other popular sex offender policies while incorporating information on the use of electronic monitoring where it is available and relevant.
The Current Study
We propose that those who perceive vulnerabilities are likely to experience greater levels of fear of crime. Given that demographic, experiential, and neighborhood factors explain fear, we contend that perceptions about sex offenders and punishment strategies governing sex offenders can, in turn, be predicted by demographic, experiential, and neighborhood variables. Note that it is important to study the source of attitudes about sex offenders for several reasons. First, policies responding to sex offenders are costly, and it seems prudent to make sure that the policies are at least logically derived from accurate perceptions, rather than misperceptions, about sex offenders. Second, one objective of criminal justice policy is to increase feelings of safety. Sex offenders evoke intense feelings of fear among neighborhood residents (Beck & Travis, 2004; Durling, 2006; Levenson & Cotter, 2005). This fear causes withdrawal among citizens that has the potential to weaken mechanisms of informal social control (Gibson et al., 2002; Markowitz et al., 2001; Wells et al., 2006). Without mechanisms of informal social control, neighborhood residents are more apt to rely on more expensive forms of public social control (Rose & Clear, 1998). If policies such as the electronic monitoring of sex offenders increase feelings of safety, they may be more likely to be seen as a cost-effective solution.
Third, research on attitudes about sex offenders is also justified on theoretical grounds. Research shows that social disorganization—the inability of neighborhood to exert social control and control unwanted behaviors—leads to a myriad of social consequences. Residents who live in socially disorganized communities with weak organization structure and social control are more likely to report higher levels of fear (Skogan, 1990; Tittle, 1983). Does social disorganization influence individual attitudes toward sex offenders? If residents in disorganized communities have increased levels of fear toward sex offenders, it may be due to the residual effects of disorganization and heightened feelings of fear in general, or it may be a consequence of sex offender relocation to more disorganized communities (Lees & Tewksbury, 2006; Mustaine, Tewksbury, & Stengel, 2006a, 2006b). Examining the effects of social disorganization on perceptions of sex offenders may help clarify the effects of social disorganization and the effects of sex offenders on individual attitudes toward sexual perpetrators and criminals in general.
Fourth, it is important to study perceptions of sex offenders for cultural reasons. Analyzing perceptions of sex offenders can tell us a lot about a particular culture or neighborhood subcultures. Comparing the perceptions about sex offenders by cultural groups may shed light on whether certain groups of individuals have increased levels of fear and why. If such effects remain constant after controlling for individual and neighborhood level variables, it may be possible that fear of sex offenders is more of a cultural phenomenon than an individual level or neighborhood level occurrence.
Fifth, research on attitudes about sex offenders is important because policy changes are often based on the will of the public. For example, if there is ample support for the electronic monitoring of sex offenders via global positioning satellite (GPS), the use of such mechanisms is further justified and so is the spending of public funds on such initiatives. If there is a lack of support, however, stakeholders must reconsider the validity of such initiatives. For example, if the public perceives rehabilitation as a valuable option for dealing with sex offenders, the use of electronic monitoring may be called into question.
Finally, definitions of “cruel and unusual” are based on public perceptions. Typically, the notion of cruel and unusual as it relates to public opinion surveys has been applied to death penalty attitudes. A similar argument can be made for research on attitudes about the use of GPS for sex offenders. Whether or not the public has a general consensus on the appropriateness of different strategies for supervising sex offenders will help ascertain the rationality behind the newer policies being used to govern sex offenders.
Literature Review
Sex Offender Policies
Community notification and residency restriction laws
Despite the fact that sex offender policies stem from public pressure, little research has explored public sentiment about sex offender mandates. The few extant scholarly studies on perceptions of sex offender policies suggest that the public generally supports punitive sanctions for sex offenders (Mears et al., 2008). Most of the available research focuses on public sentiment about community notification and residency restriction laws. The birth of registration and community notification laws stems from several highly publicized cases. In particular, Minnesota’s 11-year-old Jacob Wetterling was abducted by an unknown male assailant in October of 1989. To date, no arrest has been made, and Jacob remains missing. On learning that a nearby halfway house provided shelter to sex offenders after their release from prison, the Wetterlings advocated for more efficient methods in recovering missing children. By 1994, the U.S. Congress signed the Jacob Wetterling Crimes Against Children and Sexually Violent Offender Registration Act that required all 50 states to create registries that cataloged residential information to track the whereabouts of known offenders (Lees & Tewksbury, 2006; Levenson & Cotter, 2005; Levenson & D’Amora, 2007). Such information, in theory, provides police with readily available information on potential suspects in cases involving the sexual abuse and abduction of children.
In July of 1994, New Jersey’s 7-year-old Megan Kanka was abducted, sexually assaulted, and murdered by a local, convicted sex offender. The Kanka’s successfully petitioned the New Jersey state legislature to create a bill requiring that the public be altered of the presence of convicted sex offenders in local neighborhoods. Three months after Megan’s death, the governor of New Jersey signed the first community notification bill, Megan’s Law. In 1996, President Bill Clinton signed the federal version of Megan’s Law that amended the Wetterling Act to allow states to disseminate information to the public about registered sex offenders (RSOs; Levenson & Cotter, 2005; Levenson & D’Amora, 2007; Tewksbury, 2005). Advocates maintained that with community notification, citizens can take additional safety precautions.
Following notification mandates, legislators began passing residency restriction laws. Such mandates include exclusionary zones that sex offenders are prohibited from residing or entering. Exclusionary zones are typically close in proximity to schools, parks, day care centers, playgrounds, and other places where children are likely to be present (Levenson & D’Amora, 2007). The least restrictive distance is in Illinois and is about 500 feet. More common boundaries range from 1,000 to 2,000 feet, with some reaching 2,500 feet (Levenson & Cotter, 2005; Levenson & D’Amora, 2007).
Preliminary research on residency restriction laws and community notification mandates suggests that these policies are ineffective in reducing sex offender recidivism and do little to contribute to public safety (Anderson & Sample, 2008; also see Levenson & D’Amora, 2007 for a review; Tewksbury & Jennings, 2010). These mandates contribute to a false sense of security by diverting attention away from more likely offenders who include family, friends, and neighbors (Durling, 2006; Meloy, 2006; Quinn, Forsyth, & Mullen-Quinn, 2004). In addition, sex offenders report loss of employment, residential instability, limited housing options, and harassment due to notification and residency restriction laws (Levenson & Cotter, 2005; Levenson & D’Amora, 2007; Mustaine et al., 2006b; Tewksbury, 2005; Zandbergen & Hart, 2006).
Electronic monitoring
The use of electronic monitoring for sex offenders is a recent phenomenon, receiving widespread attention after the Jessica Lunsford Act was passed in Florida in 2005. After the kidnapping, rape, and murder of 9-year-old Jessica, her father and other advocates successfully petitioned for additional legislation that offered more stringent tracking of released sex offenders. The resulting bill requires increased restrictions on sex offenders, namely, the wearing of electronic tracking devices. Following Florida, many other states passed similar statutes.
Among the devices used, GPS systems are perhaps the most advanced monitoring devices used to track sex offenders. A total of 24 orbiting satellites transmit precise time and location to a receiver. Location, within a few feet, is determined by calculating the time difference between space and Earth. Active GPS systems monitor continuously by transmitting data via a wireless network, whereas passive GPS systems store data that is later downloaded via telephone wires (Downing, 2006). Electronic monitoring technologies are used for three specific criminal justice purposes. First, devices are used for the detaining an offender to a specific location. Second, offenders are restricted to limited areas. Finally, surveillance is accomplished through tracking movements of the offender (Mack, n.d.). The technological capabilities of electronic monitoring help ensure compliance with residency restriction mandates (Taxman, 2002).
As with community notification laws and residency restriction mandates, there is little evidence to suggest that electronic monitoring reduces recidivism among sex offenders. In fact, without rehabilitative interventions, research shows that GPS does not lower sex offender recidivism and may actually increase negative outcomes when used as a punitive measure (Aos, Phipps, Barnoski, & Leib, 2001; Gendreau, Goggin, Cullen, & Andrews, 2000; see also Levenson & D’Amora, 2007 for a review). In addition to the questionable efficacy in reducing sex offender recidivism, other concerns with the use of the electronic monitoring of sexual offenders have been identified. The American Probation and Parole Association has also questioned the the reliability of electronic monitoring devices and noted the potential for false alarms (Levenson & D’Amora, 2007). Also noted that the reliability of electronic monitoring devices and the potential for false alarms are areas of concern. As well, electronic monitoring may be more punitive than intended (Payne & Gainey, 2004).
Perceptions of Sex Offender Policies
Support for popular sex offender laws tends to be widespread despite the public’s lack of general knowledge about sex offenders and the policies used to control them (Proctor, Badzinski, & Johnson, 2002). Indeed, irrespective of the unintended consequences and inconclusive findings on the effectiveness of the above policies (see Levenson & D’Amora, 2007 for a review), as many as 8 in 10 citizens support the use of community notification and believe that it is an effective strategy to reduce sexual offenses (Levenson, Brannon, Fortney, & Baker, 2007; Lieb & Nunlist, 2008). Similarly, more than half of surveyed participants in a Melbourne, Florida, community survey believe that residency restrictions effectively reduce sexual offenses (Levenson et al., 2007). Support for the electronic monitoring of sex offenders has yet to be determined.
Using 643 telephone interviews, Lieb and Nunlist (2008) found that notification laws increases feelings of safety because citizen become more vigilant of their surroundings. However, Beck and Travis (2004) found that notification of a sex offender’s nearby residence significantly increases fear of being personally victimized. A later study by Beck and Travis (2006) revealed that the notification of the presence of a sex offender in the neighborhood significantly increased precautionary behavior among citizens (Beck & Travis, 2006). Taken together, the results from Beck and Travis (2004, 2006) are not as contradictory to Lieb and Nunlist as they first appear. While notification may elicit fear, it also allows citizens to take action via additional precautionary behaviors, which in turn may increase feelings of safety.
These studies raise additional questions, especially concerning the relationships between feelings of safety and fear and support for policies regarding the electronic monitoring of sex offender. In addition to the assumption that sex offender policies may influence feelings of safety and fear and to studies addressing other correlates of fear of crime (as noted above), researchers also need to consider the impact that fear of crime has on individuals’ support for policies including the electronic monitoring of sex offenders. Such a question is logical given that many researchers contend that sex offender legislation is driven by public perceptions and fear (Durling, 2006). We attempt to shed light on this matter by incorporating fear of crime literature into our theoretical exploration of factors that contribute to the support of GPS monitoring of sex offenders.
Theoretical Framework
Although electronic monitoring is primarily used for detention, restriction, and surveillance, a secondary purpose may be to increase feelings of safety among the public. We argue that potential contributing factors of support for the electronic monitoring of sex offenders include (a) demographic factors, (b) experiential factors such as victimization, and (c) neighborhood factors such as social disorder. Our perspective rests on the assumption that these factors influence perceptions about sex offenders and policies to control them because they are related to fear of crime. Several theoretical contributions including Tannebaum’s concept of tagging from the labeling tradition, attribution theory, and social disorganization theory guide our discussion.
Tagging Attribution Theory: Explaining Individual-Level Differences in Perceptions About Polices
Although labeling theory boasts of a long history with many theoretical influences, the scope of this article focuses on contributions from Tannenbaum. In 1938, he argued that “tagging” or labeling an individual as a criminal leads to further offending. Tagging an individual begins a demonization process that ends in stigmatization. Tannenbaum’s concept of tagging is often used in exploring the causes of crime. For example, contemporary scholars focus on how tagging or labeling leads an individual to a state of consciousness that stimulates and evokes the protested characteristics. Through a self-fulfilling prophecy, an individual may come to identify and internalize the label that promotes further offending. Second, current scholars note that the ability to maintain conventional roles and statuses become limited due to the label. Such limitations on legitimate opportunities propel an individual to seek out illegitimate opportunities that result in additional criminal engagement.
Tannenbaum’s concept of tagging may also be useful in explaining the public’s reaction to criminals, especially in conjunction with attribution theory. Attribution theory suggests that individuals rely on a set of rules or inferences to explain the behavior, motives, and personalities of others. The rules and/or inferences used for causal explanations are tied to the attributes of the individual who is under inspection (Heider, 1958). Heider (1958) differentiated between internal and external attributions explaining that personal and environmental characteristics of an individual affect the perceptions and reactions of others. Decades later, Pettigrew (1992) noted that individuals often hold distorted perceptions of the motives and capabilities of other people’s acts based on whether they are in-group or out-group.
Using Tannebaum’s concept of tagging and attribution theory, it is feasible to suggest that once an individual is tagged as a sex offender, the perceptions and reactions of others will stem from the sex offender attribute. On being tagged, he is removed from the in-group, and other’s perceptions of him, his motives, and his personality may be misinformed, exaggerated, and/or distorted. Guided by the fear evoked from misinformed images, individuals who perceive vulnerability may be more likely to support electronic monitoring policies to govern and control sex offenders. Using Tannebaum’s concept of tagging and attribution theory, the current study seeks to determine if demographic characteristics and experiential factors related to the fear of crime help explain support for electronic monitoring policies for sex offenders. Researchers have applied this perspective to judicial decision making and found that judges rely on internal and external factors they perceive to be linked to criminal behavior to determine sentencing (Albonetti, 1991; Bridges & Steen, 1998; Rodriguez, 2007).
Demographic factors
Research shows that women experience higher levels of fear of crime than men (Austin et al., 2002; Haynie, 1998; Jennings et al., 2007; Killias & Clerici, 2000; Meyer & Post, 2006; Nasar & Jones, 1997; Perkins & Taylor, 1996). Several feminist scholars argue that the gender differences in fear of crime are related to the fact that women are at greater risk for experiencing sexual assault and related crimes (Meyer & Post, 2006; Pain, 2001; Schafer, Huebner, & Bynum, 2006). Women’s perceived inability to defend themselves, their heightened awareness of their own physical and social vulnerabilities, and the gendered responsibility of keeping children safe are additional explanations for heightened levels of fear of crime among females (Madriz, 1997; Riger, Gordon, & Le Bailley, 1978; Schafer et al., 2006; Scott, 2003; Stanko, 1995).
Studies show a relationship between age and fear of crime (McGarrell, Giacomazzi, & Thurman, 1997; Schafer et al., 2006). Older individuals experience higher levels of fear of crime compared with younger individuals (Baumer, 1985; McGarrell et al., 1997). Similar to women, this fear stems from the elderly’s perceived incapability of self-protection and their heightened awareness of the physical and social vulnerabilities that accompany later adulthood (Baumer, 1985). Fear of crime is also connected to age through children’s risk of victimization. Parents with children are more likely to express fear of crime (Snedker, 2006; Warr & Ellis, 2000).
Some research suggests that individuals with lower incomes and minority residents have greater levels of fear of crime compared with their majority counterparts (McGarrell et al., 1997; Schafer et al., 2006; Will & McGrath, 1995). For example, Scarborough, Like-Haislip, Novak, Lucas, and Alarid (2010) found that Black citizens are significantly more fearful of crime than non-Black citizens, and Skogan and Maxfield (1981) found that lower income minorities living in urban areas have more fear of crime than minorities who reside in suburban and rural areas. However, these relationships are often viewed as spurious as minority residents and individuals with low income tend to live in neighborhoods with higher crime rates, and the fear these particular groups experience is attributed to their heightened risk levels (Baumer, 1985; LaGrange, Ferraro, & Supancic, 1992; Will & McGrath, 1995). Supportive of this perspective, evidence suggests that when neighborhood factors such as perceived social and physical disorder are included, the influence of race switches directions and Black citizens are less likely to experience fear of crime (Scarborough et al., 2010). Scarborough et al. agreed that it is not race in and of itself that makes individuals fearful but other factors, including neighborhood characteristics, that influence fear of crime.
Experiential factors: Direct and indirect victimization
Studies on fear of crime reveal that individuals who have been victimized and those who have contact with victims are more fearful than those who have not been subjected to direct or indirect victimization (Garofalo, 1977, 1979; Hanson, Smith, Kilpatrick, & Freedy, 2000; Smith & Hill, 1991; Weinrath & Gartrell, 1996). The link between experiences with victimization and fear of crime is explained through the potential for trauma (Wilcox Rountree, 1998). The experience of trauma increases fear in that individuals are afraid of (re)living the negative event. Scholars contend that individuals who are not directly victimized still experience victimization indirectly or vicariously when they become aware of others’ crime experiences (Hanson et al., 2000; Skogan & Maxfield, 1981). Recent research suggests that the experience of victimization is a stronger predictor of fear of crime when it is vicarious (May & Dunaway, 2000; Mesch, 2000; Parker & Ray, 1990; Snedker, 2006).
Note that the relationship between victimization and fear of crime may be moderated by type of crime (Hanson et al., 2000). One study found a significant relationship between personal victimization and fear of crime and no statistical relationship between property crime and fear (Weinrath & Gartrell, 1996), whereas another study found the exact opposite. Contrary to Smith and Hill (1991), Weinrath and Gartrell (1996) found that property victimization, either by itself or in addition to personal victimization, was associated with fear of crime, but no relationship existed between fear of crime and personal victimization.
Social Disorder and Social Disorganization: Explaining Neighborhood-Level Differences in Perceptions About Polices
Several authors suggest that residents in socially disorganized neighborhoods have heightened levels of fear (Gibson et al., 2002; Markowitz et al., 2001; Wells et al., 2006). Socially disorganized neighborhoods are characterized by concentrated economic disadvantage, ethnic heterogeneity, and residential instability, which lead to a disturbance in a community’s organizational structure and social control (Sampson & Groves, 1989). Historically, the presence of these variables has been linked to weak social control that, in turn, leads to increased levels of crime and interpersonal violence (Blau & Blau, 1982; Bursik & Grasmick, 1993; Miles-Doan, 1998; Patillo, 1998; Sampson & Bartusch, 1998; Sampson & Raudenbush, 1999).
Areas of concentrated disadvantage lack adequate resources and financial support necessary to sustain control. Neighborhood-level poverty weakens the ability to maintain informal social control agents. Institutions such as churches, schools, and community organizations, struggle to prosper and lose the ability to exercise control over the community (Sampson & Groves, 1989; Sampson & Raudenbush, 1999). Similarly, residential instability and ethnic heterogeneity weaken levels of informal social control and the ability to control crime and disorder. If able, residents living in indigent communities relocate to neighborhoods that are more desirable. Mobility stands as a barrier to the development of relationships that create informal neighborhood control (Bursik & Grasmick, 1993; Tittle, 1983). As well, heterogeneity among residents decreases communication and familiarity among inhabitants. Residents fear and distrust their diverse neighbors; dialogue and interaction is impeded and common problems (i.e., crime and violence) and possible solutions go unrecognized (Van Wyk, Benson, Fox, & DeMaris, 2003). The community lacks the ability to organize itself and, consequently, control unwanted behavior (Patillo, 1998; Sampson & Groves, 1989; Tittle, 1983).
In short, economic deprivation, residential instability, and ethnic heterogeneity weaken informal social controls necessary to prevent crime and violence. Residents of socially disorganized neighborhoods express elevated levels of fear of crime because of heightened levels of crime and disorder and the perceived inability to exert informal social control (Bursik & Grasmick, 1993; Patillo, 1998; Sampson & Groves, 1989; Skogan, 1990; Tittle, 1983; Van Wyk et al., 2003; Wells et al., 2006).
Some research suggests that perceived disorder may be a better predictor of fear of crime than actual crime (Taylor & Hale, 1986). This is because disorder, in the form of unsupervised teens, loud noise, public drinking, abandoned houses, and excess litter, is more visible than actual crime, and areas with high rates of disorder are perceived as having higher levels of criminal activity. The fear of crime generated from neighborhood physical and social incivilities is a response to the assumption that crime, and risk, is prevalent in neighborhoods that are characterized by disorder (LaGrange et al., 1992). As well, research also suggests that it is the perception, rather than the reality, of disorder that generates fear of crime (Hunter, 1978; LaGrange et al., 1992; Wyant, 2008). In a more recent study, Wyant (2008) looked at 45 neighborhoods and found that those perceiving more incivilities were more fearful of crime than those who perceived less disorder. Scholars assert that when residents witness neighborhood disorder, they perceive their immediate environment to be threatening. This leads to increased feelings of vulnerability and thus increased feelings of fear of crime (Hunter, 1978; Wyant, 2008).
Method
Sample
The data for residents’ perceptions came from a larger project that involved a telephone survey of residents living in Norfolk and Virginia Beach during the spring of 2007. The pool of telephone numbers was stratified by locality population and consisted of a randomly generated sample of telephone numbers provided by a commercial sampling company. As the original purpose of this project was to examine various aspects of elderly life, there was an oversampling of respondents who indicated they were 60 years or older. Potential participants were offered a chance to be included in a drawing to win a gift certificate with a US$250 value.
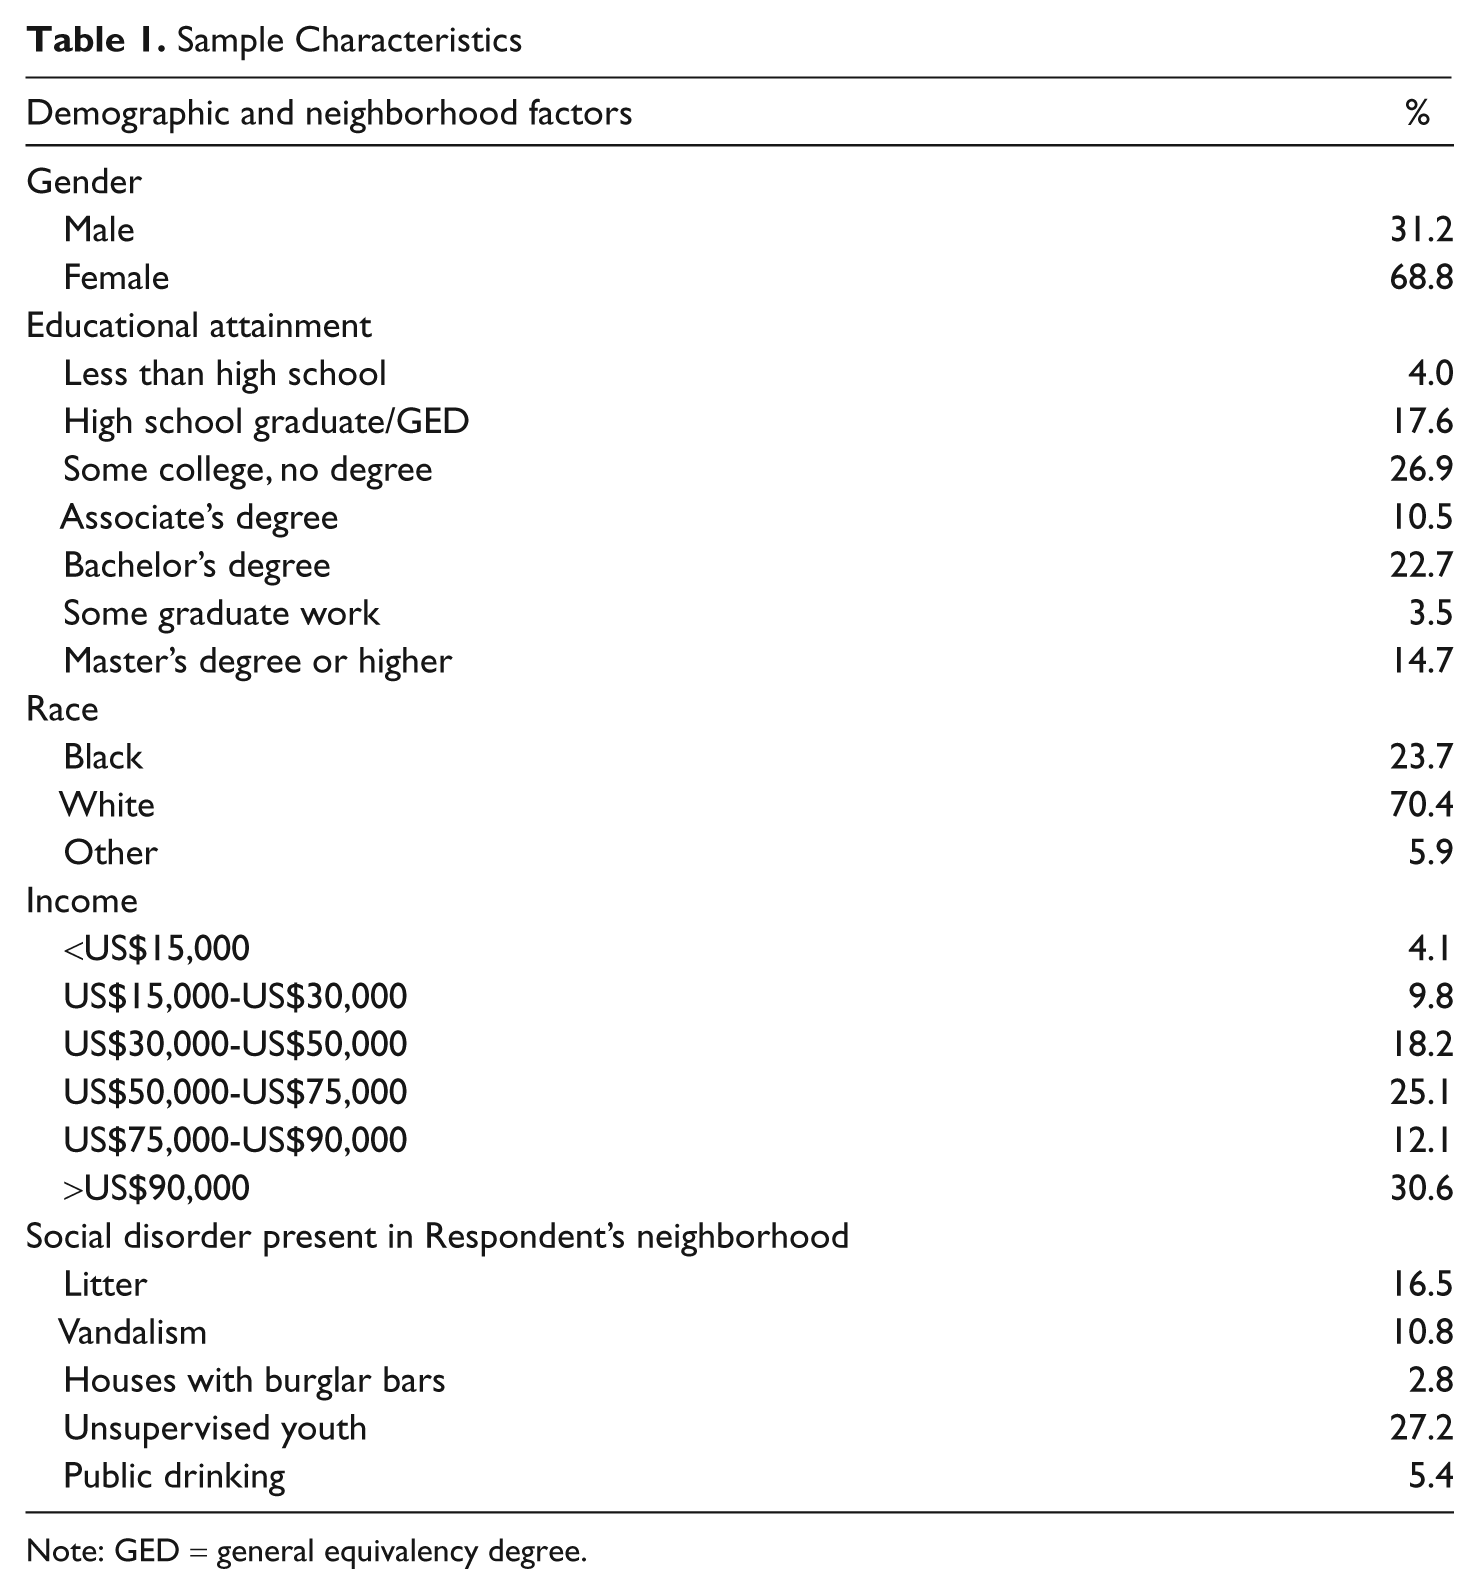
Table 1 provides an overview of the characteristics of the sample. In all, 746 respondents participated in the survey. Most of the participants were female (68.8%), and the average age of the sample was 49 years with 28.3% aged 60 or older (n = 211). The majority of respondents were White (70.4%) and just below one quarter were African American (23.7%). Reported annual income among residents showed good variation. Only 4% of respondents reported an annual income of less than US$15,000, and about 10% of respondents reported an annual income between US$15,000 and US$30,000. The remainder of the sample more frequently reported income levels between US$30,000 and US$50,000 (18.2%), US$50,000 and US$75,000 (25.1%), and US$75,000 and US$90,000 (12.1%). Respondents most often reported an annual income of more than US$90,000 (30.6%). More than a quarter of respondents reported some form of social disorder.
Sample Characteristics
Note: GED = general equivalency degree.
When comparing the characteristics of the sample with data from the two communities from which data is drawn (U.S. Census Bureau, 2007), we see that the sample has a greater proportion of females than the communities from which data is drawn (Norfolk = 49.4% female, Virginia Beach = 51.1% female). Also, the sample is older than the community values (M = 48.5 years compared with 29.6 years in Norfolk and 35.8 years in Virginia Beach; percentage aged 60 or older, sample = 28.3%, Norfolk = 14.5%, Virginia Beach = 13.8%). In regards to race, the proportion of Whites in the sample (70.4%) is very similar to the community figures for Virginia Beach (71.9%) but higher than for Norfolk (49.9%). Moreover, with regard to income, the sample appears wealthier than the communities as a whole. Less than 5% of the sample reported an annual income of less than US$15,000, whereas such incomes levels are reported by 17.3% of Norfolk households and 5.7% in Virginia Beach. However, the distribution of income at the upper end of the income continuum shows similarities: 30.6% of the sample reports an income of more than US$90,000, whereas 11.7% of Norfolk households and 23.8% of Virginia Beach households report incomes more than US$100,000.
Measures
Independent Variables
Demographic factors
We use several demographic variables in the analyses. Specifically, we include those variables that have shown to provide significant value to explanations for varying levels of fear of crime among community residents in previous research. The variables are gender, age, race, income, education, and views about income. 1 The Gender variable asks respondents to confirm their gender. If respondents are male, they are coded as 0; if they are female they are coded as 1. Respondents were asked to indicate their Age. This variable is continuous with a range of 18 to 90 and a mean of 48.9 years (SD =16.6). Respondents were asked to indicate their Race or ethnicity. Possible answers included White, Black, Hispanic, Asian, and Other. These answers were dichotomized into White = 1 and non-White = 0. Income was assessed with the following question, “What is your total household income (combined income of every person in the house)?” Answer choices are categorical: 1 = less then US$10,000, 2 = US$10,000 to US$14,999, 3 = US$15,000 to US$19,999, 4 = US$20,000 to US$24,999, 5 = US$25,000 to US$29,999, 6 = US$30,000 to US$39,999, 7 = US$40,000 to US$49,999, 8 = US$50,000 to US$59,999, 9 = US$60,000 to US$74,999, 10 = US$75,000 to US$89,999, 11 = US$90,000 to US$109,999, and 12 = US$110,000 and over. Respondents’ highest level of Education was recorded. Categorical choices include the following: 1 = some high school, 2 = high school graduate/GED, 3 = some college, 4 = associate’s degree, 5 = bachelor’s degree, 6 = some graduate work, 7 = master’s degree, and 8 = other. This measure was dichotomized into associate’s degree or higher = 1 and less than an associate’s degree = 0. Sufficient Resources is the measure of the respondent’s perception that they have sufficient resources for their housing, transportation, and medical needs, and for generating an income in the future. To assess this perceptions, respondents were asked four questions: “I have sufficient resources for my (a) housing, (b) transportation, (c) medical care and medicine, and (d) future income needs.” Respondents were asked to indicate their views on the scale, “strongly disagree, disagree, agree, and strongly agree.” The range of values for this variable is from 4 to 16. The mean score across the sample is 12.7 and the median is 12.
Experiential factors
Violence as a Child is the sum of responses regarding how much the respondent agreed or disagreed with the two statements, “When I was less than 12 years old, I was spanked or hit a lot by my mother or father” and “When I was a teenager, I was hit a lot by my mother or father.” Possible values on the variable range from 2 (greater disagreement, aka, no, not much hitting) to 8 (greater agreement, aka, yes, a lot of hitting). The mean value across respondents on this variable is 3.9 and the median is 4. These two items came from Straus’s Personal and Relationship Profile.
Victim of Property Offense is a variable that summarizes respondents’ reports of strongly disagreeing, disagreeing, agreeing, or strongly agreeing that they have received calls from a fraudulent telemarketer, made purchases over the phone that resulted in being ripped off, and whether in the past 5 years they have had items or money stolen. Possible values on this measure range from 3 (greater disagreement, aka, no, not much property crime victimization) to 9 (greater agreement, aka, yes, a lot of property crime victimization), and the mean respondent score is 6.3, with a median value of 6.
Victim of Violent Offense is a variable that summarizes the respondents’ reports on whether they strongly disagreed, disagreed, agreed, or strongly agreed about whether they had, in the past 5 years, been hit (physically) by someone, been yelled at or threatened in their home, had someone scare them in their home, and/or whether their partner/caretaker has used physical force to get his or her way with the respondent. The values on this variable range from 4 (greater disagreement, aka, no, not much violent crime victimization) to 16 (greater agreement, aka, yes, a lot of violent crime victimization). The mean value is 6.6 and the median is 7.
Neighborhood factors
Measures of the characteristics of the neighborhood in which respondents’ lived were collected from the U.S. Census Bureau, 2007. All variables were collected at the ZIP code level. Social Disorganization, a theoretical conceptualization, is assessed through two variables developed via factor analysis and two summed variable constructs. The variables Social Capital and Vulnerable Populations are each items that emerged from a factor analysis of 13 separate variables measuring characteristics of the population of each respondent’s ZIP code of residence. For the factor analysis, these two factors had eigenvalues of 5.59 and 3.20, respectively. All factor loadings are at least .44 to .96. The two summed variable constructs are Perceived Incivilities and Collective Efficacy. Each is discussed in turn.
The Social Capital variable is composed of seven variables: percentage of the ZIP code households that are female headed (reverse coded), percentage of population with a high school education, percentage of families in the ZIP code living below the poverty line (reverse coded), percentage of population that is White, percentage of households in the ZIP code that are owner occupied, percentage of population that is employed, and the median household income in the ZIP code.
The Vulnerable Population variable is composed of the six items: percentage of households in the ZIP code with residents below age 18, percentage of the population that are females, percentage of females that live alone, percentage of population U.S. born (reverse coded), percentage of population below age 18, and the percentage of households that lived in the same residence 5 years earlier (reverse coded).
The variable Perceived Incivilities is an index of the respondents’ reports of whether they perceive that there are problems in their neighborhood with the amount of litter, whether there are major signs of vandalism in the neighborhood, whether a lot of houses near to theirs have burglar bars on the windows, whether unsupervised youth are always in the neighborhood, and whether public drinking is a problem in the neighborhood. Respondents were asked whether they strongly disagreed, disagreed, agreed, or strongly agreed with the statements. These variables were summed together to create the construct. The range of values on this variable is 5 to 20; the mean is 8.9 and the median is 10. Higher values on this construct indicate that the respondent feels that there is more incivility in the neighborhood.
Collective Efficacy is a variable that represents the sum of the responses (here answer choices included very unlikely, unlikely, neither unlikely nor likely, likely, very likely) to the questions of whether the respondent believes neighbors would intervene if they witnessed children skipping school, persons spray painting graffiti, children showing disrespect to an adult, a fight breaking out in front of their house, and obvious drug activity. The values on this construct range from 5 to 25 with a mean of 19.6 and a median of 21. Higher values on this construct indicate that respondents’ feel that their neighbors would very likely intervene if they witnessed the aforementioned misbehaviors.
The Rate of Registered Sex Offenders in each ZIP Code is a measure of the density of RSOs residing in each respondent’s ZIP Code. The total population of the ZIP code is divided by the number of RSOs in residence in the ZIP Code. This measure yields the number of residents in the ZIP code per every one RSO. Across all ZIP codes included in the data, the raw number of RSOs in residence ranges from 55 to 139 (mean of 90, median of 82). When standardized by the total population of the ZIP code, the rate of RSOs in residence ranges from one RSO per every 222 residents to one in every 1,354 residents. On the rate of RSOs in residence in particular ZIP codes, the mean is one per every 696 residents, with a median value of one in every 541.
Dependent Variable
The dependent variable used in the first part of this analysis is a composite variable constructed from three individual items. This composite variable, Support of GPS, is the sum of the respondent’s indications of agreement or disagreement to three 4-point Likert-type items. We chose to sum these items rather than use factor analysis (or some other variable construct method) because the interitem correlations for these variables were less than .60 (correlations ranged from .33-.45). Furthermore, the Cronbach’s alpha coefficient for the reliability of these three variables as one scale is .7. These are 2 indications that these variables should be combined using a scale and not another method (Yaffee, 2011). The three items included in this composite measure are “Global positioning satellite systems provide authorities with an effective way to prevent more sex crimes,” “Sex offenders should be placed on GPS or other electronic monitoring as long as they are not in prison,” and “I feel safer knowing that sex offenders are wearing GPS or another electronic monitoring device.” Thus, the construct measures respondents’ views on the viability of GPS monitoring for sex offenders. Higher values indicate respondents have more favorable views about GPS monitoring, whereas values indicate respondents do not feel that GPS monitoring for sex offenders would do much good. The variable has a range in values of 3 to 12, with a mean of 9.4 and a median of 9.0. So, overall, respondents feel more positively than negatively toward GPS monitoring for sex offenders.
In later models, we dichotomize the dependent variable into extreme views about GPS monitoring of sex offenders. Here, we construct 2 additional dependent variables measuring each end of the extreme views (extremely positive views about the success potential of GPS monitoring and extremely negative views about the success potential of GPS monitoring). For the first construct, we dichotomize views into strongly positive views (scores of 10, 11, and 12 on the dependent variable construct) = 1 and other less extreme views = 0. For the second construct, we dichotomize views into strongly negative views (scores of 3, 4, and 5 on the dependent variable construct) = 1 and other less extreme views = 0. 2
Data Analytic Strategy
We use ordinary least squares (OLS) regression techniques for the first part of the analysis. This is the appropriate technique because for this first model, we use a dependent variable that is ordinal. For analyzing the predictors of extreme views, we use logistic regression techniques because for those models, the dependent variable is dichotomous. 3 In all, then, we consider three dependent variables. For each of the three analyses, we add variables in blocks of similar measures to determine the relative significance, not only of individual measures but also of theoretical constructs. The three groupings or blocks include demographic factors, experiential factors (previous victimization experiences), and neighborhood factors. Furthermore, we add these blocks cumulatively as such: For the analysis on each dependent variable, we start with the block of demographic variables (Model 1); then in addition to demographic variables, we add the block of experiential variables (Model 2); and then in addition to demographic and experiential variables, we add the block of neighborhood variables (Model 3). By adding in blocks of variables cumulatively, we can compare the chi-square statistics and F-change statistics to establish whether or not the addition of the new block of measures adds significantly to our understanding of the variation in the dependent variable.
In sum, we test three models for each of the three dependent variables. In doing so, we consider the relative impact of each block of variables as well as each measure’s individual contribution to the total variation in the dependent variables.
Results
OLS Regression Predicting Views About the Success Potential of GPS Monitoring of Sex Offenders
To assess the individual and neighborhood factors that are associated with respondents’ views on the viability of GPS monitoring of sex offenders, we turn to Table 2. Initially, we can see that these variables groupings, as well as the full model together, do not contribute much to the variance in attitudes about the success potential of GPS monitoring of sex offenders. The first grouping of variables, demographic factors, explains 1.2% of the total variance in attitudes; the addition of the second grouping of variables, experiential factors, explains an even smaller amount of the total variance, .9%; and adding the third grouping of variables increases the explanatory power of the model to 2.2% of the total variance in attitudes of the sample. Continuing, the addition of the second block of variables to the first block does not significantly alter the explanatory power of the model (F change = 0.63; significance at .60) which was actually significant to start (F change = 1.93; significance at .07). But, the addition of the third block of variables does add significantly (F change = 2.14; significance at .06) to the explanatory power of the full model.
OLS Regression of Demographic, Experiential, and Neighborhood Factors on General Views About GPS Monitoring of Sex Offenders

Note: RSO = registered sex offender; GPS = global positioning satellite; OLS = ordinary least squares.
*p < .100. **p < .05.
Turning to the specific blocks and indicators, we find that only one variable, sex, is significant the whole way through. Specifically, the results indicate that females have more positive views about the success potential of GPS monitoring of sex offenders than males in the sample (b = 0.42). When the experiential factors are added to the model, this finding remains the same (b = 0.41), an additional demographic factor is significant (sufficiency of resources), and none of the variables measuring previous experiences with victimization are significant. Specifically, as respondents agree more strongly that they have sufficient resources for their home, transportation, medical care, and future income needs, they are more likely to feel that GPS monitoring for sex offenders is a good idea (b = 0.07). When the neighborhood factors are added to the model, sex continues to be significant, with females continuing to have more positive views about GPS monitoring than males (b = 0.41), sufficiency of resources drops out, and one additional neighborhood factor is significant: vulnerable populations. Here, respondents who live in neighborhoods with greater proportions of residents who are vulnerable (e.g., youth, females living alone, households with children) have more favorable views about the success potential of GPS monitoring of sex offenders (b = 0.19).
As this OLS model predicts so little, we move to an examination of the factors that are associated with more extreme views about the success potential of GPS monitoring of sex offenders, namely, extremely positive views and extremely negative views.
Logistic Regressions Predicting Extremely Positive and Extremely Negative Views About the Success Potential of GPS Monitoring of Sex Offenders
Factors Associated With Extremely Positive Views
Table 3 specifies the results of the logistic regression examining the factors and variable groupings that are associated with extremely positive views of GPS monitoring of sex offenders. Initially, the overall picture has some similarities as well as differences to the OLS model predicting views about GPS in general. The first block of variables, demographic factors, provides a significant amount of explanation for the likelihood that respondents will have either extremely positive views on GPS monitoring or not (χ2 = 17.46; α = .08). The addition of the second block of variables, experiential factors, does not contribute anything to the model (χ2 = 1.88; α = .59), but the model as a whole remains significant (χ2 = 19.34; α = .02). The third block of variables, neighborhood factors, does significantly enhance the explanatory power of the model predicting extremely positive views about GPS monitoring of sex offenders (χ2 = 35.74; α = .01) as well as providing a significant fit to the data by itself (χ2 = 16.40; α = .01). Overall, the variables/blocks taken together provide a significant explanation (about 10%) of the variance in likelihood of respondents feeling extremely positively about GPS monitoring or not having this extremely positive view (Nagelkerke R2 = .098). This model explains extremely positive views more robustly than it did views on GPS monitoring in general. We also see this with the individual variables.
Logistic Regression of Influence of Demographic, Experiential, and Neighborhood Factors on Extremely Positive Views About GPS Monitoring of Sex Offenders

Note: RSO = registered sex offender; GPS = global positioning satellite.
*p < .100. **p < .05.
Specifically, Table 3 highlights the significance and the relationships between the variables and the likelihood of respondents holding extremely positive views on GPS monitoring of sex offenders or not holding extremely positive views.
Influence of demographic factors on extremely positive views about GPS monitoring of RSOs
When the first block of variables is added to the model, three demographic factors are significant: race, household income, and sufficient resources. To elaborate, White respondents are less likely to hold extremely positive views about GPS monitoring than non-White respondents (b = −0.51). Continuing, as respondents’ household income increases, they are less likely to hold extremely positive views on GPS monitoring of sex offenders than respondents with lower household incomes (b = −0.01). Finally, those respondents who have more positive views about the sufficiency of their resources are more likely to have extremely positive views about GPS monitoring (b = 0.09).
Influence of experiential factors on extremely positive views of GPS monitoring RSOs
As noted, the experiential factors do not contribute anything to the prediction of the likelihood of respondents holding extremely positive views on GPS monitoring or not. When these three experiential factors are added to the demographic factors, the same three demographic factors remain significant, and none of the factors measuring previous experiences with victimization are significant. To elaborate, again we find that White respondents are less likely to hold extremely positive views about GPS monitoring than non-White respondents (b = −0.53). Similarly, as respondents’ household income increases, they are less likely to hold extremely positive views on GPS monitoring of sex offenders than respondents with lower household incomes (b = −0.01). Moreover, those respondents who have more positive views about the sufficiency of their resources are more likely to have extremely positive views about GPS monitoring (b = 0.11).
Influence of neighborhood characteristics on extremely positive views of GPS monitoring of RSOs
Continuing, when the final block of five neighborhood factors is added to the model, the explanatory power of the model increases significantly (as noted above), and two of the individual factors significantly contribute: the perceived incivility construct and the vulnerable populations factor. In addition, two of the three demographic factors found to be previously important are still significant: race and household income. We also find that respondents’ views about the sufficiency of their resources lose significance, and sex becomes significant with the addition of the neighborhood factors. To specify, White respondents are less likely to hold extremely positive views about GPS monitoring than non-White respondents (b = −0.55), and as respondents’ household income increases, they are less likely to hold extremely positive views on GPS monitoring than respondents with lower household incomes (b = −0.01). Also now, females are more likely to hold extremely positive views about the success potential of GPS monitoring of sex offenders (b = 0.35).
Neighborhood factors are also significant predictors of extremely positive views on GPS monitoring of sex offenders. Specifically, the more respondents feel that there is a lot of incivility in their neighborhoods, the less likely it is that they will hold extremely positive views about the success potential of GPS monitoring of sex offenders (b = −0.12). In addition, respondents living in neighborhoods with greater proportions of vulnerable populations have greater odds of holding extremely positive views on GPS monitoring, exp(B) = 1.19.
Factors Associated With Extremely Negative Views
Table 4 specifies the results of the logistic regression examining the factors and variable groupings that are associated with extremely negative views of GPS monitoring of sex offenders. Initially, the overall picture has some similarities but mostly differences to the OLS model predicting views about GPS in general as well as the logistic model predicting extremely positive views. The first block of variables, demographic factors, does provide a significant amount of explanation for the likelihood that respondents will have either extremely negative views on GPS monitoring or not (χ2 = 11.417; α = .076). The addition of the second block of variables, experiential factors, however, does not contribute significantly to the model (χ2 = 5.45; α = .14), but the model as a whole remains significant (χ2 = 16.87; α = .051). The third block of variables, neighborhood factors, also significantly enhances the explanatory power of the model predicting extremely positive views about GPS monitoring of sex offenders (χ2 = 24.69; α = .04) does not provide a significant fit to the data by itself (χ2 = 7.82; α = .17). Overall, the variables/blocks taken together provide a significant explanation (about 12%) of the variance in likelihood of respondents feeling extremely positively about GPS monitoring or not having this extremely positive view (Nagelkerke R2 = .121). This model explains extremely positive views more robustly than it did views on GPS monitoring in general and about the same as the model assessing extremely positive views. We also see this with the individual variables.
Logistic Regression of Influence of Demographic, Experiential, and Neighborhood Factors on Extremely Negative Views About GPS Monitoring of Sex Offenders

Note: RSO = registered sex offender; GPS = global positioning satellite.
*p < .100. **p < .05.
Specifically, Table 4 highlights the significance and the relationships between the variables and the likelihood of respondents holding extremely negative views on GPS monitoring of sex offenders or not holding extremely positive views.
Influence of demographic factors on extremely negative views about GPS monitoring of RSOs
As expected, given the findings about the relationship between sex and views on GPS monitoring, here we find that females have lower odds of holding extremely negative views about the success potential of GPS monitoring of sex offenders, exp(B) = 0.53, specifically, females are 47% less likely to hold extremely negative views. Continuing, education now is a significant indicator of GPS views. To elaborate, respondents with at least a bachelor’s degree are 27% more likely to hold extremely negative views about GPS monitoring of sex offenders than respondents with less educational attainment, exp(B) = 2.73.
Influence of experiential factors on extremely negative views of GPS monitoring of RSOs
Interestingly, it is only with the prediction of extremely negative views that the experiential factors provide any significance to the model. Here, respondents who have previously been victims of property crime have a greater odds of holding extremely negative views about the GPS monitoring of sex offenders, exp(B) = 2.12. Specifically, victims of property crime are 88% more likely to feel that GPS monitoring of sex offenders has no purpose. Also, in this model, the two previously important demographic factors are still significant in that females are less likely and those with a greater educational attainment are more likely to hold extremely negative views about GPS monitoring of sex offenders (b = −0.58 and b = 1.1, respectively).
Influence of neighborhood factors on extremely negative views of GPS monitoring of RSOs
When neighborhood factors are added to the model, three additional factors are significant, and sex no longer is a significant contributor to the model. To specify, educational attainment and previous property victimization remain significant and reflect the same relationship: Those with at least a bachelor’s degree and those who have previously been victims of property crime are more likely to hold extremely negative views about the success potential of GPS monitoring of sex offenders (b = 1.01 and b = 0.93, respectively). In addition, respondents who live in neighborhoods with greater amounts of social capital are 42% more likely to hold extremely negative views of GPS monitoring, exp(B) = 1.58. Continuing, respondents who live in neighborhoods with greater proportions of vulnerable populations are 34% less likely to hold extremely negative views of GPS monitoring, exp(B) = 0.66. Finally, and also quite interesting, respondents who live in neighborhoods with a greater proportion of RSOs are 98% more likely to hold extremely negative views about the success potential of GPS monitoring for sex offenders.
Discussion
The results of this study demonstrate the complexities driving individuals’ perceptions about using GPS to monitor sex offenders. For the most part, an examination of the factors that are associated with favorable views on the use of GPS monitoring for RSOs appear to stem primarily from individuals’ demographic characteristics. Whereas other types of explanations provide only cursory explanations (e.g., victimization may lead to extreme negative views), in the final model, we see that measures of macrosocial disorganization, measures of microsocial disorganization, and proportion of vulnerable population also influence individuals’ views on the legitimacy and resulting safety of GPS monitoring for RSOs. As such, social disorganization does provide some influence over individuals’ views of GPS monitoring for RSOs, it is only in the context of other neighborhood conditions and resident characteristics and experiences. Also note that those theoretically most at risk for victimization, in terms of being in close proximity to sex offenders, do not view the electronic monitoring policies favorably. These results have interesting implications for policy, theory, and future research.
Three policy implications arise from these findings. First, because public safety is a goal of GPS monitoring policies, efforts must be undertaken to better delineate the way that these policies promote public safety, particularly for those who are most at risk for victimization. As it is, the electronic monitoring policies do not seem to be promoting perceptions of safety consistently across neighborhoods or groups. This is somewhat consistent with past research, which shows that members of the public support Megan’s law—even though they do not see the legislation as reducing recidivism (Schiavone & Jeglic, 2009). It is also consistent with research that shows that accessing sex offender registries appears to make people feel safer, but residents, in general, do not engage in additional self-protection efforts after accessing the registries (Anderson & Sample, 2008). Other research has found that females in urban areas who have accessed the registries take further prevention efforts (Anderson, Evans, & Sample, 2009). On one hand, for some groups the presence of sex offender policies (such as registries) may promote public safety. On the other hand, the lack of support for GPS policies in the communities with the highest percentage of vulnerable groups warrants attention.
Second, in promoting support for crime policies, whether they are GPS monitoring policies or other types of policies, it has been assumed that policy makers could target certain groups that historically oppose or support different remedies (Gainey & Payne, 2003). This study shows that those who want to generate support for policies, electronic monitoring or otherwise, should consider the ties between demographic experiences, victimization experiences, and neighborhood factors. Consequently, promoting understanding about crime policies requires a broader approach than has been traditionally assumed.
Third, the finding that those who live closest to sex offenders hold GPS in low regard has at least indirect implications for increasing understanding among policy makers about what policies are needed to improve the safety of those who are theoretically most at risk. Recent research by Sample and Kadleck (2008) showed that policy makers gain much of their awareness about sex offenders from high-profile cases reported in the media. In many ways, these high-profile cases are not “typical” sex offender cases. Most sex offenses are not predatory in nature, for example. If policy makers assume that sex offenses are predatory, then policies such as GPS for this offender group might make sense. However, the reality of the sex offense crime is such that GPS policies may do little to make individuals safer. In effect, it is plausible that the lack of a relationship between vulnerability (living close to sex offenders) and support for the electronic monitoring policies simply reflects the potentially accurate perception that GPS policies in and of themselves offer very little protection to potential victims of sex crimes. The task at hand is to make sure policy makers understand these dynamics.
One theoretical implication has to do with the ties between support for formal social control, informal social control, and social disorganization. Social disorganization research shows that when informal control is weak, formal mechanisms of control are more heavily relied on (Rose & Clear, 1998). Particularly, citizens turn to the criminal justice system to help regulate and control criminal offenders. It is assumed that measures taken by the state (i.e., detaining, arresting, imprisoning, and supervising offenders) ensure community safety by removing and/or controlling dangerous residents (Rose & Clear, 1998). In this study, GPS (a formal social control strategy) was supported more in communities with higher incivility but less in communities with higher social capital. On the surface, these findings are consistent with social disorganization theory. Tying in demographic characteristics and victimization experiences, however, resulted in these factors not being significant. What this suggests is that support for formal social control strategies are tied to life experiences and neighborhood characteristics. Living in disorganized areas, in and of itself, does not necessarily promote support or opposition to formal social control; rather, life experiences tied with community characteristics likely foster attitudes about social control.
Another theoretical implication that may help to understand the source of perceptions about sex offender policies has to do with attribution theory and labeling theory. It is possible that the lack of awareness about sex offender policies, in this case GPS policies, and sensationalized media reports may foster attitudes that are based on conceptualizations about sex offenders more so than awareness about the policies. Levenson’s (2007) research showed that citizens support sex offender policies irrespective of evidence about the utility of those policies. In effect, attitudes about sex offender policies may stem from the label of “sex offender” that assumes several negative dispositional attributes and an overriding desire to control sex offenders at the expense of accurate information about the effectiveness of the policies.
As with all research, this study is not without limitations. Perhaps most obvious is that this study draws on data from two communities in one state. Therefore, the results of this study should be generalized with caution. In addition, the sample in the present study is slightly skewed toward older adults, which may also affect generalizability.
A number of questions arise for future research. In terms of social disorganization theory, researchers should consider how micro- and macromeasures of social disorganization interact with demographic factors to form attitudes about other crime policies. Given that research shows that residents in these neighborhoods tend to have negative views toward strategies of formal social control, researchers should consider whether interactions between different types of factors contribute to the resistance to supporting formal social control strategies.
Also, tying these findings together with the results of prior criminological studies on sex offenders points to a number of possible research questions. Consider the past research on collateral consequences of sex offender registration and notification policies. Tewksbury (2005) found that in a sample of 121 offenders, nearly half lost a job due to registration requirements. About 1 in 2 offenders were denied a place to live or were asked to leave. More than 50% of the sample reported losing a friend who found about his registration status and almost as many reported being harassed. Although atypical, a small minority reported being physically assaulted. Mustaine and her coauthors (2006b) found that two thirds of sex offenders move after their conviction. This was attributed to the housing difficulties that RSOs face. Half of all those who change residencies move to more disorganized neighborhoods. In another study, Mustaine and colleagues (2006a) found that RSOs are more likely to live in neighborhoods that have increased levels of social disorganization. Their sample (N = 1,504) came from two counties in Florida (Seminole and Duval) and two counties in Kentucky (Jefferson and Fayette). Information on residential housing locations came from census data. The presence of structural characteristics was measured by ZIP codes. Other negative effects of sex offender legislation include social isolation, disrupted relationships, fear of assault, and shame and embarrassment. Indeed, Levenson and Cotter (2005) found that more than 70% of RSOs experienced additional stress because of legal mandates. Of 10, 6 feel isolated with more than half of the offenders losing friends. Nearly three quarters feel humiliation and stigma because of notification and registration acts. These factors, in addition to the ones listed above, are associated with sex offender recidivism (Center for Sex Offender Management, 2001; Craig, Browne, Stinger, & Beech, 2005).
This past research has done an excellent job highlighting the collateral consequences of sex offender registration and notification. Given the recency of GPS laws for sex offenders, the collateral consequences of monitoring sex offenders have not been empirically identified. Because of the large number of collateral consequences that occur as a result of registration and notification, it is reasonable to assume that GPS monitoring also results in collateral consequences for offenders as well as the community. The task is for researchers to delineate these collateral consequences and determine whether GPS monitoring policies are effectively preventing sex offenses.
Footnotes
Declaration of Conflicting Interests
The author(s) declared no potential conflicts of interest with respect to the research, authorship, and/or publication of this article.
Funding
The author(s) received no financial support for the research, authorship, and/or publication of this article.