



Abstract
This research reassessed the psychometric properties and predictive validity of the Self-Appraisal Questionnaire (SAQ) in response to published criticism of the authors’ earlier work. The current research used a much longer recidivism tracking-period, a different measure of recidivism, a larger sample, and more advanced analytic techniques than the original. Examination of the SAQ’s psychometric properties continued to indicate that three of the six recidivism prediction subscales exhibited substandard levels of reliability and four of these subscales were not unidimensional. Yet, in contrast to the author’s earlier results, the current analyses found that SAQ total score modestly predicted reconviction.
The Self-Appraisal Questionnaire (SAQ; Loza, 1996) is a relatively new recidivism/risk assessment instrument. The SAQ is made up of 72 true or false items. These items form eight subscales, six of which are intended to predict recidivism. The six recidivism subscales are (a) Criminal Tendencies, which assesses “antisocial attitudes, beliefs, behaviors, and feelings” (Loza, Dhaliwal, Kroner, & Loza-Fanous, 2000, p. 360); (b) Conduct Problems, which examines early problem behaviors; (c) Alcohol/Drug Abuse, a measure of substance abuse history; (d) Criminal History; (e) Antisocial Personality Problems, a measure designed to identify characteristics associated with antisocial personality disorder; and (f) Antisocial Associates. The SAQ also includes subscales designed to measure offenders’ anger and response validity of the test.
The SAQ (Loza, 1996) joins a growing list of recidivism/risk assessment instruments such as the Psychopathy Checklist–Revised (Hare, 1990), the Level of Service Inventory–Revised (Andrews & Bonta, 1995), and the Violence Risk Appraisal Guide (Harris, Rice, & Quinsey, 1993). Unlike these other risk assessments, the SAQ is based strictly on self-report questions, while competing instruments involve interview, clinical assessment, and file review. As a result, the SAQ can be administered by nonclinicians. Furthermore, the SAQ can be administered in group settings, and its administration is relatively quick (Loza & Loza-Fanous, 2000). Thus, the SAQ is a potentially valuable addition to the available body of recidivism/risk assessment instruments.
Generally, the extant literature has concluded that the SAQ is reliable and valid, and its subscales are unidimensional in the samples examined. Reliability assessments typically find that the SAQ exhibits adequate reliability. For instance, in a Canadian sample of offenders, the test–retest reliability coefficient was .95 for the SAQ total score and ranged from .69 to .93 for the six recidivism subscales (Loza et al., 2000). Likewise, a multinational study that assessed the internal consistency of the six recidivism subscales found that the unweighted mean Cronbach’s alphas were .77, .68, .80, .68, .75, and .53 for the Criminal Tendencies, Antisocial Personality Problems, Conduct Problems, Criminal History, Alcohol/Drug, and Antisocial Associates recidivism subscales, respectively (Loza et al., 2004, p. 1180). SAQ total scores also have exhibited high internal consistency in samples from Spain (Ballesteros Reyes, Graña Gómez, & Andreu Rodríguez, 2006) and South Africa (Prinsloo & Ladikos, 2007); however, in the Spanish sample, three of the subscales (Antisocial Personality, Antisocial Associates, Criminal History) had alphas of .60 or lower. Furthermore, five of the six recidivism subscales were determined to be unidimensional in a Canadian sample of federal inmates; the only subscale that was multidimensional was the Criminal Tendencies subscale, which had three dimensions labeled “general antisocial attitudes,” “unfair dealings with the criminal justice system,” and “attribution/rationalization for criminal conduct” (Loza et al., 2000).
Most importantly, the SAQ’s prospective, predictive validity generally has been demonstrated in the samples examined. In a series of articles using the sample of Canadian federal inmates utilized to develop the SAQ, Loza and colleagues have found that the SAQ total score predicts various postrelease outcomes such as reincarceration and parole violations (see Kroner & Loza, 2001; Loza & Green, 2003; Loza & Loza-Fanous, 2000, 2001, 2003; Loza, MacTavish, & Loza-Fanous, 2007). Furthermore, when the predictive ability of the SAQ was compared with more established actuarial measures of recidivism risk, the SAQ was found to be at least as effective in predicting recidivism as these other measures (Kroner & Loza, 2001; Loza & Green, 2003; Loza & Loza-Fanous, 2003).
Examinations of the SAQ, however, have not been uniformly positive. In our earlier work (Mitchell & MacKenzie, 2006), we examined the SAQ’s predictive validity and psychometric properties in a sample of offenders involved in a randomized experimental evaluation of Maryland’s only boot camp for adult offenders. The vast majority of sample members were young, African American males, convicted of a drug offense, who resided in high-crime inner-city areas of Maryland. Notably, this sample’s mean SAQ total score was higher than any then existing, published assessment of the SAQ. Based on the sample’s demographics, mean SAQ total score, and the high-crime contexts to which sample members would return, we characterized this sample as a “high-risk” sample.
In our earlier assessment of the SAQ, 159 offenders (out of 238 randomly assigned) had completed the SAQ and had been released back into the community for at least 90 days prior to the point when record checks were performed (M = 403 days, SD = 185 days). 1 In this sample, we found that three of the six recidivism prediction subscales exhibited substandard internal consistency reliability (Cronbach’s α for the Antisocial Personality, Criminal History, and Antisocial Associates subscales were .39, .46, and .14, respectively). 2 Furthermore, because the SAQ items are dichotomous (true/false) but principal components analysis (PCA) assumes continuous variables (McLeod, Swygert, & Thissen, 2001; Muthén, 1989), we assessed the factorial (construct) validity of the SAQ subscales by performing PCA on the tetrachoric correlation matrix of each subscales’ items, instead of the Pearson correlation matrix. 3 These analyses indicated that all of the recidivism prediction subscales were multidimensional with the exception of the Antisocial Associates subscale, whose items were so weakly related that no principal component could be extracted. Last, in our sample, a variety of analyses comported in finding that the SAQ did not predict time to first rearrest, whereas two sturdy predictors of criminal behavior, age and number of prior arrests from official criminal records, did significantly predict time to first rearrest. Based on these results, we concluded that the SAQ “may distinguish recidivists from nonrecidivists in other types of samples, [but] in this sample comprised predominantly of high-risk, young, African-American males from the inner-cities of Maryland the SAQ predicts recidivism no better than chance” (Mitchell & MacKenzie, 2006, p. 464).
In a critique of our earlier work, Dhaliwal, Loza, and Reddon (2007) conclude that “inadequacies” in the sample, method, and analytic techniques used “obfuscates their findings and invalidates their conclusions” (p. 1078). In regard to the sample used in our earlier work, Dhaliwal et al. stated (erroneously) that we recruited offenders by offering them participation in a program that promised early release in 6 months; as a result participation was not entirely voluntary and may explain the unusually high level of compliance (referring to the fact that 99% of respondents agreed to participate in the survey). Dhaliwal et al. also note that the sample used in our work was demographically unique in that it was composed largely of young, African American drug offenders; as a result, the usefulness of our earlier findings is suspect. Moreover, Dhaliwal and colleagues question our characterization of the sample as high risk. They note that very few of the offenders in our earlier sample were convicted of violent offenses (3%), and four other SAQ studies reported higher mean scores than the one reported in our earlier research.
Dhaliwal et al.’s (2007) critique also questions the methods and analytic techniques used in our assessment of the SAQ. First, these authors note that our use of tetrachoric correlations in the PCA, along with the use of parallel analysis to identify the number of components to retain, is problematic because tetrachoric correlation matrices are nongramian and consequently can have negative eigenvalues, which are incompatible with parallel analysis. Second, Dhaliwal et al. point out that in our earlier research, a substantial percentage of the sample (33%, n = 79 out of 238) was not included in the analyses and the exclusion of these offenders “could have seriously underestimated failure rates” (p. 1082). 4 Third, Dhaliwal and colleagues also note that 46% of offenders had follow-up periods of less than 1 year and 15% had follow-ups shorter than 6 months, which in their opinion is shorter than “[m]ost respectable studies” that typically “use a minimum of 6-months” (p. 1082). Fourth, and finally, another shortcoming in the recidivism analysis identified by Dhaliwal et al. is the use of rearrest as an indicator of recidivism; instead, these authors suggest the use of reconviction.
Many of these criticisms have merit. We believe that fairness requires that we reexamine our results with these issues in mind. Thus, the purpose of this research is to extend, improve, and clarify our earlier analyses of the SAQ. In response to the insights of Dhaliwal and colleagues (2007), we used a longer follow-up period and a different measure of recidivism. We also extended our earlier analyses by including many more of the offenders involved in this research project. Moreover, we improved our assessment of the factorial validity of the SAQ subscales by abandoning the use of PCA and parallel analysis.
Before we describe our revisions, it is important to clarify misinterpretations of our earlier work. First and foremost, Dhaliwal et al. (2007) misinterpreted our sampling procedure; specifically, we did not recruit offenders by promising participation in a program that would reduce their sentence. Instead, the Maryland Division of Correction (DOC) independently recruited the offenders used in our sample to participate in a correctional boot camp, and the DOC promised early release to offenders on graduation before these offenders were asked to participate in our survey. Simply put, offenders in our sample were not promised anything in return for their participation in the survey. Second, while our sample is unique in comparison to the samples used in other examinations of the SAQ, the demographics of our sample represent an important and growing part of the U.S. prison population. Considerable research demonstrates that young, minority, drug offenders increasingly have been incarcerated by the U.S. war on drugs since the mid-1980s and now represent a significant portion of the U.S. prison population (see, for example, Mitchell, 2009; Tonry, 1995; Western, 2006). Thus, our findings have important implications for a sizable segment of the U.S. prison population. Third, we regarded this sample as being at “high risk” for recidivism based on their demographic features (e.g., age, offense), relatively high mean SAQ scores, and the high-crime neighborhoods, in which they would reenter society. Prior research (e.g., Langan & Levin, 2002) shows that, at least in the United States, offenders released from imprisonment after conviction for drug or property offenses (the two most common offense types in our sample) have higher rates of recidivism (66.7% and 73.8%, respectively) than do violent offenders (61.7%). Furthermore, a growing body of research finds that offenders returning to high-crime, disorganized, inner-city communities, like the ones the majority of our sample eventually returned to, have elevated recidivism risk (e.g., Kubrin & Stewart, 2006). Finally, Dhaliwal et al.’s contention that four other SAQ studies have reported higher mean scores than the one reported in our earlier research overlooks the fact that these studies were not available at the time our earlier manuscript was written. Note that two of the four studies cited by Dhaliwal and colleagues were unpublished and unavailable at the time we wrote our earlier article (Ballesteros Reyes, 2005; Hemmati, 2004), the third study had not yet been published (Prinsloo & Ladikos, 2007), and the mean score (30.4) reported in the fourth study (Loza et al., 2004) was lower than our earlier sample’s mean of 31.43. 5 In sum, the members of our sample voluntarily agreed to take part in this research, were at considerable risk for recidivism, and represent an important section of the U.S. prison population.
Method
As mentioned above, the data analyzed herein originated from a randomized experimental evaluation of the State of Maryland’s only correctional boot camp for adult offenders. The State of Maryland restricted program eligibility to offenders: less than 36 years of age, serving their first adult term of extended incarceration (defined as a period of postconviction confinement of 60 days or more), serving a sentence for a nonviolent offense (but there were exceptions for minor violence), serving a sentence of 5 years or less, physically and psychologically fit to participate in the boot camp program, and had a release plan that involved residing in Maryland. The sample was male only because the control facility was a male institution (for a more detailed description of this evaluation and its sample, see MacKenzie, Bierie, & Mitchell, 2007; Mitchell, MacKenzie, & Peréz, 2005). The survey instrument used in this research included the full 72-item SAQ scale in addition to many other measures. The survey participation rate was very high (99%, N = 238). The present research analyzes data on 203 offenders who completed the SAQ and were released from prison. 6
In addition to the survey instrument, recidivism and criminal history data were obtained from the State of Maryland’s Department of Public Safety. It is important to note that these recidivism data differ from those used in our earlier work in two ways. First and foremost, in this research, we measured recidivism using new convictions (i.e., “reconvictions”), instead of rearrest. Second, we obtained an updated criminal record for all offenders, and as a result, time at risk for recidivism was much longer in the current analysis. The mean time at risk for recidivism was 26.4 months (SD = 7.5); all but three offenders (1.5%) had more than 6 months of time at risk and 97.5% of offenders had 12 or more months at risk. Thus, this current analysis used the recidivism measure preferred by Dhaliwal et al. (2007), and time at risk exceeded their minimum standard.
Table 1 summarizes key sample features. As previously stated, the overwhelming majority of respondents were young, unmarried, African American males convicted of drug distribution offenses. Contextually, nearly two thirds of these respondents (63%) reported that after release, they were planning to reside in high-crime, inner-city areas of Baltimore City or Prince George’s County (Maryland), which borders Washington DC. Furthermore, in spite of the fact that sample members were serving their first extended period of incarceration as adults, the average sample member had more than 5 prior arrests, 2.5 prior convictions, and a mean SAQ total score of 31.80 (SD = 10.04). 7 Thus, sample members, individually and contextually, were at considerable risk of recidivism. Therefore, it is not surprising that many offenders (27%) were reconvicted for a new offense in the period of observation.
Sample Characteristics (n = 203).
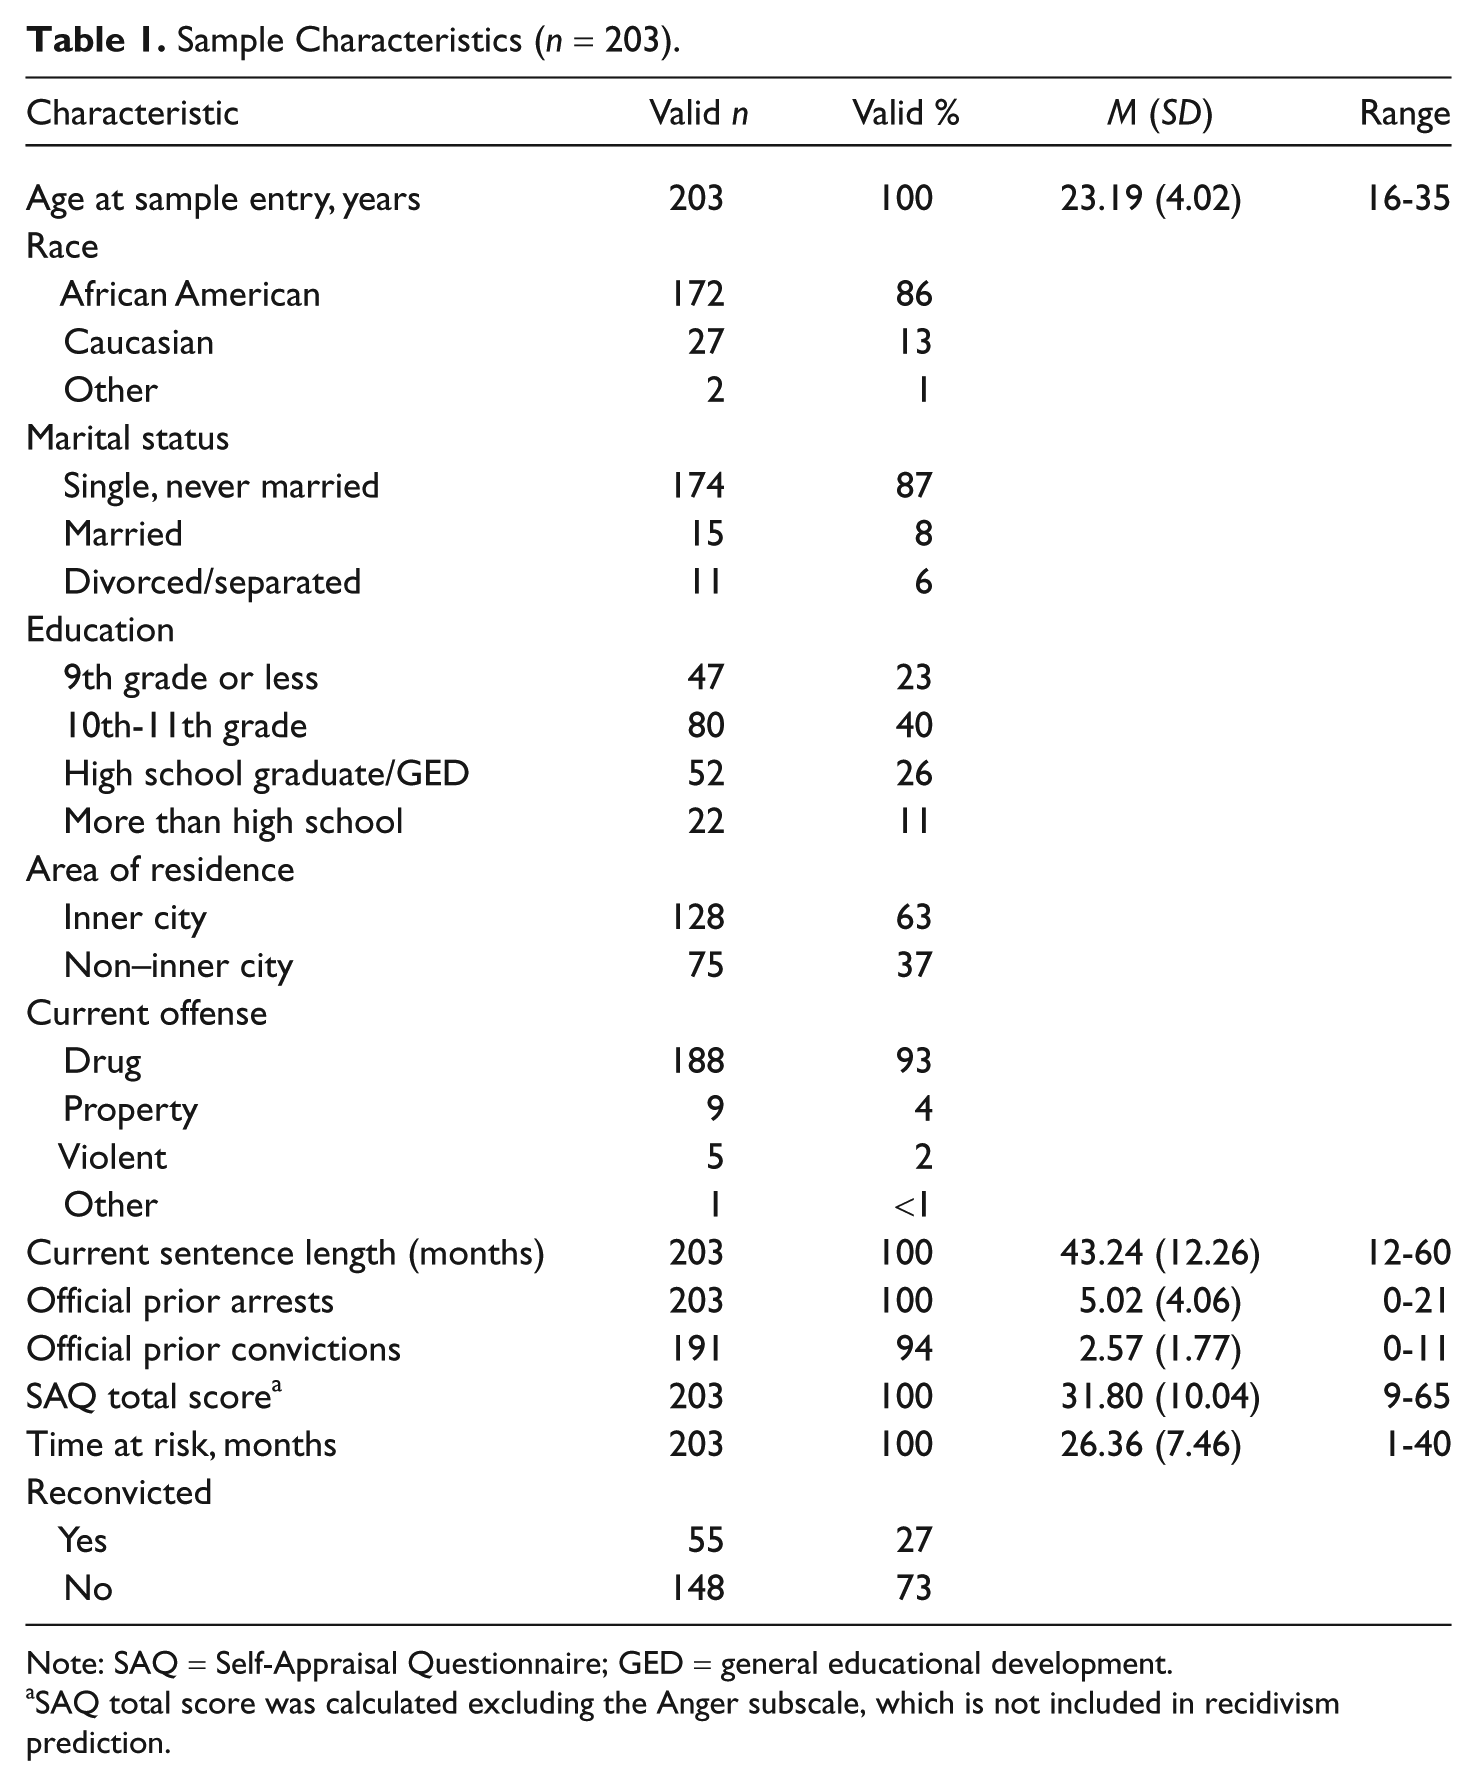
Note: SAQ = Self-Appraisal Questionnaire; GED = general educational development.
SAQ total score was calculated excluding the Anger subscale, which is not included in recidivism prediction.
Results
Reliability Assessment
Before assessing the predictive validity of the SAQ, we assessed its psychometric properties in this larger sample. To assess the internal consistency reliability of the SAQ and its subscales, we used Cronbach’s alpha. It is important to note that Cronbach’s alpha is strongly influenced by the number of items included (see, for example, Crocker & Algina, 1986); thus, it comes as no surprise that the SAQ total score, which is based on 72 items, exhibited high levels of internal consistency reliability (α = .88). Likewise, all of the subscales with 8 or more items had acceptable levels of internal consistency. The three recidivism prediction subscales with less than 8 items (Antisocial Personality, Criminal History, and Antisocial Associates), however, had substandard levels of internal consistency (i.e., α < .60). Thus, the SAQ total score and three of the six recidivism subscales met our criterion for internal consistency reliability, but the three shorter recidivism subscales did not. These findings match the results of Ballesteros Reyes and colleagues (2006) in that the same three subscales were found to exhibit low internal consistency (i.e., α ≤ .60).
Factorial Validity
Prior research (Loza et al., 2000) indicates that each of the recidivism prediction subscales is unidimensional with the exception of the Criminal Tendencies subscale, which has three dimensions. In our opinion, the above findings are questionable because they are based on the use of PCA of dichotomous items along with parallel analysis to determine the number of components to be retained. Yet, PCA and parallel analysis assume that variables are measured continuously (McLeod et al., 2001; Muthén, 1989). In our earlier work, we attempted to solve this incompatibility by performing PCA on the tetrachoric correlation matrix of each subscale and applying parallel analysis to guide component retention decisions. Dhaliwal et al. (2007) note, however, that tetrachoric correlations are nongramian and, as a result, may have negative eigenvalues, which are incompatible with parallel analysis. As a result, these authors contend that our solution may have solved one problem but “introduced another” (p. 1083).
To resolve these issues, we abandoned the use of PCA and parallel analysis, and instead used exploratory factor analysis (EFA). It is important to keep in mind that PCA is not designed to identify the number of latent variables explaining the common variance among a set of variables; instead, PCA is a data reduction technique that constructs artificial composite variables that summarize as much of the total variance, both common and unique, in the original variables as possible (Fabrigar, Wegener, MacCallum, & Strahan, 1999; Gorsuch, 1983). The appropriate analytic technique for identifying the number of factors explaining the common variance among a set of variables is EFA (Fabrigar et al., 1999; Gorsuch, 1983). In our earlier work, we applied PCA instead of EFA to be consistent with the analyses of Loza et al. (2000); however, EFA is clearly the more appropriate analytic strategy.
Here, to identify the number of latent common factors underlying each of the SAQ subscales, we used EFA estimated using weighted least squares and quartimin rotation in MPlus. The use of MPlus is noteworthy as it is designed to conduct a plethora of analyses, including EFA with noncontinuous variables, and MPlus reports several model fit statistics (e.g., likelihood ratio and root mean square error of approximation [RMSEA]) useful in guiding retention decisions (Muthén & Muthén, 2007). And instead of using parallel analysis, we follow the advice of Fabrigar et al. (1999, p. 281) and rely on multiple criteria in deciding on the appropriate number of factors to retain. Specifically, retention decisions were based on the following set of criteria: (a) All retained factors had eigenvalues greater than 1, (b) all retained factors were above the break in “scree” tests, (c) the number of retained factors had a RMSEA of .10 or less, 8 and (d) retained factors resulted in interpretable patterns of factor loadings (i.e., had “simple structure”).
The results of the EFAs are displayed in Table 2. These results indicate that two of the six recidivism subscales (Criminal History and Alcohol/Drug Abuse) were unidimensional. The Antisocial Personality and Conduct Problems subscales required two and three common factors, respectively, to explain the correlations between the items. Furthermore, the Criminal Tendencies subscale, which Loza et al. reported had three dimensions, required five common factors to explain the common item variance. Taken together, the results of these EFAs indicate that the SAQ recidivism subscales generally were not unidimensional in this sample.
Subscale and Item Analyses (n = 203).

Note: SAQ = Self-Appraisal Questionnaire.
k = number of items.
Based on exploratory factor analysis of each subscale using MPlus.
Predictive Validity
Given that the SAQ is largely a recidivism prediction tool, it is of paramount importance to ask, “Does the SAQ distinguish those offenders who recidivated from those who did not?” To address this question, we used proportional hazards (Cox) regression using days to first reconviction for a new offense as the dependent variable. 9 We began by regressing the dependent variable on the SAQ total score to assess the SAQ’s predictive validity in absolute terms. As we argue in our earlier work, we believe that it is not enough to simply establish a prediction instrument’s absolute predictive validity; instead, it is also important to establish that a prediction instrument predicts recidivism more effectively than measures readily available to corrections agencies (e.g., age and prior official arrests). Therefore, in a second analysis, we assess the SAQ’s relative predictive validity by comparing the SAQ’s predictive validity against age and number of prior arrests.
In contrast to our earlier results, these results indicate that the SAQ total score displayed a statistically significant relationship to the dependent variable (see Table 3). Model 1 assessed the absolute predictive validity of the SAQ total score. This model indicates that a 1-point increase in the SAQ total score is associated with a 5% increase in the hazard of reconviction. Harrell’s C, which measures concordance between predicted and observed events, provides a somewhat more intuitive sense of the SAQ’s absolute predictive power. Model 1 had a Harrell’s C of .627, which means that in 62.7% of useable pairs, there was concordance between the predicted and observed recidivism status. 10
Proportional Hazards Survival Analysis of Time to First Reconviction (n = 203).
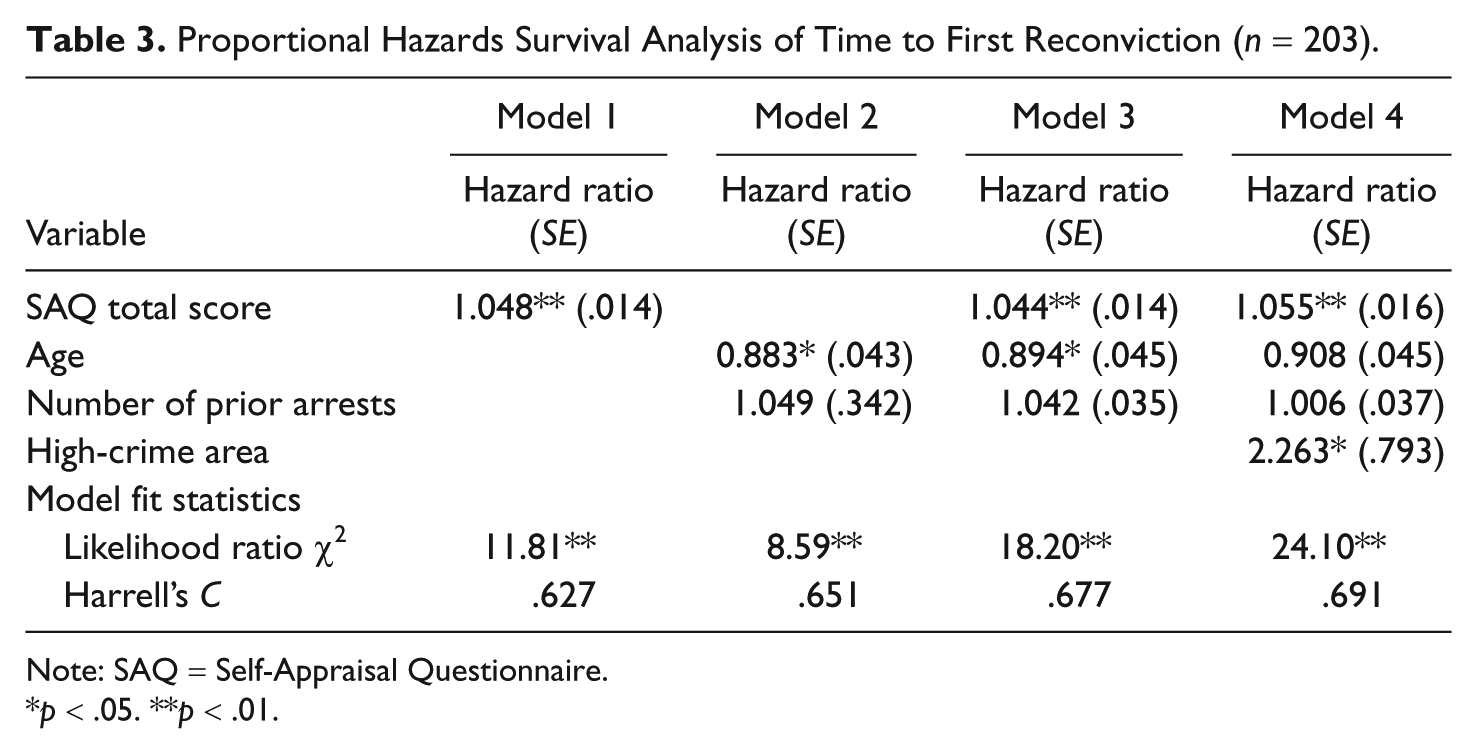
Note: SAQ = Self-Appraisal Questionnaire.
p < .05. **p < .01.
We used the scores corresponding to the 33rd and 66th percentiles to break the SAQ total score distribution into three approximately equal-sized groups. We plotted the Kaplan–Meier survivor estimates using these three groups (see Figure 1). These survivor functions indicate that, as expected, the group with the lowest SAQ total scores exhibited the highest likelihood of surviving and the group with the highest SAQ total scores had the lowest likelihood of surviving at any given point in the observation period, and the survival functions for these three groups were not equal statistically (log-rank and Tarone–Ware statistics of 10.91 and 12.94, respectively, both with 2 degrees of freedom and p < .05). Furthermore, the probabilities of reconviction for a new offense were substantively different for the three groups; 38%, 23%, and 16% of the high, medium, and low SAQ total score groups were reconvicted of a new offense in the period of observation. These results combined with the findings of Model 1 clearly indicate that SAQ predicts reconviction in absolute terms.

Kaplan–Meier survivor estimates of time to first reconviction.
To assess the SAQ’s relative predictive power, we estimated two additional models. The first of these models (Model 2) used age and number of prior arrests as predictor variables but excluded the SAQ total score. This model reveals that age and number of prior arrests predicted time to first reconviction slightly better than the SAQ total score, in that Harrell’s C for the Model 2 (.651) is slightly higher in comparison with Model 1 (.627). The second relative predictive model (Model 3) added the SAQ total score to the predictors used in Model 2. This model, which assesses the incremental predictive validity of the SAQ total score, is a statistically significant improvement over Model 2 (i.e., it fits the data significantly better). Model 3 also reveals that the SAQ total score predicted time to first reconviction, above and beyond age and number of prior arrests; in fact, the magnitude of the SAQ’s association with reconviction was essentially unchanged from Model 1. These results suggest that the SAQ total score when used as the lone predictor variable, and when used in addition to sturdy predictors of recidivism, had a positive, statistically significant relationship to the hazard of reconviction; yet, the strength of the relationship between the SAQ total score and the hazard of reconviction is relatively modest.
Finally, Model 4 added to Model 3 a dichotomous variable distinguishing respondents who returned to high-crime areas of Maryland from other respondents. Model 4 fits the data significantly better than Model 3, as revealed by testing the significance of the difference of these two models’ likelihood ratio statistics. Interestingly, this variable, above and beyond the other variables already in the model, had a sizable, positive relationship to recidivism. Specifically, respondents who returned to Baltimore (city) or Prince George’s County had hazards of reconviction 126% greater than respondents who returned to other areas. This finding, joined with the fact that 63% of the sample returned to these two areas, supports our contention that the combination of demographics (especially youthfulness of sample), relatively high SAQ total scores, and community context made this sample “high risk.”
Discussion
In this research, we endeavored to improve and extend our earlier analyses of the SAQ’s psychometric properties. These changes in methodology produced few substantive changes in our findings regarding the SAQ’s reliability and factorial validity. In concordance with our earlier findings, three of the six recidivism prediction subscales exhibited substandard internal consistency reliability, and four of the six recidivism prediction subscales were more factorially complex than suggested by the work of the SAQ’s developers (see Loza et al., 2000). Thus, the current findings confirm our earlier results, despite the fact that these results are based on a larger sample and rely on different analyses. It is important to note that Dhaliwal et al. (2007) argued that the sampling procedure used in this research is responsible for the substandard psychometric properties exhibited. This explanation, however, does not explain why our sampling procedure would only affect approximately half of the scales—primarily the shorter subscales—instead of all of the subscales. Rather than attribute these findings to flaws in the sampling procedure, a more reasonable explanation is that several of the SAQ subscales are in need of refinement (and perhaps expansion) before the SAQ can accurately measure each of the subscales in samples similar to ours.
The methodological improvements used herein did alter our findings regarding the predictive validity of the SAQ. In contrast to our earlier results, the current findings indicate that the SAQ total score was statistically related to our new measure of recidivism, reconviction. Offenders with higher SAQ scores recidivated quicker and more frequently than offenders with lower SAQ scores. This finding confirms Dhaliwal and colleagues’ (2007) contention that the SAQ predicts reconviction more accurately than the less valid measures of recidivism like rearrest.
Although the SAQ total score clearly had a statistically significant relationship with reconviction, the substantive size of this relationship was relatively modest. Harrell’s C indicated that the SAQ total score accurately predicted recidivism status for approximately 63% of all possible pairs of offenders. Yet, two static predictors of recidivism already available to corrections agencies, age and number of prior arrests, predicted recidivism slightly better, with 65% accuracy of predictions. The implication of this finding is that in samples like this one, recidivism can be predicted by age and number of prior arrests approximately as well as the SAQ total score. This finding does not mean that the SAQ is useless in recidivism prediction; in fact, the SAQ total score predicted reconviction above and beyond these two sturdy predictors. In other words, the SAQ total score when added to these predictors increased the accuracy of predictions—a finding that confirms the SAQ’s value as a predictor of reconviction.
In short, the usefulness of the SAQ in predicting recidivism in similar samples depends on how the SAQ total scores will be used. By itself, the SAQ’s predictions were no better than those generated by age and number of prior arrests. Yet, when used in combination with these factors, its addition increased predictive accuracy. 11
These revised analyses have remedied shortcomings in our prior research and more accurately assessed the SAQ. We believe that our findings highlight the need to continue to validate the SAQ in diverse samples and contexts, as well as to use various measures of recidivism. We hope this research contributes to these areas of need.
Footnotes
Declaration of Conflicting Interests
The author(s) declared no potential conflicts of interest with respect to the research, authorship, and/or publication of this article.
Funding
The author(s) received no financial support for the research, authorship, and/or publication of this article.
1.
Note that the sample originally included 238 offenders, but the State of Maryland ruled that 4 offenders were ineligible for participation in the program, and these inmates were removed from the program evaluation. Here, however, the evaluation of the boot camp is not of interest so we use the original sample of 238.
2.
Although there is no single widely agreed-on standard for internal consistency reliability, we defined adequate reliability using the relatively lenient standard of Cronbach’s alpha of .60 or greater.
3.
Tetrachoric correlation matrices estimate the Pearson correlations that would be obtained if the dichotomous items were measured continuously.
4.
These offenders were not included in the earlier analysis because they had not been released, had been released for less than 90 days, or didn’t complete the Self-Appraisal Questionnaire (SAQ).
5.
Dhaliwal, Loza, and Reddon (2007, p. 1079) report that the Australian sample used in Loza et al. (2004) had a mean score of 32.53, but this mean score conflicts with the statistics reported in Loza et al. (2004). Specifically, Loza et al. (2004) indicated that the Australian sample (n = 116) had a mean of 30.6 for the 81.9% of the sample whose SAQ scores were used for research purposes and 29.2 for the 19.1% of the sample whose SAQ scores were used for release purposes (p. 1176-77). Furthermore, Loza et al. split the Australian sample in half (low and high scores), and the mean for the two groups were 26.34 and 34.54, respectively (p. 1183). The overall sample mean calculated from both sets of reported statistics indicate a mean of approximately 30.4, which is lower than the mean reported in  .
.
6.
Of the remaining 35 offenders, 6 offenders had not been released by the time of the recidivism data collection, and another 29 offenders agreed to participate in the survey but did not complete the SAQ. We have limited information on these 35 offenders. However, the available information (demographic and criminal history data) indicates that these two groups were not statistically or substantively different in terms of age, race, educational background, and criminal history. Likewise, the 6 respondents who were not released also appear similar to the other respondents on demographic and criminal history variables. Thus, we did not believe that missing data caused any bias in our results.
7.
Note that despite the sample’s demographic homogeneity, the variability of SAQ total score (SD = 10.04) is similar in magnitude to other SAQ studies.
8.
“RMSEA is an estimate of the discrepancy between the model and the data per degree of freedom for that model” (Fabrigar, Wegener, MacCallum, & Strahan, 1999, p. 280). Root mean square error of approximation (RMSEA) values less than .05 indicate good model fit, values between .05 and .08 are considered acceptable fit, and values greater than .08 to .10 are considerable marginal fit. We used a relatively lenient criterion of any model with a RMSEA of .10 or lower as a sufficient model fit.
9.
We also conducted the predictive validity analysis using rearrest. The results of these analyses are virtually identical to those reported in . Specifically, in these analyses, SAQ total score did not have a statistically significant relationship to the hazard of rearrest; in fact, this relationship was essentially null.
10.
We used Harrell’s C as a measure of predictive power because it was designed to be compatible with survival analysis. Other measures of predictive power like the area under the (receiver operator) curve (AUC) are not well suited for outcomes with varying time at risk. Despite this concern, we estimated logistic regression models parallel to those in (i.e., used same predictors) with reconviction as the dependent variable. The AUC statistics for these four models are .630, .654, .679, and .704, which are highly similar in order rank and incremental change as the Harrell’s C statistics reported in Table 3.
11.
It is important to note that this research did not assess the SAQ’s utility beyond recidivism prediction. The developers of the SAQ note that it can also be used for classification, case planning, and referral to appropriate treatment. Its utility in performing these functions was beyond the scope of this research, and these findings have no bearing on the SAQ’s performance in these arenas.