



Abstract
An important area in correctional rehabilitation research is to better understand how offenders differentially respond to correctional treatments. Potential treatment moderators forwarded in the literature are gender, race/ethnicity, and personality types. This exploratory study asked whether a group of parolees had demographic and personality moderators of treatment and, if so, were the moderating influences different by race? An experimental design was used to randomly assign a sample of 937 male parolees (n = 658 African American, n = 279 White) to the experimental group that received the cognitive-behavioral treatment program and the control group that did not. Discrete-time event history analysis independently tested the program-moderating effects of demographic and personality characteristics (age, prior employment status, educational attainment, marital status, social class, risk of recidivism, prior violence, IQ, reading level, cognitive maturity, personality type, residential urbanization) on recidivism for African American and White parolees. This study found that the age group and personality type of the parolees interacted with the cognitive-behavioral program in ways that created racially disparate recidivism outcomes.
Keywords
Introduction
Correctional rehabilitation’s primary objective is to reduce recidivism by providing effective correctional programming to all participants. The Principles of Effective Intervention (PEI) provides a theoretical framework to accomplish this mission. The PEI is an “evidence-based” approach to correctional rehabilitation comprised of a series of empirically and professionally supported treatment techniques to reduce recidivism (Andrews & Bonta, 2007; Andrews, Bonta, & Hoge, 1990; Gendreau, 1996). The PEI includes an important but little-understood principle called Responsivity. This principle suggests that offender characteristics interact with program and facilitator characteristics to influence how well a program works to change offender behavior. This point—that clients can react differently to correctional programming—needs more empirical attention.
This exploratory study tests whether African Americans and Whites have differing treatment moderators. We used program evaluation data collected from a large-scale experiment that assessed the effectiveness of the Reasoning & Rehabilitation program on a sample of male parolees. The final report from this experiment reported that the cognitive-behavioral treatment program worked to reduce recidivism for White but not African American parolees (see Van Voorhis et al., 2002). To better understand this racially disparate program outcome, we asked two research questions. First, we asked whether any parolee characteristics moderated treatment success for the White parolee group and African American parolee group. To answer this question, we tested whether client characteristics such as age, preprison employment status, educational attainment, marital status, social class, risk of recidivism, prior violence, IQ, reading level, cognitive maturity, personality, residential urbanization, and race and gender of the supervising parole officer moderated treatment outcomes. Second, we asked whether the significant moderating characteristics were similar for Whites and African Americans. We answered this question by providing a descriptive comparison of the significant moderators by race. 1
Literature
How Could Race Matter in Correctional Treatment?
Race in the United States generally refers to categorical distinctions made on the basis of skin color or any other physical characteristic that is attached to being one race versus another (American Psychological Association, 2003; Sampson & Lauritsen, 1997). 2 Examples of these nominal categorical distinctions include “White,” “Black,” and “Hispanic.” But exactly what these physical distinctions mean in terms of constitutional, social-psychological, and cultural differences, as well as differences in the harmful effects of racial stereotyping and racial discrimination, is an entirely different matter.
Racial identity is a central component of race. Racial identity can be defined as the meaning and significance that members place on race in the process of self-identification (Sellers, Smith, Shelton, Rowley, & Chavous, 1998). Consistent with the APA’s definition of race, racial identification is continuously perpetuated through social interaction between individuals and social groups. Racial identity among African Americans has emerged from cultural, historical, political, and economic factors that have shaped this group. African American racial identity, in particular, is argued to comprise four dimensions: (a) the salience of race to self-concept by a particular person in a particular context, (b) the centrality of race in self-definition across contexts, (c) the regard that African Americans possess about being African American (positive and negative judgments), and (d) the ideology that African Americans have about the behaviors, norms, and values that the racial group should share (Sellers et al., 1998). When components of these dimensions are not taken into consideration in the treatment process, African Americans can experience an “invisibility syndrome” in the treatment setting where their experiences are not recognized, validated, legitimized, and respected (Franklin, 1999).
Yet, racial identity may not simply be a voluntary endeavor without consequence. The importance of racial identification to the development of positive psychological outcomes was reported to be dependent on the salience of group membership (Phinney, 1996), and successful racial identification was argued to be important for African Americans in the development of psychological health while the lack of it resulted in generalized psychological distress and depression (Arroyo & Zigler, 1995; Fordham & Ogbu, 1986). Therefore, racial identification for African American clients in correctional treatment might offer a sense of resiliency and relief from experienced racism and discrimination in larger society.
Racial identification was found to influence correctional treatment participation in a study of domestic violence counseling for African Americans. Average correctional program completion rates for African Americans were 55% across a series of program modalities (cultural-focus, conventional with only African American clients, and conventional with racially mixed clients). But completion rates increased to 63% and 65% when African American clients with high levels of racial identification were isolated from lower degrees of racial identification in the culturally focused and conventional programs (Gondolf, 2008).
A component of racial identity is cultural in nature. Culture is the amalgamation of values, norms, lifestyles, roles, and methods that create belief systems and value orientation (American Psychological Association, 2003). The formation of culture is a complex process. Culture emerges as social groups adapt to their environment, and these groups are not necessarily mutually exclusive—people of one cultural group may freely blend into another cultural group (Johnson et al., 1995). Researchers have noted that racism has been a primary shaper of African American culture (e.g., Sue & Sue, 1990). Such cultural issues are not shed when clients enter the treatment setting. Ethnic and racial minority clients are more likely to express a sense of distrust in therapy and a sense of elitism by the therapist as well as perceive and experience overt and covert racial discrimination in the greater criminal justice system (Shearer, Myers, & Ogan, 2001; Thompson, Bazile, & Akbar, 2004; Toch, Adams, & Greene, 1987).
Culturally focused correctional programs theorize that it is not enough for facilitators to be merely sensitive to cultural differences between clients. Culturally focused correctional programs, as part of the curriculum, also guide clients through specific and culturally relevant issues (Gondolf, 2007). For African American men, such issues include overcoming the lack of positive images of Black manhood (Blake & Darling, 1994), the shared experience of prejudice and racism, racial inequality (Reisig, Bales, Hay, & Wang, 2007), reasons for substance use (Marsh, Cao, Guerrero, & Shin, 2009), and a lack of educational and employment achievement (Western & Pettit, 2000).
Taken together, there is ample evidence to question whether the so-called best practices approaches to correctional rehabilitation can afford to disregard race. The field of psychology (American Psychological Association, 2003) and, in particular, the multicultural counseling literature (Arredondo et al., 1996; Sue, Arrendondo, & McDavis, 1992) considers it necessary to integrate cultural, ethnic, and racial differences into the program setting. The PEI is amenable to idea of racially/ethnically specific and culturally directed treatment through the notion of responsivity. Yet, how race influences correctional treatment, or more specifically whether offender demographics and assessments help to explain racially different program outcomes, have yet to be identified. Taking this body of work, we test to see if race needs to be integrated into the treatment setting. We do so by testing whether African American and White parolees have different demographic, assessment, and personality moderators of correctional success.
Principle of Responsivity
Risk, need, and responsivity are core principles of the PEI. The risk principle states that intensive services should only be given to high risk offenders and not to low risk offenders (Andrews & Bonta, 2007; Andrews, Zinger, et al., 1990). The need principle argues that for correctional programs to reduce recidivism, they must reduce the malleable criminogenic needs that fuel criminal behavior (Andrews & Bonta, 2007; Andrews, Bonta, et al., 1990). The principle of responsivity advises correctional personnel to match the correctional programs they offer to the offenders they treat and the facilitators that run the programs (Andrews & Bonta, 2007; Gendreau, 1996; Kennedy, 2000). The evidence in support of the PEI is strong and extensive (Allen, MacKenzie, & Hickman, 2001; Andrews, Bonta, et al., 1990; Gendreau & Ross, 1979, 1987; Izzo & Ross, 1990; Lipsey, 1992, 1999; Lowenkamp, Latessa, & Smith, 2006; MacKenzie, 2000; Pearson, Lipton, Cleland, & Yee, 2002). However, the PEI is not a static set of principles; it is continually being investigated, criticized, and improved on. This study seeks to build on the PEI by empirically investigating the principle of responsivity.
The responsivity principle is based on the idea that “one size does not fit all.” The notion of “matching” offenders to facilitators and features of correctional treatment is not new. Work on personality typologies (Jesness, 1988; Megargee & Bohn, 1977; Quay, 1983; Warren, 1969) and Palmer’s long-standing support of individualized treatment (Palmer, 1992, 2002) remind correctional researchers that responsivity has been an important feature of successful rehabilitation for quite some time.
There are two types of responsivity: general responsivity and specific responsivity (Andrews & Bonta, 2007). Matching facilitator and program characteristics to a general offender population is called general responsivity. For example, one element of general responsivity says that the way facilitators relate to offenders during the program makes a difference in how well the program works. Facilitators who are warm, sensitive, and “fair but firm” are generally more effective with offender groups than facilitators who are authoritarian and unapproachable (Andrews & Kiessling, 1980). Matching the treatment modality to the offender population is another element of general responsivity. Cognitive-behavioral therapy is considered an optimal treatment modality for general correctional populations as well as across a variety of offender populations such as substance abusers (Auerbach & Castellano, 1998; Parks & Marlatt, 1999; Pearson & Lipton, 1999; Robinson, 1995; Taxman, 1999), sex offenders (Aos, Phipps, Barnoski, & Lieb, 2001; Hall, 1995; MacKenzie, 2006; Marques, Day, Nelson, & West, 1994; Polizzi, MacKenzie, & Hickman, 1999), violent offenders (Dowden & Andrews, 2000), women offenders (Andrews & Dowden, 1999), and institutional populations (Baro, 1999; Henning & Freuh, 1996). Meta-analyses show that cognitive behavioral therapy (CBT) programs reduce recidivism as much as 50% (Landenberger & Lipsey, 2005; Lipsey, Chapman, & Landenberger, 2001; Lipsey, Landenberger, & Wilson, 2007), but more typically in the range of 8% to 26% (Aos, Miller, & Drake, 2006; Aos et al., 2001; Lipsey, 2009; Lipsey et al., 2007; Pearson et al., 2002; Wilson, Bouffard, & MacKenzie, 2005).
Specific responsivity recommends that treatment is more successful when the modes and styles of treatment programs are matched to client and facilitator characteristics (Andrews & Bonta, 2007; Gendreau, 1996; Kennedy, 2000). Specific responsivity factors that researchers suggest may be important to correctional treatment are gender (Bloom, Owen, & Covington, 2003; Covington, 1998; Hubbard & Matthews, 2008; Spiropoulos, Spruance, Van Voorhis, & Schmitt, 2005), motivation (Miller & Rollnick, 2002), personality type (Listwan, Sperber, Spruance, & Van Voorhis, 2004; Listwan, Van Voorhis, & Ritchey, 2007), and race (Andrews & Bonta, 2007; Andrews, Bonta, et al., 1990; Van Voorhis et al., 2002). Furthermore, some researchers have found that the accumulation of individual responsivity factors may correspondingly decrease the success of treatment (Hubbard & Pealer, 2009). Across the board, more empirical research is not only needed to further empirically support these potential specific responsivity factors, but to develop techniques and approaches that are more attuned to these clients. The current study seeks to inform the specific responsivity principle by testing whether moderators of treatment outcomes correspond to the races of clients.
Method
The current study’s data were taken from the Georgia Cognitive Skills Experiment (GCSE), a large-scale program evaluation of the Reasoning & Rehabilitation program conducted from July 1998 to April 2002. A total of 25 parole sites across the state of Georgia admitted into the study all male parolees who fit the eligibility and screening criteria. Eligible male parolees had to have at least 16 months remaining in their parole term to allow for 4 months to complete the program and 12 months to track on parole. The parolees were then screened according to the admission criteria of the Reasoning & Rehabilitation program. The program was designed for offenders who (a) were at high risk to re-offend, (b) had IQ scores of at least 80, (c) had no histories of sexual offending, and (d) did not have substance abuse problems that were so severe as to interfere with program participation.
The Georgia Board of Pardons and Paroles’ (GBPP) staff identified 966 eligible parolees for the study. The GBPP evaluation unit randomly assigned the 966 parolees to the experimental or the control group. The sample was further reduced for the current study. Twenty-six parolees were removed from the sample because their race was unknown or they were not African American or White (two offenders were Hispanic and one offender was Native American). The current study’s sample size was 937 parolees, 459 were in the experimental group and 478 were in the control group; 658 were African American and 279 were White. All parolees were male.
Data Collection
The GCSE provided a variety demographic, personality, and intelligence measures; a program condition measure (experimental and control groups); and a long-term recidivism measure (returns to prison). Much of the demographic data were self-reported when the parolees were admitted to prison (and later verified by the prison intake officer). Most of the personality and intelligence assessment data were obtained on the parolees’ first day of the correctional program. The assessment data were mostly collected through pencil-and-paper evaluations. The outcome data, recidivism (return to prison), were collected at the end of the study. Returns to prison were obtained by GBPP personnel reviews of the parolees’ FLOID (Field Log of Interaction Data) record and follow-up forms completed by the parolees’ parole supervisors or the program coordinators at GBPP.
The Reasoning and Rehabilitation program
The Reasoning & Rehabilitation program was created by Robert Ross and Elizabeth Fabiano (1985) and Ross, Fabiano, and Ross (1989). Grounded in the cognitive-behavioral tradition, it was designed to modify illogical, impulsive, and egocentric thinking and to improve cognitive skills (e.g., problems solving) to lessen criminal behavior. The program consists of 35 lessons that cover seven component areas: (a) problem solving, (b) creative thinking, (c) social skills, (d) management of emotions, (e) negotiation skills, (f) values enhancement, and (g) critical thinking. Each component was further broken down into sub-skills. The classes provided the opportunity for facilitators to model new skills, participants to role-play new skills, and facilitators to give feedback of their performance of the skills. Homework assignments, class discussions, and small group discussions were also integrated into the program. Many program evaluations show that the Reasoning & Rehabilitation program is successful with offenders (Porporino, Fabiano, & Robinson, 1991; Raynor & Vanstone, 1996; Robinson, 1995; Ross & Fabiano, 1985; Ross, Fabiano, & Ewles, 1988; Tong & Farrington, 2006).
Measures
All variables were examined as binomial and multinomial terms to simplify the analyses and ease the interpretation of examined interactions. 3
Age
The ages of parolees were collected on the first day of program participation. Age was collected as ratio-level variables. Bivariate analysis, however, showed that age was not linearly related to recidivism (Van Voorhis et al., 2002). 4 Therefore, age was collapsed into a series of multinomial terms that best fitted its relationship to recidivism. The dummy variables for the age measure were as follows: “age 20” represented parolees aged 18 to 22 years old, “age 25” represented parolees aged 23 to 27 years old, “age 30” represented parolees aged 28 to 32 years old, “age 35” represented aged 33 to 37, and “age 38+” represented parolees aged 38 or more years old. No data were missing for this measure.
Socioeconomic status
Socioeconomic status was assessed by prison intake counselors who selected one of four SES categories: “welfare,” “occasionally employed,” “minimum standard,” and “middle class.” 5 Almost 3% (2.7%) of the data were missing. These missing data were replaced by imputing the predicted values derived from conducting a multivariate logistic regression procedure as described by Sijtsma and Van der ark (2003; Van Voorhis et al., 2002). Middle class status was isolated and compared with the remaining lower classes for the current study (1 = middle class, 0 = less than middle class).
Employment
Employment status was represented as a dummy variable that identified the parolees who were employed full-time when they were admitted into prison (1 = employed full-time, 0 = all else). The “all else” category represented parolees who were employed part-time, unemployed, never had a job, and an “other” option. 6 One percent of the data were missing for this measure. These data were replaced by randomly choosing values for the missing data in proportion to the existing data for the measure (Van Voorhis et al., 2002).
Educational attainment and marital status
The education measure isolated parolees who completed high school, obtained a GED, or attended/completed college or graduate school and compared them with lower educational attainment (1 = high school/GED or more, 0 = less than high school/GED). Less than 1% (0.4%) of the educational data were missing. These missing data were replaced by imputing values for the measure in proportion to the existing data for the measure (Van Voorhis et al., 2002). The marital status measure isolated married parolees from all other marital status categories (1 = married, 0 = not married).
Intelligence and reading levels
The Culture Fair Intelligence Test assessed the intellectual abilities of the parolees (Cattell & Cattell, 1973). The Culture Fair is a short pencil and paper intelligence test that assesses intelligence independent of the respondents’ reading ability and cultural referents. Its scoring system is similar to traditional IQ assessment instrument. The Culture Fair intelligence scores were dichotomized at a cut point of 85 (1 = IQ < 85 level, 0 = ≥ 85). 7 The Wide-Range Achievement Test (WRAT; Reid, 1986; Reynolds, 1986) assessed the parolees’ reading abilities. The test provided a numerical score that matched school grades. A cut point of 5.0 (reading level at the beginning of fifth grade) was chosen to correspond to the study’s selection criteria for reading ability (1 = reading below the fifth-grade reading level, 0 = reading at or above the fifth-grade level).
Risk of recidivism
Risk level was constructed using a modified Salient Factor Score (SFS; Hoffman, 1994; see Van Voorhis et al., 2002). Data were not available for three of the original SFS classification items. Juvenile prior convictions and juvenile prior incarcerations were replaced with adult prior convictions and incarcerations and a history of heroin dependence was replaced by a history of alcohol and drug abuse. The modified SFS measure showed (a) construct validity with the subgroup of parolees who had an original SFS score on record (gamma = .71, p < .001) and (b) predictive validity with recidivism (r = −35, p < .001; Van Voorhis et al., 2002). The risk score was dichotomized into high and low risk (1 = high risk, 0 = low risk).
Psychological assessments
The Jesness Inventory (Jesness, 1996) determined the cognitive (or interpersonal) maturity (Sullivan, Grant, & Grant, 1957; Warren, 1983) and personality type (Van Voorhis, 1994) of the parolees. The assessment was administered on the first day of the program as a pencil and paper evaluation and these evaluations were calculated using the computerized Jesness Inventory scoring software (Jesness, 1996). Higher I-Level scores reflected better insight into one’s own world view and a more complex understanding of the motivations, emotions, and behaviors of themselves and others. Fourteen percent (14.0%) of the Jesness Inventory data were missing due to a lack of responses or invalid responses. These data were replaced by entering the predicted values for the missing data derived from the multivariate logistic regression procedure as described by Sijtsma and Van der ark (2003;Van Voorhis et al., 2002). The I-level measure was collapsed from three categories to two (1 = I-level 4, 0 = I-level 2 and 3). Parolees scoring I-Levels 2 and 3 were primarily concerned with power and need gratification. Parolees that scored an I-level of 4 demonstrated an internalized value system and standard of behavior (Harris, 1988; Jesness, 1988). The Jesness Inventory also categorizes respondents on nine personality types. The nine personality types were collapsed into four personality types (aggressive, situational, dependent, and anxious) consistent with the work of Van Voorhis (1994). Aggressive offenders tend to be manipulative, negative, hostile, and antisocial. Anxious offenders are insecure and have trouble coping with moments of high anxiety. Dependents follow the influences of others around them. Situationals tend to abide by conventional standards but can become rigid in their adherence to them. These personality types were coded as a multinomial of the four personality-type dummy variables (1 = yes, 0 = no).
Residential urbanization
The degree of residential urbanization was assigned by GBPP according in the district where the parolees were serving their parole. Urbanization was collapsed into two categories that isolated urban from rural and suburban areas (1 = urban, 0 = rural and suburban).
Recidivism
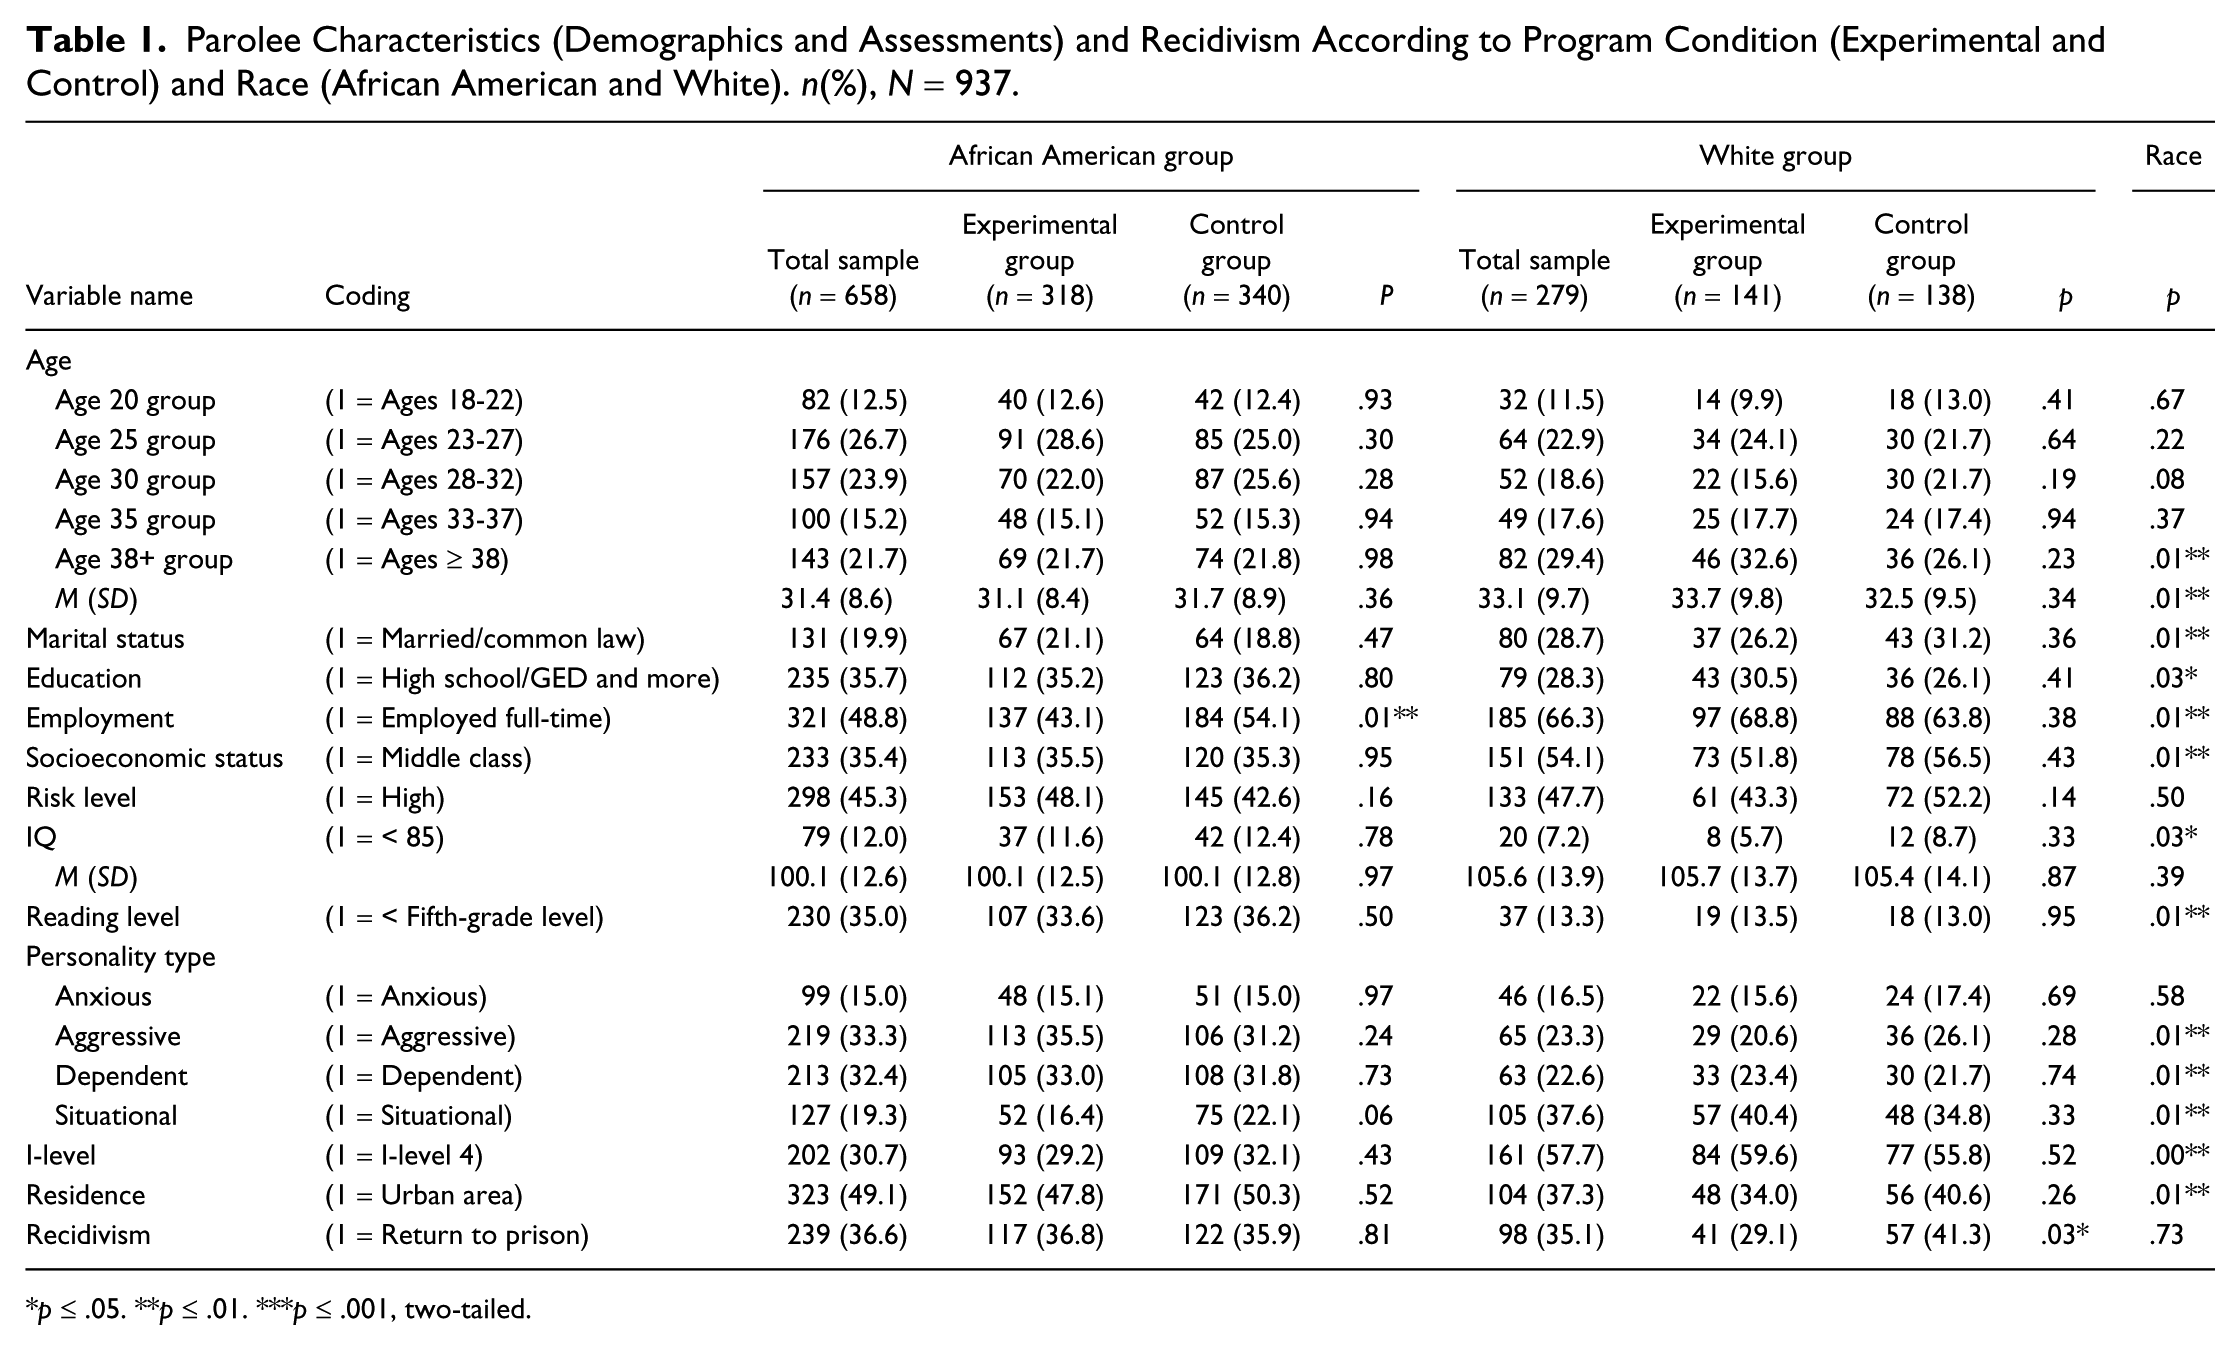
The outcome variable for this study is recidivism, operationalized as readmission to prison. The outcome data were supplied in monthly increments up to 33 months on parole. A series of dummy variables at 3-month intervals indicated whether any at-risk parolees returned to prison (1 = yes, 0 = no). The base recidivism rates of the White and African American groups are provided in Table 1. 8
Parolee Characteristics (Demographics and Assessments) and Recidivism According to Program Condition (Experimental and Control) and Race (African American and White). n(%), N = 937.
p ≤ .05. **p ≤ .01. ***p ≤ .001, two-tailed.
Data Analysis
Discrete-time event history analyses were used to test for significant moderators of the relationship between program condition and recidivism. 9 Event history analysis “right-censors” longitudinal data to control for time “at-risk” (Allison, 1984). Time at risk was captured by introducing a multinomial for time (time1 – time10) and conducting logistic regression analyses on a person-period, or stacked, data set. 10 Time 1, or the time period during the program, was the reference term for time. To conserve space, we did not list the multinomial control terms for time (time2 – time10) in the tables.
To preserve the integrity of the experimental design, experimental to control group comparisons within the African American and White groups were the only statistical comparisons made. The multivariate logistic regression analyses tested whether the race’s program condition to recidivism relationship was influenced by a variety of demographic characteristics and assessments as potential moderators (age, prior employment status, educational attainment, marital status, social class, risk of recidivism, prior violence, IQ, reading level, cognitive maturity, personality, residential urbanization, and race and gender of the supervising parole officer). In all cases, a significant decrement to the chi-square test determined whether the interaction model was a better fit for the data than a main effects model. The interaction models contained the 2 × 2 cross-variable or cross-product (Characteristic1 × Program Condition) interaction terms where, in the cases that the interaction models were a better fit for the data, we turned our attention to specifically testing for experimental to control differences by creating four distinct interaction groups represented by the significant cross-variable interactions (Group 1 [characteristic = 1 program condition = 1], Group 2 [characteristic = 1 program condition = 0], Group 3 [characteristic = 0 program condition = 1], and Group 4 [characteristic = 0 program condition = 0]), and run a series of significance tests between these discrete groups. To conserve space, the results from these additional component interaction significance tests were not given in the tables but were reported in the text and graphed in the figures. No interracial significance testing was conducted so all interracial comparisons were descriptive in nature.
Sample Characteristics
Table 1 lists the sample descriptives for the African American and White parolee groups.
African American group
The average age in the African American group was 31 (M = 31.4 years, SD = 8.6). Most of the group were unmarried (80.1%), without a high school education (64.3%), and made below a middle class standard of living (64.6%). Just under half of the sample (48.8%) reported that they had a full-time job before they were admitted to prison. The African American sample has a normal IQ (M = 101.1, SD = 12.6) but a considerable proportion of the sample did not read above a fifth-grade level (35.0%). Cognitive maturity assessments showed that a third of African American parolees were at I-Level 4 (30.7%). A relatively similar proportion of the African American group were assessed with aggressive (33.3%) and dependent (32.4%) personalities with lower proportions considered to be situational (19.3%) and anxious (15.0%) offenders. Forty-five (45.3%) of the group were considered high risk to recidivate. Many African American parolees lived in urban areas (49.1%) rather than suburban and rural areas (50.9%). The African American group had only one significant experimental to control group difference. More African Americans in the control than the experimental group were employed full-time before they were admitted to prison (χ2 = 8.01, p = .01).
The White group
The White group was, on average, in their early thirties (M = 33.1 years, SD = 9.7), unmarried (71.3%), and with lower educational attainment (only 28.3% had high school diploma/GED or more). A majority of Whites were considered middle class (54.1%) and employed full-time before they were admitted to prison (66.3%). The average IQ for the group was 105.6 (SD = 13.9) and relatively few White parolees read below a fifth-grade level (13.3%). Almost 40% of the White group’s personality characteristics comprised of the situational-type offender (37.6%) and a smaller but relatively even proportion of aggressive (23.3%) and dependent (22.6%) offenders. Similar to the African American group, the anxious offender was the least common personality type in the White group (16.5%). A majority of the White group (57.7%) demonstrated an internal values system (I-Level 4). Many of the White parolee group were considered high risk to recidivate (47.7%). A minority of Whites lived in urban (37.3%) versus suburban and rural (62.7%) areas. As shown in Table 1, the White experimental and control groups did not significantly differ on any offender characteristics or assessments. 11 The last column in Table 1 shows ways in which the African American and White groups significantly differ on demographic and personality characteristics. We use all of these offender characteristics as controls in the analyses.
Listed at the end of Table 1 are the zero-order relationships between program condition and recidivism for the total sample and then disaggregated racial groups. As first reported by Van Voorhis and colleges (2002) and evident here, the Reasoning & Rehabilitation program significantly reduced recidivism for the White group (χ2 = 4.58, p = .03) but not the African American group.
Results
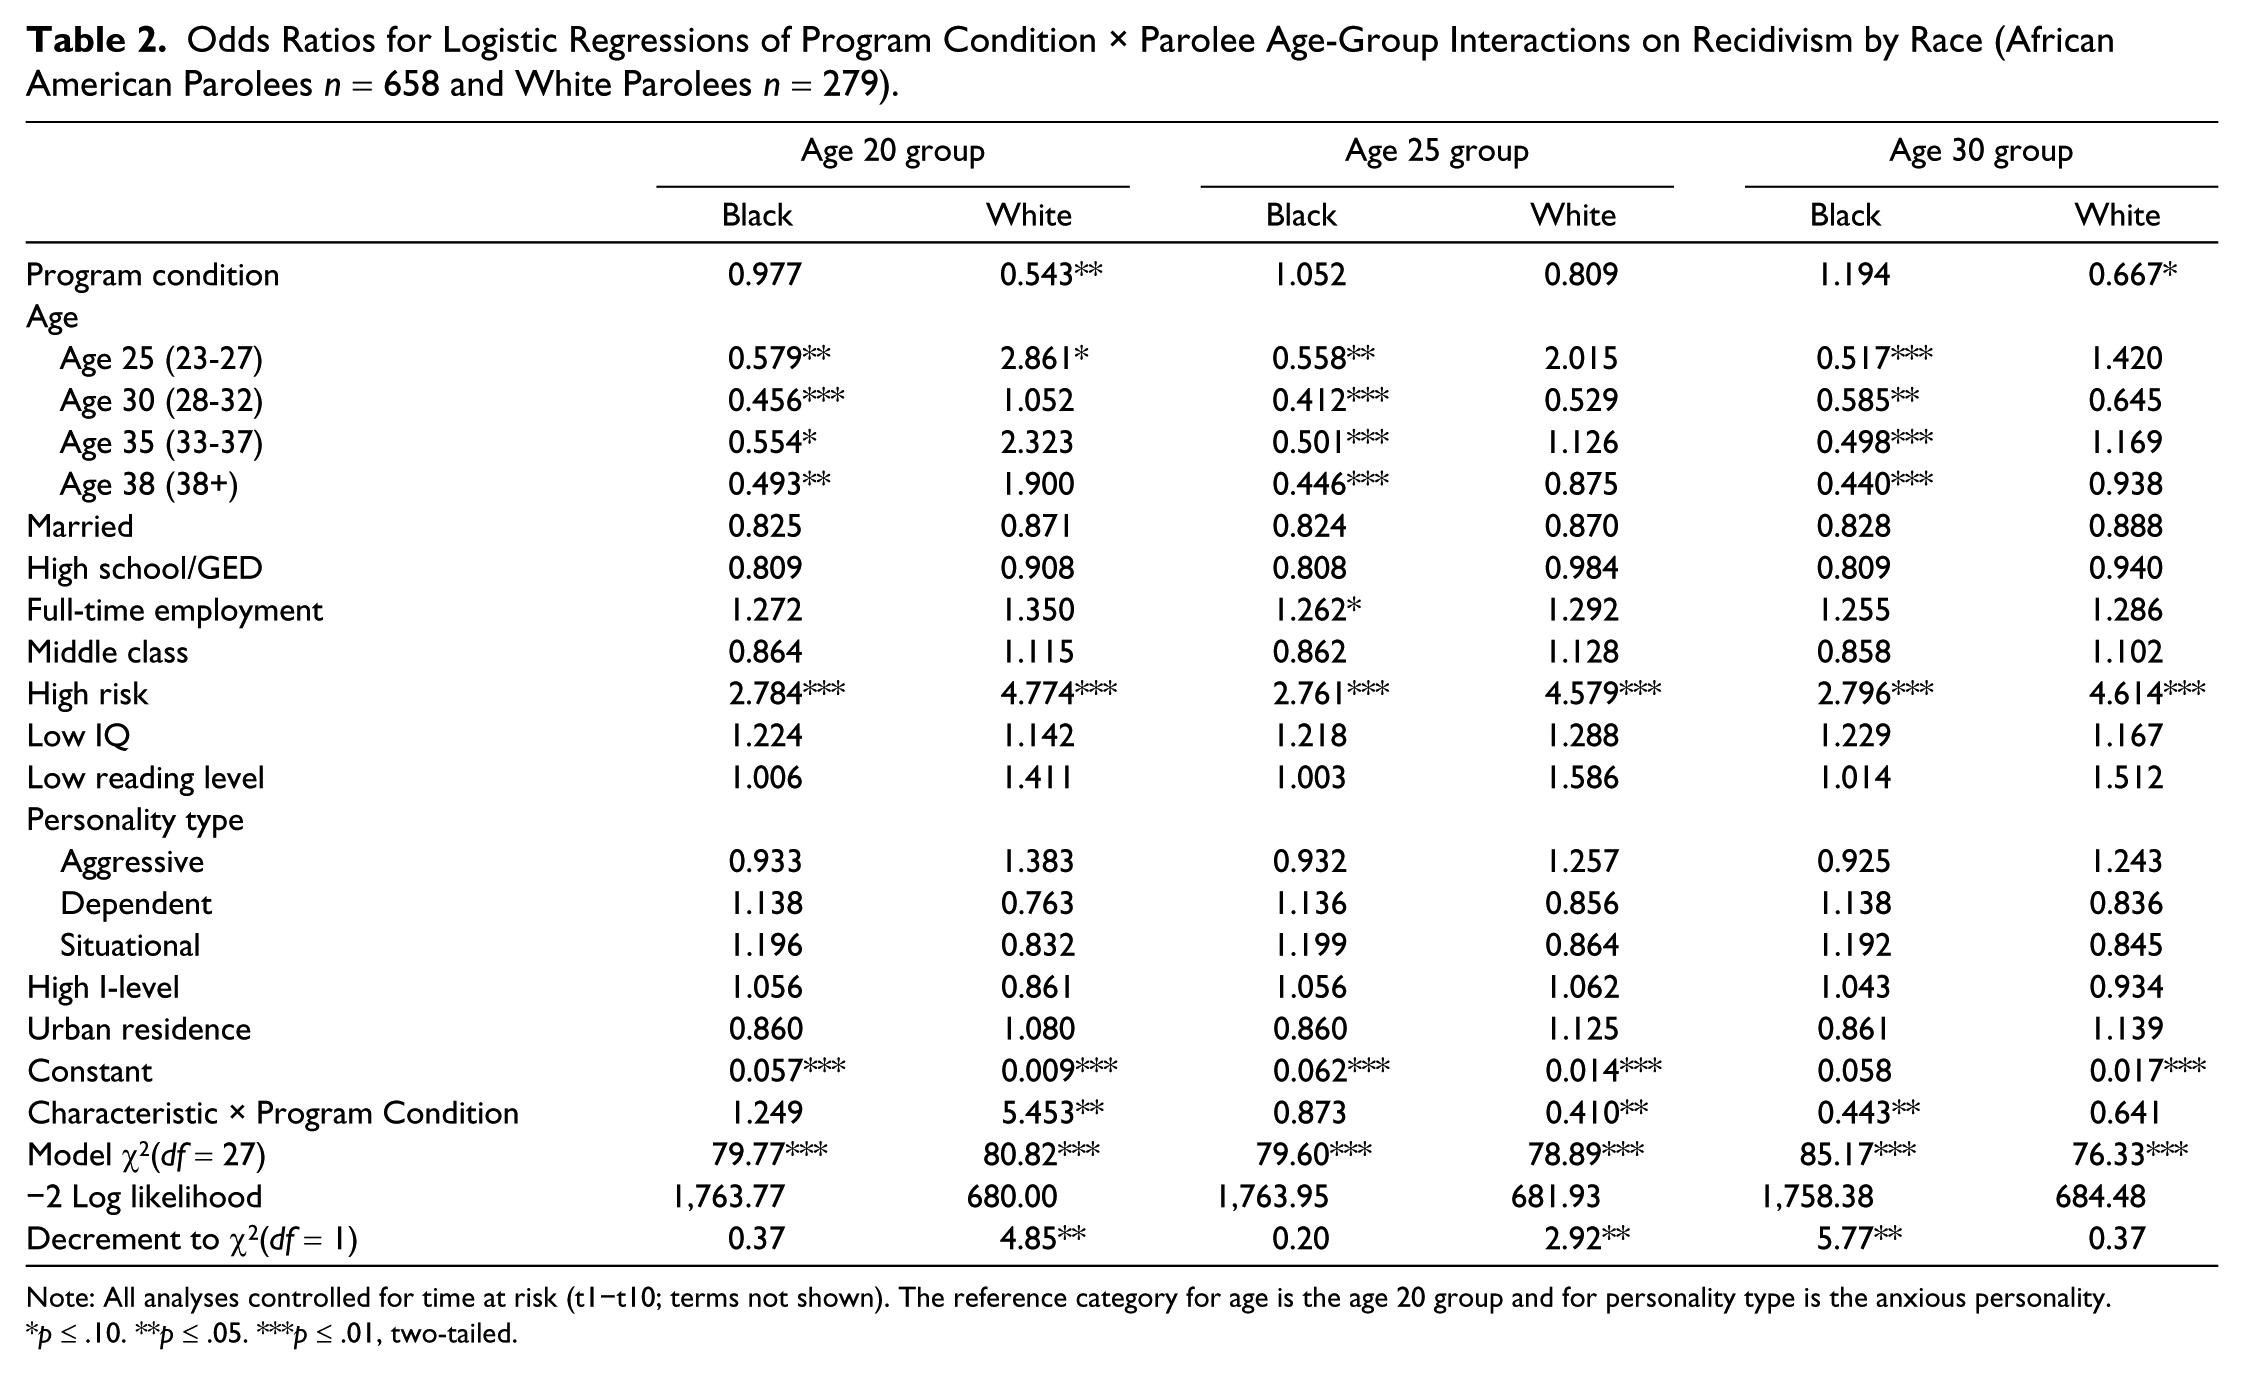
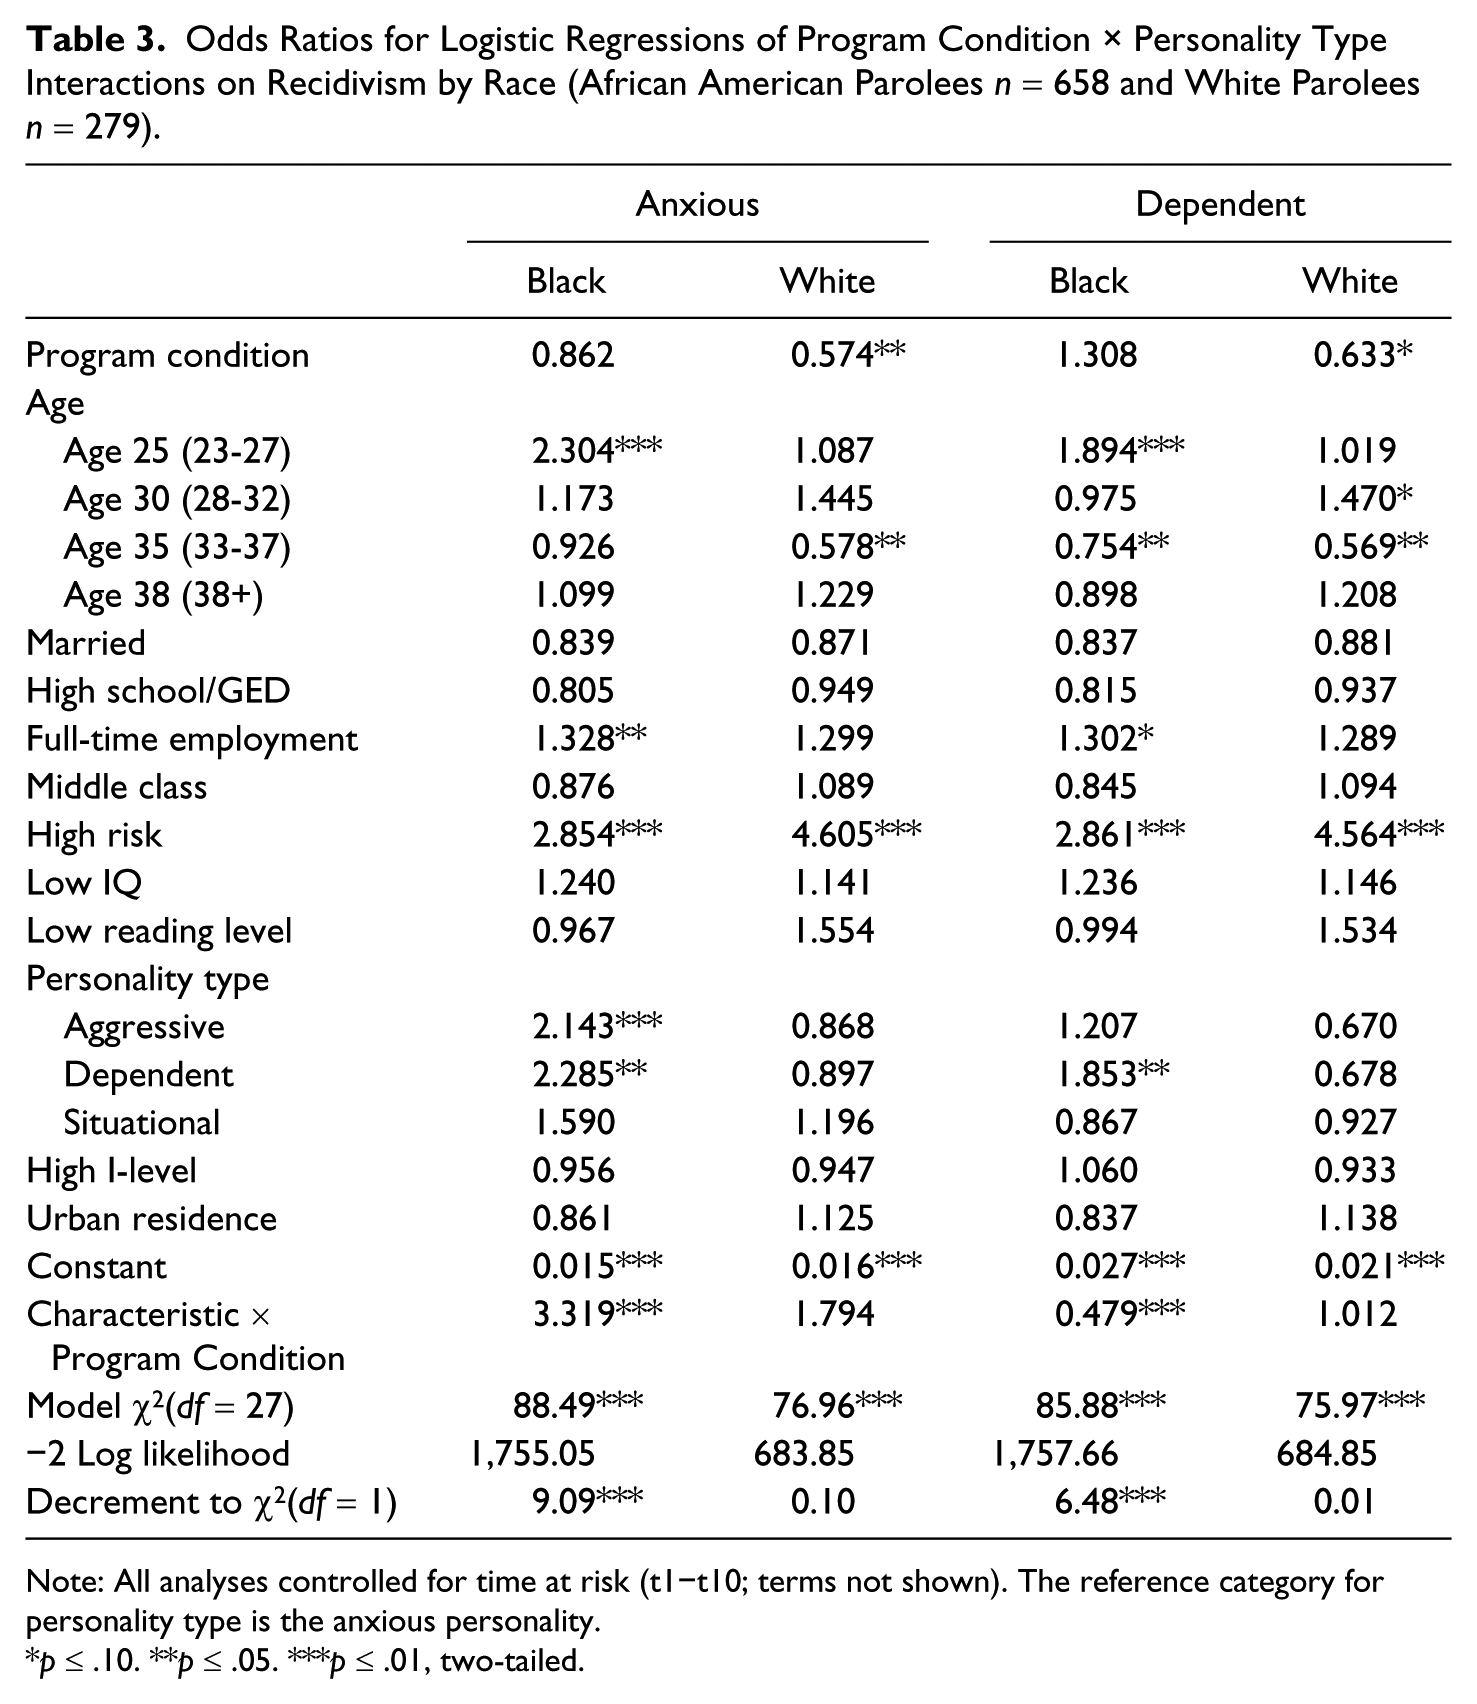
African American and Whites in treatment recidivated at different rates to their respective control groups by age and personality type. 12 Tables 2 and 3 show these significant relationships for age groups 20, 25, and 30, and the anxiety and dependent personality types. 13
Odds Ratios for Logistic Regressions of Program Condition × Parolee Age-Group Interactions on Recidivism by Race (African American Parolees n = 658 and White Parolees n = 279).
Note: All analyses controlled for time at risk (t1−t10; terms not shown). The reference category for age is the age 20 group and for personality type is the anxious personality.
p ≤ .10. **p ≤ .05. ***p ≤ .01, two-tailed.
Odds Ratios for Logistic Regressions of Program Condition × Personality Type Interactions on Recidivism by Race (African American Parolees n = 658 and White Parolees n = 279).
Note: All analyses controlled for time at risk (t1−t10; terms not shown). The reference category for personality type is the anxious personality.
p ≤ .10. **p ≤ .05. ***p ≤ .01, two-tailed.
Age
Table 2 shows the results of three significant age-group interaction models by race. Two separate interaction models for Whites in the age 20 group (ages 18-22 years) and the age 25 group (ages 23-27 years) had significant decrement to the chi-square tests (χ2 = 4.85, p ≤ .05 and χ2 = 2.92, p ≤ .05, respectively) and significant cross-product interaction terms (β = 5.45, p ≤ .05 and β = .41, p ≤ .05, respectively). The component interaction significance tests between the Whites in the age 20 experimental and control groups and the Whites in the nonage 20 (age 23 and older) experimental and control groups (age 20 experimental, age 20 control, nonage 20 experiment, and nonage 20 control groups) revealed positive treatment effects within the nonage 20 group (β = 1.73, p ≤ .05). 14 Figure 1 shows this significant reduction in recidivism as failure curves up to 33 months on parole. Without the treatment program, approximately 43% (43.6%) of Whites aged 23 or more recidivated after the follow-up period. When Whites aged 23 or more participated in the program, the group’s recidivism level reduced to 28.6%, which translates into a 34.4% reduction in recidivism. 15
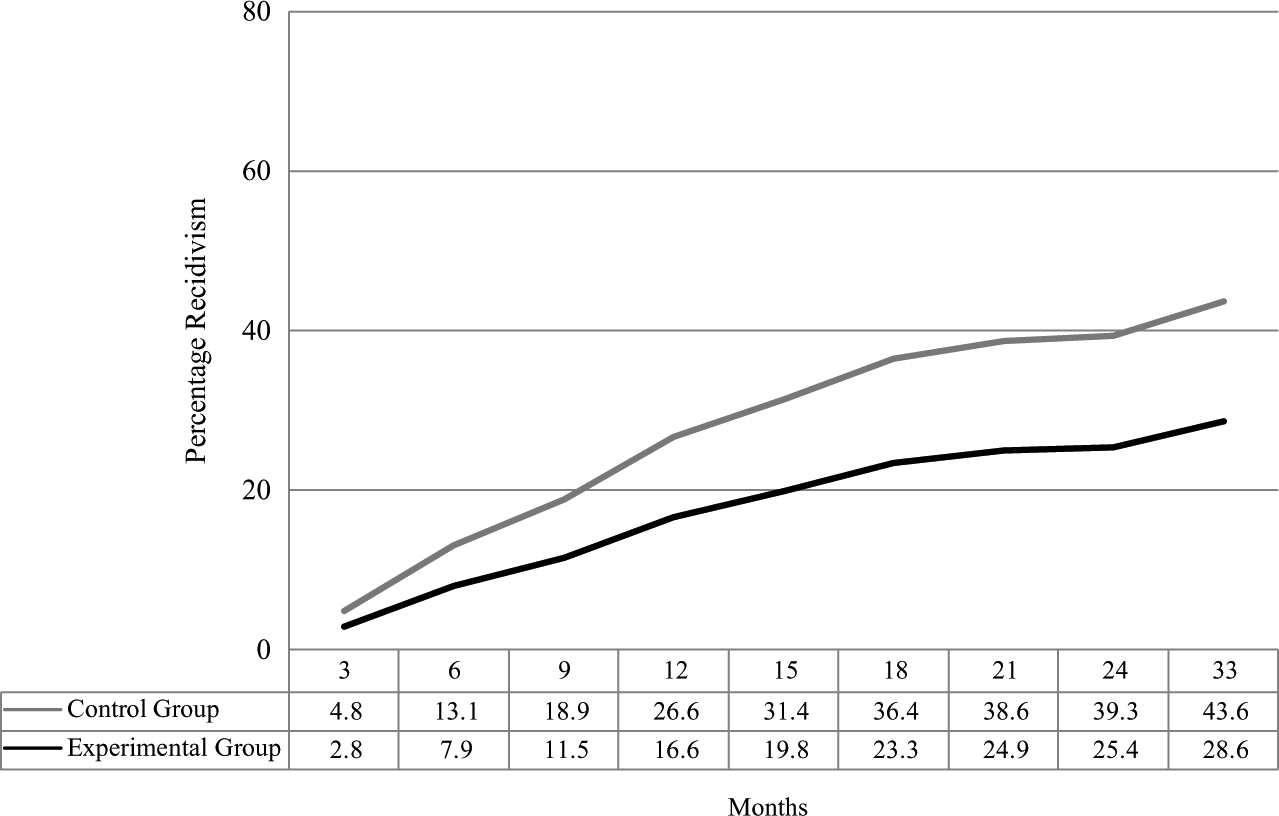
Failure curves for Whites aged 23 years and more in the experimental and control groups (n = 279, p ≤ .05).
Specific component interaction tests with the White 25 groups were particularly positive (β = .41, p ≤ .05). Figure 2 shows these failure curves. Without correctional intervention, almost 60% (57.0%) of Whites aged 23 to 27 years recidivated after 33 months on parole. Treatment participation reduced the recidivism rate by 47.2% from 57.0% to 30.1%.

Failure curves for Whites aged 23 to 27 years in the experimental and control groups (n = 279, p ≤ .05).
While the cognitive-behavior program, overall, did not reduce recidivism for African Americans, the program was successful for parolees in the age 30 group. Table 3 shows its significant model decrement to the chi-square test (χ2 = 5.77, p ≤ .05) and cross-product interaction term (β = .44, p ≤ .05). Component interaction significance tests revealed that the age 30 experimental group had a significantly lower recidivism level compared with the age 30 control group (β = 0.54, p ≤ .05). Figure 3 presents this treatment effect. Without treatment, 40.8% of African Americans aged 28 to 32 years recidivated up to 33 months on parole. With treatment, the recidivism level dropped to 25.0%. Correctional treatment provided a 38.7% reduction in recidivism for African Americans aged 28 to 32 years.
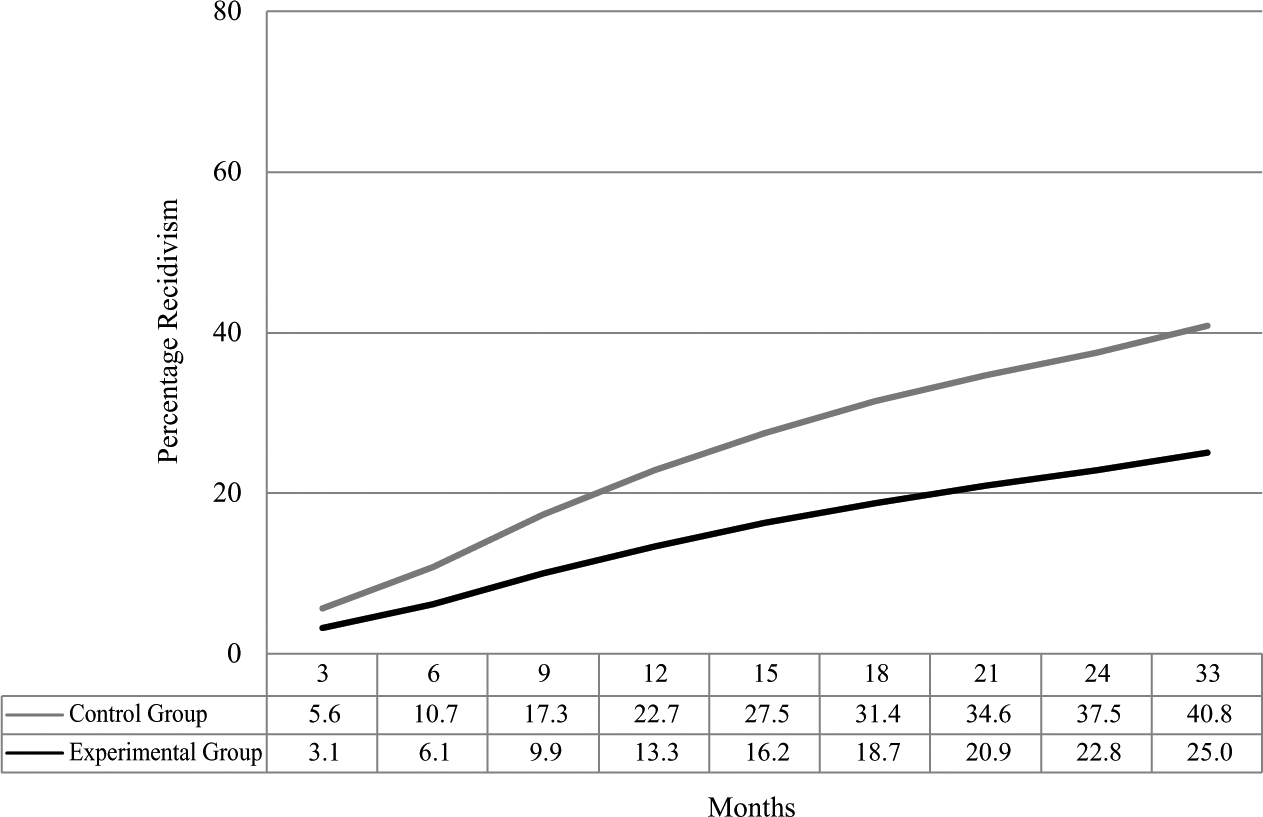
Failure curves for African Americans aged 28 to 32 years in the experimental and control groups (n = 658, p ≤ .05).
Personality
Table 3 shows the personality type−program condition interaction analyses. The African Americans anxious and dependent personality models produced significant decrement to the chi-square tests (χ2 = 9.09, p ≤ .01 and χ2 = 6.48, p ≤ .01, respectively) and cross-product interaction terms (β = 3.32, p ≤ .01 and β = .48, p ≤ .01, respectively). The White group had no significant personality-type interaction with treatment.
Component interaction tests between the anxious African American experimental and control groups showed that anxious African Americans had a significantly higher rate of recidivism than the anxious African American controls (β = 2.50, p ≤ .01). Figure 4 shows the harmful effect of treatment for the anxious African American group. Without correctional intervention, anxious African Americans had a relatively low level of recidivism (23.8%). But when they were put into cognitive-behavioral treatment, recidivism rates more than doubled (103.8%) to 48.5%.
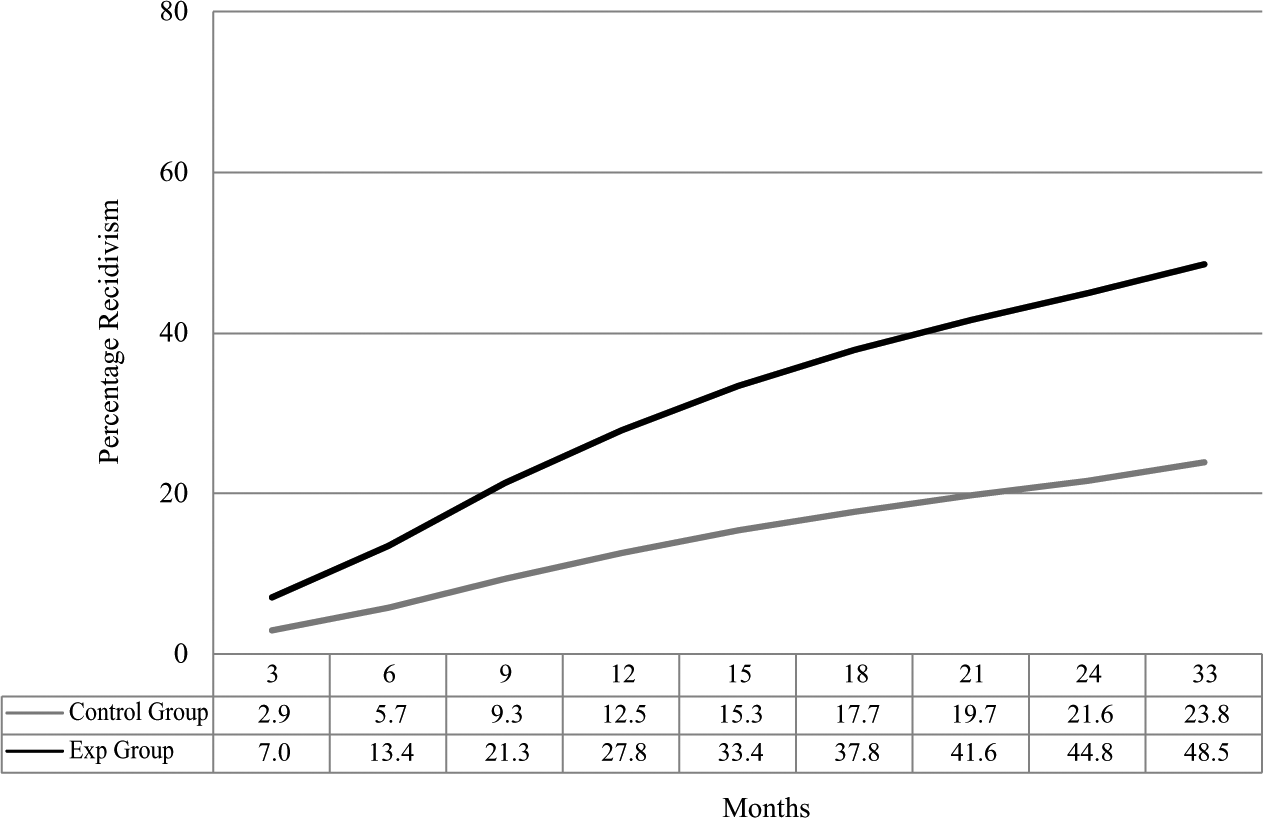
Failure curves for African Americans with anxious personalities in the experimental and control groups (n = 658, p ≤ .01).
In contrast to the harmful effects of anxiety, African Americans with dependent personalities responded well to treatment. Figure 5 shows the results of component interaction significance tests to reveal that the treatment program provided modest effectiveness for African Americans with dependent personalities (β = .67, p ≤ .10). When dependent African Americans participated in treatment, the recidivism level for the group was 35.2% after 33 months on parole. But without correctional intervention, almost half (47.6%) of the dependent African American group recidivated. Treatment showed a 26.1% reduction in recidivism for African Americans with dependent personalities.
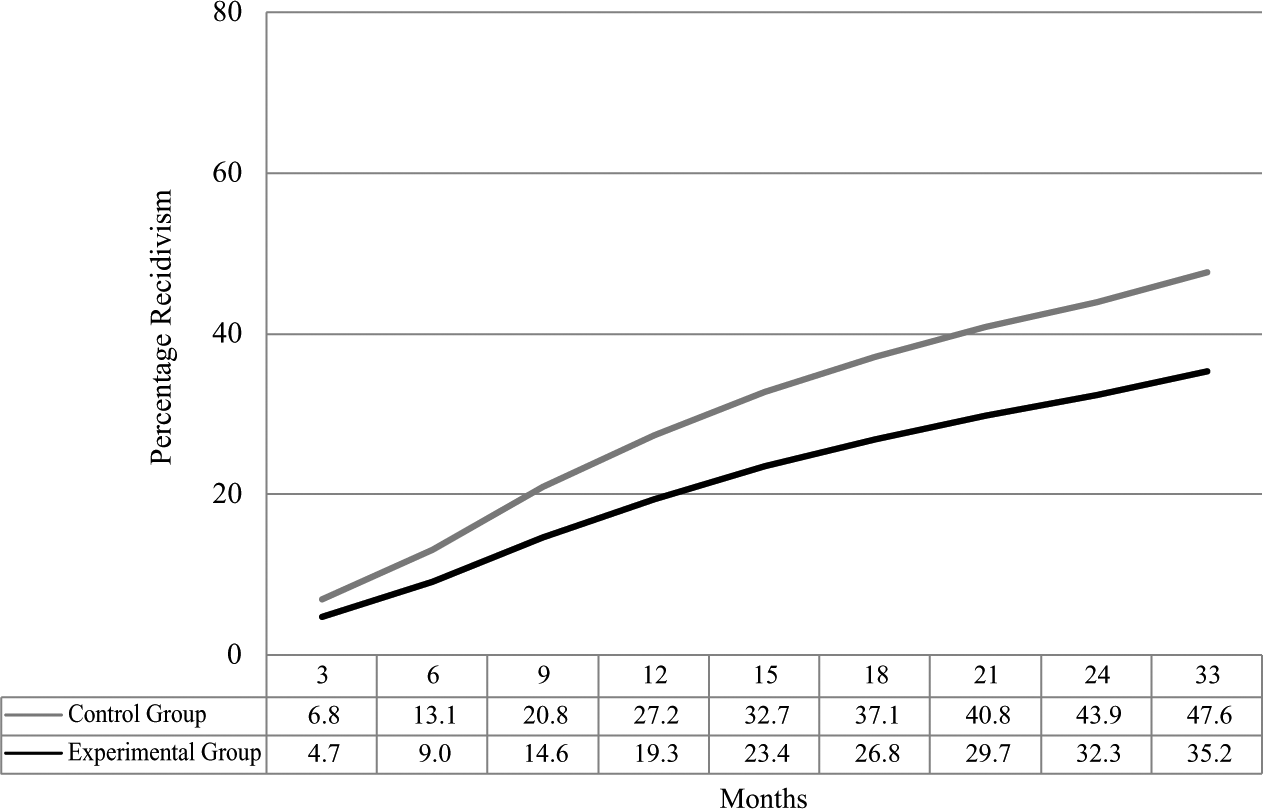
Failure curves for African Americans with dependent personalities in the experimental and control groups (n = 658, p ≤ .10).
Discussion
The theory and practice of effective correctional treatment has advanced a great deal in the past three decades in spite of, at times, unfair techniques used to discredit it (see Gottfredson, 1979; Cullen & Gilbert, 1982). Still, the “best practices” in correctional treatment remain a dynamic concept as researchers continually push for improvements to effective treatment. The responsivity principle is one of the central features of the PEI that needs more attention. Van Voorhis (1987) and Palmer (1975) warn correctional researchers and practitioners that ignoring responsivity in program evaluations typically hides treatment effects for some offender populations. To shed more light on the responsivity principle as it relates to race, this work identified treatment moderators by racial group.
The data used for this study were taken from a large-scale program evaluation study that found that the Reasoning & Rehabilitation program reduced recidivism for Whites but not African Americans (Van Voorhis et al., 2002). This study sought to identify moderators that helped to explain why African Americans and Whites reacted differently to the same treatment program. To this end, the current study asked “given that African Americans did not respond to correctional treatment whereas Whites did, did offender demographics and assessments have any bearing on the disparate outcomes?” To answer this question, we conducted racially separated event history analyses that tested the moderating effects of a variety of demographic and assessment characteristics on correctional success. We used an experimental design to make intraracial statistical comparisons between the experimental and control groups. The tested treatment moderators included age, prior employment status, educational attainment, marital status, social class, risk of recidivism, prior violence, IQ, reading level, cognitive maturity, personality type, and residential urbanization.
This study found that the parolee age and personality type moderated the success of cognitive-behavior treatment, and it did so differently by race. Specifically, Whites over age 22, particularly Whites aged 23 to 27 years, benefited from treatment whereas treatment only helped African Americans in the 27-32 age group. The personality type of parolees moderated treatment for only the African American group. Anxious African Americans had a higher rate of recidivism after treatment whereas African Americans with dependent personalities had a lower recidivism after treatment.
The work of Farrington (1986), Sampson and Laub (1993), and Moffitt (1993) argued that criminal behavioral is best understood as a developmental process such as the product of age-graded changes across the life course. This study supports that body of work in terms of the responsiveness that these parolees showed toward treatment by age group. The beneficial effects of treatment were most notable for Whites between ages 23 to 27 years, who are also in the process of aging out of crime (Farrington, 1986). Treatment potentially accentuated this naturally occurring aging out process. African Americans were also responsive to treatment, but in an older age group (ages 28-32). It is theoretically unclear why African Americans benefited from treatment in an older age group than Whites.
Personality types are argued to make a difference in treatment (Andrews & Bonta, 2007; Van Voorhis, 1994). This study found that, as moderating characteristics, they only mattered for African Americans. First, anxiety increased recidivism for African American participants of treatment. Recidivism was almost twice as high for anxious African Americans participants in treatment. Several reasons can explain this outcome. Anxious offenders are generally insecure about themselves and their interactions with others, which can manifest in cynical and hostile behavior (Van Voorhis, 1994). Extant research is beginning to show that anxiety adversely influences offenders in a variety of correctional contexts (Kubak & Salekin, 2010; Listwan et al., 2004). Furthermore, cognitive-behavioral programs such as the Reasoning & Rehabilitation program are based on social learning theory. Social learning is an active and participatory method of treatment that asks for client to participate, role-play, and have direct interactions with other of real-life situations. These programs require calling attention to oneself and trying on new skills in front of an “audience.” African Americans, particularly those who feel culturally isolated from generic correctional programs and anxious to begin with, may find it much more difficult to fulfill the demands of treatment. In this way, the participatory nature of the program and the generalization training may suffer. In addition, the cognitive-behavioral curricula are widely touted as programs that may be facilitated by nonclinical personnel. But the task of accommodating highly anxious, African American offenders may surpass the skill sets of lay facilitators. Indeed, the skills needed to build client trust across race in a group setting, formulate therapeutic relationships, and deal with anxiety are not the primary focus of current curricula for training correctional staff. Training for therapeutic relationships in cultural contexts is even rarer (Shearer & King, 2004).
African Americans with dependent personalities were considerably helped by correctional treatment. Dependent personalities are followers of others, whether it is to positive or negative models (Van Voorhis, 1994). They can sometimes have some cognitive dysfunction, but work best in highly structured environments. The beneficial effects of the Reasoning & Rehabilitation program with African American dependents may be found in the nature of the cognitive-behavioral treatment itself. These intensive and highly structured programs, particularly in the case of the Reasoning & Rehabilitation program, rely on clients providing “real world” solutions to commonly encountered problems with prosocial living. Directed instruction into ever-closer steps of success may promote self-efficacy with this population. Therefore, despite the racial issues relevant to many African Americans in correctional treatment, the dependent personality may best respond to intensive structure and instruction.
Important to any study is to qualify it in terms of its methodological limitations. First, racial comparisons of treatment-moderating characteristics were done descriptively rather than statistically in this work. Therefore, we are unable to say that African Americans and Whites have statistically different treatment moderators. Second, many of the predictor measures were dummy-coded to simplify the interpretation of the interaction terms. Dichotomizing variables reduced the variation in the measures and likely resulted in some loss of information. Third, our tests could not assess the integrity of the treatment program itself within the context of our experimental design. Fourth, some analyses suffered from statistical power problems. It was more difficult for the White group, with the smaller sample size than the African American group, to achieve statistical significance.
The major implication of this study suggests that more attention needs to be paid to the races of clients in cognitive-behavioral treatment. Overall, there may be different personality attributes and developmental periods where African Americans and Whites are most responsive to cognitive-behavioral treatment.
Footnotes
Declaration of Conflicting Interests
The author(s) declared no potential conflicts of interest with respect to the research, authorship, and/or publication of this article.
Funding
The author(s) received no financial support for the research, authorship, and/or publication of this article.