
Abstract
This study investigates whether crime patterns fluctuate periodically throughout the year using data containing different property crime types in two Canadian cities with differing climates. Using police report data, a series of ordinary least squares (OLS; Vancouver, British Columbia) and negative binomial (Ottawa, Ontario) regressions were employed to examine the corresponding temporal patterns of property crime in Vancouver (2003-2013) and Ottawa (2006-2008). Moreover, both aggregate and disaggregate models were run to examine whether different weather and temporal variables had a distinctive impact on particular offences. Overall, results suggest that cities that experience greater variations in weather throughout the year have more distinct increases of property offences in the summer months and that different climate variables affect certain crime types, thus advocating for disaggregate analysis in the future.
Introduction
The study of seasonal fluctuations in crime patterns dates back to the mid-1800s and continues to be a prominent topic in the criminological literature (see Baron & Bell, 1976; Block, 1983; Cohn & Rotton, 2000; Hipp, Bauer, Curran, & Bollen, 2004; Landau & Fridman, 1993; Linning, 2015; McDowall, Loftin, & Pate, 2012; Quetelet, 1842; Tompson & Bowers, 2015). A better understanding of how the frequency of various crime types change throughout the year can lead to more efficient policy implementations. More specifically, research into this field can assist enforcement personnel in knowing when to implement crime prevention initiatives as well as when to evaluate them (Andresen & Malleson, 2013). Although it is widely accepted that “seasonal fluctuation in crime is an established fact” (Block, 1984, p. 1), debate continues to exist regarding which crime types experience annual changes, when these changes occur, and why (McDowall et al., 2012; Uittenbogaard & Ceccato, 2012).
While much of the earlier literature applied temperature aggression theory to explain annual variations in offending (see Anderson & Anderson, 1984; Baron & Bell, 1976), L. E. Cohen and Felson’s (1979) routine activities theory has become instructive in recent years. The former contends that because higher temperatures act as “psychological causal mechanisms” in persons, increased temperatures lead to greater aggression increasing crime rates particularly in the summer months (Hipp et al., 2004, p. 1338). Furthermore, research has shown that a relationship exists between aggression and temperature (see Anderson & Anderson, 1984; Baron & Bell, 1976). However, based on the principles of temperature aggression theory, it is only able to account for the increase in violent crime. Research has since found that seasonal peaks exist for other crime types, such as property crime, and that routine activities theory can account for these changes (Hipp et al., 2004). In the context of seasonality, the latter theory suggests that fluctuations in crime rates are the result of changes in peoples’ activities over the course of the year (Cohen & Felson, 1979). For instance, in the summer months, warmer temperatures encourage people to engage in leisure activities outside of the home, leaving their homes unguarded for motivated offenders—this leads to the increased convergence of offenders and targets that leads to more criminal activity (see Andresen & Malleson, 2013). It is important to note that, differing from temperature aggression theory, an increase in crime (both violent and property) is not expected because of increased motivation but because of increases in the number of convergences of (already motivated) offenders and suitable targets. As such, routine activities theory is capable of predicting the seasonal occurrence of many crime types, not just those involving aggressive behavior.
Although the empirical literature on crime seasonality has been giving more attention to property offences, there still exists a great deal of unanswered questions. For instance, in some cases, studies employ an aggregate property crime variable that often combines burglary, mischief, larceny, and/or motor vehicle thefts into one dependent variable (for example, see Hipp et al., 2004). Even though this was appropriate for testing the merits of multiple theories, the next logical step would be to conduct analyses of each of the individual property crime types. These disaggregate analyses are becoming more prominent in the literature (Cohen, Gorr, & Durso, 2003; Yan, 2004) but consist primarily of research conducted in the United States or Europe (Breetzke & Cohn, 2012) and would benefit from further investigation in a Canadian context (for exception, see Andresen & Mallson, 2013). As such, this study seeks to explore the above ideas using property crime data from two major Canadian cities, namely, Vancouver, British Columbia and Ottawa, Ontario, regarding the following research questions:
Based on our research questions and study design, we contribute to the literature in a number of ways. First, though some research has investigated many more cities in the same analysis (Hipp et al., 2004; McDowall et al., 2012), we contribute to the literature comparing multiple locations with different climatic conditions. Second, one of our cities (Vancouver, British Columbia) has a relatively long data series available for analysis (11 years), contributing to studies that analyze seasonal variations in crime over extended time periods. Third, though research has investigated climatic variables (Hipp et al., 2004) and individual crime types (McDowall et al., 2012), we contribute to the literature using both to show the nuances for the effects of climate on individual crime types. Moreover, we include a number of different climate variables not always present in the previous empirical literature on crime seasonality.
The Previous Empirical Literature on Crime Seasonality
Crime peaks, particularly in the summer months, have been frequently exhibited in the literature. However, disagreement continues over which specific crime types experience seasonal fluctuations and when (McDowall et al., 2012; Uittenbogaard & Ceccato, 2012). Research on this topic dates back to the work of Quetelet (1842) who observed that property offences were higher in the winter months, whereas crimes against persons peaked in June. Quetelet (1842) argued that this pattern was likely due to the fact that winter months brought about more difficult conditions, thus evoking criminal activity of necessity (i.e., stealing goods). In the summer months, however, he believed that crimes against persons were precipitated by higher temperatures that lead to increased discomfort and aggression as well as increased “collisions” with other people (Quetelet, 1842, p. 56). During the summer, the former implied that higher temperatures brought on violent behavior due to physical discomfort, whereas the latter involved the principles of environmental criminology, namely, that the more people come into contact with one another, the more likely they are to cross paths with a potential offender and/or victim.
Empirical testing of routine activities theory with respect to crime seasonality has predominantly focused on the patterns of assault (see Block, 1984; Breetzke & Cohn, 2012; Cohn & Rotton, 1997; Harries, Stadler, & Zdorkowski, 1984; Michael & Zumpe, 1983). As discussed above, however, more recent research has begun to emerge regarding various crime types, including property crime (see Cohn & Rotton, 2000; Farrell & Pease, 1994; Hipp et al., 2004; McDowall et al., 2012), and the majority of these articles employ routine activities as the theoretical framework for the research.
Violent Crime
Although much of the research on seasonality has not come to a firm consensus on the temporal trends of various crime types, most of the empirical literature has consistently found statistically significant peaks for assault in the summer months (Cohn, 1990; Harries et al., 1984; Michael & Zumpe, 1983). Due to the violent nature of these offences, researchers often attribute the trends to both heightened aggression levels, due to elevated temperatures, as well as increased engagement in leisure activities outside of the home (Breetzke & Cohn, 2012; Cohn & Rotton, 1997; Uittenbogaard & Ceccato, 2012). In other words, having large groups of frustrated and/or aggressive people congregating in specific places during these times increases the occurrence of offending and subsequent victimization. Moreover, these effects can also be exacerbated when alcohol is a factor in the interaction (Harries et al., 1984).
Research regarding the seasonality of sexual assault is limited, and of the literature that exists, there seems to be no firm consensus on any distinct annual rhythms for the offence. Some studies have found significant peaks for rapes in the summer months (Michael & Zumpe, 1983; Perry & Simpson, 1987). Others, however, have not found statistically significant relationships between rape and higher temperatures (DeFronzo, 1984). These empirical inconsistencies may be present due to the specificity of victim selection preferred by sexual offenders and whether they choose to offend against strangers or acquaintances as well as whether or not they assault the same victims on multiple occasions (Leclerc, Wortley, & Smallbone, 2010; Maguire & Brookman, 2009).
After assault, homicide is arguably the second most studied crime type in the seasonality literature. Unlike assault, however, little agreement exists regarding universal offending patterns (Cohn, 1990). Some research has found distinct summer increases of homicides in Dallas, Texas (Harries et al., 1984); Sao Paulo, Brazil (Ceccato, 2005); and Tshwane, South Africa (Breetzke & Cohn, 2012), whereas other studies in major American cities (McDowall et al., 2012), Canada (Dagum, Huot, & Morry, 1988), and Israel (Landau & Fridman, 1993) were unable to identify concrete statistical evidence for a single seasonal peak. Similar to the conclusions made in the sexual offending literature, researchers have argued that these seasonal inconsistencies could be due to individually motivating factors and that the victims were often known to the offenders (see Landau & Fridman, 1993).
Property Crime
In a test designed to contrast the explanatory capacities of temperature aggression and routine activities theory, Hipp et al. (2004) generated a hypothesis based on temperature aggression theory stating that because seasonal variation is due to higher temperatures that lead to violent behavior, “there [would] not be a seasonal effect for property crime rates” because the offences are not aggressive in nature (Hipp et al., 2004, p. 1338). After applying a latent curve model to their 3 years’ worth of uniform crime report data, they found statistically significant oscillations for both violent and property crimes (Hipp et al., 2004). Such results provided further support for routine activities theory as well as evidence for the existence of crime seasonality for property crimes. Other studies have also found that burglaries tend to peak during the summer months (Chimbos, 1973; Cohn & Rotton, 2000; McDowall et al., 2012). Such temporal patterns have often been attributed to the fact that summertime leisure activities of people remove them from their homes, thus eliminating capable guardianship of their property. This provides ideal target selection for motivated offenders (Chimbos, 1973). Furthermore, one of the most effective crime prevention techniques for burglary is to lock the doors and windows of one’s home, but in the summer months, these are more often left open due to higher temperatures (Hamilton-Smith & Kent, 2009). Such actions provide offenders with easier access to homes. Despite these findings, other research in England has indicated that residential burglary drops to the lowest annual levels in the summer months and is instead at its highest in February and March (Farrell & Pease, 1994). What should be noted, however, is that Farrell and Pease’s (1994) work focused solely on residential burglaries as opposed to a more routinely used aggregate burglary variable. Unfortunately, little work has been done with disaggregated burglary data. As such, less is known as to whether residential burglaries experience the same seasonal trends as commercial burglaries. Contrary to the issue of unlocked doors and windows of houses in the hotter months, many businesses operate consistently throughout the year, thus eliminating a particular prime time to commit such an offence (see also Sherman, Gartin, & Buerger, 1989).
Robbery has also been characterized by an inconsistency in the empirical literature. In their analysis of 3 years’ worth of data for Minneapolis, Minnesota, Cohn and Rotton (2000) found that robberies peaked during the summer months. Conversely, McDowall et al. (2012) found that all crimes except for robbery peaked in the summer months. More specifically, they observed that robberies were highest in December but that there was also a peak in the summer (McDowall et al., 2012). Michael and Zumpe (1983) found that only five of their 16 American locations had statistically significant rhythms for robbery and that they peaked in November-December. Finally, Landau and Fridman (1993) found that in Israel, robberies peaked in the winter months and attributed these findings to monetary motives based on increased unemployment and necessities such as food, clothing, and shelter. Moreover, they explained that the colder weather present in winter months reduced the number of people in the streets (i.e., capable guardians), thus increasing the suitability of targets who were present. They also believed that shortened daylight hours put potential victims at an increased likelihood of victimization (Landau & Fridman, 1993). However, some contradictory results have argued that the winter months provide increased opportunities due to peak shopping times for the Christmas holidays (Andresen & Malleson, 2013). Therefore, robberies may also be largely attributed to “the intensity of activity on the street” (Loukaitou-Sideris, 1999, p. 397).
Of the existing seasonality literature concerning motor vehicle theft, mixed results have been found. Farrell and Pease (1994) found no distinct seasonal trend for motor vehicle theft. Instead, they only observed a drop in calls for service to police in 1988 that they attributed to a “change in recording practices” (p. 492). Likewise, E. G. Cohen et al. (2003, p. 21) discovered a “cancelling-out effect” in their assessment of vehicle thefts. More specifically, the statistically significant predictor variables 1 demonstrated opposing impacts on the dependent variable, thus annulling any annual peaks (Cohen et al., 2003). More recently, McDowall et al. (2012) found distinct seasonal peaks for motor vehicle theft over a 24-year period across 88 American cities. The months that the crime count spiked, however, differed once they controlled for average monthly temperatures. When solely using the raw crime data, offences peaked in August and reached their lowest in February. However, when temperature was accounted for in the model, motor vehicle thefts were highest in December-January and lowest “in the spring and early summer” (McDowall et al., 2012, p. 399). Finally, when exploring trends within each of the 88 American cities, McDowall et al. (2012) found much larger magnitude changes in the percentage difference between peaks and troughs in cities with generally colder climates. In other words, cities that experience large annual temperature changes (e.g., Minneapolis, Minnesota) exhibited more distinct seasonal trends for motor vehicle theft than cities with more consistent ambient temperatures (e.g., Honolulu, Hawaii; McDowall et al., 2012). This provides strong support for the need for additional comparisons of cities with differing annual climates.
The Present Study
Based on the above literature, there is still a need for further research on property crime patterns, particularly when two cities have divergent climates. As such, this study seeks to explore the relationship between property crime and weather using Canadian data from Vancouver, British Columbia and Ottawa, Ontario. Table 1 shows the temperature differences, by season, for Vancouver and Ottawa. 2 Overall, the seasonal differences are statistically significant at the 1% level, but there are variations for the different cities. Ottawa has greater differences while comparing seasons than Vancouver, and consequently, all of the seasonal temperature differences are statistically significant at the 1% level. The temperature differences in Vancouver are statistically significant at the 1% level for all comparisons except for fall and winter, p = .15. Given the proposed research questions and principles guided by routine activities theory, the following hypotheses were generated regarding the temporal aspects of crime seasonality:
Temperature Differences by Season, ANOVA.
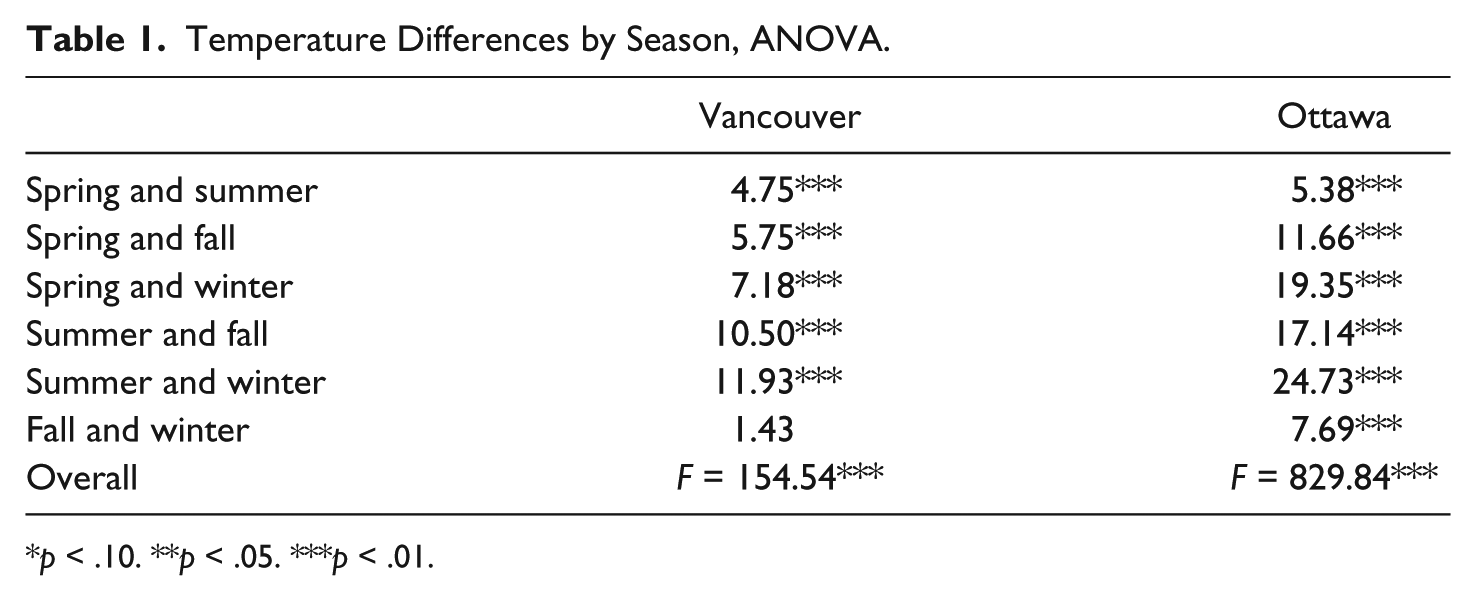
p < .10. **p < .05. ***p < .01.
Method
Characteristics of the Two Cities
Vancouver, British Columbia and Ottawa, Ontario are the third and fourth most populated census metropolitan areas (CMAs), respectively, in Canada, following only Toronto, Ontario and Montreal, Québec. The former is a coastal city located on the Pacific Ocean that is famous for its frequent rainfall in all seasons except the summer and very little snowfall in the winter. Generally, there is very little variability in the overall temperature throughout the calendar year. In fact, based on 29 years’ worth of historical climate data, Environment Canada (2015b) lists average daily temperatures in Vancouver that range between 3.6 °C (38 °F) in December to 18.0 °C (64 °F) in July and August. Average rainfall levels are more drastic and range from 35.6 mm (1.4 inches) in July to 185.8 mm (7.3 inches) in November. Conversely, average snowfall amounts remain relatively low and range from 0 cm in April through October and 15 cm (5.9 inches) in December (Environment Canada, 2015b). Ottawa, Ontario is the capital city of Canada and is located between Toronto, Ontario and Montreal, Québec. The city’s climate is very humid and experiences more drastic changes in temperature throughout the year and less rainfall than Vancouver. Based on historical climate data from 1981 to 2010, Environment Canada lists Ottawa’s average daily temperatures as ranging from −10.3 °C (13 °F) in January to 21.0 °C (70 °F) in July. Extreme temperatures have historically ranged between −36.1 °C (−33 °F) and 37.8 °C (100 °F). Average rainfall amounts range from 18.7 mm (0.7 inches) in February to 92.8 mm (3.7 inches) in June, and average snowfall ranges from 0 cm in May through September and can reach as high as 54 cm (21 inches) in January (Environment Canada, 2015a).
In addition to these differences in regard to weather, there are notable differences between these cities. Ottawa is the federal capital of Canada with a population of 812,000 in 2006 according to the census, an increase in population of 5% from 2001. This population makes Ottawa the fourth largest city in Canada. The CMA of Ottawa had a population of approximately 875,000 the same year, making it the sixth largest CMA in Canada (Dauvergne & Turner, 2010; Gannon, 2006; Statistics Canada, 2007). In 2006, the Ottawa CMA had a crime rate of 5,775 per 100,000 persons, nearly one half of the crime rate in the Vancouver CMA, 10,609 per 100,000 persons (Silver, 2007). In 2006, the City of Vancouver had a population of 578,000 persons, whereas the Vancouver CMA had a population of approximately two million persons. This also corresponds to far greater population density in Vancouver than Ottawa. Because of the longer time frame for data from Vancouver, discussed below, this city experienced substantial events and change during this time. Most notable during the study period were the 2010 Winter Olympic Games and the establishment of a new light rail rapid transit line the previous year. And finally, with regard to crime, research has shown that crime is far more concentrated in Ottawa than in Vancouver (Andresen & Linning, 2012). Needless to say, weather does not represent the only set of differences between Ottawa and Vancouver.
Data
The data for both Vancouver and Ottawa were employed to test the proposed hypotheses. The dependent variables for Vancouver are the natural logarithms of crime rates per 10,000 calculated using police incident data and annual city population data. (We used a linear interpolation between the annual figures to obtain monthly population estimates—natural logarithms ease the interpretation of estimated parameters across crime types because the estimated parameters represent the percentage change in the dependent variable, given a one unit change in the independent variable.) The police incident data were retrieved from the Vancouver Open Data Catalogue website 3 and contained information pertaining to location and month of occurrence on four crime types over an 11-year period (2003-2013), whereas the Vancouver population data were retrieved from BC Stats. 4 The crime classifications include commercial break and enter, mischief, 5 theft from vehicle, and theft of vehicle.
Similarly, dependent variables for the city of Ottawa were taken from police incident data posted on the Ottawa Police Service website. 6 Those data contained information regarding the specific dates and times as well as locations of offences that occurred between 2006 and 2008. Because these data were available for each day, crime rate calculations would prove to be problematic. With the range of the crime counts for these crime types ranging from 0 to 22 (0 to 41 for total crime), a count-based regression model is appropriate, discussed further below. The crime classifications that included data throughout this entire 3-year period include commercial break and enter, residential break and enter, robbery, 7 and stolen vehicle. Records of mischief incidents began consistently being reported in April 2007 until December 2008. As such, the use of mischief will be discussed further when its inclusion could be justified in certain analyses. Finally, it should be noted that these data apply exclusively to the cities of Vancouver and Ottawa, not their CMAs.
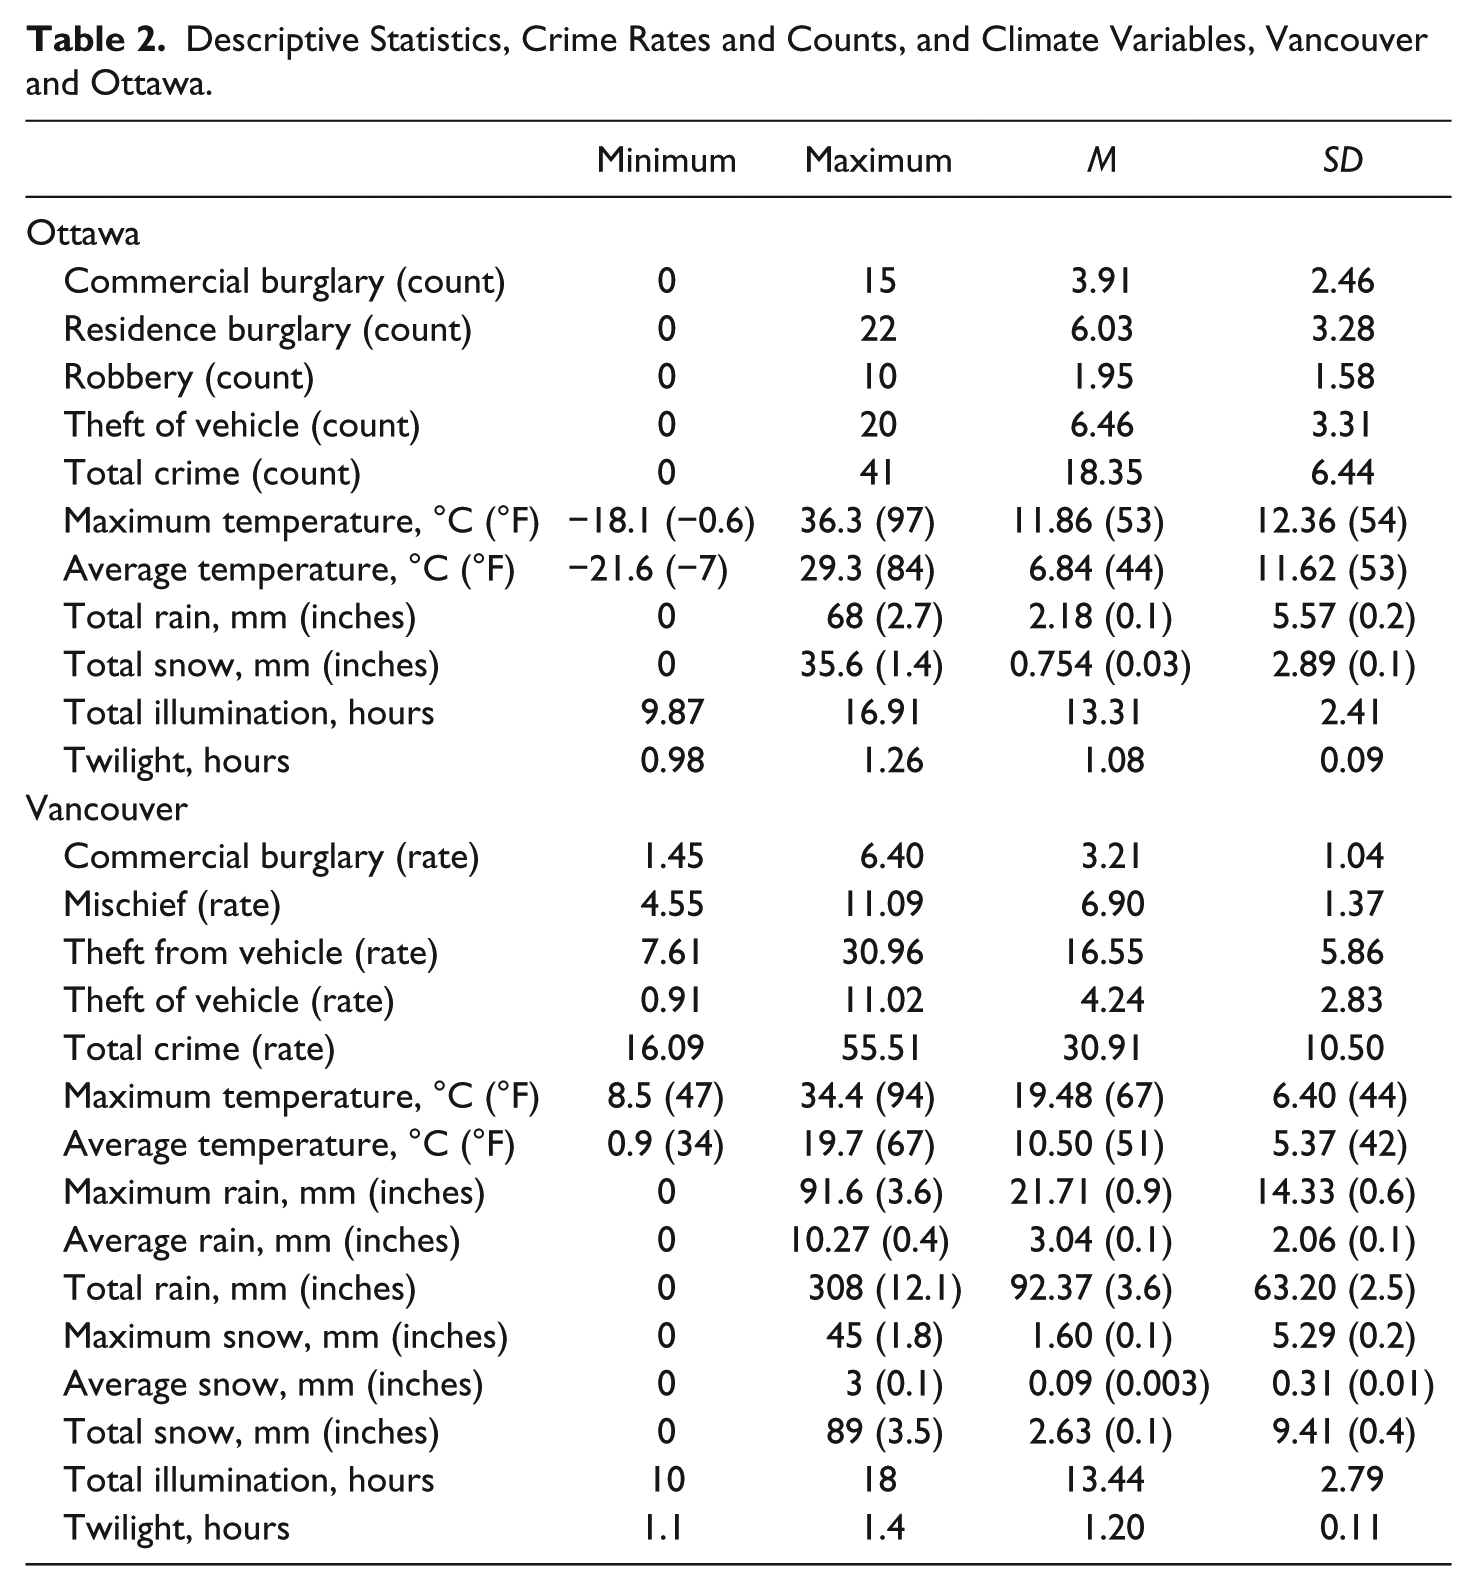
The independent variables concerning climatic conditions were obtained from two sources. All data representing weather variables including temperature, rain, snow, and precipitation were retrieved from the Environment Canada historical climate data webpage. 8 Similarly, all information regarding the times and hours of illumination were obtained from the National Research Council of Canada website. 9 For both cities, we included the average and maximum temperature: average and maximum for the month in Vancouver and for the day in Ottawa. For rain and snow, we included the maximum, average, and total measures for Vancouver because we use monthly data; for Ottawa, we only use total rain and total snow because the data are measured daily. Information regarding the descriptive statistics and frequencies of the independent and dependent variables are available upon request.
Month and month-squared trend variables were included in the analyses to account for the quadratic seasonal trend found in some of the literature, discussed above: Month is expected to have a positive sign, and month-squared is expected to have a negative sign. The month variable was assigned sequential values (1, 2, 3, . . ., 12) for each month, and each crime type and month squared is simply the square of month. Because the Vancouver data were identified only by month, variables for the number of days in the month as well as the number of weekend days in a month were created. We also included a set of dummy variables. Dummy variables were created to control for the annual seasons, and the seasons themselves were defined as the following: winter (January-March), spring (April-June), summer (July-September), and fall (October-December). In the case of Ottawa, however, information regarding the specific day was available, and thus, trend variables for day of the year and day of the entire data set were included. Moreover, dummy variables for major and minor holidays 10 were created because they could be identified in the data set. The dummy variables for the seasons remained the same as those of Vancouver for consistency. The descriptive statistics for the dependent variables and the climate-related independent variables are all shown in Table 2.
Descriptive Statistics, Crime Rates and Counts, and Climate Variables, Vancouver and Ottawa.
Analytical Strategy
To operationalize and test the aforementioned temporal hypotheses, a series of descriptive evaluations, ordinary least squares (OLS) regressions (Vancouver), and negative binomial regressions (Ottawa) were conducted on the Vancouver and Ottawa data using R: The Project for Statistical Computing (http://www.R-project.org). As stated above, the dependent variables for Vancouver are calculated rates making OLS appropriate, and the dependent variables for Ottawa overdispersed counts making negative binomial regression appropriate. Eleven distinct models were run on each of the independent variables (both aggregate and disaggregate) using the Vancouver and Ottawa data. Initial tests checking for OLS assumptions were conducted and revealed that error terms in all models were not independently or identically distributed. In fact, both autocorrelation and heteroscedasticity were present in the data. As such, robust covariance matrix estimators were incorporated into the regression analyses using the vcovHAC function in R—feasible generalized least squares. The use of robust standard errors most often lead to a smaller number of statistically significant variables in all of the models; this shows the importance of correcting for nonspherical errors that can lead to the erroneous inclusion of variables in a model when they are, in fact, statistically insignificant.
Results
Descriptive Patterns
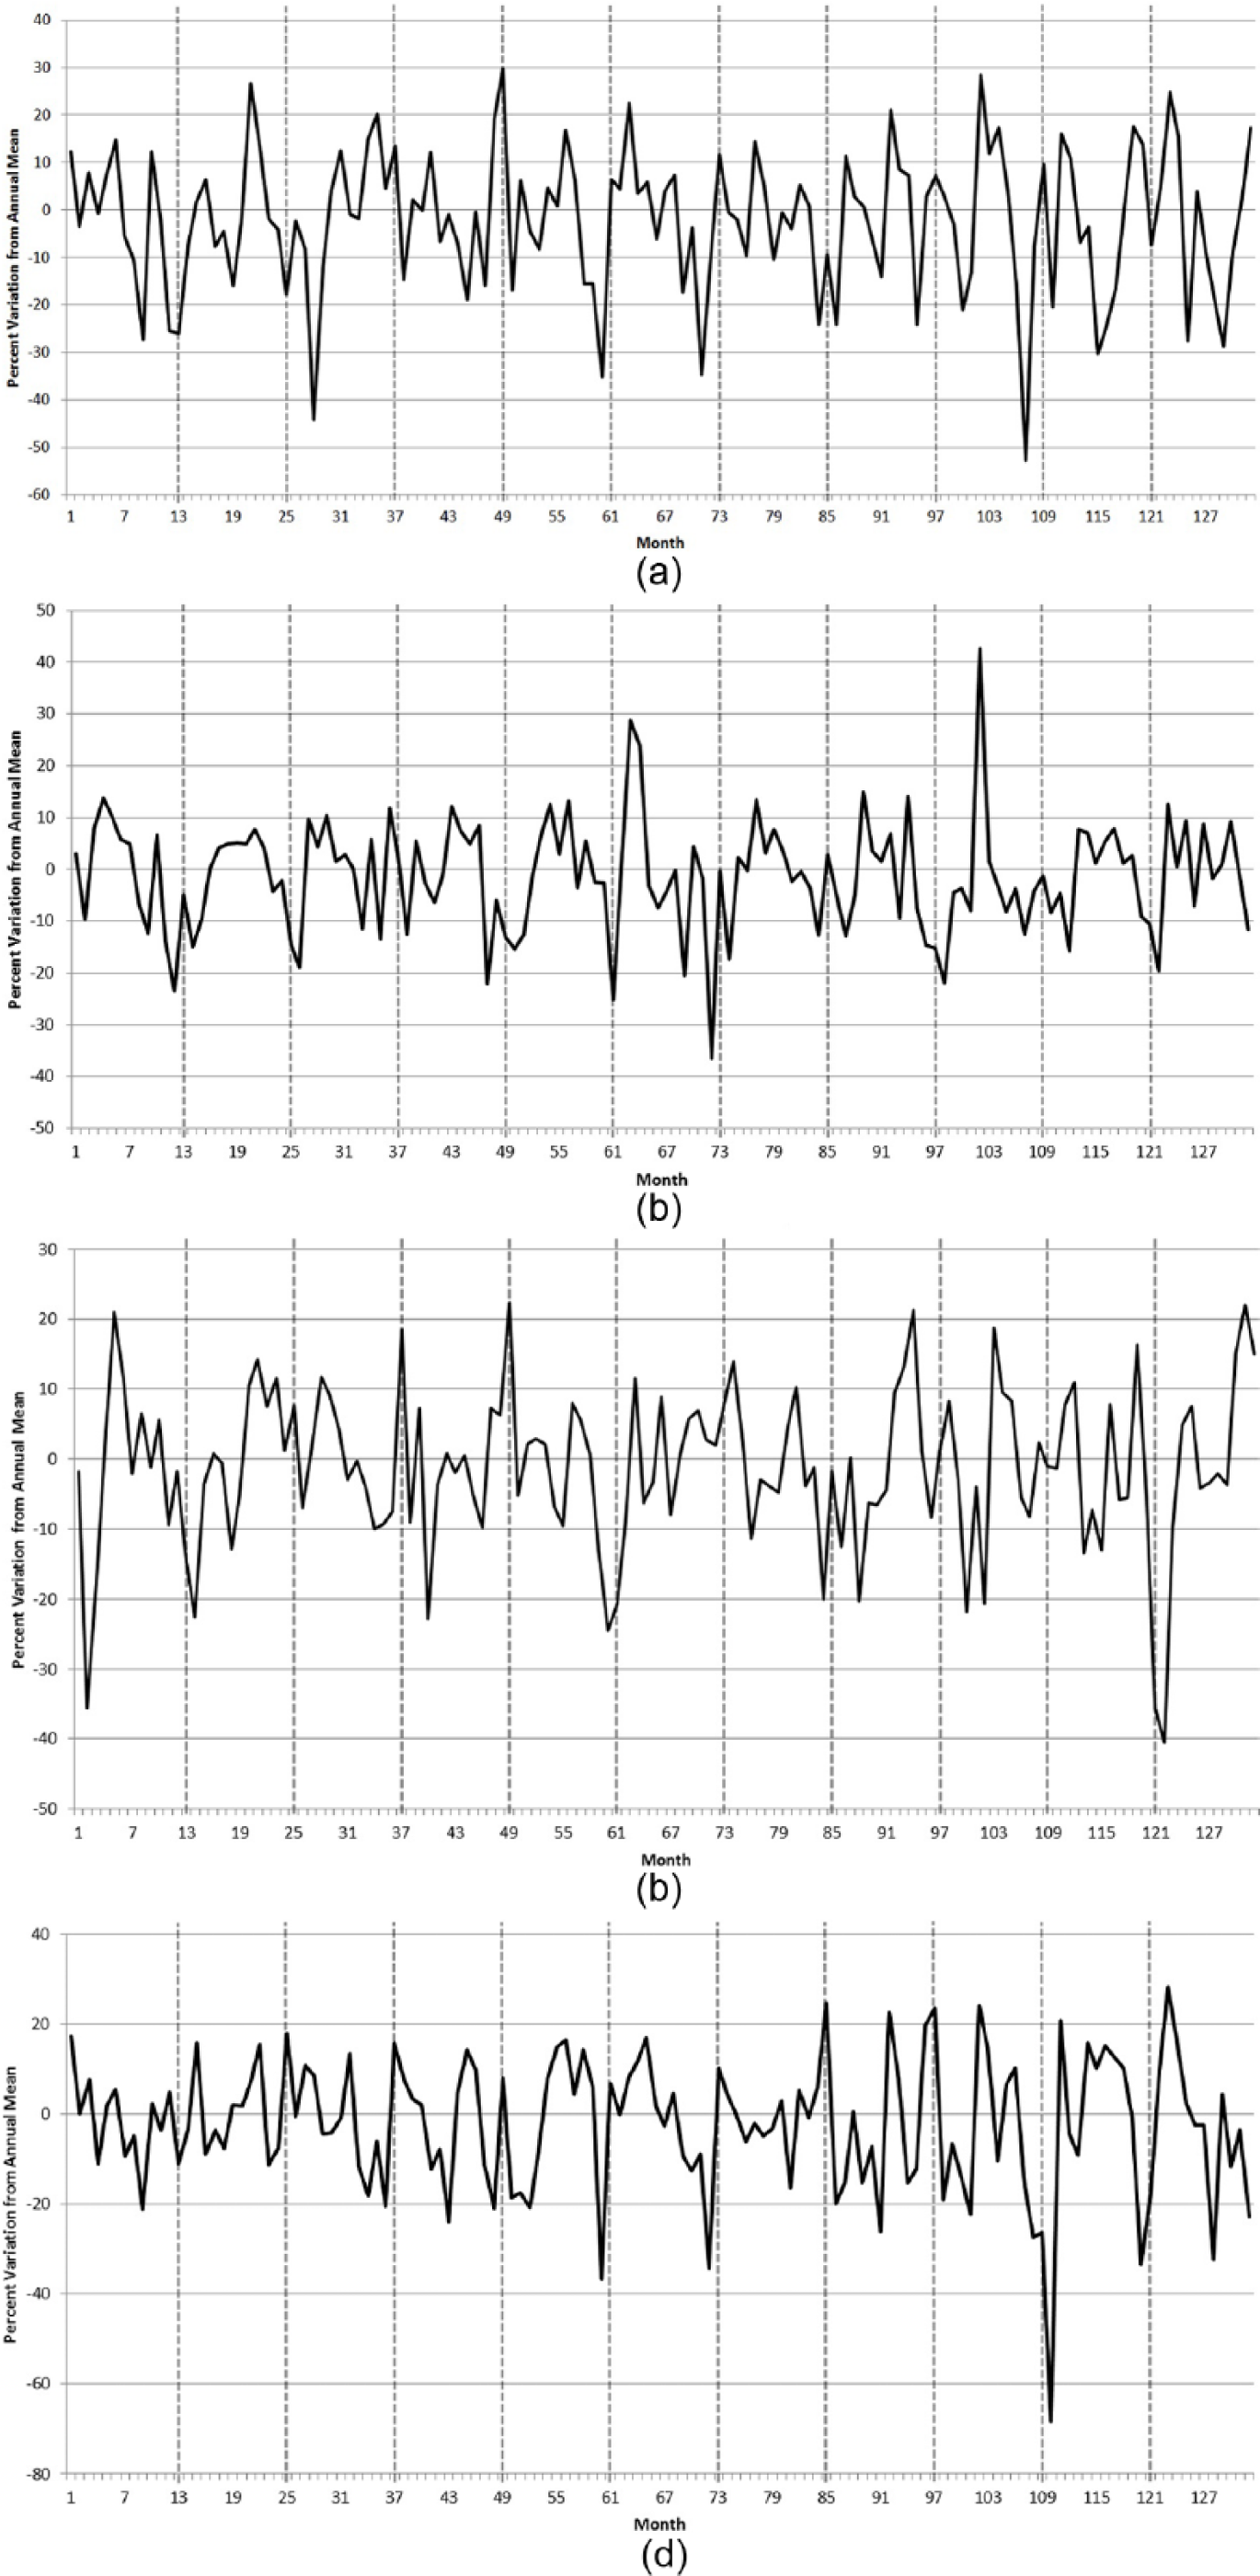
Graphical representations of crime frequencies in both cities can be found in Figures 1 through 3. Figure 1 contains the aggregate total crime trends over the 11 years in Vancouver and 3 years in Ottawa. With the exception of the graph for mischief, 11 each figure shows the percent variation from the annual mean to display a more standardized view of the data for easier comparison. Given the more distinct changes in weather patterns mentioned above that occur in Ottawa, it is not surprising that more definite peaks in crime are visible, particularly in the summer months. In Vancouver, however, consistent and reoccurring surges in crime are not as apparent. Moving to Figures 2 and 3, trends for each of the individual crime types can be seen in both cities. These graphs demonstrate the importance of disaggregating data. For instance, in Figure 3c, the monthly frequencies of robbery in Ottawa do not match the overall trends seen in the total crime graph (Figure 1a). Instead, the latter may be largely driven by crime types that occurred more frequently, such as theft of vehicle or residential break and enter (frequency tables are available upon request). As such, the underlying trends of other crime types are likely masked by the overall aggregate trends.
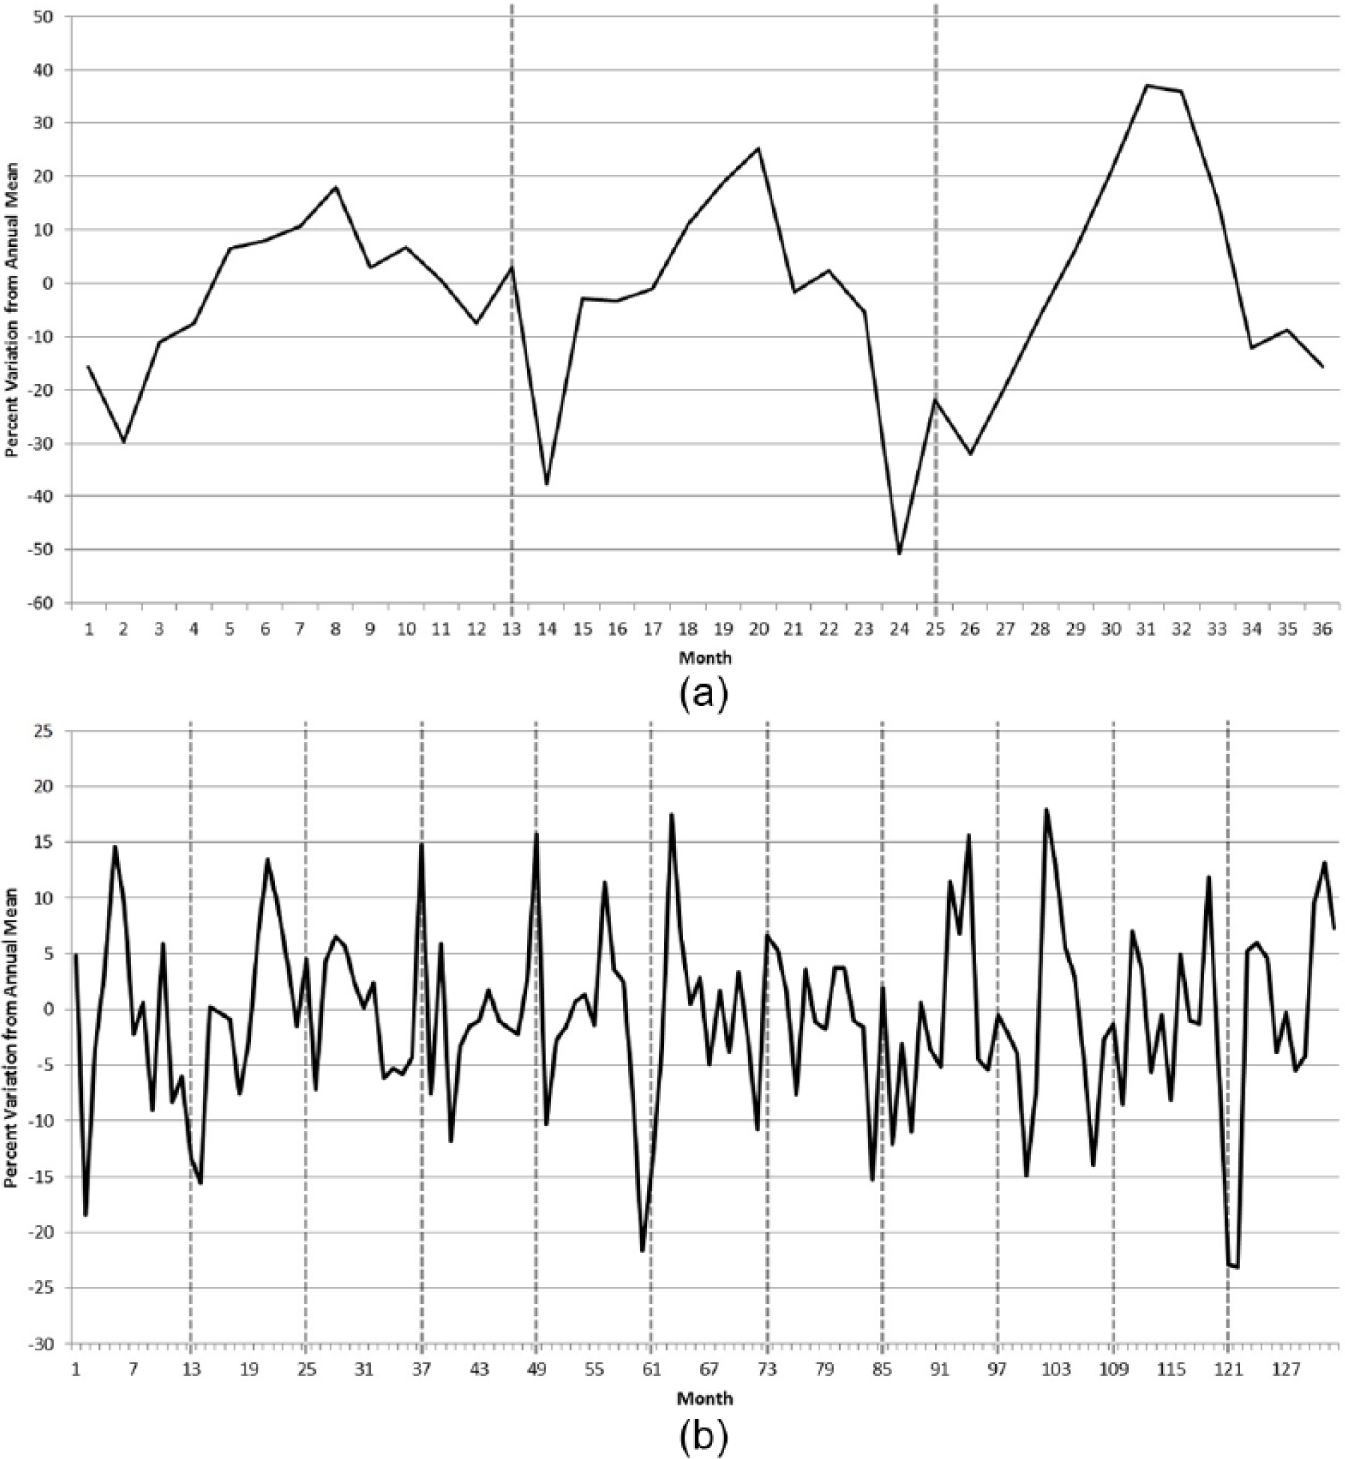
Monthly crime trends: (a) Total crime, Ottawa (2006-2008) and (b) total crime, Vancouver (2003-2013).
Monthly crime trends, disaggregate crime types: (a) Commercial break and enter, Vancouver (2003-2013), (b) mischief, Vancouver (2003-2013), (c) theft from vehicle, Vancouver (2003-2013), and (d) theft of vehicle, Vancouver (2003-2013).

Monthly crime trends, disaggregate crime types: (a) commercial break and enter, Ottawa (2006-2008), (b) residential break and enter, Ottawa (2006-2008), (c) robbery, Ottawa (2006-2008), (d) theft of vehicle, Ottawa (2006-2008), and (e) mischief, Ottawa (2006-2008).
Regression Results
The first regression models that were run for this study merely involved each of the available crime types and the month and month-squared variables. Seeing as a seasonal/quadratic relationship was anticipated, a standard OLS regression would not provide an accurate reflection of the data because it assumes that a linear relationship exists between the independent and dependent variables. As such, month and month-squared variables were computed and incorporated to test/control for the quadratic (inverted U-shaped) distribution that was likely present in the data. Tables 3 and 4, show the 11 models that were run with the trend variables to test for the presence of crime seasonality using all 14 years of data. Not surprisingly, quadratic relationships were present across all crime types in Ottawa and were statistically significant at the p < .001 level. Conversely, mischief was the only crime classification that exhibited a significant curvilinear distribution in Vancouver between 2003 and 2013. Given the differences in climate, it is not surprising that crime in Ottawa yielded differing results. Each of the aggregate and disaggregate crime variables generated statistically significant results when tested with the aforementioned predictor variables indicating the existence of quadratic relationships. More specifically, the positive beta values for the month variables and reciprocal negative values for the month-squared variable imply that a curvilinear relationship exists. That is, crime levels increase early in the year and subsequently decline over time.
Temporal Regression Results, Seasonal/Quadratic Relationship, Vancouver, 2003-2013.
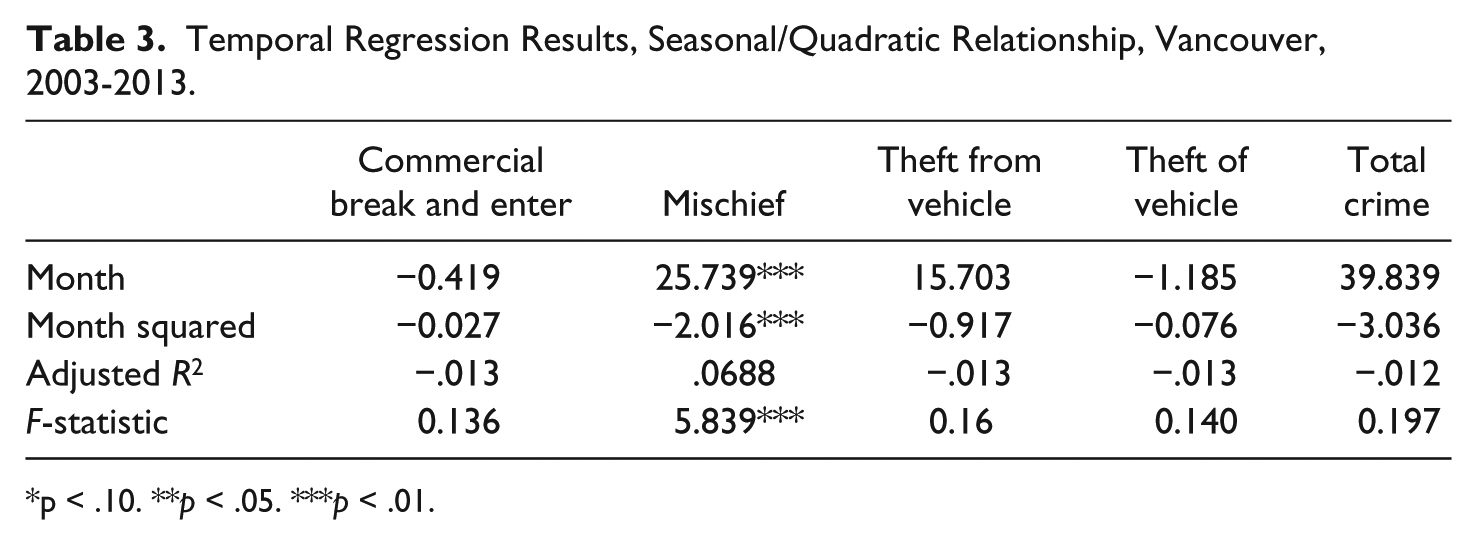
p < .10. **p < .05. ***p < .01.
Temporal Regression Results, Seasonal/Quadratic Relationship, Ottawa, 2006-2008; Mischief (2007-2008).
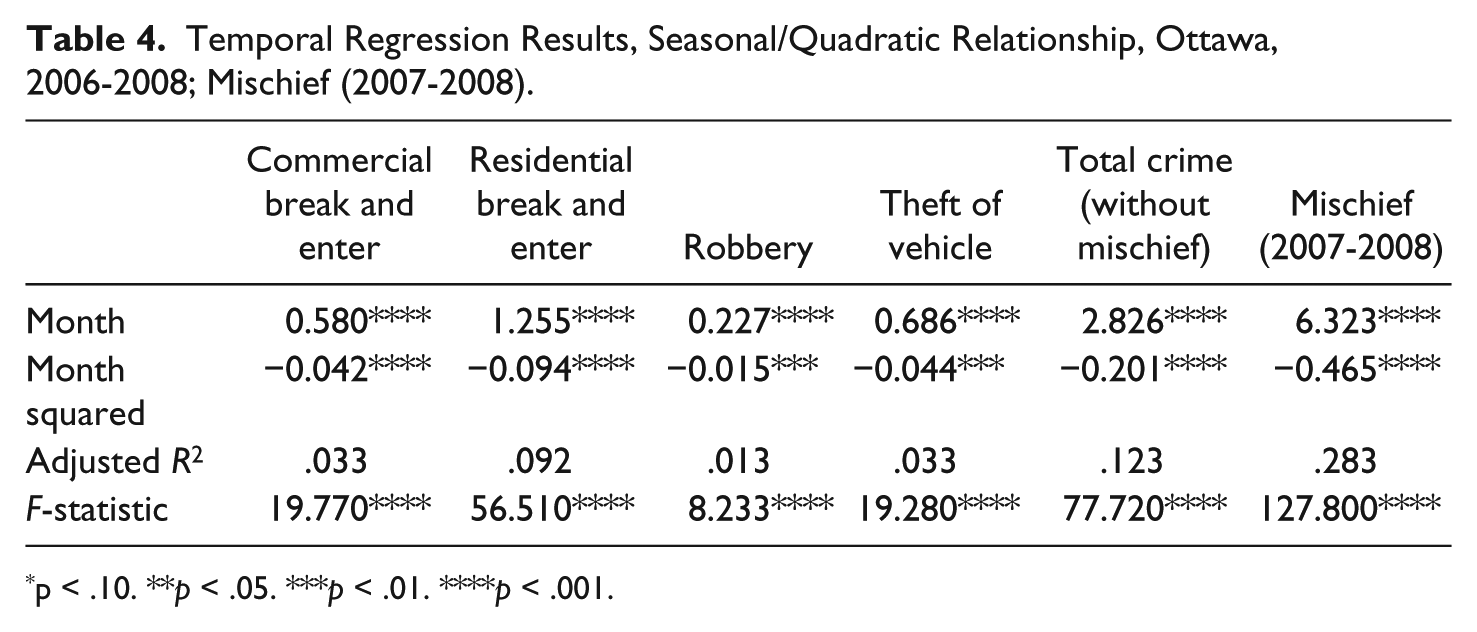
p < .10. **p < .05. ***p < .01. ****p < .001.
Vancouver, British Columbia
Results from the OLS regression models for Vancouver can be seen in Table 5. With the addition of weather, dummy, trend, and illumination variables, month and month squared are no longer statistically significant for any crime type but do retain their positive and negative estimated parameters, as expected, except for commercial break and enter. The trend variable that was created to represent each of the months over the 11-year time period and number of days in the month were all statistically significant and possessed the same directional relationships. In other words, as time went on between 2003 and 2013, crime decreased, and when there were more days in a given month, more crime was committed. These two trends are consistent with previous literature that has been conducted chronicling and examining the well-documented crime drop that has been occurring in North America and Europe (see Blumstein & Wallman, 2006; Farrell, Tilley, Tseloni, & Mailley, 2011). Moreover, it is more than expected that crime will occur more frequently in months that contain more days due to the increased time (and thus opportunity) that it allows for criminal activity (see also Harries et al., 1984). Other than those two variables, however, no additional variables possess significant relationships across all crime types. As such, a disaggregate evaluation of each offence classification is considered.
Temporal Regression Results, Vancouver, 2003-2013.
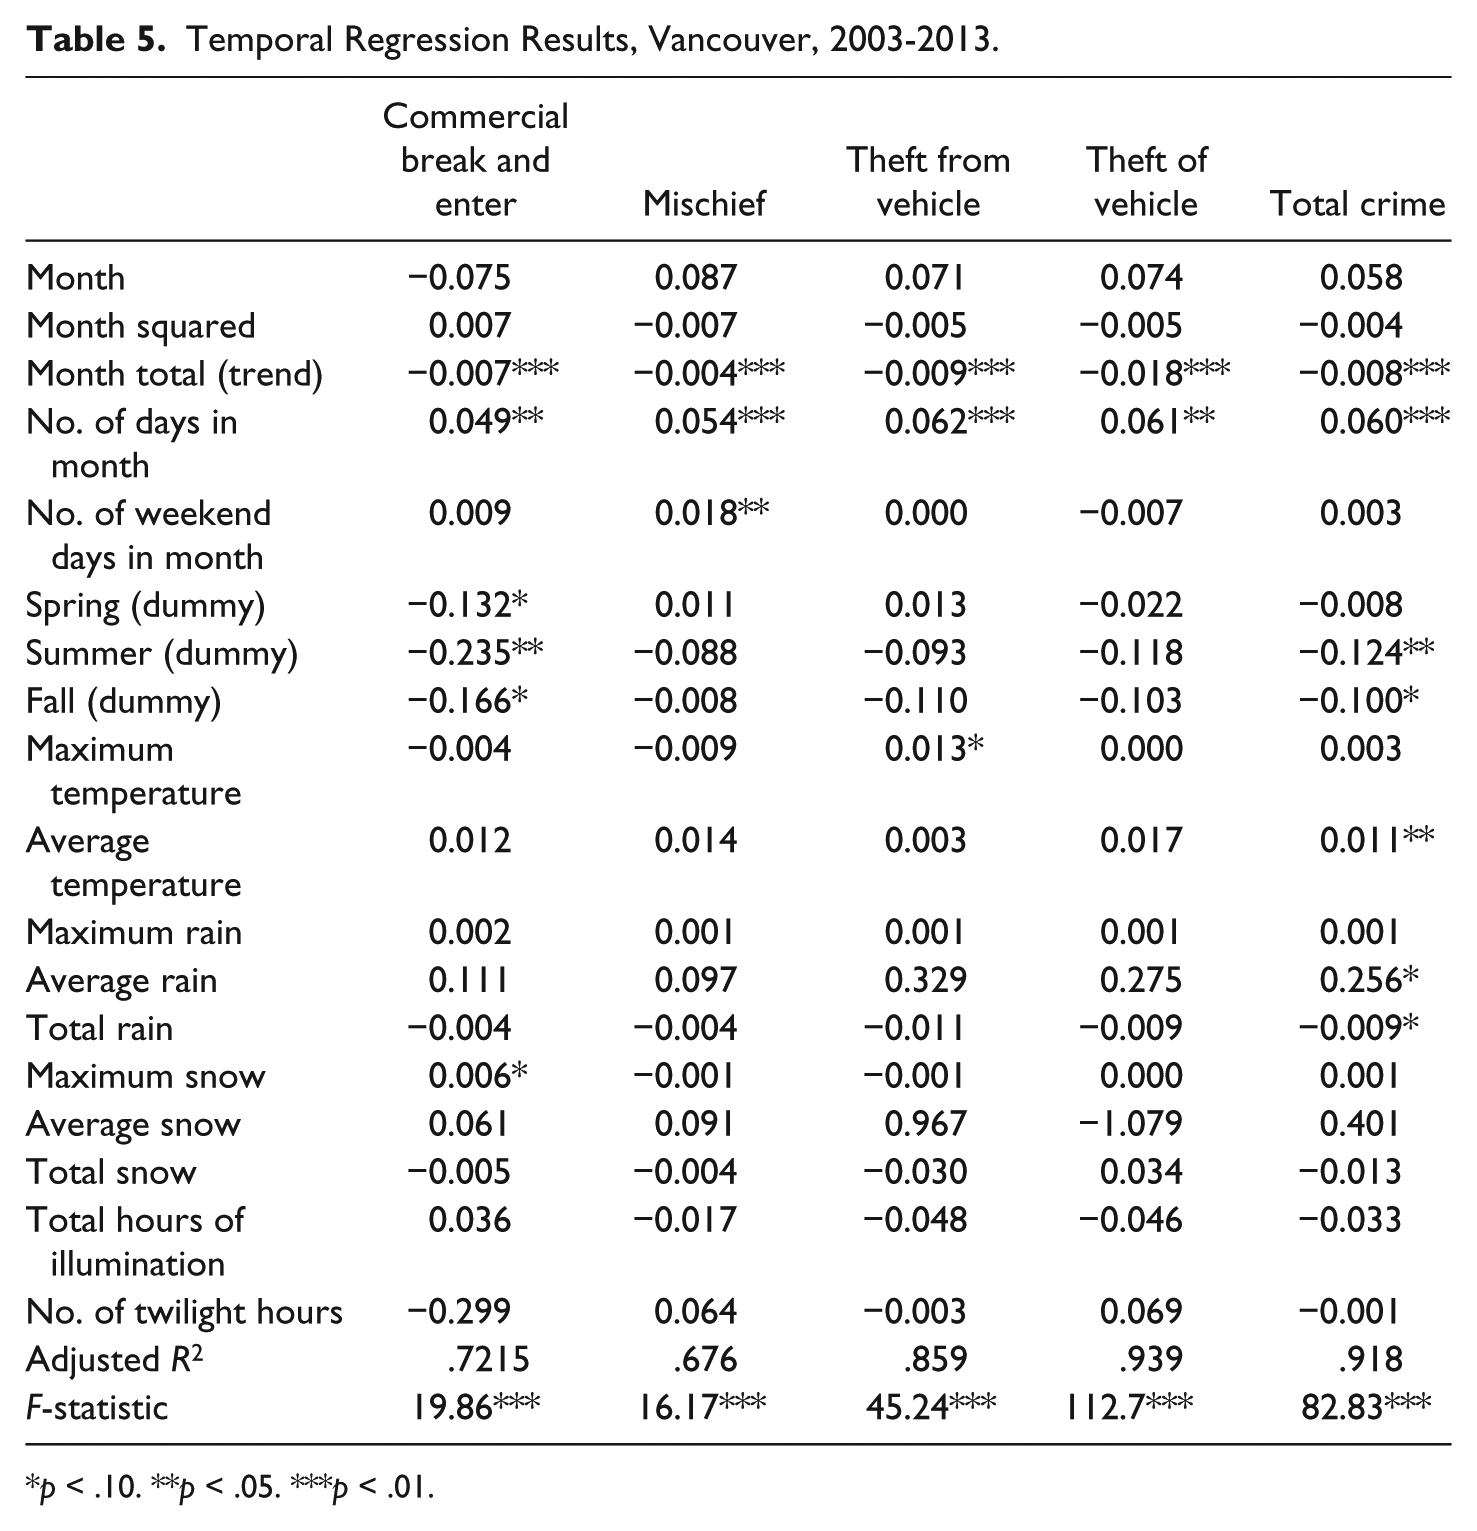
p < .10. **p < .05. ***p < .01.
Commercial break and enter in Vancouver had a significant relationship with the three seasonal dummy variables (all negative) as well as the maximum snow variable (positive). Collectively, these statistically significant results indicate that commercial break and enter is most frequent during the winter months. This is also consistent with the signs on month and month squared being opposite of expectations. Although mischief possessed the expected signs for month and month squared, and had a statistically significant relationship with the number of weekend days in the month, none of the seasonal or climate-related or illumination variables were statistically significant.
The results for theft from and theft of vehicle have the most potential to provide invaluable insights into the seasonality literature regarding cities with different climates. Once again, the month and month-squared variables indicate that there is no statistically significant quadratic relationship present in the data. Moreover, none of the seasonal dummy variables were able to elicit specific temporal concentrations to a given time of the year for theft from vehicle or theft of vehicle. However, when the maximum temperature for each month increased, there was an increase in the theft from vehicle crime rate of 1.3% (β = 1.3%; p < .01). It is possible that warmer temperatures make activities outside of the home more attractive, thus increasing the exposure to potential targets. However, even when temperatures are at their peak, offenders may still have more activities outside of the home because of the greater volume of rain in Vancouver and the fact that maximum temperatures in Vancouver are often considered relatively comfortable because of the temperate climate.
Ottawa, Ontario
Results from the negative binomial regression models are displayed in Table 6. These models show that the addition of additional weather, illumination, and dummy variables renders the month and month-squared relationship insignificant in all models except for commercial break and enter and mischief. These outcomes suggest that the additional climate-related variables are accounting for further variation in crime that was initially captured by the month and month-squared variables. This implies that with the exception of these two offences, factors other than time and/or calendar months contribute to the seasonal fluctuations of crime in the city.
Temporal Negative Binomial Regression Results, Ottawa, 2006-2008.
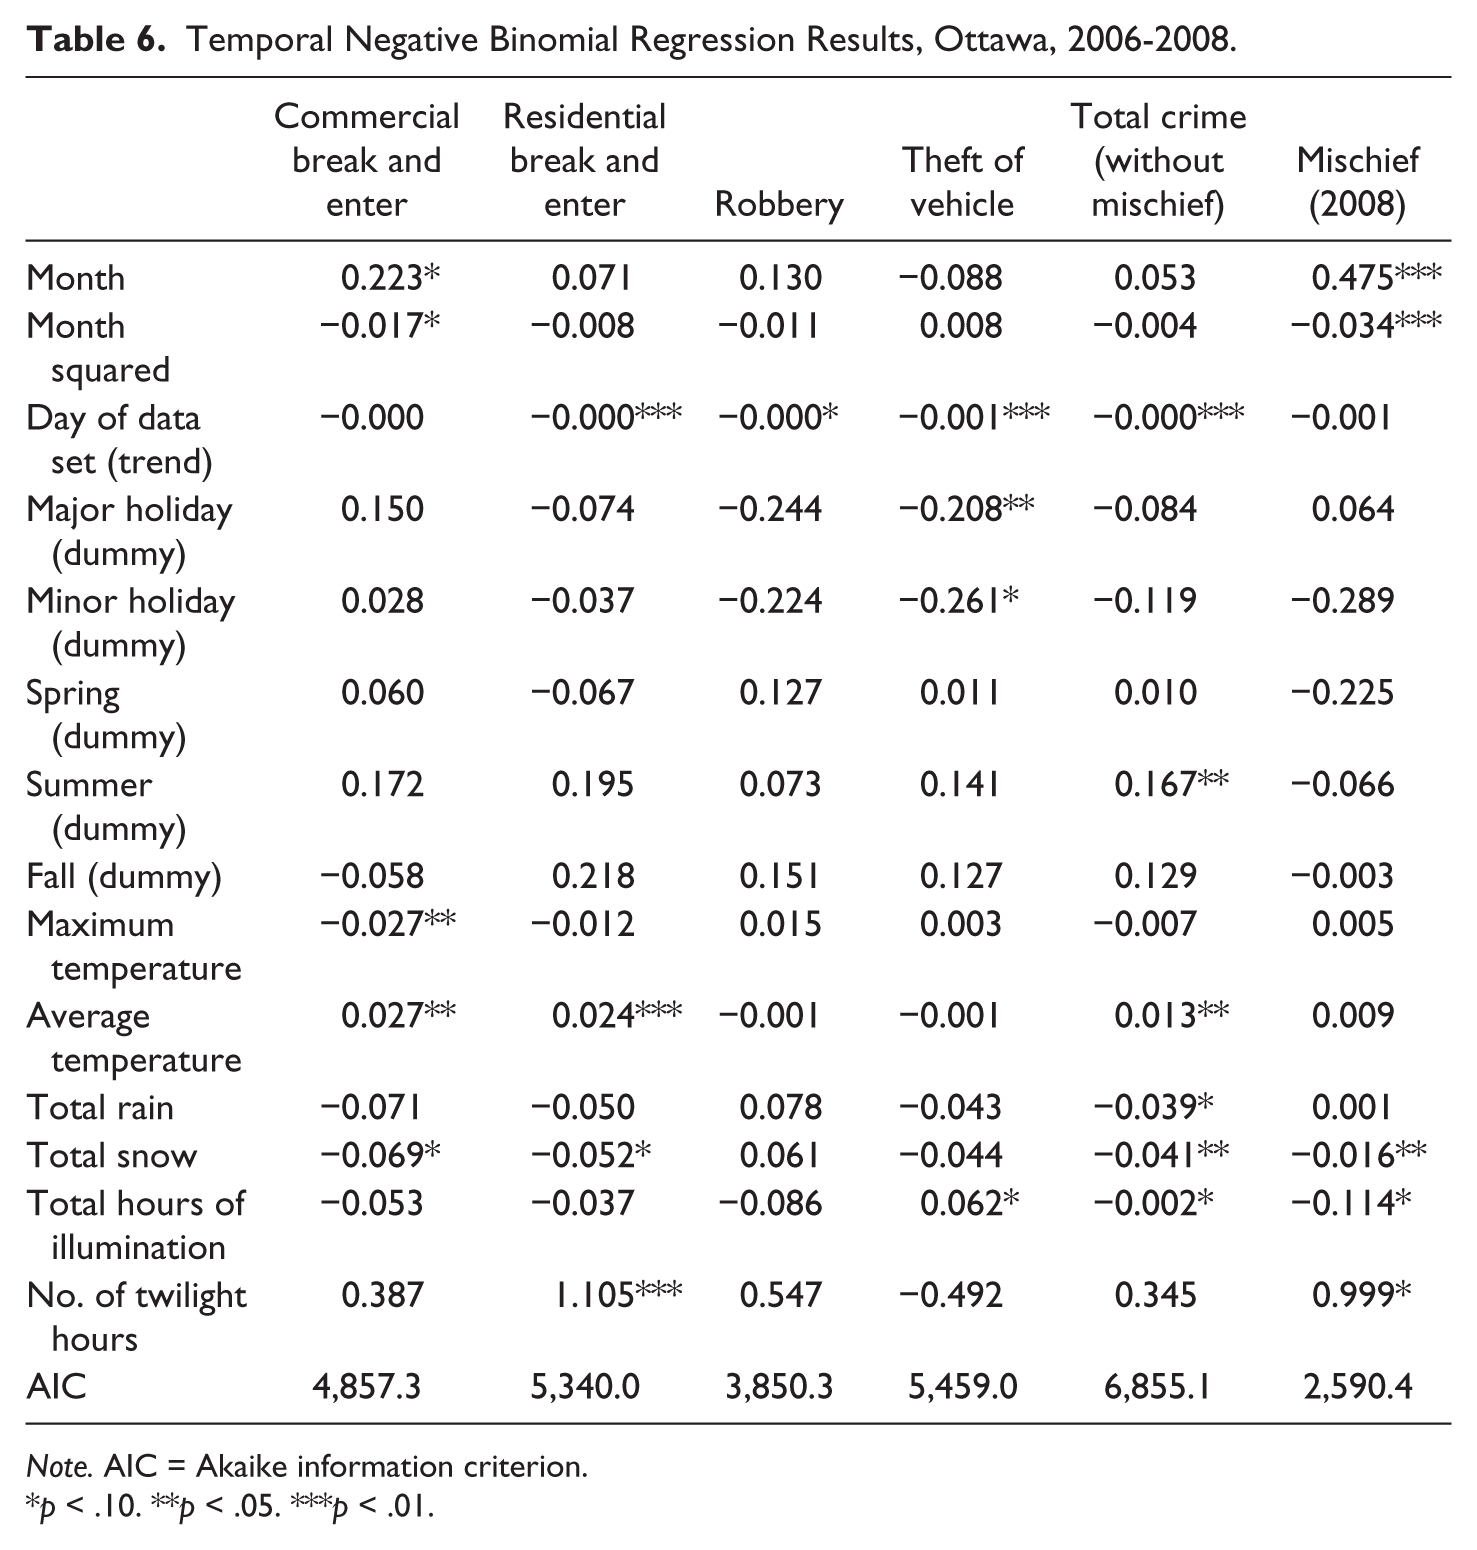
Note. AIC = Akaike information criterion.
p < .10. **p < .05. ***p < .01.
Contrary to the results found in Vancouver, nearly all models indicated that weather had an impact on crime in Ottawa. These are not surprising given the more distinct weather variations that are characteristic of the city. Curiously, only total crime has a statistically significant and positive relationship with the summer variable. However, many other variables revealed results that were consistent with summer crime peaks. On average, as temperatures rose so did property crime, and as snowfall amounts increased in the winter months, property crime fell in all cases but robbery and theft of vehicle. Variables that measured the number of daylight hours and/or twilight also revealed that longer days experienced more residential break and enter and theft of vehicle. This is not surprising given that daylight hours increase in the summer months. Overall, these results suggest that property crime tends to peak in the summer months in cities that experience greater fluctuations in weather and temperature patterns.
Discussion
Although a number of studies have been conducted to assess crime seasonality, works that have focused on property crime trends are less common. Moreover, in some cases when property offences were evaluated, the investigators often aggregated the crime types into an aggregate property crime variable (see Hipp et al., 2004). Fortunately, the data sets employed in this study contained sufficient information to assess distinct property crime types separately. For instance, both the commercial and residential break and enter offence variables in Ottawa and the theft of and theft from vehicle data from Vancouver allowed for some very interesting comparisons. Given the frequently cited offence-specific characteristics sought out by offenders in the search of suitable targets regardless of crime type (see Beauregard, Rebocho, & Rossmo, 2010; Clarke, 1980; Kennedy, 1990; Neel & Taylor, 2000; Wright, Logie, & Decker, 1995), it is unsurprising that different offences yielded distinct seasonal patterns. Moreover, the direct examination of two cities with differing climates also generated some valuable insights into the existence (or lack thereof) of seasonal crime trends within the same country.
Before proceeding to further discussion, it should be noted that no research is conducted without limitations, and this study is no exception. First, although these results are certainly informative, they can only provide insights into the various property crime types included in the datasets. As previously mentioned, the total crime variables are simply an aggregate of each of the crime types included in the data. Therefore, no conclusions can be made regarding other crime classifications such as assault, homicide, or drug offences. Second, the crime classifications were not explicitly defined in the data and should thus be factored into all interpretations particularly when comparing results from the two cities. Although crime types such as theft of vehicle and/or commercial break and enter are relatively straightforward, a variable such as mischief could be defined differently by each police department.
The above issue also coincides with the concern regarding the accuracy of police data. While discrepancies in reporting practices of different police agencies are a very common occurrence, one must also consider the variation between the individual police officers who file the reports. For an in-depth discussion of the accuracy of police report data, see Sherman et al. (1989). Finally, the differing temporal units of analysis should be discussed. Although the analyses incorporated Vancouver crime data over an 11-year period, the data were aggregated to the month of occurrence as opposed to the day. Conversely, the Ottawa Police Department released data containing the specific date of offence (i.e., day) but only for a 3-year period. Despite these discrepancies between cities/data, however, comparisons are still warranted but must be taken with caution.
By comparing the temporal property crime trends in two cities with different climates, it is no surprise that divergent trends emerged. In fact, these results are consistent with past research that had concluded that cities with warmer climates had flatter seasonal crime cycles and that, conversely, seasonality was strongest in colder climate cities (Hipp et al., 2004; McDowall et al., 2012). As such, because Vancouver experiences relatively minor climatic fluctuations throughout the year, it was expected that annual variations would likely be limited. Instead, factors such as frequent rainfall, which is famously characteristic of the city, and warmer temperatures appeared to have more of an impact. Given the scarcity of snowfall, it was also predictable to find that snow had no effect on crime in Vancouver.
Conversely, Ottawa’s more distinct seasons exhibited readily apparent impacts on crime in the regression models. In fact, with the exception of robbery, each of the property crimes generated multiple significant relationships with many of the climate variables. A prime example would be the consistently significant negative relationships between snowfall and crime across nearly every crime type. Such findings reinforce the results of Hipp et al. (2004) who found “considerable evidence of a seasonal effect for property crime,” thus providing support for the explanatory use of routine activities theory as opposed to temperature aggression theory (Hipp et al., 2004, p. 1363). Therefore, the hypothesis that posited that seasonality would exist in cities with more distinct weather seasons appears to be substantiated by these data.
The disaggregation of crime types has also proven useful in understanding some of the underlying property crime trends. The most obvious example demonstrating the advantages of individual analyses is robbery in Ottawa. Although the initial month and month squared only models indicated that quadratic relationship existed, the models with climatic variables showed virtually no seasonal pattern. However, the aggregate variable for Ottawa indicated that temporal-, illumination-, and weather-related influences were all present and that they could account for much of the occurrence of crime. Therefore, had the disaggregation of crime types been omitted from these analyses, the underlying robbery patterns would have been masked within the overall total crime variable. As such, these results provide further support for the situational crime prevention literature and the importance of studying crime-specific trends (see Clarke, 1980; L. E. Cohen & Felson, 1979).
At yet another level, different climate-related variables demonstrated varying impacts on each crime type in both cities. There were, however, weather variables that possessed more common impacts on various crime types in Ottawa than Vancouver. More specifically, in Vancouver, rainfall variables mattered for the occurrence of total crime, but only one temperature variable affected theft from vehicle. Furthermore, there were no set variables that were consistently significant across all crime types. This is likely due to the relative lack of seasonal variations in climate in Vancouver; rain is common all year and temperatures are most often mild. In Ottawa, however, very different trends emerged. Instead, climatic variables such as temperature and snowfall generated consistent relationships across most crime types incorporated into the models. For example, with the exception of robbery and theft of vehicle, there was a statistically significant decrease in crime as snowfall levels increased. Simultaneously, increasing rainfall amounts had no significant impact on any of the individual crime types included, only their aggregate. Interestingly, other variables such as hours of illumination and temperature provided significant impacts on crime but only with certain types of offences. This provides some support for the second hypothesis that different weather variables will only affect certain crime types. Therefore, these results indicate that not only was the disaggregation of crime types important to parse out individual offence patterns but these disaggregate patterns can also vary across cities with differing climates. As such, replication of such temporal analyses in different cities would not be redundant to our knowledge of seasonal crime trends.
Within the above discussion, we have alluded to implications from these results that are relevant for policing and communities in the context of crime prevention. However, some more explicit discussion is warranted. Of course, climate and illumination variables cannot be modified with the goal of preventing or reducing crime, but understanding their impact may be useful for police and communities to be able to affect the volume of criminal events. For example, in the context of Vancouver, climate and illumination variables have very little impact on temporal crime patterns. However, increases in the maximum temperature lead to modest increases in theft from vehicle. Knowing this in conjunction with knowledge of where theft from vehicle occurs may be instructive for those who wish to prevent such crimes. In the context of commercial break and enter, winter is the season most affected by this crime; knowing this may influence the behavior of the business community with specific crime prevention efforts. In the context of Ottawa, weather can have more of a predictive effect for police and communities. For example, increases in average temperature lead to increases in commercial and residential break and enter with (albeit statistically insignificant) decreases in robbery and theft of vehicle. Conversely, increases in snow decrease the volume of commercial and residential break and enter. Such knowledge can help inform police of the appropriate crime prevention initiatives, or proactive policing strategies, given the nature of the weather.
This also leads to the importance of understanding theory in the context of temporal variations in crime. Within the seasonality of, or temporal variations in, crime literature, routine activity theory is often cited as being instructive for both property crime and violent crime. The general assertion is that warmer temperatures, and corresponding less precipitation, leads to more people being outside of the relatively protective environment of the home. This leads to an increase in both property and violent crime. Although general support for this hypothesis is found in the current article, we also find more specific relationships between routine activities and criminal activity. We argue that this is centered on the suitability of targets and capable guardianship.
In the results for Vancouver, as stated above, winter and snow are associated with increases in commercial break and enter. Presumably, this is related to the shopping season after and immediately prior to the Christmas and Boxing Day holidays. Although some new commercial outlets may emerge during this time of the year, it is unlikely that the change would be enough to alter citywide crime rates. Rather, because of the increased volume of people in any given commercial outlet, capable guardianship decreases. Even with modern security practices and increased security personnel at this time of the year, the volume of people out in commercial areas dominates increases in security at this time. Perhaps more important is the role of commercial burglary that occurs when commercial outlets are closed and there are no extra capable guardians in the area. Because of the huge volume of sales during this time of year, commercial outlets must necessarily increase their stock of goods. This increases the payoffs for any given commercial break and enter. Consequently, the suitability of a target has a temporal component and is not simply placed on the suitability of the actual items being stolen: target suitability has multiple dimensions. For Ottawa, though this manifests itself through temperature and snowfall, the opposite relationship exists: decreases in temperature and increases in snow decrease the volume of both commercial and residential break and enter. In this particular case, though commercial outlets and residences will have more items to steal this time of the year, the weather decreases target suitability because it would be more difficult to leave a crime scene in this more extreme weather. Again, this shows that target suitability has multiple dimensions, not simply related to the presence of lightweight and valuable items; the volume of these items available and the environment within which they are placed also affects the suitability of these targets and shows that routine activity theory provides deeper insight into the temporal variations of crime literature than simple changes in the volume of convergences.
Future research on these trends is still warranted and any similar replications should strongly consider some of the aforementioned methodological choices. The use of longitudinal data, particularly of daily intervals, over many years in multiple cities would also be beneficial to the literature. Although the Vancouver data used in this analysis were ideal for the study of a trend over time, data containing which day each offence occurred as opposed to simply which month would have strengthened the study. The analysis of data that contain an even greater variety of criminal offences would be even more valuable. Moreover, the examination of data from multiple jurisdictions, ideally recorded by the same provincial and/or federal police agency, would also be invaluable to the seasonality literature. As previously discussed, it is very likely that data sets that include other crime types, such as violent crimes that involved mobile targets (i.e., people), will generate very different spatial results in the study of crime seasonality. Access to and use of such data would provide invaluable insights into the true seasonal variations of crime. The use of temporal statistical methods such as autoregressive integrated moving averages (ARIMA) and/or the Box-Jenkins method, seasonal adjustments, and spectral and Fourier analyses could also provide a better understanding of seasonal crime patterns (Block, 1983; Breetzke, 2015; McPheters & Stronge, 1974; Rotton & Frey, 1985). Moreover, when possible, other predictors that are relevant to each crime type should be included; however, the availability of such variables will be limited.
Running the above analyses across multiple cities and countries is imperative for our understanding of annual crime patterns and the application of environment-specific prevention policies (see Block, 1983). It is apparent from these data that temporal seasonality analyses in a given city may not translate effectively into another. Moreover, law enforcement management should be aware of annual fluctuations in crime to delegate available resources to the most effective units (Block, 1983). Because each city will have its own weather patterns and general routine activities, the monitoring of each city’s respective trends must be conducted individually. From a crime prevention standpoint, knowledge of when these surges occur will assist in more effectively applying the initiatives as well as when to evaluate their effectiveness (Andresen & Malleson, 2013). As such, research into the seasonal patterns of both property and violent offences is warranted and should prove useful in the continuing attempts to reduce crime.
Footnotes
Declaration of Conflicting Interests
The author(s) declared no potential conflicts of interest with respect to the research, authorship, and/or publication of this article.
Funding
The author(s) disclosed receipt of the following financial support for the research, authorship, and/or publication of this article: This research was supported by the Social Sciences and Humanities Research Council of Canada (SSHRC).