



Abstract
Gottfredson and Hirschi argue that parenting is the primary source of self-control. Research on the etiology of self-control has provided partial support for this proposition. Studies have shown parenting is an important determinant of self-control; however, research has also shown that other social and biological/genetic factors also influence the development of self-control. The current study contributes to the literature by examining the possibility that sources of self-control may vary across subgroups, which exhibit different developmental patterns of self-control. Analyses are based on 6-year panel data from a sample of South Korean youths. The results indicate that youths are clustered into three subgroups showing stable, increasing, and decreasing levels of self-control over time. Similarities/differences in the relationships among family, school, peer, and community variables and self-control appeared across the subgroups. Theoretical and policy implications are discussed.
Introduction
The central premise of Gottfredson and Hirschi’s (1990) self-control theory is that between-individual differences in the tendency to engage in crime and analogous behaviors are explained by differences in self-control. This central premise is supported by a large number of studies that show differences in self-control have a relatively robust relationship with criminal and delinquent acts that provide immediate gratification and the potential for long-term negative consequences (de Ridder, Lensvelt-Mulders, Finkenauer, Stok, & Baumeister, 2012; Pratt & Cullen, 2000). Less well supported are Gottfredson and Hirschi’s arguments regarding the development of self-control. Within the framework of Gottfredson and Hirschi’s theory, between-individual differences in self-control are largely determined by parenting practices and are stable starting in early adolescence around the ages of 8 to 10. Between-individual stability suggests that relative differences in self-control between individuals are stable but absolute levels of self-control may change. That is, overall self-control may gradually increase over the life-course, but individuals who are low in self-control relative to their peers in early adolescence will remain low in self-control relative to those peers later in life. Contrary to the proposition of the relative stability of self-control, a number of studies have shown that samples typically yield multiple trajectories of self-control development with some groups traversing each other (Hay & Forrest, 2006; Higgins, Jennings, Tewksbury, & Gibson, 2009; Ray, Jones, Loughran, & Jennings, 2013).
Gottfredson and Hirschi (1990) argued that self-control is overwhelmingly determined by parenting practices, with schools potentially having a minor effect. While a number of studies do show parental influences on self-control (see Cullen, Unnever, Wright, & Beaver, 2008, for the summary of the findings), other research shows that the factors influencing self-control do indeed extend not only to schools but also include peer and community influences (Burt, Simons, & Simons, 2006; DeLisi, 2013; Jo & Bouffard, 2014; Meldrum, 2008; Meldrum & Hay, 2012; Meldrum, Young, & Weerman, 2012; Pratt, Turner, & Piquero, 2004; Turner, Piquero, & Pratt, 2005). While providing an important extension of the literature, the studies of the determinants of self-control have not considered the possibility that the factors influencing the development of self-control may vary across groups. This is a potential limitation, given the aforementioned studies showing the existence of multiple trajectories of self-control development (Hay & Forrest, 2006; Higgins et al., 2009; Ray et al., 2013). Multiple trajectories of self-control development suggest not only that self-control may be malleable for some, if not everyone, but also that causes of self-control may vary across subgroups. However, the research incorporating these new findings in tests of the etiology of self-control is very limited (Ray et al., 2013). The current study builds on this research by linking the findings from developmental research showing multiple trajectories of self-control development with studies showing that distinct factors including parent, peers, schools, and communities contributed to the development of self-control. Specifically, this study examines whether or not multiple developmental trajectories of self-control exist, and if so, whether or not the factors influencing change in self-control varies across these trajectories.
Literature Review
Since the publication of Gottfredson and Hirschi’s (1990) A General Theory of Crime, the majority of research on the theory has focused primarily on the relationship between low self-control and deviant behavior. This research has showed that the relationship between self-control and deviance is quite strong (de Ridder et al., 2012; Pratt & Cullen, 2000). Concomitant to studies testing the relationship between self-control and acts of crime and delinquency, other research has also tested Gottfredson and Hirschi’s arguments regarding the development of self-control. Gottfredson and Hirschi argued that to develop self-control parents “must monitor the child’s behavior; recognize deviant behavior when it occurs; and punish such behavior” (p. 97). When a child’s undesirable behaviors are checked, recognized, and punished by his or her affectionate caregivers, the child becomes “more capable of delaying gratification, more sensitive to the interests and desires of others, more independent, more willing to accept restraints on his activity, and more unlikely to use force or violence to attain his ends” (Gottfredson & Hirschi, 1990, p. 97). Gottfredson and Hirschi acknowledged schools as alternative sources of self-control as teachers can effectively monitor students’ behavior, easily recognize unacceptable behavior, and have the authority and the means to punish these behaviors. However, the authors suggested that schools can effectively socialize students only when they receive support from parents. Without parents’ active involvement in school activities, students with low self-control may drop out after experiencing difficulties in completing their homework, becoming accustomed to restrained school environments and/or meeting performance standards. Gottfredson and Hirschi reemphasized the role of parenting as the major source of self-control by stating that “self-control differences seem primarily attributable to family socialization practices. It is difficult for subsequent institutions to make up for deficiencies” (Gottfredson & Hirschi, 1990, p. 107).
Consistent with Gottfredson and Hirschi’s (1990) arguments regarding the central role of parenting in the development of self-control, a number of studies using a variety of measures of parenting and distinct data sets show that parenting influences the development of self-control. For example, Gibbs, Giever, and Martin (1998) in one of the earliest tests of Gottfredson and Hirschi’s arguments regarding the association between parenting and self-control, found parental management had a significant, direct, and positive effect on self-control. Significant relationships between parenting and self-control have also been found with a variety of parenting measures including parents’ fair discipline and nonphysical discipline (Hay, 2001), children’s attachment and parental supervision (Hope, Grasmick, & Pointon, 2003; Polakowski, 1994; Pratt et al., 2004), parental efficacy (Feldman & Weinberger, 1994; Perrone, Sullivan, Pratt, & Margaryan, 2004), parental closeness, parental support and parental monitoring (Unnever, Cullen, & Pratt, 2003; Vazsonyi & Belliston, 2007), and parental socialization (Hay & Forrest, 2006).
Research has also shown that other factors including schools, peers, and communities influence the development of self-control. Beaver, Wright, and Maume (2008), for example, examined the effects of classroom characteristics on self-control using a multilevel approach and found that students’ self-control was significantly reduced by misbehavior occurring in the classroom and by the percent of students eligible for free lunch (tapping the economic well-being of students). Significant relationships have also been found among self-control and both school monitoring and school socialization (Meldrum, 2008; Turner et al., 2005). Beyond school effects, studies have also shown that peers influence the development of self-control (Burt et al., 2006; Meldrum, 2008; Meldrum & Hay, 2012; Meldrum et al., 2012). The relationship between peer and self-control appears to be contingent on the type of peer association (Meldrum & Hay, 2012). That is, prosocial peer association is positively associated with self-control, whereas deviant peer association has negative effects on self-control. Researchers have also found that the development of self-control is influenced by community characteristics. Aspects of the community with a negative influence on self-control include socioeconomic disadvantage, residential mobility, and general measures of neighborhood problems and adverse neighborhood conditions (Lynam et al., 2000; Meldrum & Hay, 2012; Pratt et al., 2004; Teasdale & Silver, 2009).
Studies finding parental, peer, school, and community effects on self-control are called into question to a certain extent by research showing that self-control is highly heritable (Beaver, Connolly, Schwartz, Al-Ghamdi, & Kobeisy, 2013; Beaver, Wright, DeLisi, & Vaughn, 2008; Boisvert, Wright, Knopik, & Vaske, 2012; DeLisi, 2013; Turner, Livecchi, Beaver, & Booth, 2011). Studies within this body of research suggest that genetic variation may moderate the impact of social influences on self-control (Beaver et al., 2013; Beaver, Wright, DeLisi, & Vaughn, 2008; Boisvert et al., 2012). Research in this area also shows that accounting for the heritability of self-control can reduce and even fully attenuate the effects of environmental characteristics such as parenting (Wright & Beaver, 2005). At a minimum, these studies show that research designs that do not consider the heritability of self-control may overestimate the relative importance of parents, peers, schools, and communities on the development of self-control. Concerns regarding the impact of a lack of controls for heritability on studies relating environmental factors to self-control development are attenuated somewhat by questions regarding the methodology of the heritability studies themselves (see, for example, Charney, 2012). Relative to the arguments of Gottfredson and Hirschi (1990) regarding the causes of self-control, studies showing genetic/biological effects substantially undermine their contention that self-control is not influenced in any meaningful way by genetic/biological characteristics.
The research reviewed above shows that, contrary to the propositions of Gottfredson and Hirschi’s (1990) self-control theory, the factors influencing the development of self-control extend well beyond parenting. While school effects on self-control were anticipated to a certain extent by Gottfredson and Hirschi, peer and community effects were not. Studies showing parental, peer, school, and community effects on self-control clearly represent an important contribution to our understanding of the development of self-control. However, this line of research may be extended through a consideration of the possibility that the factors influencing self-control vary across distinct trajectories of self-control development. A number of studies using group-based modeling approaches have now found evidence of distinct trajectories of self-control development (Hay & Forrest, 2006; Higgins et al., 2009; Ray et al., 2013; Vaske, Ward, Boisvert, & Wright, 2012). Multiple trajectories of self-control development suggest that the factors influencing the development of self-control may vary across trajectory. Prior studies examining the causes of self-control have not recognized this possibility instead treating all individuals in a study as one homogeneous group.
Beyond their potential implications for studies exploring the factors influencing self-control development, studies showing multiple trajectories of self-control development are inconsistent with Gottfredson and Hirschi’s (1990) arguments regarding the relative stability of self-control. In the original statement of their theory, Gottfredson and Hirschi argued that “individual differences in self-control are established early in life . . . and are reasonably stable thereafter” (p. 177). In later work, they elaborated on the stability of self-control noting that “differences [in self-control] observed at ages 8 to 10 tend to persist from then on. Good children remain good. Not so good children remain a source of concern to their parents, teachers, and eventually to the criminal justice system” (Hirschi & Gottfredson, 2001, p. 90). A number of studies have now found results inconsistent with this argument. Work exploring trajectories of self-control development have found evidence for multiple trajectories including trajectories that traverse each other (Hay & Forrest, 2006; Higgins et al., 2009; Jo & Bouffard, 2014; Jo & Zhang, 2014; Ray et al., 2013; Vaske et al., 2012). In an early application of group-based modeling to patterns of self-control development, Hay and Forrest (2006) found eight distinct pathways of self-control development. Four groups (83.97%) showed very stable levels of self-control, while other groups showed that self-control consistently increased (4.79%), decreased (10.33%), or fluctuated (0.91%) over time. Only one group (12.37%) out of the eight provided perfect support for the relative stability (i.e., no traverse). Approximately 45% or three groups and 34.93% or two groups showed one traverse and two traverses, respectively. Finally, 6.0% or two groups showed three or more traverses. The existence of multiple trajectories of self-control development and traverses among them have been found in different populations in North America (Higgins et al., 2009; Ray et al., 2013; Vaske et al., 2012) as well as in Asian countries (Jo & Bouffard, 2014; Jo & Zhang, 2012). Evidence of distinct trajectories of self-control development with traverses among them is inconsistent with the suggestion that those who exhibit comparatively lower levels of self-control than their peers in early adolescence will remain so throughout life.
Recently, Ray and colleagues (2013) extended this literature by exploring the predictors of self-control trajectory group membership. After finding six developmental trajectories of self-control, Ray and colleagues explored the factors associated with membership in the groups defined by these patterns. The results of multinomial logistic regression analyses indicated that delinquent peer association, maternal attachment, parental criminality, and school commitment were significant indicators of group membership. Although this study advanced the literature by testing the predictors of membership in developmental trajectories of self-control, it did not explore factors influencing variation in self-control within these trajectories. Differences in aggregate self-control trajectories allow that the factors influencing change within these trajectories vary. Among groups showing stability in self-control, within-individual changes in self-control are likely attenuated and may largely be defined by factors that evince relative stability over time. Similarly, among groups showing substantial changes in self-control over time, within-individual changes in self-control may be more pronounced and influenced by factors that change substantially.
As studies have yet to directly test the predictors of variation in self-control within trajectory groups, support for such an exploration is necessarily indirect, but may be found in studies of offense trajectories. This can be seen in the work of Ray et al. (2013) who reviewed research showing criminogenic risk factors predict offending trajectories in support of inquiry into the manner in which these risk factors also explain differences in self-control trajectories (see Fergusson, Horwood, & Nagin, 2000; Nagin, 1999; van der Geest, Blokland, & Bijleveld, 2009; Weisner & Capaldi, 2003). Evidence on offense trajectories can be generalized somewhat to self-control development as risk factors associated with offending trajectories include factors that have been linked to self-control such as family environments and delinquent peers. Studies of offending trajectories also show that the risk factors that predict trajectory group membership also predict within group variation in offending and critically that the association between risk factors and offending varies across groups (see Blokland & Nieuwbeerta, 2005; Piquero, Brame, Mazerolle, & Haapanen, 2002). While the generalization of these results to patterns of self-control development should certainly be made with caution, these studies do show that the developmental processes associated with criminal behavior vary across trajectory groups and that the factors associated with this variation include factors associated with the development of self-control.
The potential policy implications of inquiry into differences in the factors associated with the development of self-control are much more straightforward. Understanding variation in the factors predictive of within-individual change in self-control may help to refine prevention efforts and support a focus on factors predictive of within-individual change in self-control among trajectory groups showing substantial change in self-control over time. With this in mind, the current study extends the literature on the causes of self-control by examining whether multiple trajectories of self-control exist and, if so, whether or not there are differences across these trajectories in the factors that are associated with variation in self-control.
Method
Data
Analyses utilize cohort data, extracted from the 2010 Korean Youth Panel Survey (KYPS). The KYPS was started in 2003 by the National Youth Policy Institute with the purpose of examining changes in a number of aspects of adolescent development including family, school, peer, and community characteristics, in addition to delinquency and victimization. To obtain a nationally representative sample, a stratified multistage cluster sampling design was employed. A total of 104 middle schools were randomly selected from 13 jurisdictions. Within each school, one second-grade class (eighth grade in the American educational system) was randomly chosen. After parents of potential survey respondents were provided with the purpose of the survey and information concerning confidentiality, the survey was conducted in the selected classrooms. Only students whose parents had given consent were surveyed. Parents of participating children were surveyed by telephone. Follow-up individual interviews were conducted over the next 5 years annually. A total of 3,449 students participated in the initial survey. Of students participating in the initial survey, 990 were excluded from analyses due to attrition (261, 171, 107, 189, and 262 at Waves 2, 3, 4, 5, and 6, respectively). A total of 231 cases had missing values imputed using Expectation Maximization (EM) in which the missing values were imputed with maximum likelihood (ML) values by using the information of means, variances, and covariances of the complete data. This method offers substantial improvements over traditional techniques (e.g., listwise deletion, pairwise deletion, and mean substitution; Dempster, Laird, & Rubin, 1977; Hair, Black, Babin, Anderson, & Tatham, 2006). After imputation of missing values, 2,459 students were included in the analyses. A t test was conducted to examine whether an individual’s self-control level influenced his or her participation in the follow-up survey. The results indicated no significant difference in self-control between students who remained in the current study (M = 19.96) and those who dropped out (M = 19.91).
Measures
Self-control
Self-control was measured with six items that tapped the dimensions of low self-control outlined by Gottfredson and Hirschi (1990). The specific items for this measure and for others included in the analyses are provided in Appendix A. Responses to the six items in the self-control measure were recorded on a 5-point Likert-type scale ranging from 1 (always) to 5 (never). Given the uniqueness of this measure and its centrality for our analyses, we conducted confirmative factor analyses (CFA) of self-control items with the ML estimator in Mplus 7.11. In this model, items for each wave loaded on a wave-specific latent self-control variable. The results showed that model fit indices were acceptable. In addition, all the factor loadings were statistically significant at p < .05, were of acceptable magnitude, and comparable with those of prior studies (Hair et al., 2006; Hay & Forrest, 2006; Schumacker & Lomax, 2004).
We also tested the invariance of the self-control measure across waves. Initial models tested metric invariance by comparing a model where factor loadings varied across time with a model where factor loadings were constrained to be equal across time. The difference in fit between the two models was not statistically significant at p < .05 (χ2 difference = 25.591, df difference = 20), demonstrating metric invariance. We then tested scalar invariance. The scalar invariance model was tested by constraining both the factor loadings and the intercepts of the indicators to be equal across time. The difference between the metric invariance and the scalar invariance models was statistically significant at p < .05 (χ2 difference = 683.834, df difference = 24), indicating that the measure of self-control lacked full scalar invariance. Based on prior research (Suh et al., 2016), we tested partial scalar invariance by constraining 17 intercepts to be equal and allowing 13 intercepts to vary across time. The partial scalar invariance model showed significant improvement in fit compared with the full scalar invariance model. Also, there was no significant difference between the metric invariance model and the partial scalar invariance model at p < .05 (χ2 difference = 16.828, df difference = 12), supporting partial scalar invariance. Additional CFAs were conducted for other measures. As with self-control, a single model using all waves of data was estimated for each variable. The results of the analyses are presented in Appendix B with specific fit statistics.
Parenting
Analyses included three measures of parenting, paralleling the aspects of parenting highlighted by Gottfredson and Hirschi (1990): attachment to parents (six items), parental monitoring (four items), and abuse (four items). Responses to items comprising the different parenting measures were all recorded on a Likert-type scale ranging from 1 (never) to 5 (always). Higher scores indicated greater attachment, more monitoring, and more severe abuse.
Other variables
Prior studies have shown that self-control is also influenced by aspects of schools, neighborhoods, and peer groups (Beaver, Wright, & Maume, 2008; Burt et al., 2006; Jo & Bouffard, 2014; Lynam et al., 2000; Meldrum, 2008; Meldrum & Hay, 2012; Meldrum et al., 2012; Pratt et al., 2004; Teasdale & Silver, 2009; Turner et al., 2005). Based on these findings, analyses included measures of attachment to teachers (three items), deviant peer affiliation (eight items), and neighborhood cohesion (four items). Responses to questions for attachment to teacher and neighborhood cohesion were recorded on a Likert-type scale ranging from 1 (never) to 5 (always). Higher scores indicated increased attachment to teachers and better relationships among neighbors. Responses to questions for the deviant peer affiliation measure were dichotomized (0 = none and 1 = one or more), with higher scores indicating stronger association with deviant peers. Analyses also included a measure of sex (0 = male and 1 = female) and the age of the participant at the beginning of the study (in years).
Statistical Method
The possibility that distinct trajectories of self-control development were present in the sample was tested with growth mixture modeling (GMM; Muthen, 2004; Muthen & Muthen, 2010). In GMM, individuals exhibiting similar intercepts and slopes are clustered into an unobserved group. Analyses are iterated by adding an additional group to the model, one at a time. The optimal number of groups is identified based on model fit indices that include the lowest value of Bayesian Information Criteria (BIC), significant p values of the Lo–Mendell–Rubin Likelihood Ratio Test (LMR-LRT) and the Bootstrap Likelihood Ratio Test (Bootstrap LRT), as well as usefulness and interpretability of latent trajectory classes (Connell & Frye, 2006; Hay & Forrest, 2006; Jung & Wickrama, 2008; Muthen & Muthen, 2010). Several limitations with this type of method have been identified. These include the influence of sample size and length of a study on results, the potential generation of fictitious groups, and the possibility that groups can obscure important individual variation, in particular, atypical cases diverging from the group or average pattern (Bushway, Sweeten, & Nieuwbeerta, 2009; Sampson & Laub, 2005; Sampson, Laub, & Eglleston, 2004; Skardhamar, 2010). However, researchers agree that these limitations can be alleviated when this technique is linked tightly with theories and research questions (Bushway et al., 2009; Hay & Forrest, 2006; Jo & Zhang, 2012; Kreuter & Muthén, 2008; Nagin & Odgers, 2010).
Hierarchical linear modeling (HLM) was used to explore the potential influence of parenting, school, peers, and neighborhoods on the development of self-control within trajectory groups. A separate HLM model was estimated for the members of each self-control trajectory identified in the GMM model. HLM models regressed self-control on both within-individual (or called time-varying) variables at Level 1 and sex and age (as between-individual or time-constant variables) at Level 2. To ensure that models had proper temporal ordering (that the potential causes of self-control came before self-control itself), time-varying independent variables (attachment to parents, parental monitoring, abuse at home, attachment to teachers, deviant peer affiliation, and neighborhood cohesion) were drawn from Wave 1 to Wave 5 while self-control was drawn from Wave 2 to Wave 6. Comparisons across the results of HLM models for the various self-control groups were used to explore potential differences across trajectory groups in the factors influencing the development of self-control.
Findings
Table 1 provides means and standard deviations of variables. Two interesting findings are noteworthy. First, the within-individual level of self-control was not stable but increased slightly. This gradual increase is consistent with Gottfredson and Hirschi’s (1990) argument that “self-control can increase over time due to unceasing socialization throughout life” (p. 107). The other interesting finding is that the increases in self-control were paralleled by increases in attachment to parents and parental monitoring. This suggests that change in self-control may stem from changes in these variables rather than changes in other variables showing different developmental patterns.
Descriptive Statistics (N = 2,459).

The summary of model fit indices from GMM models are provided in Table 2. Model generation stopped after the five-group model due to a lack of improvement between the four- and five-group models (i.e., the p value of LMR-LRT was higher than .05). The three-group model was selected as the best fitting model because it had the smallest BIC value and there was a significant improvement between the two- and three-group models (i.e., the p values of LMR-LRT and Bootstrap LRT were lower than .001). Among the possible three functions (i.e., linear, quadratic, and cubic) the model specifying the quadratic function provided a better fit to the data than the others. 1
Model Fit Index.
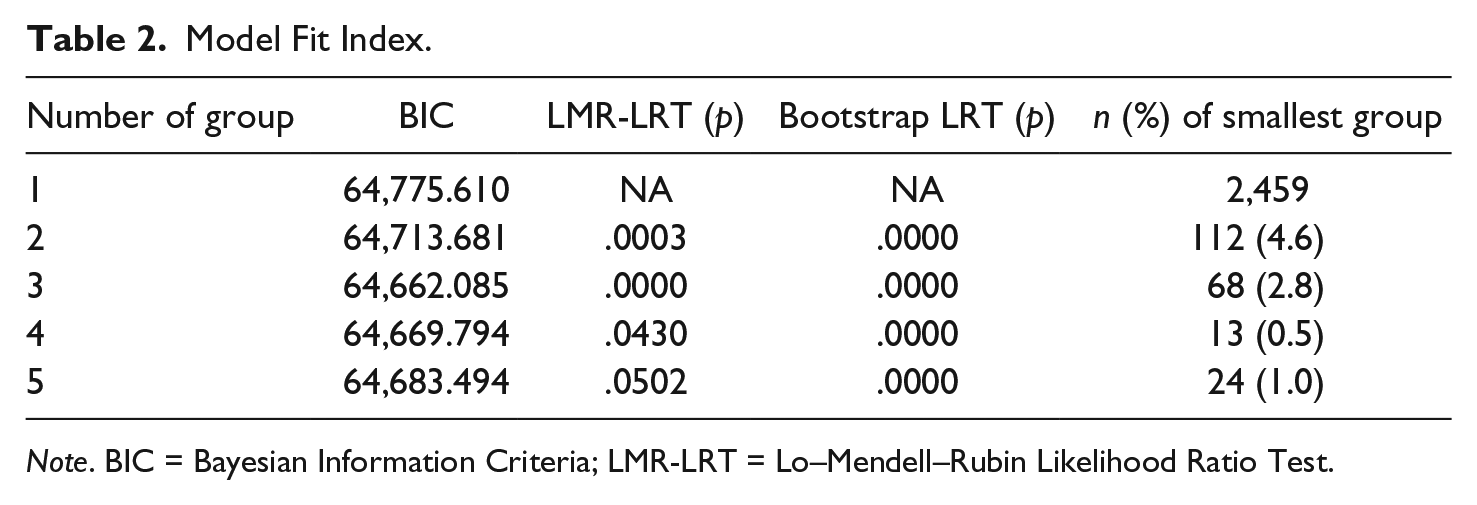
Note. BIC = Bayesian Information Criteria; LMR-LRT = Lo–Mendell–Rubin Likelihood Ratio Test.
The three groups identified in the GMM models are illustrated in Figure 1. Each group was named based on the initial level of self-control and pattern of change. The majority group, comprising 93.1% (n = 2,289) of the sample was named medium-stable. Its initial level of self-control fell in the middle among the three groups at a scale value of approximately 20 over the 5-year period. This group also showed relatively stable self-control scores. The next largest group was the low-increasing group. This group included 3.7% (n = 90) of the sample. This group began with the lowest level of self-control among the groups at age 15, but reached the highest level of self-control among the groups at age 19 (approximately a 43% increase). Finally, the smallest group made up 3.2% (n = 80) of the sample and was named the high-decreasing group. This group exhibited the highest initial level of self-control among the groups and exhibited a consistent decrease in self-control from age 15 to age 19 (approximately a 26% decrease).

Trajectories of self-control.
The size of the medium-stable group suggests that the majority of the sample does indeed share a common trajectory of self-control development. However, the low-increasing and the high-decreasing groups show that all individuals do not follow one homogeneous pathway of self-control development. The finding of multiple trajectories of self-control in the current analyses is consistent with the results of other recent research finding heterogeneity in trajectories of self-control development (Hay & Forrest, 2006; Higgins et al., 2009; Jo & Bouffard, 2014; Jo & Zhang, 2012; Ray et al., 2013; Vaske et al., 2012). The existence of multiple subgroups showing different developmental patterns indicates the factors influencing self-control may vary across subgroups.
Results for HLM models examining the influence of the independent variables on within-individual variation in self-control are presented in Table 3. The HLM model for the medium-stable group showed that subjects who had increased attachment to their parents, increased parental monitoring, and increased attachment to teachers showed increases in self-control from ages 15 to 19. In contrast, subjects who had more friends involved in deviant behaviors and were abused more often tended to have decreases in self-control during late adolescence. Across the factors associated with self-control, deviant peer affiliation had the strongest influence on self-control. Results also indicated that being female was associated with increased self-control while age was not related to change in self-control.
Hierarchical Linear Model Results.

p < .05. **p < .01. ***p < .001.
In the HLM model for the high-decreasing group, the only factor associated with self-control was deviant peer affiliation. In this group, the association between self-control and deviant peer affiliation indicates that those who had increased association with deviant peers experienced an accelerated decline in self-control relative to others in the group. Delinquent peers were also associated with self-control in the HLM model for the low-increasing group, as was abuse at home. In the low-increasing group, the association between affiliation with deviant peers and self-control indicated that the youths who showed increases in affiliation with deviant peers experienced decreases in self-control. In this group, abuse was also associated with decreases in self-control. Sex and age were not related to self-control development in either the high-decreasing group or the low-increasing group.
Discussion and Conclusion
The results of GMM analyses indicated the existence of three subgroups exhibiting different initial levels and different directional change in self-control over the follow-up period. It is noteworthy that the strong majority of the sample (93.1%) was in the medium-stable group. This group showed little change in self-control from ages 15 to 19. The existence of a large group with stable self-control scores is consistent with some of Gottfredson and Hirschi’s (1990) arguments regarding the development of self-control. Specifically, Gottfredson and Hirschi argued that self-control tends to become stable around ages 8 to 10 and remains stable between individuals thereafter. In contrast, the change in self-control seen in the high-decreasing and the low-increasing groups is inconsistent with Gottfredson and Hirschi’s arguments regarding the relative stability of self-control. The trajectories of these groups show that in the sample used in the current work, there were individuals who showed large increases in self-control (the low-increasing group) and individuals who showed large decreases in self-control (the high-increasing group) from ages 15 to 19.
The implications of the low-increasing group for Gottfredson and Hirschi’s (1990) prediction regarding the development of self-control are somewhat nuanced. There is some indication that self-control theory may be able to accommodate modest increases in self-control that are relatively equally distributed across a sample. Gottfredson and Hirschi provide for increases in self-control across the life-course when they suggest that “socialization continues to occur throughout life” (p. 107). This allows for some continued change in self-control as a product of socialization. However, this suggestion is not specific to a subset of individuals. Thus, the existence of a small group showing a large increase in self-control can be interpreted as inconsistent with Gottfredson and Hirschi’s predictions regarding the relative stability of self-control.
The finding of a group with high initial levels of self-control that decline rapidly from ages 15 to 19 contrasts sharply with Gottfredson and Hirschi’s arguments regarding the relative stability of self-control. In the original statement of their theory, the authors proposed that “individual differences in self-control are established early in life . . . and are reasonably stable thereafter” (Gottfredson & Hirschi, 1990, p. 177). In later work, they reemphasized the relative stability of self-control stating that, “differences [in self-control] observed at ages 8 to 10 tend to persist from then on. Good children remain good. Not so good children remain a source of concern to their parents, teachers, and eventually to the criminal justice system” (Hirschi & Gottfredson, 2001, p. 90). This suggests that groups of individuals should not manifest large increases or decreases in self-control, such as those present in the current work and in prior studies (Hay & Forrest, 2006; Higgins et al., 2009; Jo & Bouffard, 2014; Jo & Zhang, 2012; Ray et al., 2013; Vaske et al., 2012).
Studies showing that there are groups that experience substantial change in self-control imply that self-control might be more malleable than Gottfredson and Hirschi’s insist. Schmeichel and Baumeister (2004) offered an alternative model for relating differences in self-control to antisocial behavior that is more consistent with changes in self-control over time. According to Schmeichel and Baumeister’s (2004) self-regulatory strength model, an individual’s ability to exercise self-control is dependent on the availability of resources. For example, self-control within a child might decrease when the child faces a stressful situation, which requires considerable resources. Steady increases in life stress over time may then lead to decreases in the tendency to exercise self-control. Within this framework, the downward trajectories of self-control development seen in the current results and in earlier work may be driven by stressors such as deteriorating relationship with parents and certain aspects of peer relationships and community environments. Similarly, decreases in stress including improved family or peer environments may lead to increases in the capacity to exercise control. Over time, these improvements may lead to the increases in self-control development manifest in the low-increasing group in the current work and in groups showing increased self-control found in other work (e.g., Hay & Forrest, 2006).
In the current study, the potential influence of family, school, peer, and neighborhood variables on self-control was studied with a series of HLM models. For the large medium-stable group, these models showed that all parenting measures, including attachment to parents, parental monitoring, and abuse at home, were significantly related to self-control in the expected direction. In the medium-stable group, deviant peer affiliation and attachment to teachers were also related to self-control, with deviant peer affiliation associated with decreases in self-control and attachment to teachers associated with increases in self-control. The relationship between parenting measures and self-control in this group is consistent with Gottfredson and Hirschi’s (1990) contention that parenting is a major source of self-control, but suggests that the influence of parenting on variation in self-control continues throughout adolescence. The continued influence of parenting on self-control during ages 15 to 19 is indirectly anticipated by Gottfredson and Hirschi’s suggestion that “socialization continues to occur throughout life” (p. 107). However, should the association between parenting and self-control lead to overlap in individual self-control trajectories, this would be inconsistent with Gottfredson and Hirschi’s arguments regarding the relative stability of self-control. In the HLM model for the medium-stable group, attachment to teachers also had a statistically significant association with self-control. This association is consistent with Gottfredson and Hirschi’s suggestion that the school may influence the development of self-control when school contributions to socialization are supported by parents. Significant school effects on self-control echo those found in earlier work (Beaver, Wright, & Maume, 2008; Burt et al., 2006; Cullen et al., 2008; Jo & Bouffard, 2014; Meldrum, 2008; Turner et al., 2005).
In HLM models, deviant peer affiliation proved to be a strong and consistent predictor of self-control across all groups. This finding is consistent with a number of prior studies showing peer influences on self-control (Burt et al., 2006; Meldrum, 2008; Meldrum & Hay, 2012; Meldrum et al., 2012). The implications of these results for specifications of the development of self-control must be drawn with caution. Significant coefficients show that a given factor is associated with within-individual variation in self-control among group members. Thus, these factors may be unrelated to trends at the aggregate group level. Nonetheless, these models show that deviant peer affiliation may be important for explaining changes in the exercise of self-control during adolescence. To the extent that the association between delinquent peers and self-control results in substantial changes in self-control, this association is inconsistent with Gottfredson and Hirschi’s (1990) argument that once established in early adolescence, between-individual differences in self-control remain stable. Furthermore, any association between deviant peer affiliation and self-control is directly inconsistent with Gottfredson and Hirschi’s argument that peers do not exert a meaningful influence on self-control development. The association between deviant peer affiliation and self-control is readily accommodated within the Schmeichel and Baumeister (2004) model of self-regulation mentioned earlier. In this model, increases in deviant peer affiliation may result in a decreased capacity for self-regulation. Explained within the Schmeichel and Baumeister (2004) model, the impact of deviant peer affiliation on self-control may underpin both the causal influence of delinquent peers on criminal and delinquent behavior and potentially the tendency of delinquents to self-select into delinquent peer groups. Of these, the first seems more plausible. When it leads to reductions in self-control, deviant peer affiliation may lead to additional criminal and delinquent behavior. Alternatively, it is possible that the influence of deviant peers on self-control may lead to self-selection based on the broad behavior tendencies resulting from low self-control rather than just criminal and delinquent behavior itself.
Beyond the theoretical implications discussed above, the current results also have policy implications. Variation in trajectories of self-control development and in the factors influencing self-control lead to the possibility that effectiveness of programs aimed at reducing or preventing crime by increasing self-control is contingent on targeting the factors associated with a specific individual’s self-control development. This challenges the notion of a one-size-fits-all approach to self-control development and indicates that a consideration of the etiology of self-control within an individual may help to craft an individualized treatment program. The current study shows that abuse in the home was associated with decreased self-control among youths whose initial self-control was comparatively much lower than other youths. In this case, a focus on resolving verbal and physical conflicts between parents and a child may be critical to self-control development among those who are particularly low in self-control. We also find that delinquent peers are a consistent predictor of within-individual variation in self-control. This suggests that programs designed to address control-related process with a direct focus on emotional and cognitive development may benefit from a further consideration of the peer environments in which these processes unfold (i.e., the Providing Alternative THinking Strategies [PATHS] program, Greenberg, Kusche, & Mihalic, 1998). Differences in trajectories of self-control and differences in the factors influencing the development of self-control within trajectories may also help to explain inconsistencies in the findings of research on effectiveness of programs in improving self-control (Hay, Meldrum, Forrest, & Ciaravolo, 2010; Mitchell & MacKenzie, 2006; Na & Paternoster, 2012).
Three methodological features of the current study condition its theoretical and policy implications. The first is a lack of control for the influence of heritability on self-control. The lack of controls for heritability suggests that the substantive findings of the current work may not hold should the influence of heritability be accounted for. In particular, accounting for heritability may attenuate the association between the factors influencing self-control and self-control itself. The second methodological consideration relative to the weight given the current results is the lack of full measurement invariance across time for the self-control measure. We were able to demonstrate full metric invariance but the indicators that comprised our measure only had partial scalar invariance. Here, partial scalar measurement invariance indicates that some of the changes in self-control seen over time may be driven by change in the way in which sample members respond to questions about self-control net of any real difference in self-control itself. Although there is some suggestion in the literature that partial scalar invariance can be acceptable, this nonetheless remains an important limitation of the current work (Suh et al., 2016). Future studies exploring the development of self-control may build on the current work by paying careful attention to the measurement of self-control over time.
The third methodological feature of the current study that is key for a consideration of the implications of study results is the South Korean sample. This sample is an advantage in that it allowed a test of the generalizability of the results of earlier research based on North American samples. The results of the current work show that many of the basic findings from earlier studies of the development of self-control do generalize to the South Korean culture. Specifically, the current work joined studies showing multiple trajectories of self-control development in North American samples (Hay & Forrest, 2006; Higgins et al., 2009; Ray et al., 2013). The current work is also consistent with studies based on North American samples that show that self-control is influenced by parenting, peers, and schools (Beaver, Wright, DeLisi, & Vaughn, 2008; Burt et al., 2006; Meldrum, 2008; Meldrum & Hay, 2012; Meldrum et al., 2012). Despite this consistency, it is possible that the results of the current work, in particular the strong influence of parenting on self-control development, were influenced by the unique nature of the sample. In South Korea, it is a priority for a family to provide their child with the best education possible. This priority is driven by the association between academic success, social status, and financial success (Morash & Moon, 2007). It is common for parents to start planning academic-based extra curriculum even before their child enters an elementary school. Parents are also inclined to move to a school district in top ranking and to let the child study abroad when he or she is very young. It is not an exaggeration to say that parents sacrifice everything they have, such as time, money, and their lives for their child’s academic success. It is possible that parental effects on self-control will be magnified in a culture that supports such parental commitment to children’s development.
In conclusion, the current study provides mixed results relative to Gottfredson and Hirschi’s (1990) predictions regarding the development of self-control. Results inconsistent with Gottfredson and Hirschi’s theory include multiple trajectories of self-control development and evidence that within these trajectories the factors influencing self-control vary somewhat and include peers and schools in addition to parents. The current results are partially consistent with self-control theory in that, for the majority of sample members, self-control evidenced relative stability and was influenced by parenting variables. These results suggest that models of self-regulatory influences on antisocial behavior that not only emphasize the relative stability in self-control but also allow for some change may be preferable to those that over-emphasize stability. These results also show that while parents are clearly very important in the development of self-control, peers also exert a nontrivial influence on self-control. Future work should continue to explore the developmental trajectories of self-control and the factors influencing changes in self-control within these trajectories. This work should pay particular attention to nature of the association between these factors and self-control and attempt to disentangle proximal influences on the exercise of self-control relative to more enduring influence on self-control as a trait associated with the ability to delay gratification, ignore the temptation of the moment, and pursue long-term courses of action.
Footnotes
Appendix
The Results of Confirmatory Factor Analyses.

| 2003 | 2004 | 2005 | 2006 | 2007 | 2008 | |
|---|---|---|---|---|---|---|
| Self-control | ||||||
| Item 1 | NA | 0.52 | 0.52 | 0.53 | 0.54 | 0.55 |
| Item 2 | NA | 0.43 | 0.43 | 0.44 | 0.44 | 0.45 |
| Item 3 | NA | 0.53 | 0.54 | 0.54 | 0.53 | 0.54 |
| Item 4 | NA | 0.54 | 0.55 | 0.54 | 0.55 | 0.58 |
| Item 5 | NA | 0.50 | 0.50 | 0.49 | 0.49 | 0.50 |
| Item 6 | NA | 0.53 | 0.54 | 0.54 | 0.54 | 0.55 |
| RMSEA = 0.04, CFI = 0.96, TLI = 0.95 | ||||||
| Attachment to parents | ||||||
| Item 1 | 0.68 | 0.72 | 0.69 | 0.67 | 0.71 | NA |
| Item 2 | 0.58 | 0.64 | 0.63 | 0.63 | 0.64 | NA |
| Item 3 | 0.67 | 0.73 | 0.74 | 0.75 | 0.73 | NA |
| Item 4 | 0.72 | 0.77 | 0.79 | 0.81 | 0.80 | NA |
| Item 5 | 0.72 | 0.73 | 0.75 | 0.79 | 0.82 | NA |
| Item 6 | 0.81 | 0.81 | 0.84 | 0.84 | 0.86 | NA |
| RMSEA = 0.05, CFI = 0.96, TLI = 0.95 | ||||||
| Parental monitoring | ||||||
| Item 1 | 0.79 | 0.79 | 0.83 | 0.84 | 0.84 | NA |
| Item 2 | 0.82 | 0.83 | 0.85 | 0.86 | 0.87 | NA |
| Item 3 | 0.82 | 0.84 | 0.85 | 0.85 | 0.88 | NA |
| Item 4 | 0.63 | 0.69 | 0.69 | 0.69 | 0.72 | NA |
| RMSEA = 0.03, CFI = 0.99, TLI = 0.98 | ||||||
| Abuse at home | ||||||
| Item 1 | 0.67 | 0.73 | 0.81 | 0.76 | 0.75 | NA |
| Item 2 | 0.72 | 0.81 | 0.73 | 0.84 | 0.84 | NA |
| Item 3 | 0.71 | 0.79 | 0.81 | 0.73 | 0.80 | NA |
| Item 4 | 0.58 | 0.70 | 0.72 | 0.70 | 0.72 | NA |
| RMSEA = 0.05, CFI = 0.97, TLI = 0.96 | ||||||
| Attachment to teacher | ||||||
| Item 1 | 0.59 | 0.60 | 0.61 | 0.67 | 0.69 | NA |
| Item 2 | 0.81 | 0.81 | 0.78 | 0.84 | 0.86 | NA |
| Item 3 | 0.65 | 0.66 | 0.70 | 0.71 | 0.74 | NA |
| RMSEA = 0.02, CFI = 0.99, TLI = 0.99 | ||||||
| Deviant peer affiliation | ||||||
| Item 1 | 0.75 | 0.81 | 0.85 | 0.83 | 0.88 | NA |
| Item 2 | 0.86 | 0.90 | 0.92 | 0.90 | 0.94 | NA |
| Item 3 | 0.86 | 0.88 | 0.85 | 0.82 | 0.84 | NA |
| Item 4 | 0.91 | 0.96 | 0.93 | 0.93 | 0.92 | NA |
| Item 5 | 0.79 | 0.85 | 0.86 | 0.87 | 0.81 | NA |
| Item 6 | 0.85 | 0.87 | 0.84 | 0.84 | 0.90 | NA |
| Item 7 | 0.90 | 0.91 | 0.86 | 0.85 | 0.88 | NA |
| Item 8 | 0.78 | 0.80 | 0.74 | 0.72 | 0.85 | NA |
| RMSEA = 0.03, CFI = 0.97, TLI = 0.97 | ||||||
| Neighborhood cohesion | ||||||
| Item 1 | Not available | 0.75 | 0.68 | 0.72 | 0.75 | NA |
| Item 2 | Not available | 0.79 | 0.73 | 0.74 | 0.76 | NA |
| Item 3 | Not available | 0.68 | 0.77 | 0.86 | 0.88 | NA |
| Item 4 | Not available | 0.54 | 0.60 | 0.63 | 0.70 | NA |
| RMSEA = 0.05, CFI = 0.98, TLI = 0.97 | ||||||
Note. RMSEA = root mean square error of approximation; CFI = comparative fit index; TLI = Tucker–Lewis index.
Declaration of Conflicting Interests
The author(s) declared no potential conflicts of interest with respect to the research, authorship, and/or publication of this article.
Funding
The author(s) received no financial support for the research, authorship, and/or publication of this article.