




Abstract
Using telephone survey data collected in Houston, Texas, this study explores the feasibility of a dual-frame (landline and cell-phone-only household samples) design survey in police studies and compares the corresponding characteristics of survey respondents and multiple measures of citizens’ attitudes toward the police. It was found that a cell-phone interview with the same scope and length of a landline interview is indeed operationally feasible, albeit at higher cost and lower response rate. Compared with their landline counterparts, respondents in our cell-phone-only sample are younger, males, members of ethnic minority, renters, mobile, and less educated. No appreciable attitudinal differences among the respondents are observed between the two samples. In addition, substantive outcomes from multivariate regression models do not seem to be impacted by the types of phones used. Implications for future studies are included.
Keywords
Public opinions play a crucial role in informing government policies and keeping government officials in check. This statement is particularly applicable to the American police organizations—the most visible public agency entrusted to protect and serve and empowered to use force, even deadly force (Bittner, 1972). Since the endemic urban disturbances and riots of the late 1960s, police departments in the United States have consistently used public opinion surveys as an important means to gauge public attitudes toward the police (PATP; Brown & Benedict, 2002). Though systematic reviews of the literature have been conducted to summarize the important empirical findings from these public opinion surveys aiming at revealing how Americans perceive their local police (Brown & Benedict, 2002; Decker, 1981; Peck, 2015), little attention has been paid to the issues surrounding specific survey methods used to study PATP (Ballard & Prine, 2002). From a methodological standpoint, telephone survey has become the prominent data collection method for policing scholars and practitioners, surpassing the applications of face-to-face interview, self-administered survey (e.g., mail survey or online/web-based survey), and systematic social observations. This is largely due to its reasonable cost, limited time commitment, and greater control over data collection.
When conducting public opinion surveys by telephone, coverage bias has been a recurring concern for researchers. More specifically, coverage bias refers to the inherited biases in the selection of a sampling frame due to considerations of demographic and economic factors (Blumberg & Luke, 2007). A commonly used procedure to address a potential coverage bias is random selection of a sample from a known population (Groves, 1989). In this regard, most of the studies on PATP have utilized randomization procedure either in telephone interviews or mail surveys (Correia, Reisig, & Lovrich, 1996; Frank, Smith, & Novak, 2005; O’Connor, 2008; Sims, Hooper, & Peterson, 2002). The usage of mail surveys utilized to study PATP has changed little since the introduction of Dillman’s method in 1978. In contrast, the threat of coverage bias has plagued telephone survey historically. This type of bias is primarily attributed to the underrepresentation of the disadvantaged households without a telephone (Lucas & Adams, 1977).
Issues concerning coverage bias in telephone survey have resurfaced recently due to the ever-increasing popularity and ownership of cell phones. In several related social science disciplines, scholars have taken notice of the fact that nearly one-half of American homes (48.3%) had only cellular/mobile phones during the second half of 2015 (Blumberg & Luke, 2016). According to the National Center for Health Statistics, 44.1% of the adults in the Houston metropolitan area live in wireless-only households between July 2011 and June 2012 (Blumberg, Ganesh, Luke, & Gonzales, 2013). Different from the coverage bias of landline phones during the 1960s (i.e., exclusion of the minorities and the poor who could not afford a telephone), the current cell-phone-only households tend to be young (e.g., college students), Hispanics, and renters (Blumberg & Luke, 2016; Ehlen & Ehlen, 2007). If change has been a reoccurring theme of telephone survey research since the 1940s, it is upon us to embrace yet another change due to rapid technological innovations. With the introduction of the smartphone, it seems reasonable to speculate that more households will switch to be cell-phone-only in the next decade (Peytchev & Neely, 2013). In our view, the possible coverage bias issue involved in the traditional landline Random Digit Dialing (RDD) telephone survey is a topic long overdue that needs to be taken seriously. To the best of our knowledge, however, no study on PATP has taken into consideration the possible coverage bias against this ever-increasing population of cell-phone-only households.
The purpose of this study is to investigate the possible differences in PATP by comparing landline-phone and cell-phone-only samples. More specifically, we attempt to answer the following questions: (a) Is it feasible to conduct a dual-frame telephone survey that includes both landline and cell-phone-only samples to learn about PATP? (b) Are there differences in the demographics between randomly selected cell-phone-only respondents and their landline counterparts? (c) Are cell-phone-only respondents’ attitudes toward the police significantly different from those of the landline respondents? and, (d) Do choices of the type of phone used (i.e., cell phone or landline) influence the outcome of PATP in multivariate analysis? Data used in this study were collected in 2012 from a dual-frame random telephone survey in Houston, Texas. The first sample includes residents who have a landline phone at the time of the survey, whereas the second sample is composed of cell-phone-only users.
Literature Review
A Brief History of Citizen Surveys in the Studies of PATP
Studies of PATP can be traced back to 1935 when Bellman (1935) developed the so-called “Police Service Rating Scale.” It contained 685 specific items, ranging from selection of police chiefs; to selection, training, and promotion of police personnel; to rating of different police divisions. The instrument, however, was designed to be filled out by expert police analysts only, not the general public. Parratt (1937) criticized Bellman’s approach and proposed an alternative performance measurement system involving the use of citizen surveys to measure “citizen approval-disapproval” of the police. Since the reports by the President’s Commission on Law Enforcement and the Administration of Justice in the late 1960s and the 1970s, citizen surveys have become an important instrument used by police departments nationwide. The 1970s witnessed major growth of public opinion surveys as a standard research tool for police researchers (Maguire, 2005). According to the Bureau of Justice Statistics, 30% of the local police departments conducted citizen surveys in 1997 and 22% conducted such surveys in 2003 (Hickman & Reaves, 2006). The percentage of surveys conducted has increased rapidly in recent years, especially for the large police agencies. For instance, in the year of 2007, 65% of the police departments serving 250,000 to 999,999 residents surveyed citizens in their jurisdiction on topics related to crime, fear of crime, or satisfaction with police services (Reaves, 2010). There are good reasons to believe that more law enforcement agencies will incorporate citizen surveys into their administrative routine as police-community relations have gained prominence on the heels of recent incidences of social unrest and protests triggered by police-related actions in major U.S. cities.
Six data collection methods are identified to study PATP, including telephone interview (e.g., Hawdon & Ryan, 2003; Nofziger & Williams, 2005; Sprott & Doob, 2009; Xu, Fiedler, & Flaming, 2005; Zhao, Tsai, Ren, & Lai, 2014), mail survey (e.g., Cao, Frank, & Cullen, 1996; Haberman, Ratcliffe, Groff, & Sorg, 2016; Maxson, Hennigan, & Sloane, 2003; Ren, Cao, Lovrich, & Gaffney, 2005; Skogan, 2005), group administration in fixed settings (e.g., in classrooms or police-sponsored community meetings; Lee & Zhao, 2016; Wu, Lake, & Cao, 2015), face-to-face interview (e.g., Jesilow, Meyer, & Namazzi, 1995; Payne & Gainey, 2007; Ren, Zhang, Zhao, & Zhao, 2016; Skogan, 2009), Internet/online/web-based survey (e.g., Ballard & Prine, 2002; Lee & Gibbs, 2015; Weitzer & Tuch, 2005), and systematic social observations by trained researchers (e.g., Dai, Frank, & Sun, 2011). While telephone survey is considered the most frequently used method in social science due to its computer assistance feature and many other advantages, face-to-face interview and direct observations are the least popular due to time and/or money constraints, and both mail survey and Internet/online/web-based survey often encounter problems of low response rates (Babbie, 2009; Ballard & Prine, 2002; Fowler, 2014). There is no exception to the popularity of telephone surveys in the area of PATP. For example, in a recent systematic review of police-led interventions that sought to enhance public perceptions of police legitimacy, Mazerolle, Bennett, Davis, Sargeant, and Manning (2013) did a thorough search by using six electronic databases (CSA, Informit, Ingenta Connect, Ovid, Proquest, and Web of Knowledge) and two library catalogues (National Police Library and the Cambridge University Library). Among 963 unique studies on PATP generated by the systematic search, 30 studies were identified as eligible for meta-analysis, containing 41 independent evaluations conducted in the time frame from 1987 to 2009. Of those, approximately half used telephone survey to collect information concerning respondents’ attitudes toward the police (Mazerolle et al., 2013).
Cell-Phone-Only Households
Groves (2011) identifies three distinct stages of development for telephone survey research, namely, 1930-1960, 1960-1990, and 1990 and forward. 1 Throughout each era, survey research methods “adapted to changes in society and exploited new technologies when they proved valuable to the field” (Groves, 2011, p. 861). In the third era from 1990 to the present, the traditional telephone survey frames have declined in coverage mainly due to the emergence of new phone technology, the rise of cell phone use and cell-phone-only households (Groves, 2011). While residents have ability to screen calls from numbers they do not recognize with the assistance of new phone technology such as caller ID, the fast growth of the cell-phone-only segment has posted a serious challenge to the ability of researchers to reach representative samples of the U.S. public via only landline-based telephone surveys (Ehlen & Ehlen, 2007; Guterbock, Diop, Ellis, Holmes, & Le, 2011).
There is consistent evidence to suggest that cell-phone use is indicative of a certain lifestyle and demographic characteristics (Ansolabehere & Schaffner, 2010). Dutwin, Keeter, and Kennedy (2010), for example, noted that “age is the most conspicuous difference between cell-only users and others” (p. 311). In comparison with the landline households, those who live in cell-phone-only households tend to be younger. Recent national estimates suggest that approximately two thirds or more adults aged 18 to 24 (61.1%), 25 to 29 (72.6%), and 30 to 34 (69.0%) live in households with only wireless telephones. The corresponding numbers are noticeably lower for adults aged 45 to 64 (41.2%) and 65 and over (20.5%; Blumberg & Luke, 2016).
It is well documented that one’s willingness to rely exclusively on cell phones is a reflection of not only age, but also other socioeconomic factors such as race, gender, residential mobility, and indicator of family structure (Ansolabehere & Schaffner, 2010). Christian, Keeter, Purcell, and Smith (2010) found that their landline sample includes more Caucasians and non-Hispanics than the cell-only sample for the reason that Hispanic and African American respondents are likely to make up a larger share of the cell-phone-only population. For example, it is estimated that Hispanic adults (60.5%) are more likely than non-Hispanic White (44.0%), non-Hispanic Black (48.5%), or non-Hispanic Asian (48.4%) adults to be living in households with only wireless telephones (Blumberg & Luke, 2016). In addition, the findings from cell phone surveys reveal that males prefer to rely on cell phones more than their female counterparts. According to recent research, approximately six-in-10 cell-only adults are men (Christian et al., 2010). Moreover, cell-phone-only households are often single, have no children, and renters who are less rooted in their immediate community (Ehlen & Ehlen, 2007). In terms of economic status, adults living in poverty (64.3%) or near poverty (54.0%) were more likely than higher income adults (45.7%) to be living in households with only wireless telephones (Blumberg & Luke, 2016).
The demographic differences between landline and cell-phone-only populations discussed above bring both new challenges and opportunities for the research in PATP where race, age, and gender have already been identified as important predictors. For example, age is found to be positively correlated with ratings of police performance in the literature (Cao et al., 1996; Correia et al., 1996; Jesilow et al., 1995; Ren et al., 2005; Sampson & Jeglum-Bartusch, 1998; Sims et al., 2002; Stack & Cao, 1998; Webb & Marshall, 1995). Cao et al. (1996) argued that aging is a process that promotes conservatism and integration into the institutional order. Younger individuals perceive the police as authoritative figures attempting to restrict their independence, and as a result, they evaluate the police less favorably than their elders. Among the demographic variables, race has received the most attention in PATP literature. For example, African Americans are more likely to show less confidence in the police than their White counterparts (Cao et al., 1996; Carter, 1985; Correia et al., 1996; Gabbidon & Higgins, 2009; Peck, 2015; Weitzer & Tuch, 2005; Wu, Sun, & Triplett, 2009). Hispanic residents tend to rate local police departments somewhere in between Whites and African Americans (Cheurprakobkit, 2000; Reitzel, Rice, & Piquero, 2004; Schuck & Rosenbaum, 2005; Schuck, Rosenbaum, & Hawkins, 2008; Weitzer & Tuch, 2005, 2006). In contrast, Engel (2005) did not find ethnicity as a significant predictor of public perceptions of distributive and procedural justice (also see Weitzer & Tuch, 2006). In sum, given the demographic differences between landline and cell-phone-only populations, there is a good reason to hypothesize that these two segments of telephone survey may yield different ratings of the police.
Noncoverage Bias and the Dual-Frame Sample
The most serious problem associated with the ever-increasing use of cell phones in telephone survey research concerns the noncoverage bias/error when “some persons are not part of the list or frame (or equivalent materials) used to identify members of the population” (Groves, 1989). In his 2006 American Association for Public Opinion Research (AAPOR) Presidential Address, Cliff Zukin noted the growth of cell phone usage, particularly among young people, as creating a “serious coverage problem” and a “particular challenge” to the representativeness of industry-standard RDD samples (also see Keeter, 2006). Guterbock et al. (2011) echoed this concern that certain members of the study population have no chance to be interviewed because they are not in the sampling frame. In addition, nonresponse bias in RDD surveys may also grow if households with landline phones come to rely on cell phone for most of their calls (Brick, Dipko, Presser, Tucker, & Yuan, 2006).
A primary strategy developed to tackle this noncoverage bias is the use of a dual-frame sample of both landline and cell phone numbers. 2 A “dual-frame” sample that combines data from landline and cell samples to produce estimates is always considered an optimal solution to the problem of coverage bias, as the proportion of cell-phone-only households continues to increase (e.g., Blumberg & Luke, 2016; Brick, Brick, et al., 2007). Steeh (2004) pioneered a large-scale U.S. telephone survey that sampled from a frame of cell phone numbers. Her primary research focus was to examine the operational aspects and feasibility of interviewing on cell phones. Subsequently, Brick et al.’s (2006) study was one of the first rigorous attempts to evaluate the feasibility of the inclusion of surveying cell phone numbers. Similarly, Brick, Edwards, & Lee (2007) explored the practical possibility of conducting a lengthy survey interview on a cell phone given the fact that most cell phone surveys had to limit the length of the interview time to accommodate cell phone users. The Pew Research Center conducted 11 dual-frame surveys in 2009 and 2010 to gauge the possibility of coverage bias in landline surveys. The surveys covered public policy issues, personal and national economic ratings, foreign policy views, political attitudes, and religious and social values (Christian et al., 2010). The findings from these studies showed that cell-phone surveys were feasible, but were considerably more difficult and expensive than landline surveys.
There is little doubt that survey methodologists have made noticeable progress in examining the characteristics of the cell-phone-only population, minimizing the noncoverage bias, and exploring the feasibility of conducting dual-frame surveys. While dual-frame sample is increasingly used in telephone surveys in areas such as public health indicators and voting preferences, such practice has been lacking in studies on PATP—a key research area in policing. This study attempts to fill such a void by exploring the feasibility of dual-frame survey in the area of PATP. Previous research with the general public in the United States has produced mixed findings on political and social attitudes between the landline and cell phone populations. While there is evidence that cell-phone-only users are different attitudinally compared with landline-phone users especially among the young cohort (e.g., party affiliation, perceptions of discrimination, acculturation; for example, Dutwin et al., 2010), others suggested that attitudes and perceptions varied little regardless of whether a respondent was reached on a landline or a cell phone (Brick, Brick, et al., 2007; Keeter, Kennedy, Clark, Tompson, & Mokrzycki, 2007). Given the mixed literature in related social science disciplines, it is worth our attention to examine the differences in PATP between the landline and cell-phone-only samples.
Method
The Dual-Frame Sampling Design
Unlike any previous studies on PATP, a dual-frame sampling design (landline sample and cell-phone-only sample) was used to examine the differences between landline and cell-phone-only respondents in their respective perceptions of the police. The cell sample was screened so that only adults living in cell-phone-only households were interviewed. This procedure is used to avoid the noncoverage biases that might be associated with a landline-only sampling frame as discussed earlier. Both samples were drawn by a professional survey firm based in Arizona. The landline sample yielded 1,197 completed interviews, and the cell-only sample yielded 240 completed interviews. The sample sizes for both segments are determined by the dual considerations of the statistical power needed and the cost.
The landline sample was randomly selected from the residents aged 18 years and older who resided within the City of Houston in 2012. RDD and CATI technologies were used to facilitate the survey. RDD was list-assisted in that a listed landline telephone directory within the spatial boundary of the City of Houston was utilized to systematically exclude unlisted landline numbers. The survey documented the respondent’s residence with X and Y coordinates collected at the time of the survey. This information enables us to incorporate the geocoded data and survey-based perceptual and attitudinal data into a single dataset using the GIS software ArcGIS. The geocoded landline sample distribution of the 1,197 respondents is reported in a map in the Appendix. The survey respondents came from most areas of the City of Houston except for the airport (i.e., George Bush Intercontinental Airport in the north), lakes (i.e., Lake Houston in the northeast), and forested and recreational areas (i.e., in the west).
For this study, a comprehensive sampling frame for the selection of the cell-phone sample was first identified based on Houston area codes (281, 346, 713, and 832). It systematically excluded cell-phone-only users living in Houston with cell phone numbers from other areas of the country. Then all 1,000-series telephone blocks (e.g., 281-653-7xxx) dedicated to cellular devices was drawn. From the identified 1,000 series telephone blocks dedicated to cellular devices, a random sample of possible telephone numbers were generated. The sampling interval was calculated by dividing the universe of all possible numbers by the number of records desired, thus specifying the size of the frame subdivisions. At this point, the frame size was fixed and divided into equal-sized subsets of 10-digit numbers. The cell sample was loaded in a separate file from the landline sample and dialed manually by interviewers who were specifically trained in averting initial refusals which were known to be significantly higher among cell-phone respondents than their landline counterparts. A total of 240 cell-phone-only users residing in Houston were successfully surveyed over the phone by trained interviewers.
Data Collection
The telephone survey instrument includes a screener interview and an extended interview. When a potential respondent was contacted, she/he was first asked questions to determine study eligibility. The first screener verified that the person answering the telephone was at least 18 years old; she/he was also informed of the purpose of the survey and the nature of voluntary participation. The second screener concerned the geographic screening, that is, whether she/he resided within the City of Houston jurisdiction as this study specifically focused on citizens’ attitudes toward the Houston Police Department (HPD). For those who responded “No” to any of these questions, the interview was terminated. For the cell-only sample, one more screening question was added. Those who responded “Yes” to both the screening questions (age and residence) were asked whether they also had a landline telephone in their home or were cell-phone-only users. All of those who had only a cell phone were interviewed, whereas persons who had both types of telephones were excluded from the survey. The extended interview contained a wide range of questions about the perceptions of the police, neighborhood crime and disorder, victimization, and so on.
Data collection for the survey started on January 20, 2012 and ended on March 12, 2012. For both samples, one common survey instrument was used. Data were collected over the same time period by the same group of interviewers. The average time to complete an interview was about 15 to 20 min. The respondents residing in Spanish-speaking only households were provided with the opportunity to complete the interview in Spanish. Respondents who did not speak either English or Spanish were excluded from the study.
A total of 18,785 calls were made for the landline sample, among which there were 7,715 refusals (both explicit refusals to answer and telephone hang-ups) in the screener interviews (5,400 from the first screening question and 2,315 from the second question). For the cell-only sample, 9,959 calls were placed and 2,458 were categorized as refusals in the process of screening for age, Houston residency, and cell-phone-only household. Overall, 1,437 extended interviews were completed, with 1,197 from the landline sample and 240 from the cell-only sample. Taking into consideration the average number of callbacks, break-offs, partial interviews, and other miscellaneous calls, the overall cooperation rates for the extended interviews among the eligible respondents were 27% for the landline sample and 10% for the cell sample. Consistent with the findings in the relevant literature, cell-only sample had a much lower response rate than its landline counterpart (e.g., Link, Battaglia, Frankel, Osborn, & Mokdad, 2007; Steeh, 2004). The consistent decline in the response rates of landline telephone surveys (Battaglia, Link, Frankel, Osborn, & Mokdad, 2008) suggests that a substantial percentage of the population does not want to participate in any telephone survey, regardless of the study’s goals. There is no reason to think that respondents reached on cell phones should be any different. It is worthwhile to mention that, in our study, the cost per respondent for the cell-only sample was about three times higher than that of the landline sample. This is due to the increased number of ineligibles in the cell-only sample caused by geographic specificity of cell phone numbers and the need to hand dial cell-phone numbers whereas landline numbers are auto-dialed. 3
Measurement
Dependent variables
A total of 20 items were used to measure four core dimensions of PATP. While PATP is multifaceted and complex in its scope and measures, citizens’ procedural justice judgments about police actions have become the focal point of this conceptual framework since the introduction of Tyler’s (1988) process-based model of regulation. The notion of procedural justice in the context of policing captures the idea of “fairness of the process through which the police make decisions and exercise authority” (Sunshine & Tyler, 2003, p. 514). When the police make decisions fairly and treat citizens with dignity and respect (net of the actual outcome of the treatment), people are more likely to feel a sense of satisfaction and comply with the law represented by the police. Thus, the first variable was the perception of procedural justice consisting of five items intended to assess quality of treatment of the police (e.g., Bradford, Jackson, & Stanko, 2009; Van Craen & Skogan, 2014). Respondents were asked to rate the following statements using a Likert scale of values ranging from 1 = strongly disagree to 5 = strongly agree: the HPD’s officers are courteous, honest, respectful toward the people like me, fair, and communicate very well. The Cronbach’s alpha for the “procedural justice” scale is .89. The second dependent variable is police effectiveness gauged by 10 items that share the common trait of a specified geographic location (e.g., Brandl, Frank, Worden, & Bynum, 1994; Frank et al., 2005; Skogan, 2005). The respondents were asked to rate 10 items of the HPD dealing with crime and disorder in their immediate neighborhood in the past 12 months prior to the survey on a scale from 1 = very unsatisfied to 5 = very satisfied. These 10 items include (a) traffic law enforcement (e.g., DUI), (b) narcotics and drug enforcement, (c) responding to gang issues and graffiti, (d) responding to vandalism, (e) responding to prostitution, (f) responding to burglary, (g) responding to mental health consumers, (h) responding to calls for service, (i) police visibility, and (j) crime prevention efforts. It is important to note that trained interviewers were instructed to stress the neighborhood contexts (i.e., within two or three blocks of their residences) while interviewing the respondents for each of the aforementioned items. The Cronbach’s value of this scale is .89. In addition, two items were used to gauge public perception of HPD’s responses to citizen complaints. Respondents were asked to give their assessment on the following two statements: “I trust the Houston Police Department to investigate complaints against its own employees” and “The Houston Police Department investigates citizen complaints fairly,” using a scale ranging from 1 = strongly disagree to 5 = strong agree. The Cronbach’s alpha for the scale is .66. Finally, the fourth dependent variable included in the analysis concerns a citizen’s expectations of the future encounters with the police. The survey respondents were asked to rate the police in the following three hypothetical situations on a Likert-type scale ranging from 1 being very unsatisfied (or unprofessionally) to 4 being very satisfied (or professionally): “When or if you were to interact with police officers to receive service, how satisfied do you think you will be with their treatment of you?”, “When or if the police were to stop you, how professionally do you think you will be treated?”, and “When or if the police were to stop you, how satisfied do you think you will be with their treatment of you?” The Cronbach’s alpha of the scale is .84.
Independent variables
Eight explanatory variables were included in the analytical model to predict the variations in PATP. The first and the foremost variable is the phone type. It is a dichotomous variable with landline phone being coded as 0 and the cell-phone-only coded as 1. The second variable measures collective efficacy in a community given its important association with residents’ sense of cohesion in a community. Collective efficacy was originally developed by Sampson, Raudenbush, and Earls (1997, p. 921) suggesting that the “willingness and intentions to intervene on behalf of the neighborhood would be enhanced under conditions of mutual trust and cohesion.” This concept has since been used in subsequent studies by other scholars (e.g., Gibson, Zhao, Lovrich, & Gaffney, 2002). For example, Ren et al. (2005) found that collective efficacy is a robust predictor of citizen’s confidence in the police (also see Huebner, Schafer, & Bynum, 2004; Lai & Zhao, 2010). Four survey items derived from Sampson et al. (1997) were used in combination to measure this concept by asking: (a) “How likely are adults in your neighborhood to take responsibility for notifying the police about illegal activity occurring in this neighborhood?”; (b) “If there is a suspicious person hanging around your block, someone is likely to call the police,”; (c) “When you do a favor for a neighbor, can you generally trust the neighbor to return the favor?”; and (d) “If you were in need of help with your car stuck in front of your residence, how much faith do you have that your neighbors would come to your assistance?” Following the reasoning of Sampson et al. (1997) and Gibson et al. (2002), an index is formed by averaging the combination of the informal social control items, the social cohesion and interpersonal trust items. Higher scores indicate higher estimate of these four items. In addition, the measure was sufficiently consistent internally to warrant its use here (Cronbach’s α = .62).
The next variable being tested measures the degree of awareness of disorder present in a respondent’s immediate neighborhood. This variable is an additive index of perceptions of several types of disorder derived from previous studies (e.g., Cao et al., 1996; Scheider, Rowell, & Bezdikian, 2003). Respondents were asked to assess a number of disorder problems in their immediate neighborhood, including (a) people openly selling drugs; (b) drunk drivers on the road; (c) people drinking in excess in public; (d) prostitutes hanging out on the streets; (e) youth gangs are present; (f) people using illegal drugs; and (g) vandalism. For each of these types of disorder, respondents are asked to rate the problem on a scale ranging from 1 = no problem to 4 = serious problem. The Cronbach’s alpha of the index is .88.
Also included in the analysis were three variables measuring the contact with the police. It is well documented that recent contact with the police and associated experiences can influence a respondent’s rating of the police (Ren et al., 2005). Three dichotomous variables were created to measure the presence/absence and the nature of respondents’ contact with the police by asking the respondents two distinct questions: (a) During the past 12 months, have you had any contact with a Houston Police Department officer? (b) Was this contact initiated by the police? These two questions were converted into three dichotomous variables—namely no contact, voluntary contact (i.e., citizen-initiated contact), and involuntary contact (i.e., police-initiated contact) with the police. No contact experience was treated as a reference group in the analysis. Citizens’ voluntary contact with the police for information and assistance is usually associated with a positive effect on their attitude toward the police (Ren et al., 2005). In contrast, involuntary contact such as a traffic stop or reporting crime or victimization to the police is often associated with negative attitude toward the police (Reisig & Correia, 1997; Sprott & Doob, 2009; Zhao et al., 2014).
Finally, media portrayal of the HPD was included in the model pertaining to the perceptions of the fairness of media. Relevant research has consistently found that citizens can be heavily influenced by how the news media covers crime and how they report police stories (Chiricos, Eschholz, & Gertz, 1997; Graziano, Schuck, & Martin, 2010; Zhao et al., 2014). Consequently, residents’ evaluation of the police is significantly affected by media consumption and reaction to the “spin” applied, that is, news reported fairly or reported in a biased manner (Chermak & Weiss, 1997; McCorkle & Miethe, 2002). In this study, respondents were asked to rate the statement, “The Houston Police Department is portrayed fairly by the media” on a Likert-type scale ranging from 1 = strongly disagree to 5 = strongly agree.
Demographic variables
A number of demographic variables were included to compare the demographic differences between the landline sample and the cell-phone-only sample. Some of them were also included in the models of PATP. More specifically, seven demographic factors deserve attention here: gender, age, race/ethnicity, household income, education, type of residence, and length of residency. Gender was coded as 1 (male) and 0 (female). Age was measured by five categories: 1 (18-25), 2 (25 to 34), 3 (35 to 49), 4 (50 to 64), and 5 (65 and above). Race/ethnicity was measured as four dichotomous variables coded as White, African American, Hispanic, Asian, and Others. In the statistical analysis, the variable “White” was used as the reference group. Household income ranged from 1 (less than $30,000) to 4 ($70,000 and over). Education was coded as 1 (less than high school), 2 (high school or GED), 3 (training school certification), 4 (associate degree or some college), 5 (college graduate), and 6 (graduate or professional degree). Type of residence was a dichotomous variable, where owned house (single family home) was coded as 1 and rented residence (apartment, duplex, and others) as 0. Length of residency was measured by the number of years a respondent had been living in the neighborhood.
The purpose of the analysis is to determine whether there are substantive differences between the landline-phone users and cell-phone-only users regarding their attitudes toward the police. First, the differences and similarities in demographic characteristics between the landline and cell-only samples are described. Then, logistic regression analysis is employed to explore the significant predictors of cell-only status in the full sample. Using t tests and chi-square tests, the differences between the two samples in terms of substantive items that tap into attitudes and behaviors are examined. Finally, multivariate models were estimated to more precisely isolate differences in responses across the two different survey devices (i.e., landline and cell-only).
Findings
Who Are the Cell-Only Users?
Demographic composition of the landline and cell samples is reported in Table 1. Survey respondents reached by a landline are quite different in many demographic measures from those reached by a cell phone. Male respondents account for a larger proportion in the cell-only sample than those in the landline sample (56.7% vs. 46.4%). The most notable difference is that cell-only respondents are younger: 26.2% of cell-only users are younger than 25 years old, compared with just 5.9% among the landline respondents. Similarly, the 25 to 34 age group accounts for 30.4% in the cell-only sample, much higher than that in the landline sample (10.6%). In terms of the racial makeup, there are more Hispanics (44.2%) in the cell-only sample than in the landline sample (37.2%). While 34.5% of respondents in the landline sample identify themselves as Whites, only 26.7% of the cell-only users are White. One other notable difference between respondents in the two sampling frames is the education attainment. The cell-frame respondents are slightly more likely to have achieved an associate degree or attended some college (24.2% vs. 19.1%). However, close to 13% of respondents have graduate degrees in the landline sample in comparison with 5.8% in the cell-only sample. Significant differences are also observed in the type and length of residence. 71.4% of landline respondents are found to own a family house, compared with 56.2% of cell-only respondents. Landline respondents are also significantly more likely to have lived in their current residences longer than their cell-only counterparts (15.7 years vs. 7.0 years).
Demographic Composition of the Landline and Cell-Only Samples.
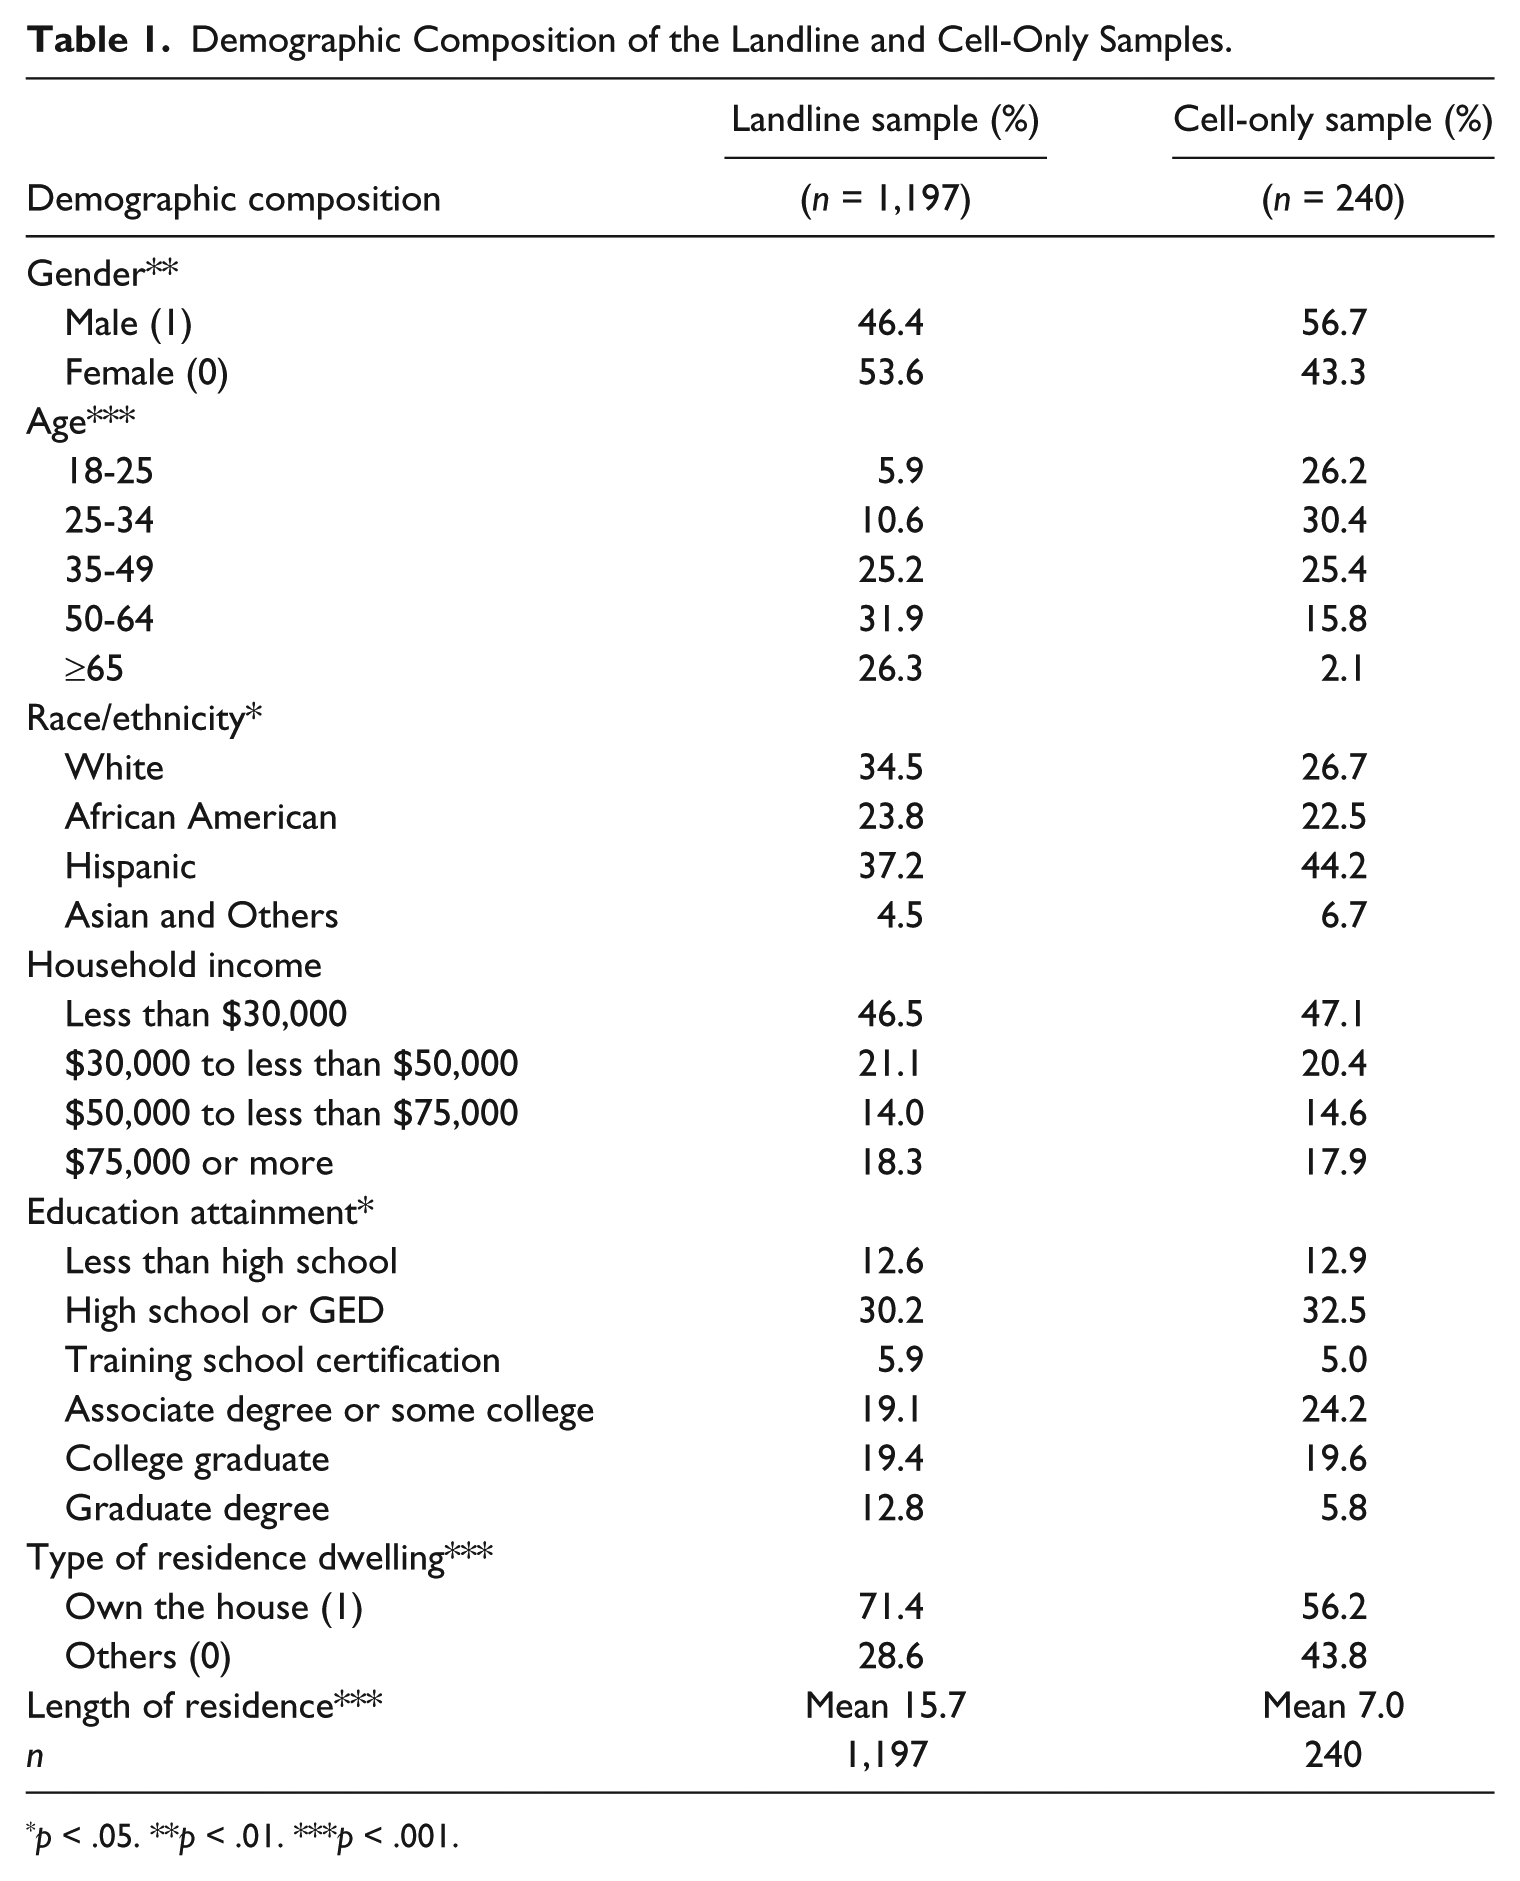
p < .05. **p < .01. ***p < .001.
The importance of demographics becomes abundantly clear upon estimating a Logit model that predicts cell-phone-only status as a function of gender, age, race, residential mobility, and other demographic factors. The results of the binomial logistic regression identified four important and statistically significant predictors of cell-phone users: gender, age, home ownership, and residential mobility (see Table 2). Consistent with previous studies predicting characteristics of cell-only households, the authors find that males, younger respondents, those who rent rather than own their residences, and those who have short tenure of residency are more likely to be living in cell-only households.
Logit Model Predicting Cell-Only Status (0 = Landline Phone; 1 = Cell Phone).
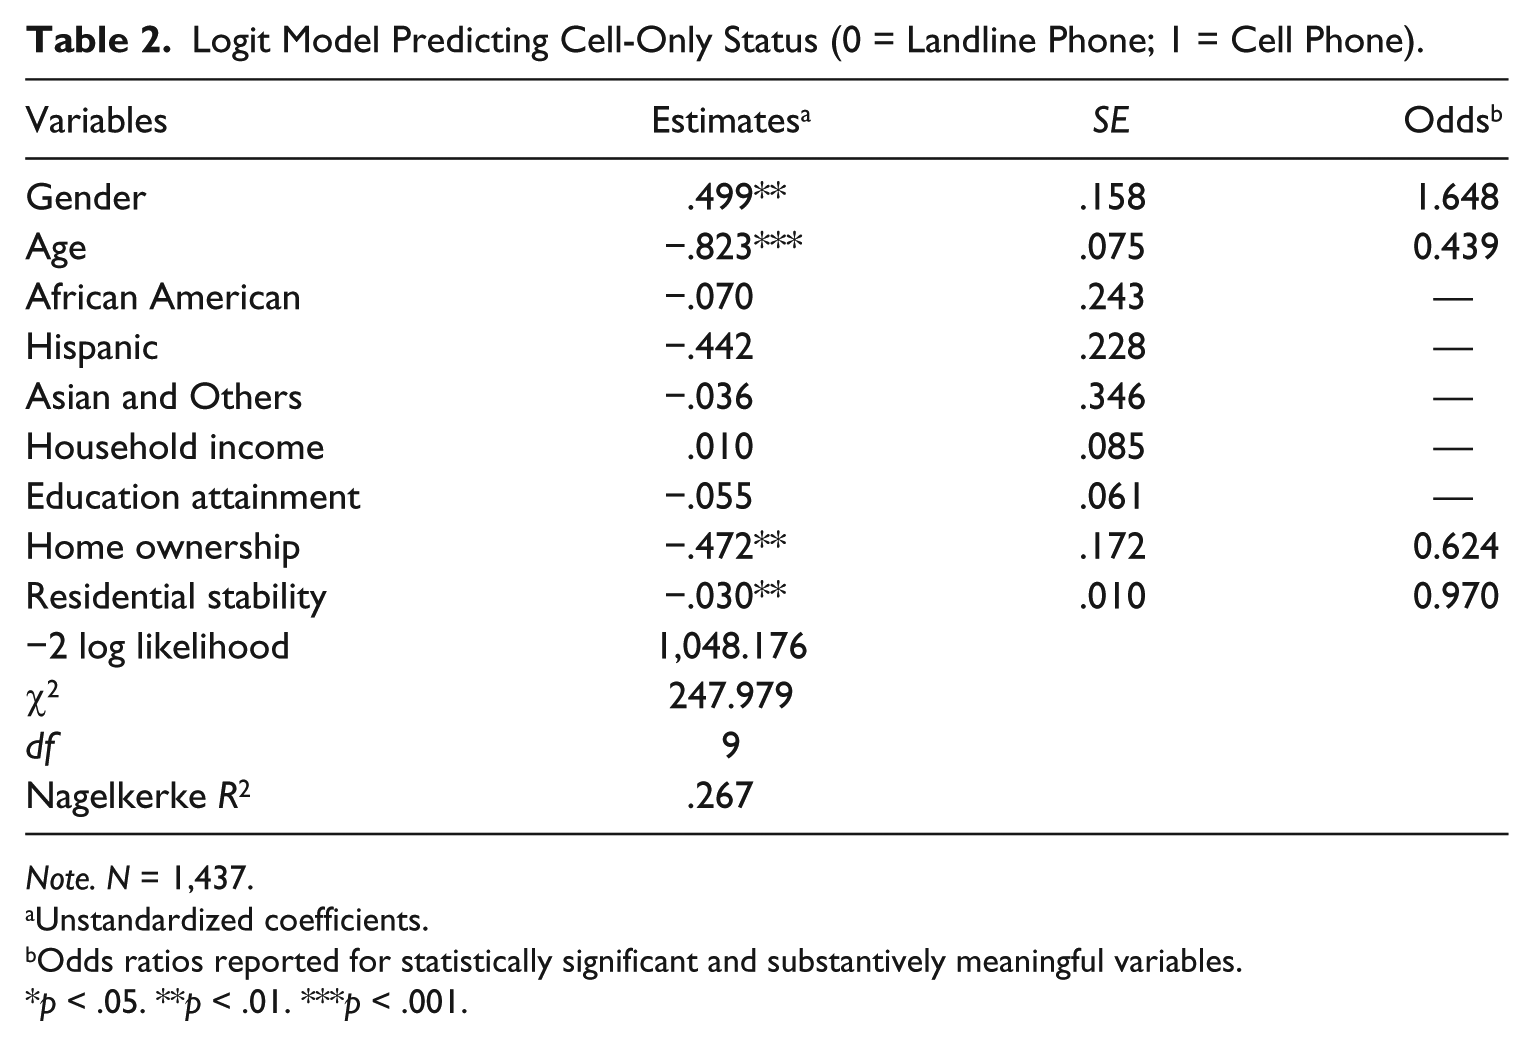
Note. N = 1,437.
Unstandardized coefficients.
Odds ratios reported for statistically significant and substantively meaningful variables.
p < .05. **p < .01. ***p < .001.
Public Attitudes Toward the Police Between Landline and Cell-Only Samples
Presented in Table 3 is a comparison between the landline and cell-only respondents on their respective attitudes and behaviors. A set of t tests are performed and no statistical significances are detected across all four measures of PATP, including the perceptions of procedural justice, police effectiveness in the immediate neighborhoods, perceptions of police response to citizen complaints, and expectations of police treatment of citizens. Similar results are found among the social correlates of PATP such as neighborhood disorder, contact with the police, victimization, and media portrayal of the police, with collective efficacy being the only exception. More specifically, the mean value of collective efficacy for the landline sample is statistically higher than that for the cell-only sample (i.e., 15.03 vs. 14.49). This difference, although statistically significant, is rather small substantively.
Attitudes and Perceptions by Sample.
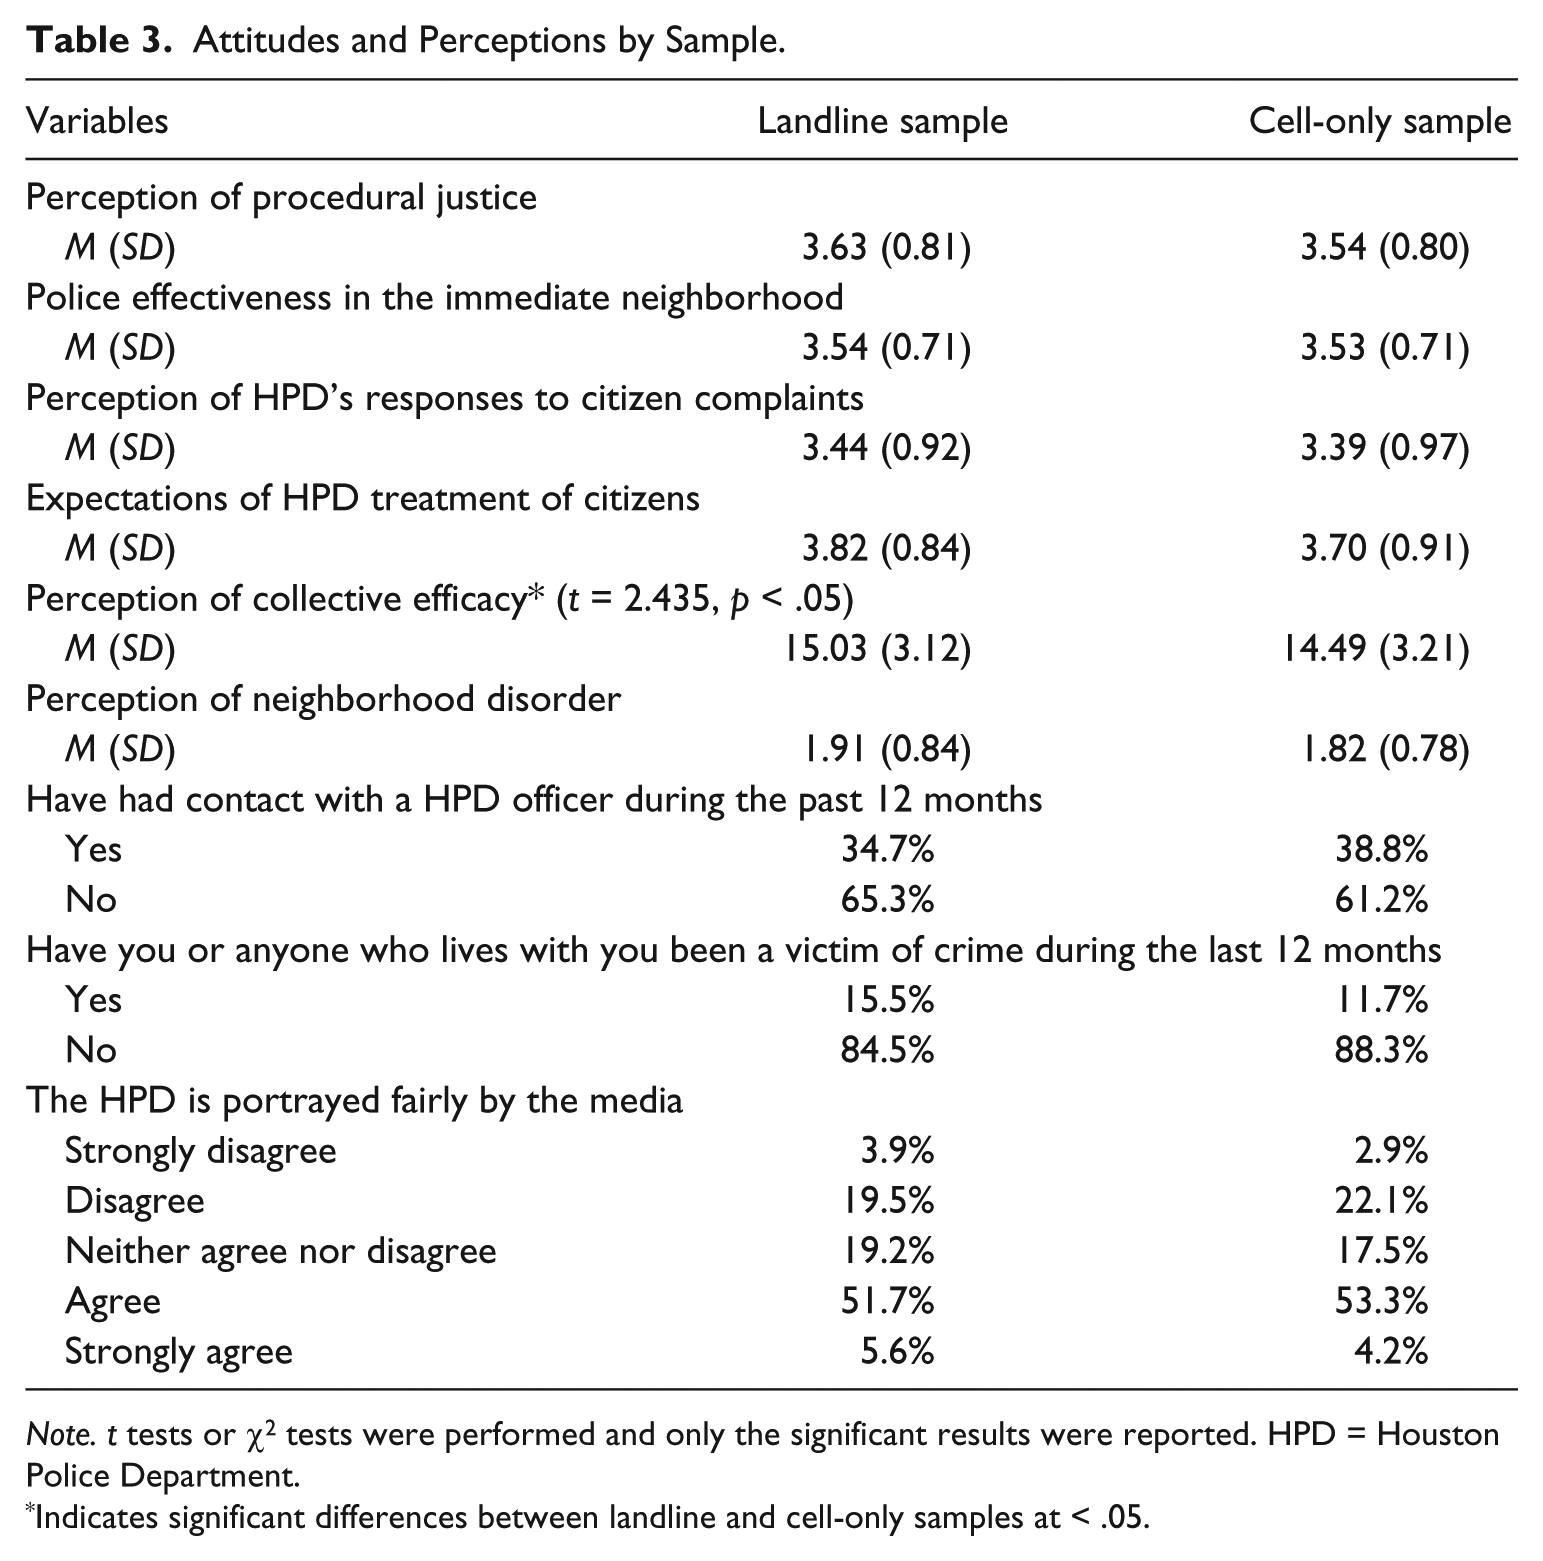
Note. t tests or χ2 tests were performed and only the significant results were reported. HPD = Houston Police Department.
Indicates significant differences between landline and cell-only samples at < .05.
The Phone Device Effect
The last step of our analysis examines whether the cell-phone-only status has an independent effect on PATP after controlling for other correlates and demographic factors. Four ordinary least squares (OLS) regression models are conducted using the blended sample and the results are displayed in Table 4 with the standardized regression coefficients reported. It is obvious that cell-phone-only status does not exert a significant effect on any of the four dependent variables. Instead, six social correlates and demographic indicators manifest statistically significant effects on predicting PATP (all in the expected direction). The variable—“African American” is a significant predictor that is associated with a decrease in PATP regardless of different measures of the concept. Similar negative relationships between the variable “Hispanic” and the four dependent variables are found but the sizes of these effects are not as large as that of the variable African American. Education attainment is another significant predictor across the board, and the findings suggest that higher levels of educational attainment are associated with lower ratings of the police. Among the commonly used predictors of PATP, collective efficacy, victimization experience, and media portrayal of the police are all statistically significant predictors in four models. Respondents who show more confidence in their neighbors also show more confidence in the police. Similarly, if a resident believes that the HPD is reported fairly by the media, he/she is more likely to be satisfied with the services provided by the HPD. Moreover, victimization has a direct and negative impact on all four measures of PATP. It is worth noting that perception of neighborhood disorder is a significant predictor in three out of the four models.
OLS Regression on the Four Measures of the Public Attitudes Toward the Police.
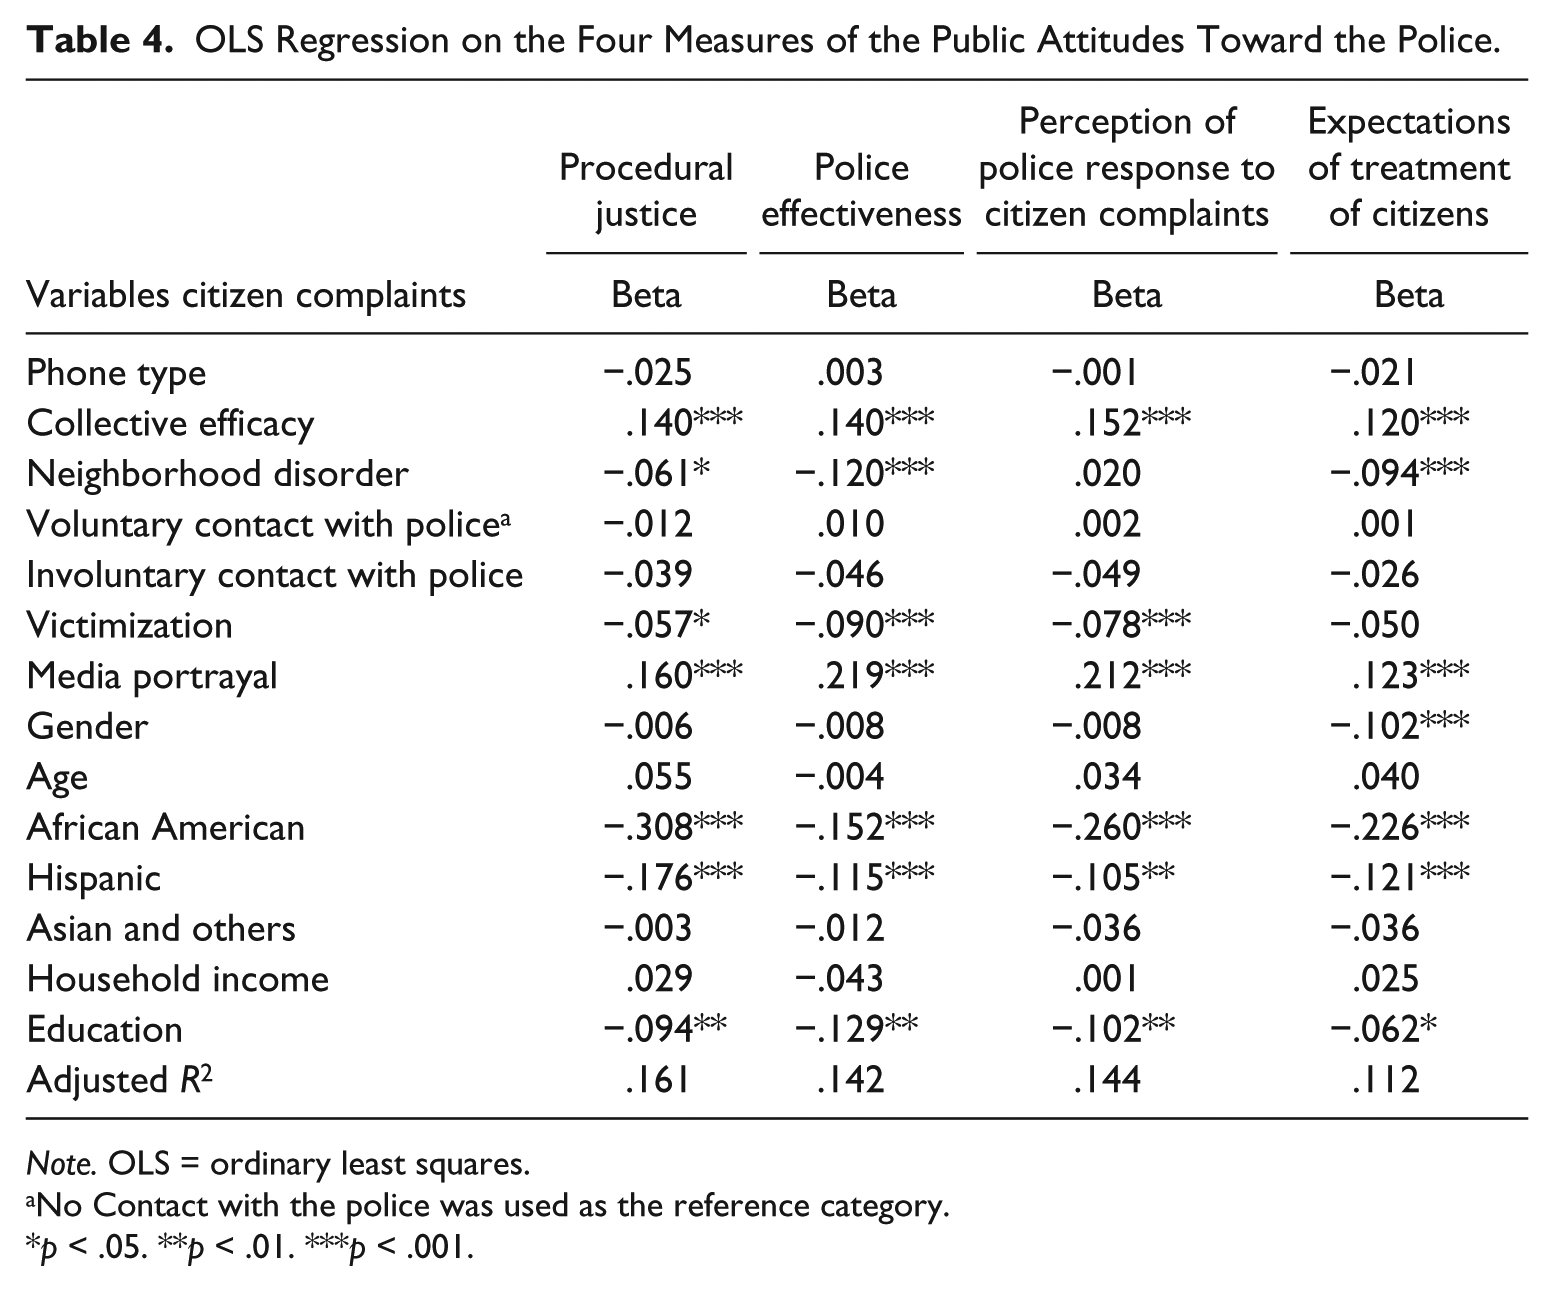
Note. OLS = ordinary least squares.
No Contact with the police was used as the reference category.
p < .05. **p < .01. ***p < .001.
Discussion and Conclusion
The growth of cell-phone-only households presents a new challenge for telephone surveys because it is no longer practical to reach cell-phone-only through traditional RDD (Carley-Baxter, Peytchev, & Black, 2010; Lavrakas, Shuttles, Steeh, & Fienberg, 2007). A wealth of research has focused on the potential bias introduced by omitting cell-phone-only users and on the feasibility of conducting cell-only telephone surveys. Prior research has also looked into the attitudinal and behavioral differences between the landline and cell-only respondents on a variety of topics such as voting preferences, health indicators, religious and social values, immigration, and alcohol use (Brick, Edwards, & Lee, 2007; Christian et al., 2010; Keeter, 2006). To the best of our knowledge, no study has included a cell-only sample to examine PATP—a key area of research in American policing. Thus, this study serves as the first attempt to explore if the cell-phone-only and the landline samples are significantly different from one another in their demographic backgrounds and whether the landline respondents rate the police differently than their cell-only counterparts. In the current study, the citizen attitudinal data were collected from a dual-frame sample (landline and cell-only samples) in 2012 in Houston. Four important observations deserve attention.
Our first noteworthy observation concerns the feasibility of including a cell-only sample in a telephone survey and its subsequent response rate. Similar to some previous studies (Brick et al., 2006; Fleeman, 2006; Link et al., 2007; Steeh, 2004), the current study lends support to this technical issue by concluding that a cell phone interview of the same scope and length as a landline RDD interview is indeed operationally feasible. It is important to note, however, that cell-only telephone survey is costly and the response rate is often low. According to the estimate of the survey company contracted to carry out this survey, the cost of interviewing one cell-only respondent is three times higher than that of interviewing a landline user. This explains the comparatively small sample size of the cell-only segment (16.7% of the total blended sample) in our study. At the same time, the response rates for both samples are at the lower end in comparison with other dual-frame-sample studies (e.g., Brick, Edwards, & Lee, 2007; Link et al., 2007) for a couple of reasons. First, there has been a rapid decline in response rates to telephone surveys in general (Battaglia et al., 2008). Curtin, Presser, and Singer (2005) reported that the University of Michigan’s monthly Survey of Consumer Attitudes had experienced an accelerated decline in response rates in the last 25 years, from a high of 72% in 1979 to a low of 67% in 1996, and to only 48% in 2003. The deterioration since 1996 has been twice as steep as prior to the 1996 period, averaging 1.5 percentage points a year. There is good reason to believe that the response rate of telephone surveys will continue to drop. Second, the screening interview at the beginning of the surveys has significantly affected the response rates for both samples. While the landline sample includes the age and geographic screenings, one additional eligibility question about the cell-phone-only status is added to the cell-only sample interview, leading to the even lower response rate for the cell-only sample.
Our second observation pertains to the distribution of demographic characteristics between the two samples. The literature of general public opinion surveys has overwhelmingly supported the conclusion that cell-only adults differ demographically from adults with landlines in that cell-phone-only respondents tend to be younger, males, members of ethnic/racial minorities, renters, mobile, and less educated (Blumberg & Luke, 2016; Ehlen & Ehlen, 2007). Overall, our findings are consistent with the literature in this regard. The most conspicuous difference between the cell-only and landline users found in this study is their age. About 57% of the cell-only respondents are concentrated in the age group of 18 to 34, whereas only 17% of the landline users fall in this age category. The cell-only sample has about 10% more males than the landline sample. In addition, cell-only respondents are more likely to be a renter and move around more frequently than their landline counterparts. This study also confirms the previous finding that Hispanics lead all ethnic/racial groups in the percentage of cell-only users (Dutwin et al., 2010).
Our third noteworthy observation concerns the link between the phone-device effect and the ratings of the police. The demographic differences between land phone sample and cell-only sample do not translate into their respective attitudinal differences in the ratings of the police. Simple t tests, for example, indicate no device differences for the four dimensions of PATP. Moreover, when the phone type is included in the multiple regressions along with other traditional predictors, the cell-only dichotomous variable does not yield any significant effect on any of the four dependent variables. Though our data are from 2012, the regression coefficients for phone type are so small across four models that it is unlikely the conclusions will already be outdated.
These results provide no support for the hypothesis that information collected via a cell phone carries different response characteristics than those obtained via landline devices. Stated differently, demographic differences detected between landline and cell-only samples do not necessarily imply that cell-only respondents are significantly different from landline respondents in their attitudes toward the police. To investigate this unexpected finding, additional multivariate analyses are conducted where phone type is treated as a proxy for demographic differences between two samples. Also included in the multivariate models are the other seven independent variables, while no demographic variables are added. The purpose is to examine if the demographic differences carried by phone type are strong enough to exert a significant effect on the measures of PATP without the presence of the demographic factors. The results show that phone type remains insignificant across four models of PATP. Thus, it is plausible to speculate that the two samples based on phone type were not different enough demographically to produce a statistically significant change in the measures of PATP in the blended sample. For example, no difference was detected in the variable African American between the two samples. Yet African American is undoubtedly the single most powerful variable identified in the extant research on PATP (see Weitzer & Tuch, 2005). As this is the first attempt to study PATP between landline and cell-only samples, the authors will refrain from drawing any further speculations without additional research evidences.
The findings of nonsignificant device effect are in line with the results derived from other research using the dual-frame sample. For example, in their nationwide dual frame survey of landline and cell phone numbers conducted in 2004, Brick, Edwards, & Lee (2007) found that there are no significant differences by device for the two voting items though demographic differences are present between the two samples. The results from their multilevel model analysis showed that device type, age, sex, and home ownership are not significant and the interviewer effects for these items are negligible at best. Similarly, the Pew Research Center (2006) conducted four independent dual-frame studies and concluded that despite the fact that there were significant differences between cell-only and landline respondents on many important variables, including a cell-only sample with a landline RDD sample produced general population estimates that were nearly identical to those from the landline sample alone (Keeter et al., 2007). Our findings suggest that, for policing scholars studying PATP, inexpensive landline surveys may have sufficient validity for most purposes. Given the logistical and cost implications associated with dual-frame designs, the utility of including cell-only respondents with landline samples appears marginal, at least at present. Yet the rapid growth in the size of the cell-only segment and its continued concentration among younger people implies that its potential impact warrants continued study.
Our final observation is that the traditional predictors of PATP played a major role in explaining the variance in the four multiple regression models. Variables such as African American, Hispanic, education, collective efficacy, victimization experience, and media portrayal are all significant predictors of the four measures of PATP. Among them, the variable African American stands out as the most powerful predictor. This finding is consistent with previous research on the relationship between race and PATP (Brandl et al., 1994; Correia et al., 1996; Lai & Zhao, 2010; Peck, 2015; Reisig & Giacomazzi, 1998; Reisig & Parks, 2000; Schuck et al., 2008; Weitzer & Tuch, 2006; Wu et al., 2009).
This study has several limitations that future researchers should be aware of. First, though it contains more measures of PATP than most studies, the inclusion of these variables is clearly not exhaustive and our measures are by no means perfect. For instance, the measure of perceived procedural justice is largely derived from quality of treatment; the second important dimension of procedural justice—quality of decision making—needs to be included in the future studies on PATP (Sunshine & Tyler, 2003). Second, as the data were collected in Houston, Texas, the fourth largest city in the United States with diverse socioeconomic and neighborhood characteristics, there remains the possibility that PATP in smaller cities may carry their distinctive trademarks. It will be interesting to see if the findings from this study can be replicated in other urban or nonurban areas. Third, with the continued increase in the popularity of cell phone uses, wireless substitution for landlines may eventually lead to a relative demographic homogeneity. Today the proportion of cell-phone-only households is significantly larger than it was 4 years ago when the data of this study were collected. This warrants additional evidences and continued study to ascertain the potential impact of telephone device on PATP. Finally, this is only a first attempt to examine what may be a complex problem, and more work is needed to understand the role of the cell phone only as an interviewing device, not only in the area of PATP, but also for a greater coverage for criminal justice topics. As telephone surveys have been widely adopted as the primary data collection method in criminal justice, the focus of future dual-frame-sample research shall go beyond PATP by examining other important and meaningful criminological topics (e.g., public opinion, sentencing, and death penalty).
Footnotes
Appendix
Authors’ Note
Points of view or opinions contained in this article are those of the authors and do not necessarily represent the official positions or policies of the funding agency.
Declaration of Conflicting Interests
The author(s) declared no potential conflicts of interest with respect to the research, authorship, and/or publication of this article.
Funding
The author(s) disclosed receipt of the following financial support for the research, authorship, and/or publication of this article: This project was funded by the Houston Police Department (#32120B190).