



Abstract
Previous research suggests that the relationship between employment and recidivism is complex, with more support needed to facilitate employability motivation for sustained change. An arts-based programme designed to facilitate vocational self-determinism among prisoners with evidence of impact across three prisons in the United Kingdom was replicated and delivered to 234 prisoners and long-term unemployed participants from six European countries, to explore whether the findings from the previous evaluation would be replicated on a much larger scale. The research presented in this article found that supporting prisoners and the long-term unemployed to articulate employability goals had a positive effect on personal growth as well as understanding of individual strengths and weaknesses with respect to work, employment, problem solving, and thinking styles. Future research might explore the longer term impact on employment and recidivism.
Introduction
Evidence suggests that offending and employment are inextricably linked with unemployment more likely than not to precede offending, to follow a prison sentence, and then to precede reoffending. Indeed, Niven and Olagundoye (2002) revealed that 67% of prisoners were not in work or training in the 4 weeks before going to prison. Employability of offenders has been identified as a major factor to improve rehabilitation and resettlement to reduce recidivism (May, Sharma, & Stewart, 2008) with considerable attention placed on the training and employment of prisoners (Clarke, Kelly, & Hutton, 2005; Foster et al., 2013).
There is evidence to suggest that prison-based employability interventions affect recidivism. In the United Kingdom, three surveys of prisoners shortly before prison release in 2001, 2003, and 2004, representing 4,898 participants, revealed that a combination of accommodation and employment problems were significantly associated with an increased risk of reoffending (odds ratio [OR] = 1.43)—and that attending a prison job club was significantly associated with a reduced likelihood of reoffending (with 49% of those who attended reoffending compared with 58% of those who did not attend reoffending; May et al., 2008). A systematic review of empirical evidence of the impact of employability initiatives and reoffending by Hurry, Brazier, Parker, and Wilson (2006) revealed that offenders who took part were significantly more likely to be employed 6 months later than those who did not in six of the seven studies reviewed. The authors suggested that “employment programmes need to give more attention to facilitating an internal needs assessment, enabling offenders to make career decisions that maximise success” (Hurry et al., 2006).
Some evidence suggests that the relationship between employment and recidivism is a complex one; that gaining employment is not significantly associated with a decrease in the likelihood of re-incarceration but, rather, in greater time to return to prison (Tripodi, Kim, & Bender, 2010). As prisoners who gain employment are less likely to engage in criminal behaviour for longer before returning to prison, the authors suggest that for sustained change, interventions should focus on improving individual motivations associated with employment (Tripodi et al., 2010).
Employment that fits an individual’s interests, strengths, and skills is related to greater motivation (Noe, Noe, & Bachhuber, 1990). This fit, which relates to a feeling of personal growth and competence, is thought to be a fundamental human motivation and related to the extent to which individuals feel active, engaged, passive, or disaffected (Ryan & Deci, 2000). Such “self-determination” is thought to have implications for both self-regulation and well-being (Ryan & Deci, 2000). The theory of self-determination was used in a correctional facility educational program in an effort to preserve motivation and actively engage in the learning process to ease the transition from prison to community (McKinney & Cotronea, 2011). Aspiring to achieve in the context of personal growth and perceived competence is associated with well-being, and at the heart of this is a sense of motivation and engagement (Sheldon & Kasser, 1998). Indeed, practice emerging from the evidence base suggests that ex-offenders should be provided with more information about how to match individual skills with particular jobs and that feelings, subjective reaction, and attitudes about careers should be explored with ex-offenders with a view to improving employment outcomes (Hurry et al., 2006).
The programme “Talent 4 . . .” was developed by Rideout (Creative Arts for Rehabilitation) to provide innovative, arts-based approaches to working with prisoners and staff in prisons in the United Kingdom, aiming to facilitate “vocational self-determination offenders defining for themselves (or redefining) work/life choices” based on observations of widespread disaffection toward work (Caulfield & Wilkinson, 2011). In collaboration with prison education specialists, ex-offenders, careers guidance consultants, and the Institute for Employment Research at the University of Warwick, a six-session programme grounded in learning psychology, guidance studies, and arts practice using a range of exercises, games, role-plays, and videos was developed with the aim to support offenders in defining intrinsically motivated professional career choices to employability. This programme was piloted across three prisons over a period of 3 years in the midlands of the United Kingdom and was found to significantly increase confidence in the ability to tackle the challenges of finding work in the future, to challenge negative thought cycles, to increase aspirations and confidence about work and employment, to significantly increase individual knowledge and understanding about strengths and weaknesses in relation to work and employment, to increase the value placed on achievement of future career prospects, and to encourage in-depth consideration of individual skills and ability (Caulfield & Wilkinson, 2011).
The aim of this research was to build on the pilot, to explore whether the findings from the previous evaluation would be replicated on a much larger scale, across six European countries and different participation groups. The core aim of the programme was to help participants learn more about their innate or acquired talents and skills, particularly for those who do not have a clear idea about the kind of employment they would like to pursue, including people in prison and the long-term unemployed. Over a series of six workshop sessions, participants engaged in a range of activities from responding to arts stimuli, playing games, solving problems, and discussions about personal desires and interests. At the end of the workshop, each participant received feedback on their strengths as measured on a series of spectra. These assessments were then fed into software that analyses the participant’s skills and professional territories where such skills would be used as possible options for future training and/or employment. The programme ran between October 2012 and September 2014 where Rideout visited each of the project partners to train staff in the use of the Talent 4 workshops. Each partner was given workshop materials and a programme for six pilot workshops with their chosen client group—young and adult prisoners, ex-prisoners, disadvantaged and vulnerable groups, young and adult long-term unemployed. Rideout made a second visit to each partner midway through the piloting process to assess progress and troubleshoot problems.
Method
Design
A questionnaire survey study was undertaken to explore whether taking part in a Talent 4 . . . programme affected participants’ aspirations, perceived competence, and understanding of their strengths and weaknesses around work and employment. Three questionnaires were used to collect the data. Two of the questionnaires were pre-existing and adapted for use in this research: the “personal growth” subscale of the Aspiration Index (AI: Kasser & Ryan, 1996), and the Perceived Competence Scale (PCS: G. C. Williams & Deci, 1996). The third questionnaire consisted of a series of statements designed by Rideout to assess participants’ understanding of their strengths and weaknesses and to record their approach to tasks and personal skills. These three questionnaires were completed by participants both before the project and after completing the project. Collecting baseline data from participants and assessing this data against that collected at project completion allows change to be monitored. Using a repeated measures design, this allowed for each participant to act as her or his own control “subject.” The research was conducted in adherence to the British Psychological Society’s principles on research ethics.
Participants
In total, 234 participants from six countries participated in this study including 34 (14.5%) from Italy, 36 (15.4%) from Spain, 31 (13.2%) from Bulgaria, 29 (12.4%) from Lithuania, 68 (29.1%) from Romania, and 36 (15.4%) from Malta. Participants from Italy were recruited in partnership with Euroform RFS, an Italian organisation based in Rende, and Calabria who provide vocational guidance and training. Participants from Spain were recruited from Esmovia, a Spanish company based in Valencia dedicated to the management of European mobility projects within the Lifelong Learning Programme, specialising in providing work placements, educational programmes, and study visits to young people and adults from all over Europe. Participants from Bulgaria were recruited in partnership with the Center for promoting lifelong learning (CPIP) (a nongovernmental organization [NGO] and nonprofit institution, active in the educational and social field based in Timisoara, Romania) and Bulgaria Gateway (based in Sofia, who are concerned with the planning and management of international mobility and training projects for young students, teaching staff, young workers, and organisations within the Lifelong Learning Programme, especially Leonardo da Vinci and Erasmus). Participants from Lithuania were recruited in partnership with EduPro based in Siauliai, who promote, develop, and implement principles of life-long study and nonformal education. Participants from Romania were recruited in partnership with the Association for an Active Future, a nonprofit organisation based in Constanta, Romania, who focus on activities designed for inmates and ex-offenders. Participants from Malta were recruited in partnership with the European Prison Education Association (EPEA)–Malta Branch, a “not for profit” NGO that has been active in the area of prison education and rehabilitation. Of the 234 participants, the gender of 136 was recorded. While 56 of the recorded participants were women (41%), 80 of the recorded participants were men (59%). Of the 234 participants, 48 (19.2%) were under the age of 18, 18 (7.7%) were between the ages of 18 and 21, and 171 (73.1%) were between the ages of 22 and 40.
Materials
Three questionnaires were used to collect the data. The AI (Kasser & Ryan, 1996) was developed to assess individual aspirations. The Aspirations Index includes seven categories of aspirations within the full scale. This assessment has demonstrated good psychometric properties of reliability and validity across a range of settings (Bernarda & Taffesseb, 2014; Utvaer, Hammervold, & Haugan, 2014). The intrinsic aspirations scale of personal growth was used in this research. Participants rate (a) the importance to themselves of each aspiration, (b) their beliefs about the likelihood of attaining each, and (c) the degree to which they have already attained each. For example, participants are asked to consider the life goal “To learn more about why I do the things I do” and rate the importance of this, the likelihood of attaining this, and the current level of attainment, on a 7-point Likert rating scale. There are a total of five items for importance, five for likelihood, and five for attainment for the personal growth subscale. As noted above, attainment of personal growth is positively associated with well-being (Sheldon & Kasser, 1998). Competence is proposed to be a fundamental psychological need (G. C. Williams & Deci, 1996), and perceptions of competence facilitate goal attainment. In addition, perceived competence is predictive of maintained behaviour change and effective performance in activities. Thus, any significant changes in participant scores on the PCS would indicate changes in the likelihood of behavioural changes and levels of effective performance. The PCS is a short, 4-item questionnaire devised to be specific to the behaviour or activity being studied. Individuals rate each item on a 7-point Likert scale where 1 = not at all true, 4 = somewhat true, and 7 = very true. In this research, the PCS assessed participants’ feelings of competence in finding future employment and doing well at work. This scale has demonstrated good psychometric properties of validity and reliability across a variety of settings (L. Williams & Gill, 1995; G. C. Williams et al., 2006; G. C. Williams, McGregor, Zeldman, Freedman, & Deci, 2004).
Rideout designed four bespoke questions aimed at investigating participants’ perceptions of work and employment strengths and weaknesses, problem-solving style, working style, and communication style. These items were rated on a Likert 7-point rating scale. The maximum score for each item is 7 and minimum score is 1. The maximum score for the overall scale is 4, and the maximum score is 28. All measures were translated in the relevant language for each partner organisation.
Procedure
Research was conducted in the following stages: (a) Ethics approval granted from Birmingham City University; (b) Design of bespoke change measurement assessment, based on existing validated assessment tools; (c) Identification of Talent 4 . . . projects to take part in the research; (d) Collection of baseline data from participants immediately prior to project start. This data consisted of the three scales discussed above and was collected from all participants prior to beginning Talent 4 . . . . Ten days after completing Talent 4 . . . participants completed the scales again. Data were collated and analysed to provide evidence on the effects of participating in a Talent 4 . . . project.
Results
Participant’s scores were analysed using the statistical package SPSS (v21) to identify whether there were any statistically significant differences between participant’s scores on the scales before and after taking part in the Talent 4 programme. The results for each section were analysed using a related t-test, and the effect size for each was assessed using SPSS (v21). Analysis of Covariance (ANCOVA) was used to assess the impact of the intervention across different countries, while controlling for pre-test scores using SPSS (v21).
Personal Growth Using the Aspirations Index
A related t-test was conducted to evaluate the impact of the intervention on participants’ overall mean scores on the personal growth subscale. There was a statistically significant increase in the personal growth subscale means of the AI from Time 1 at pre-intervention (M = 5.34, SD = 1.08) to Time 2 at post-intervention (M = 5.55, SD = 1.09), t(226) = 3.40, p = .001 (two-tailed). The mean increase in personal growth subscale scores was .19 with a 95% confidence interval ranging from .31 to .08. The eta squared statistic 0.05 indicated a small effect size (Cohen, 1988).
A one-way between-groups analysis of covariance was conducted to compare the effectiveness of the intervention among different countries on the personal growth subscale scores. The independent variable was country (Italy, Spain, Bulgaria, Lithuania, Romania, and Malta), and the dependent variable consisted of scores on the personal growth subscale of the AI after the intervention was completed. Participants’ scores on the pre-intervention administration of the personal growth subscale of the AI were used as the covariate in this analysis.
Preliminary checks were conducted to ensure that there was no violation of the assumptions of normality, linearity, homogeneity of variance, homogeneity of regression slopes, and reliable measurement of the covariates. The regression slope illustrating the relationship between the covariate and dependent variable for each group suggests a linear relationship for each group; however, the lines are noticeably different in their orientation, suggesting an interaction between the covariate and the partners. This is illustrated in Figure 1.

Regression slope scatterplot illustrating the relationship between the dependent variable (personal growth subscale for the AI at Time 1) and the covariate (personal growth subscale for the AI at Time 2) for each country.
Further inspection using Levene’s Test of Equality of Error Variances revealed a significant difference in variance, F(5, 221) = 7.96, p = .001. The violation of this assumption may lead to a Type II error (to fail to reject the null hypothesis when there is a significant finding).
The means and standard deviations for each partner group score on the personal growth subscale for the AI at Time 2 is provided in Table 1.
The Means and Standard Deviations for Each Country Score on the Personal Growth Subscale for the AI at Time 2.
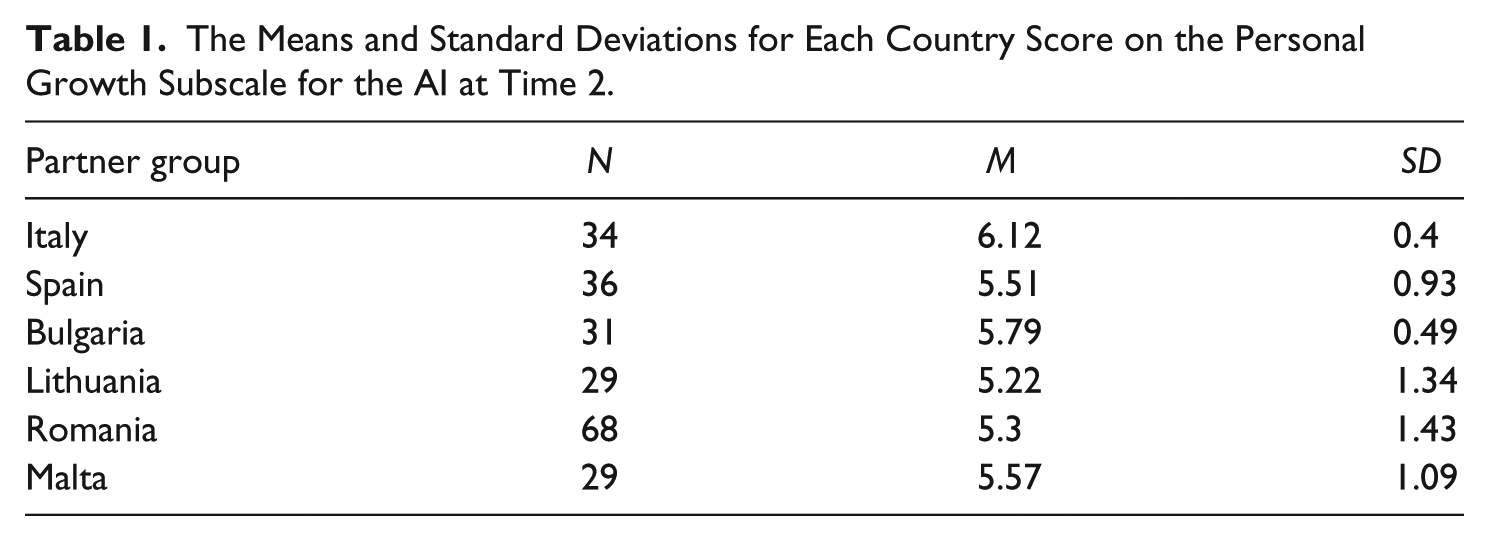
After adjusting for pre-intervention scores, there was a significant difference between the countries on post-intervention scores on the personal growth subscale of the AI, F(5, 221) = 2.76, partial eta squared = 0.06. There was a moderate relationship between the pre-intervention and post-intervention scores on the personal growth subscale of the AI, as indicated by a partial eta squared value of .51.
Importance of Personal Growth
To evaluate the impact of the intervention on participants’ mean scores ratings of the importance of personal growth using the AI, a related t-test was conducted, revealing a statistically significant increase in the importance of personal growth subscale means of the AI from Time 1 at pre-intervention (M = 6.02, SD = 1.13) to Time 2 at post-intervention (M = 6.19, SD = 1.30), t(226) = 2.18, p = .03 (two-tailed). The mean increase in personal growth subscale scores was .16 with a 95% confidence interval ranging from .30 to .08. The eta squared statistic 0.02 indicated a small effect size (Cohen, 1988).
To compare the effectiveness of the intervention among different countries on the importance of personal growth using the AI, a one-way between-groups analysis of covariance was conducted. The independent variable was partner (Italy, Spain, Bulgaria, Lithuania, Romania, and Malta), and the dependent variable consisted of scores on the importance of personal growth using the AI after the intervention was completed. Participants’ scores on the pre-intervention administration of the importance of personal growth using the AI were used as the covariate in this analysis.
To ensure that there was no violation of the assumptions of normality, linearity, homogeneity of variance, homogeneity of regression slopes, and reliable measurement of the covariates, preliminary checks were conducted. The regression slope illustrating the relationship between the covariate and dependent variable for country suggests a linear relationship for country; however, the lines are noticeably different in their orientation, suggesting an interaction between the covariate and the partners. Further inspection using Levene’s Test of Equality of Error Variances did not reveal a significant difference in variance, F(5, 221) = 1.39, p = .22.
The means and standard deviations for each partner group score on the importance of personal growth using the AI at Time 2 is provided in Table 2.
The Means and Standard Deviations for Each Country Score on the Importance of Personal Growth Using the AI at Time 2.

There was a significant difference between the countries on post-intervention scores on the importance of personal growth subscale of using the AI, F(5,221) = 2.94, partial eta squared = 0.06 after adjusting for pre-intervention scores. There was a moderate relationship between the pre-intervention and post-intervention scores on the importance of personal growth using the AI, as indicated by a partial eta squared value of .33.
Likelihood of Personal Growth
A related t-test was conducted to evaluate the impact of the intervention on participants’ mean scores ratings of the likelihood of personal growth using the AI. There was a statistically significant increase in the likelihood of personal growth subscale means of the AI from Time 1 at pre-intervention (M = 5.36, SD = 1.18) to Time 2 at post-intervention (M = 5.59, SD = 1.56), t(226) = 2.57, p = .01 (two-tailed). The mean increase in personal growth subscale scores was .23 with a 95% confidence interval ranging from .41 to .05. The eta squared statistic 0.03 indicated a small effect size (Cohen, 1988).
A one-way between-groups analysis of covariance was conducted to compare the effectiveness of the intervention among different countries on the likelihood of personal growth using the AI. The independent variable was country (Italy, Spain, Bulgaria, Lithuania, Romania, and Malta), and the dependent variable consisted of scores on the likelihood of personal growth using the AI after the intervention was completed. Participants’ scores on the pre-intervention administration of the likelihood of personal growth using the AI were used as the covariate in this analysis.
Preliminary checks were conducted to ensure that there was no violation of the assumptions of normality, linearity, homogeneity of variance, homogeneity of regression slopes, and reliable measurement of the covariates. The regression slope illustrating the relationship between the covariate and dependent variable for each country suggests a linear relationship for each group; however, the lines are noticeably different in their orientation, suggesting an interaction between the covariate and the partners. This is illustrated in Figure 2.
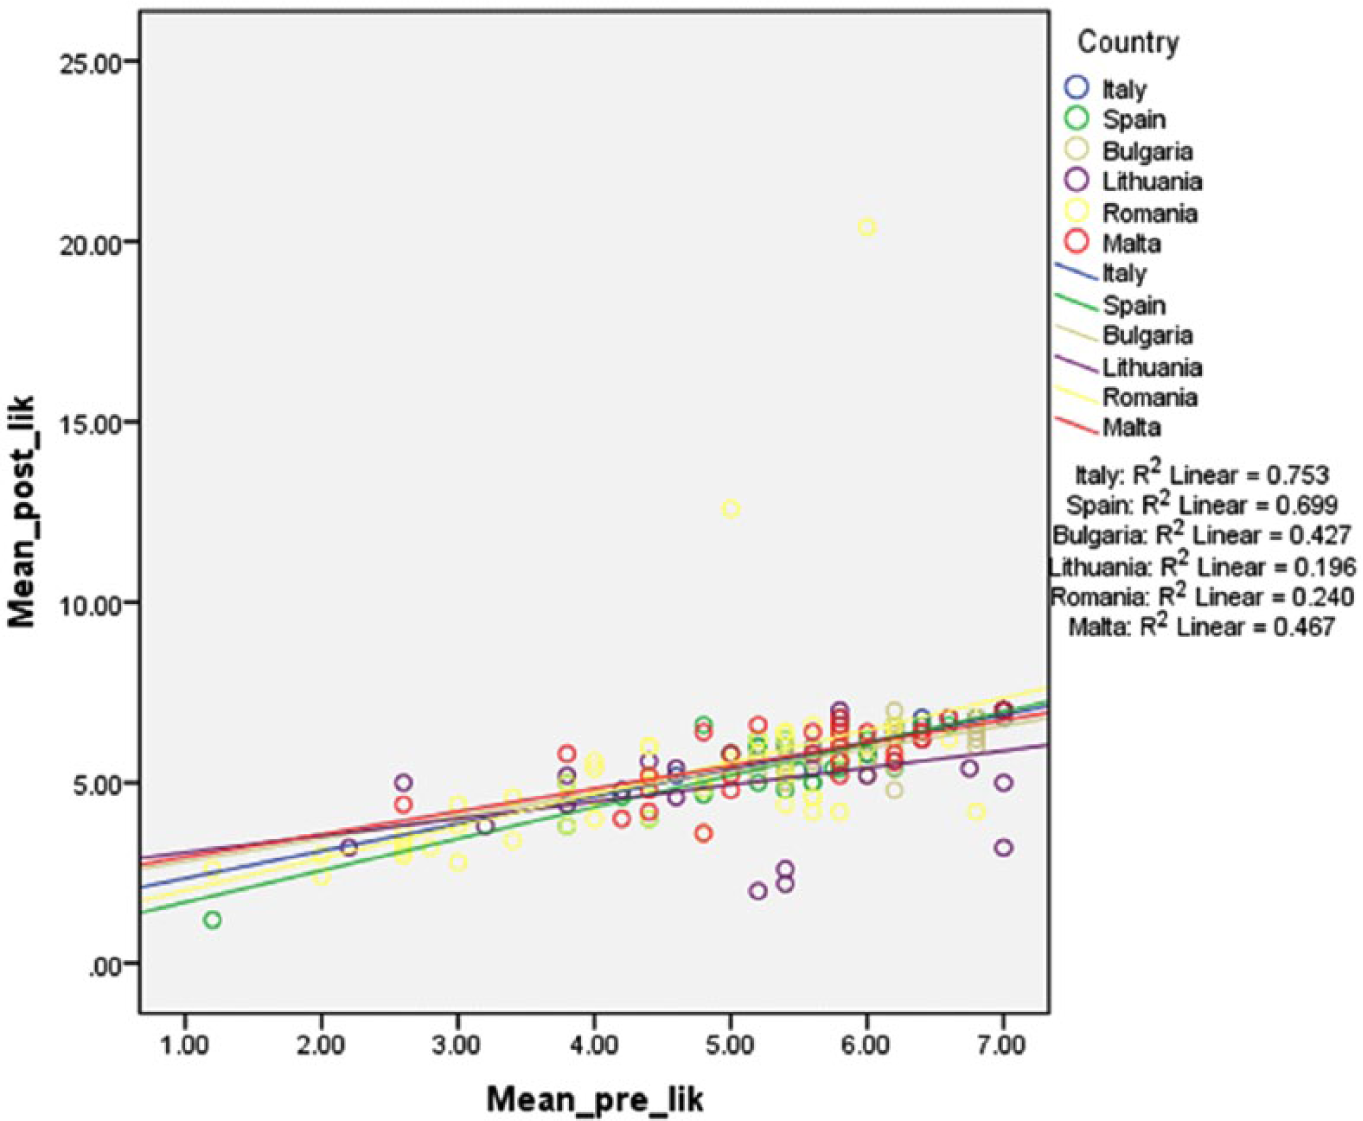
Regression slope scatterplot illustrating the relationship between the dependent variable (likelihood of personal growth using the AI at Time 1) and the covariate (likelihood of personal growth using the AI at Time 2) for each country.
Further inspection using Levene’s Test of Equality of Error Variances did reveal a significant difference in variance, F(5, 219) = 3.03, p = .01. The violation of this assumption may lead to a Type II error (to fail to reject the null hypothesis when there is a significant finding). The means and standard deviations for each country score on the likelihood of personal growth using the AI at Time 2 is provided in Table 3.
The Means and Standard Deviations for Each Country Score on the Likelihood of Personal Growth Using the AI at Time 2.
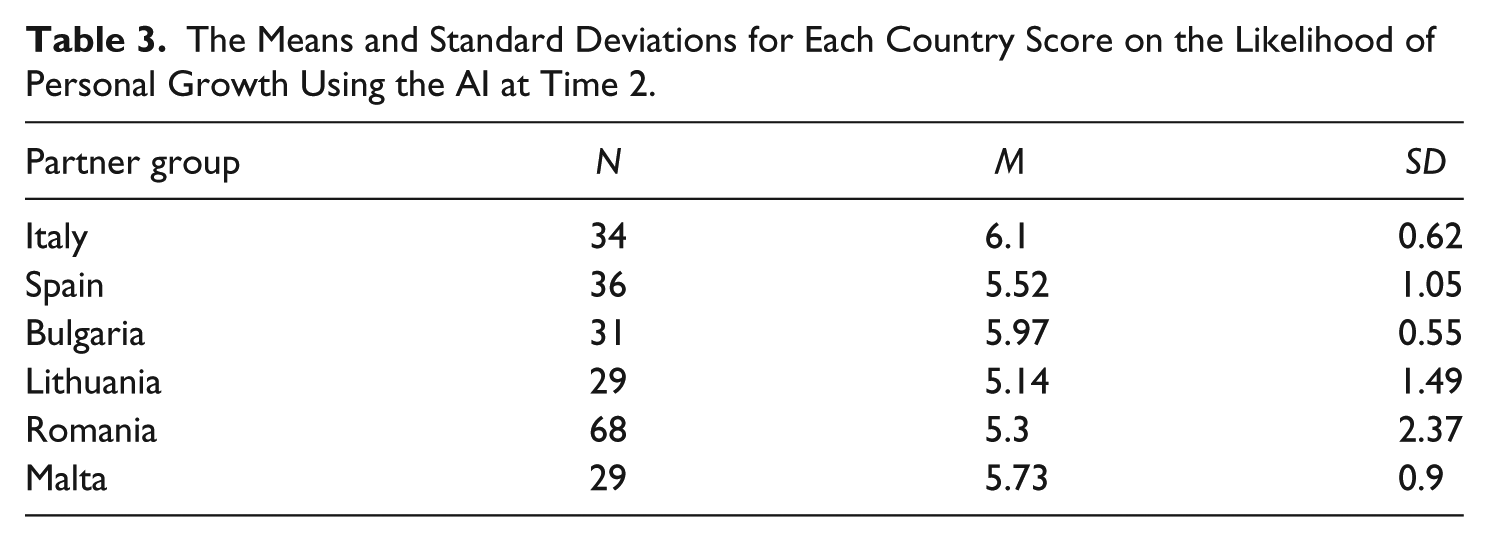
After adjusting for pre-intervention scores, there was not a significant difference between the countries on post-intervention scores on the likelihood of the personal growth subscale of using the AI, F(5, 219) = 1.20, partial eta squared = 0.03. There was a small relationship between the pre-intervention and post-intervention scores on the importance of personal growth using the AI, as indicated by a partial eta squared value of .31.
Attainment of Personal Growth
To evaluate the impact of the intervention on participants’ mean scores ratings of the attainment of personal growth using the AI, a related t-test was conducted. There was a statistically significant increase in the attainment of personal growth subscale means of the AI from Time 1 at pre-intervention (M = 4.67, SD = 1.27) to Time 2 at post-intervention (M = 4.90, SD = 1.13), t(226) = 3.85, p = .0001 (two-tailed). The mean increase in attainment of personal growth subscale scores was .23 with a 95% confidence interval ranging from .34 to .11. The eta squared statistic 0.06 indicated a moderate effect size (Cohen, 1988).
To compare the effectiveness of the intervention among different countries on the attainment of personal growth using the AI, a one-way between-groups analysis of covariance was conducted. The independent variable was partner (Italy, Spain, Bulgaria, Lithuania, Romania, and Malta), and the dependent variable consisted of scores on the attainment of personal growth using the AI after the intervention was completed. Participants’ scores on the pre-intervention administration of the attainment of personal growth using the AI were used as the covariate in this analysis.
To ensure that there was no violation of the assumptions of normality, linearity, homogeneity of variance, homogeneity of regression slopes, and reliable measurement of the covariates, preliminary checks were conducted. The regression slope illustrating the relationship between the covariate and dependent variable for each country suggests a linear relationship for each country; however, the lines are noticeably different in their orientation, suggesting an interaction between the covariate and the countries. This is illustrated in Figure 3.
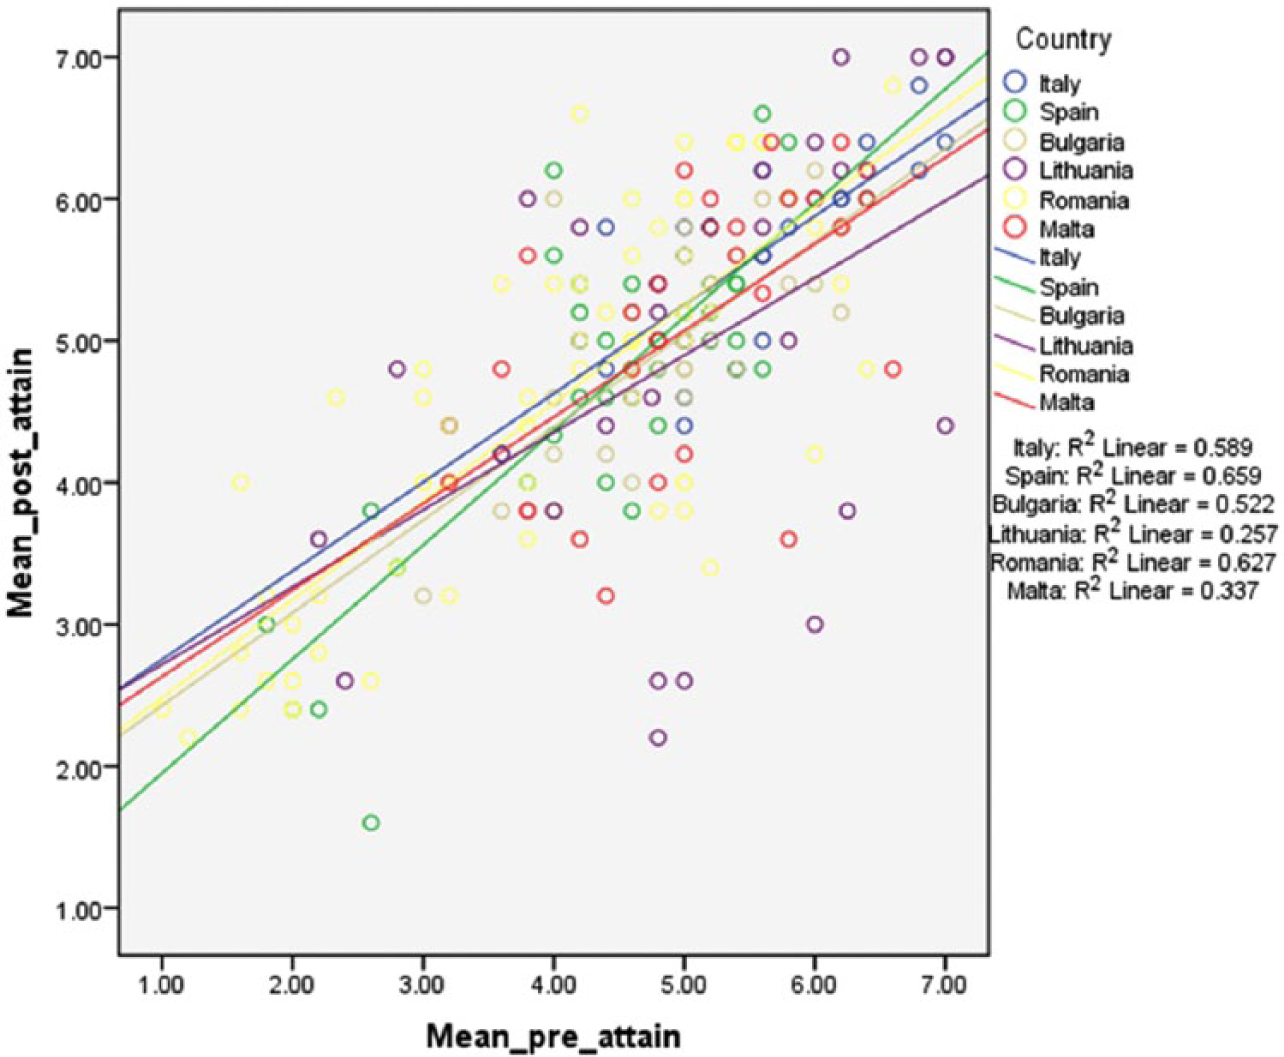
Regression slope scatterplot illustrating the relationship between the dependent variable (attainment of personal growth using the AI at Time 1) and the covariate (attainment of personal growth using the AI at Time 2) for each country.
Further inspection using Levene’s Test of Equality of Error Variances revealed a significant difference in variance, F(5, 221) = 8.33, p = .001. The violation of this assumption may lead to a Type II error (to fail to reject the null hypothesis when there is a significant finding).
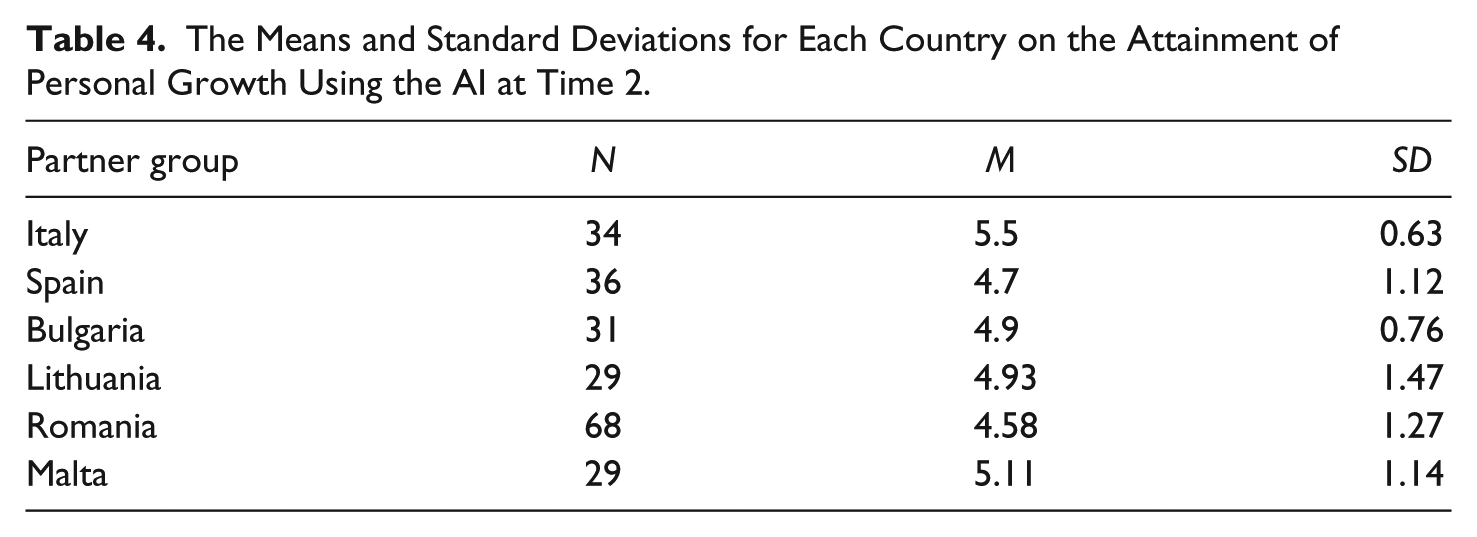
The means and standard deviations for each country on the attainment of personal growth using the AI at Time 2 is provided in Table 4.
The Means and Standard Deviations for Each Country on the Attainment of Personal Growth Using the AI at Time 2.
After adjusting for pre-intervention scores, there was not a significant difference between the countries on post-intervention scores on the attainment of personal growth subscale of using the AI, F(5,221) = 0.99, partial eta squared = 0.02. There was a moderate relationship between the pre-intervention and post-intervention scores on the attainment of personal growth using the AI, as indicated by a partial eta squared value of .54.
PCS
A related t-test was conducted to evaluate the impact of the intervention on participants’ overall mean scores on the PCS. While there was an increase in the mean scores of Perceived Competence from Time 1 at pre-intervention (M = 5.42, SD = 1.25) to Time 2 at post-intervention (M = 5.54, SD = 1.56), this difference failed to reach significance, t(226) = 1.49, p > .05. The means and standard deviations are presented in Table 5. The mean increase in Perceived Competence scores was .12 with a 95% confidence interval ranging from .27 to .04.
The Means and Standard Deviations for Each Country on Perceived Competence at Time 2.

A one-way between-groups analysis of covariance was conducted to compare the effectiveness of the intervention among different countries on Perceived Competence scores. The independent variable was partner (Italy, Spain, Bulgaria, Lithuania, Bulgaria, and Malta), and the dependent variable consisted of scores on Perceived Competence after the intervention was completed. Participants’ scores on the pre-intervention administration of Perceived Competence were used as the covariate in this analysis.
Preliminary checks were conducted to ensure that there was no violation of the assumptions of normality, linearity, homogeneity of variance, homogeneity of regression slopes, and reliable measurement of the covariates. The regression slope illustrating the relationship between the covariate and dependent variable for each group suggests a linear relationship for each country; however, the lines are noticeably different in their orientation, suggesting an interaction between the covariate and the countries. This is illustrated in Figure 4.
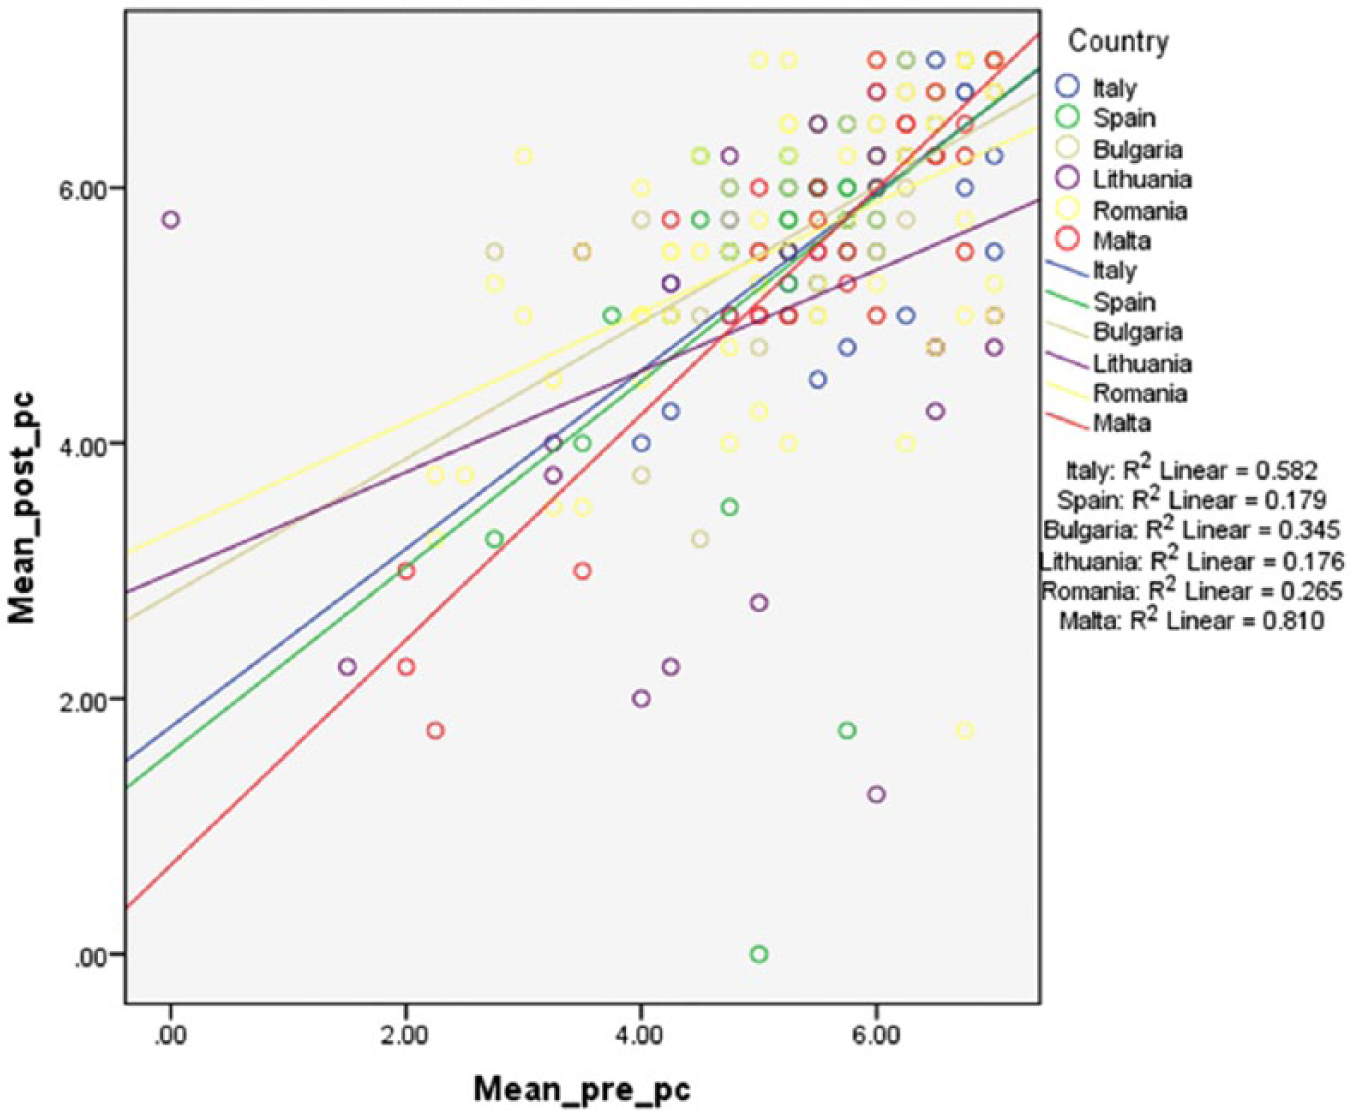
Regression slope scatterplot illustrating the relationship between the dependent variable (Perceived Competence at Time 1) and the covariate (Perceived Competence at Time 2) for each country.
Further inspection using Levene’s Test of Equality of Error Variances revealed a significant difference in variance, F(5, 220) = 4.42, p = .001. The violation of this assumption may lead to a Type II error (to fail to reject the null hypothesis when there is a significant finding).
The means and standard deviations for each country on Perceived Competence at Time 2 is provided in Table 5.
After adjusting for pre-intervention scores, there was not a significant difference between the partner groups on post-intervention scores on Perceived Competence, F(5, 220) = 1.29, partial eta squared = 0.03. There was a moderate relationship between the pre-intervention and post-intervention scores on Perceived Competence, as indicated by a partial eta squared value of .33.
Bespoke Questions
To evaluate the impact of the intervention on participants’ perceptions of work and employment strengths and weaknesses, problem-solving style, working style, and communication style, related t-tests were conducted.
Perceptions of Work and Employment Strengths and Weaknesses
To evaluate the impact of the intervention on participants’ overall mean scores on the bespoke question, “In terms of work and employment, I have a good understanding of my strengths and weaknesses” using a 7-point Likert rating scale where 1 = not at all true and 7 = very true, a related t-test was conducted. There was a statistically significant increase in the means from Time 1 at pre-intervention (M = 5.38, SD = 1.10) to Time 2 at post-intervention (M = 5.65, SD = 1.06), t(214) = 3.31, p = .001 (two-tailed). The mean increase in personal growth subscale scores was .26 with a 95% confidence interval ranging from .42 to .11. The eta squared statistic 0.05 indicated a small effect size (Cohen, 1988).
To compare the effectiveness of the intervention among different partners on the bespoke question, “In terms of work and employment, I have a good understanding of my strengths and weaknesses,” a one-way between-groups analysis of covariance was conducted. The independent variable was country (Italy, Spain, Bulgaria, Lithuania, Bulgaria, and Malta), and the dependent variable consisted of scores on the bespoke question, “In terms of work and employment, I have a good understanding of my strengths and weaknesses,” after the intervention was completed. Participants’ scores on the pre-intervention administration of the bespoke question, “In terms of work and employment, I have a good understanding of my strengths and weaknesses,” were used as the covariate in this analysis.
To ensure that there was no violation of the assumptions of normality, linearity, homogeneity of variance, homogeneity of regression slopes, and reliable measurement of the covariates, preliminary checks were conducted. The regression slope illustrating the relationship between the covariate and dependent variable for each country suggests a linear relationship for each country; however, the lines are noticeably different in their orientation, suggesting an interaction between the covariate and the countries.
Further inspection using Levene’s Test of Equality of Error Variances did not reveal a significant difference in variance, F(5, 209) = 1.53, p = .18.
The means and standard deviations for each country on the bespoke question, “In terms of work and employment, I have a good understanding of my strengths and weaknesses,” at Time 2 is provided in Table 6.
The Means and Standard Deviations for Each Country on the Bespoke Question, “In Terms of Work and Employment, I Have a Good Understanding of My Strengths and Weaknesses,” at Time 2.

There was not a significant difference between the countries on post-intervention scores on the bespoke question, “In terms of work and employment, I have a good understanding of my strengths and weaknesses,” F(5, 209) = 1.64, partial eta squared = 0.04, after adjusting for pre-intervention scores. There was a weak relationship between the pre-intervention and post-intervention scores on the bespoke question, “In terms of work and employment, I have a good understanding of my strengths and weaknesses,” as indicated by a partial eta squared value of .20.
Perception of Problem-Solving Style
A related t-test was conducted to evaluate the impact of the intervention on participants’ overall mean scores on the bespoke question, “In terms of problem solving, I am methodological and go step-by-step rather than be intuitive and follow my gut instinct,” using a 7-point Likert rating scale where 1 = not at all true and 7 = very true. There was a statistically significant increase in the means from Time 1 at pre-intervention (M = 4.97, SD = 1.24) to Time 2 at post-intervention (M = 5.25, SD = 1.24), t(220) = 3.47, p = .001 (two-tailed). The mean increase in personal growth subscale scores was .26 with a 95% confidence interval ranging from .44 to .12. The eta squared statistic 0.06 indicating a moderate effect size (Cohen, 1988).
A one-way between-groups analysis of covariance was conducted to compare the effectiveness of the intervention among different countries on the bespoke question, “In terms of problem solving, I am methodological and go step-by-step rather than be intuitive and follow my gut instinct.” The independent variable was country (Italy, Spain, Bulgaria, Lithuania, Bulgaria, and Malta), and the dependent variable consisted of scores on the bespoke question, “In terms of problem solving, I am methodological and go step-by-step rather than be intuitive and follow my gut instinct,” after the intervention was completed. Participants’ scores on the pre-intervention administration on the bespoke question, “In terms of problem solving, I am methodological and go step-by-step rather than be intuitive and follow my gut instinct,” were used as the covariate in this analysis.
Preliminary checks were conducted to ensure that there was no violation of the assumptions of normality, linearity, homogeneity of variance, homogeneity of regression slopes, and reliable measurement of the covariates. The regression slope illustrating the relationship between the covariate and dependent variable for each country suggests a linear relationship for each country; however, the lines are noticeably different in their orientation, suggesting an interaction between the covariate and the countries. This is illustrated in Figure 5.
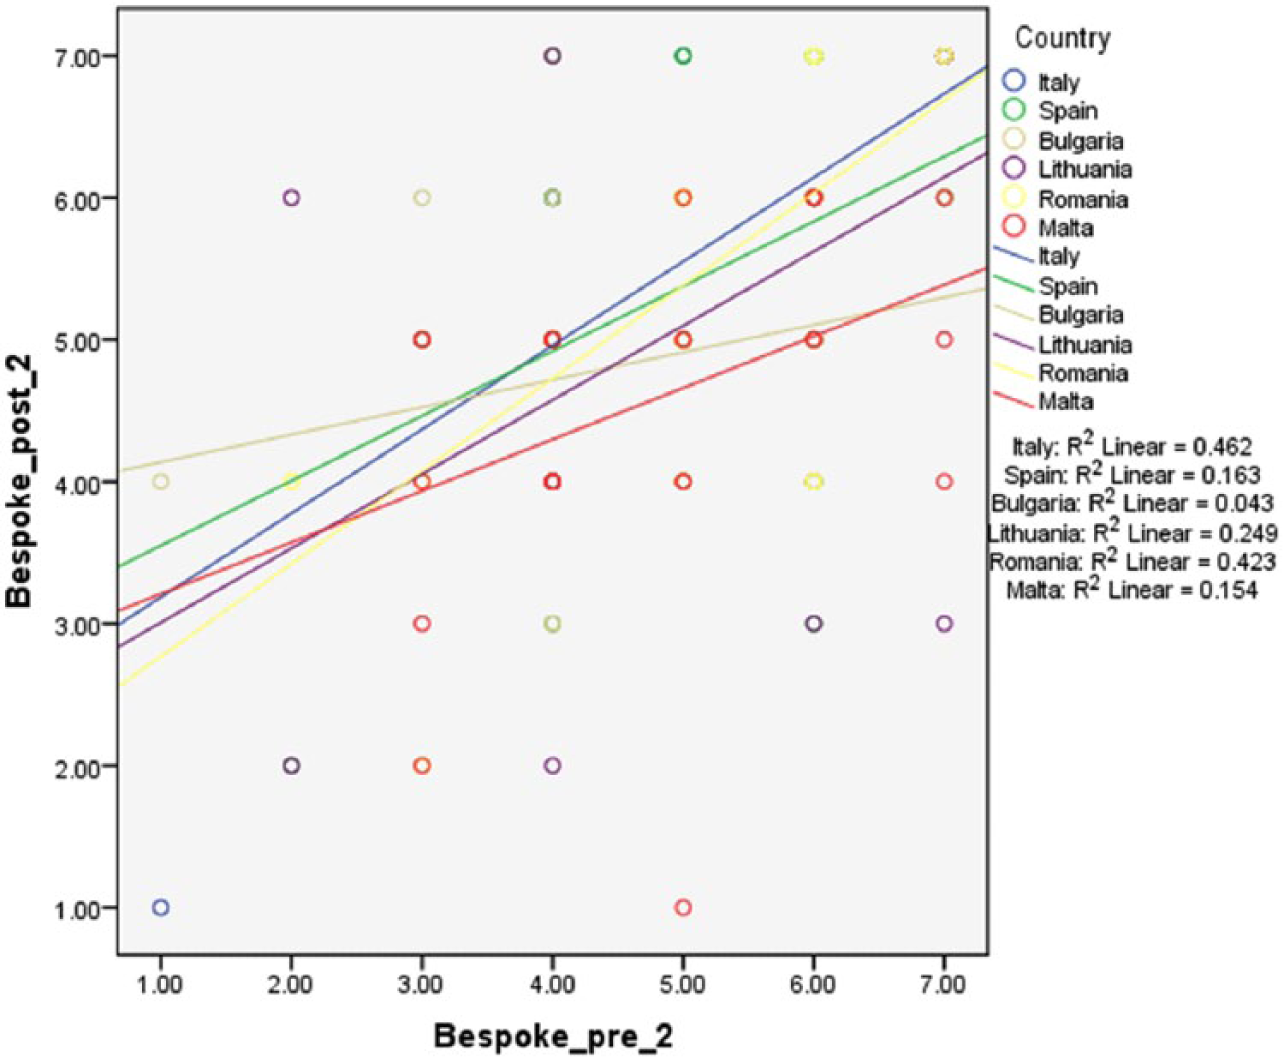
Regression slope scatterplot illustrating the relationship between the dependent variable (Bespoke question: “In terms of problem solving, I am methodological and go step-by-step rather than be intuitive and follow my gut instinct” at Time 1) and the covariate (Bespoke question: “In terms of problem solving, I am methodological and go step-by-step rather than be intuitive and follow my gut instinct” at Time 2) for each country.
Further inspection using Levene’s Test of Equality of Error Variances revealed a significant difference in variance, F(5, 215) = 2.67, p = .02. The violation of this assumption may lead to a Type II error (to fail to reject the null hypothesis when there is a significant finding).
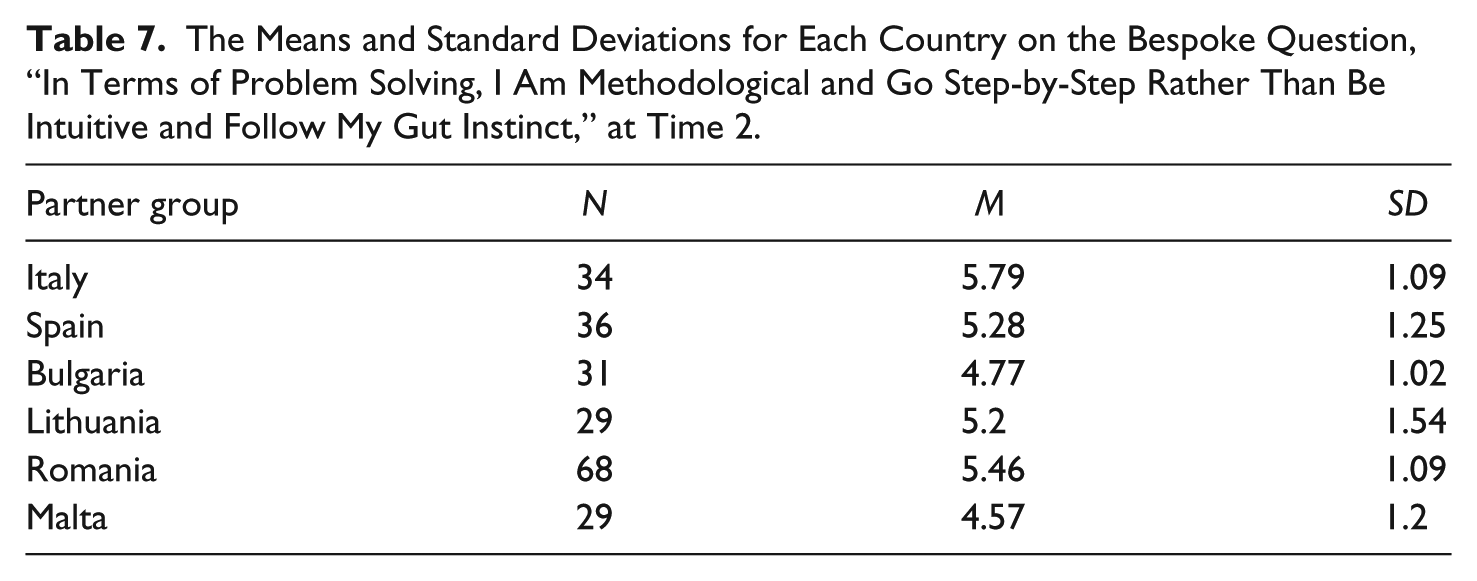
The means and standard deviations for each country on the bespoke question: “In terms of problem solving, I am methodological and go step-by-step rather than be intuitive and follow my gut instinct” at Time 2 is provided in Table 7.
The Means and Standard Deviations for Each Country on the Bespoke Question, “In Terms of Problem Solving, I Am Methodological and Go Step-by-Step Rather Than Be Intuitive and Follow My Gut Instinct,” at Time 2.
After adjusting for pre-intervention scores, there was a significant difference between the countries on post-intervention scores on the bespoke question, “In terms of problem solving, I am methodological and go step-by-step rather than be intuitive and follow my gut instinct,” F (5, 215) = 2.78, partial eta squared = 0.06. There was a weak relationship between the pre-intervention and post-intervention scores on the bespoke question, “In terms of problem solving, I am methodological and go step-by-step rather than be intuitive and follow my gut instinct,” as indicated by a partial eta squared value of .23.
Perception of Working Style
To evaluate the impact of the intervention on participants’ overall mean scores on the bespoke question, “Where possible, I prefer to work with others rather than work on my own,” using a 7-point Likert rating scale where 1 = not at all true and 7 = very true, a related t-test was conducted. There was not a statistically significant difference in the means from Time 1 at pre-intervention (M = 5.33, SD = 1.37) to Time 2 at post-intervention (M = 5.29, SD = 1.36), t(222) = 0.49, p > .05 (two-tailed). The mean decrease in personal growth subscale scores was .04 with a 95% confidence interval ranging from .14 to .04.
To compare the effectiveness of the intervention among countries on the bespoke question, “Where possible, I prefer to work with others rather than work on my own,” a one-way between-groups analysis of covariance was conducted. The independent variable was country (Italy, Spain, Bulgaria, Lithuania, Bulgaria, and Malta), and the dependent variable consisted of scores on the bespoke question, “Where possible, I prefer to work with others rather than work on my own,” after the intervention was completed. Participants’ scores on the pre-intervention administration on the bespoke question, “Where possible, I prefer to work with others rather than work on my own,” were used as the covariate in this analysis.
To ensure that there was no violation of the assumptions of normality, linearity, homogeneity of variance, homogeneity of regression slopes, and reliable measurement of the covariate, preliminary checks were conducted. The regression slope illustrating the relationship between the covariate and dependent variable for each country suggests a linear relationship for each country; however, the lines are noticeably different in their orientation, suggesting an interaction between the covariate and the countries.
Further inspection using Levene’s Test of Equality of Error Variances did not reveal a significant difference in variance, F(5, 217) = 1.82, p = .11.
The means and standard deviations for each country on the bespoke question, “Where possible, I prefer to work with others rather than work on my own,” at Time 2 is provided in Table 8.
The Means and Standard Deviations for Each Country on the Bespoke Question, “Where Possible, I Prefer to Work With Others Rather Than Work on My Own,” at Time 2.

After adjusting for pre-intervention scores, there was a significant difference between the countries on post-intervention scores on the bespoke question, “Where possible, I prefer to work with others rather than work on my own,” F(5, 217) = 3.93, partial eta squared = 0.08. There was a weak relationship between the pre-intervention and post-intervention scores on the bespoke question, “In terms of problem solving, I am methodological and go step-by-step rather than be intuitive and follow my gut instinct,” as indicated by a partial eta squared value of .31.
Perception of Communication Style
A related t-test was conducted to evaluate the impact of the intervention on participants’ overall mean scores on the bespoke question, “When communicating with others, I prefer things to be factual and literal rather than to talk about ideas and concepts,” using a 7-point Likert rating scale where 1 = not at all true and 7 = very true. There was a statistically significant increase in the means from Time 1 at pre-intervention (M = 5.16, SD = 1.43) to Time 2 at post-intervention (M = 5.40, SD = 1.27), t(221) = 2.47, p = .01 (two-tailed). The mean increase in personal growth subscale scores was .23 with a 95% confidence interval ranging from .42 to .47. The eta squared statistic 0.03 indicated a small effect size (Cohen, 1988).
A one-way between-groups analysis of covariance was conducted to compare the effectiveness of the intervention among different countries on the bespoke question, “When communicating with others, I prefer things to be factual and literal rather than to talk about ideas and concepts.” The independent variable was country (Italy, Spain, Bulgaria, Lithuania, Bulgaria, and Malta), and the dependent variable consisted of scores on the bespoke question, “When communicating with others, I prefer things to be factual and literal rather than to talk about ideas and concepts,” after the intervention was completed. Participants’ scores on the pre-intervention administration on the bespoke question, “When communicating with others, I prefer things to be factual and literal rather than to talk about ideas and concepts,” were used as the covariate in this analysis.
Preliminary checks were conducted to ensure that there was no violation of the assumptions of normality, linearity, homogeneity of variance, homogeneity of regression slopes, and reliable measurement of the covariates. The regression slope illustrating the relationship between the covariate and dependent variable for each country suggests a linear relationship for each country; however, the lines are noticeably different in their orientation, suggesting an interaction between the covariate and the countries. This is illustrated in Figure 6.
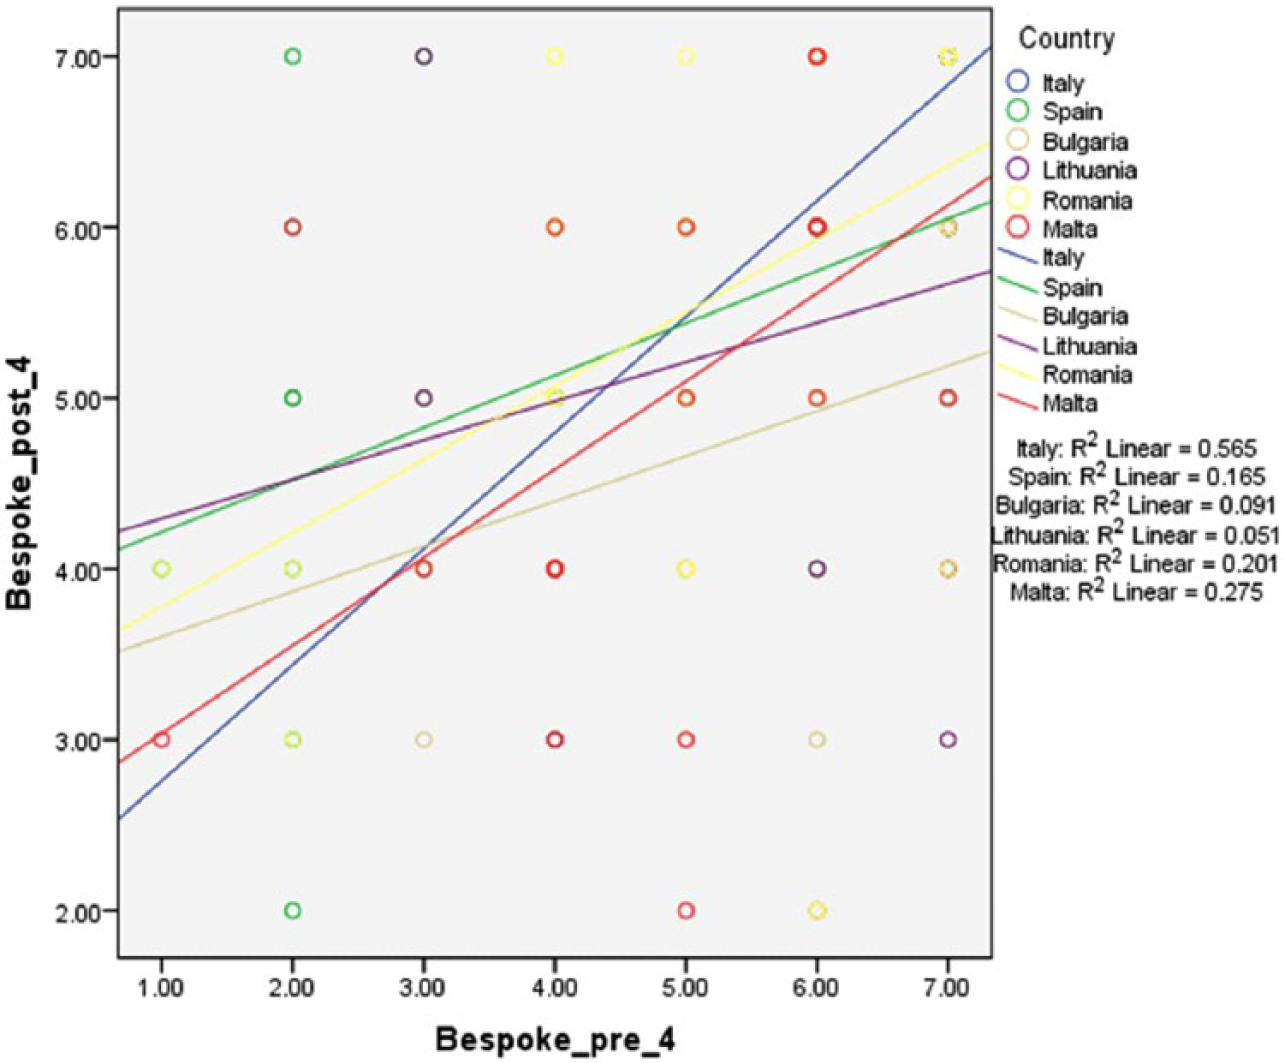
Regression slope scatterplot illustrating the relationship between the dependent variable (Bespoke question: “When communicating with others, I prefer things to be factual and literal rather than to talk about ideas and concepts” at Time 1) and the covariate (Bespoke question: “When communicating with others, I prefer things to be factual and literal rather than to talk about ideas and concepts” at Time 2) for each country.
Further inspection using Levene’s Test of Equality of Error Variances did reveal a significant difference in variance, F(5, 216) = 2.47, p = .03. The violation of this assumption may lead to a Type II error (to fail to reject the null hypothesis when there is a significant finding).
The means and standard deviations for each country on the bespoke question, “When communicating with others, I prefer things to be factual and literal rather than to talk about ideas and concepts,” at Time 2 is provided in Table 9.
The Means and Standard Deviations for Each Country on the Bespoke Question, “When Communicating With Others, I Prefer Things to Be Factual and Literal Rather Than to Talk About Ideas and Concepts,” at Time 2.

After adjusting for pre-intervention scores, there was a significant difference between the countries on post-intervention scores on the bespoke question, “When communicating with others, I prefer things to be factual and literal rather than to talk about ideas and concepts,” F(6, 216) = 4.66, partial eta squared = 0.09. There was a weak relationship between the pre-intervention and post-intervention scores on the bespoke question, “When communicating with others, I prefer things to be factual and literal rather than to talk about ideas and concepts,” as indicated by a partial eta squared value of .29.
Discussion
The aim of this research was to explore whether findings from the U.K.-based pilot intervention to facilitate vocational self-determination to increase aspirations and confidence about work and employment as well as individual knowledge and understanding about the strengths and weaknesses in relation to work and employment could be replicated on a much larger scale, across six European countries and different participation groups was supported.
Across all participating countries, participant’s scores on the personal growth subscale of the AI significantly increased after taking part in Talent 4 . . ., with significant differences on this measure between the countries (with participants in Italy reporting the most, and participants in Lithuania reporting the least, personal growth after participating). There was a statistically significant increase in the importance participants placed on personal growth across the sample, as well as differences between countries (with participants in Italy placing the most importance, and Lithuanian participants placing the least importance, on personal growth). While across all participants there was a significant difference in how likely future personal growth would be, there was not a significant difference in this measure between countries. There was a significant difference in how much personal growth participants reported to have attained post-intervention across all countries, as well as differences between countries, with the greatest personal growth reported by participants in Italy, and the least reported attained personal growth in Romania. While there was an increase in participant’s scores on the PCS after taking part in Talent 4 . . ., this did not reach statistical significance across or between countries. While there was no significant increase in participants’ preference for group work after taking part in a Talent 4 . . . programme, participant’s understanding of their strengths and weaknesses in terms of work and employment, self-reported methodological thinking and problem solving, and preference for factual and literal thinking styles significantly increased after taking part in a Talent 4 . . . programme. The evidence collected across six European countries provides evidence for the benefit to prisoners in articulating employability goals on personal growth and insight into strengths and weaknesses with respect to work employment, problem solving and thinking styles, supporting both theory and research on the benefits of self-determination initiatives on motivation and engagement (McKinney & Cotronea, 2011; Noe et al., 1990; Ryan & Deci, 2000).
While the Council of Europe (2006) member states are expected to continue to update and observe common principles regarding their prison policy, it is worth noting that penitentiary systems and prison regimes and systems do vary from country to country, which can result in different contexts in which the programme detailed here is delivered. For instance, across the countries detailed in this study, there is variation in prison density per 100 places (Aebi, Tiago, & Burkhardt, 2017) with Italy reporting the highest density (105.6% capacity), followed by Romania (101.3%), Lithuania (85.4%), Spain (82.3%), and Bulgaria reporting the lowest density (73.6% capacity; with Malta with missing comparable data). Moreover, the percentage of staff responsible for workshops or vocational training working inside penal institutions on the basis of full-time equivalents across countries also varies, with only Spain (2.4%) and Romania (0.3%) reporting such provision (Aebi et al., 2017). Such differences in the context in which the programme is delivered across institutions must be considered.
It has been argued that national variation in self-report ratings may not necessarily reflect absolute differences, but rather, cross-cultural variation in value attributed to those ratings. For instance, Diener, Suh, Smith, and Shao (1995) noted that differences in ratings of subjective well-being across nations may be due to true variability but may equally be attributed to factors related to self-report measurement such as variation across nations in whether it is desirable to say one is happy and driven by cultural norms rather than lived experience. Diener et al. (1995) found that cross-national differences in ratings of experience of subjective well-being were in line with differences in ratings of importance of this variable, suggesting that differences in norms governing the degree to which expressing and experiencing personal growth is desirable may be reflected by ratings of the importance of this variable. Moreover, differences in response styles in completing self-assessment tools across cultures have been observed (Hui & Triandis, 1989). In this study, there were differences in mean ratings of the importance of, attainment of, and likelihood to attain personal growth across the six countries; however, only differences in ratings of the importance of personal growth and attainment of personal growth reached statistical significance. The highest mean ratings of personal growth was in Italy (M = 6.12, SD = 0.4), and the lowest mean ratings on this measure was in Lithuania (M = 5.22, SD = 1.34);the importance of this construct was also highest in Italy (M = 6.78, SD = 0.31) and lowest in Lithuania (M = 5.73, SD = 1.38). It could be argued that the difference in the importance of personal growth across countries may reflect differences in normative expectations of the value of this construct across cultures as indicated by the importance of personal growth and self-reported attainment of this construct.
Future research could explore in greater depth the role of Talent 4… within each of the programmes in the participating countries, as it is possible that any differences in integration of the programme (e.g., whether Talent 4 . . . outcomes were directly linked into careers advice and work opportunities) could have had some impact on the findings in each country. This would allow for investigation of (a) differences in findings between countries, which might identify elements that are predictive of change in the factors measured here, and (b) how far the opportunities and resources to enable participants to meet their aspirations are available.
As noted in the introduction to this article, aspiring to achieve, and succeeding, is associated with significant well-being (Sheldon & Kasser, 1998). Having aspirations treated seriously and supported is particularly important as it is viewed as central to achieving lasting change in offender populations (HMI Probation, 2016). Nugent and Schinkel (2016) warn that “In the face of the strain created by their inability to achieve their aspirations, they (ex-offenders) might also return to . . . crime” (Nugent & Schinkel, 2016, p. 575).
It is useful here to place these findings in the context of the Good Lives Model (GLM: Ward, 2002). The GLM is a strength-based rehabilitation framework, which recognises the need for a holistic approach to offender rehabilitation. The GLM is centered around the concept that successful rehabilitation is contingent on building capabilities and strengths in people. The GLM promotes rehabilitation that is responsive to offenders’ particular interests, abilities, and aspirations, and rests on the premise that offending behaviour occurs when individuals lack both internal and external resources necessary to satisfy their needs using pro-social means. Ward and Stewart (2003) thus explain criminal behaviour as a maladaptive attempt to meet life values.
The GLM highlights that successful rehabilitation should equip individuals not only with the knowledge and skills needed to satisfy their life values but also with the opportunities and resources (in ways that do not harm others). The findings presented in this article suggest that Talent 4 . . . provided the knowledge and skills to enhance participant’s aspirations, but the research was unable to investigate whether the opportunities and resources to meet these aspirations were being met. An understanding of the wider careers and employment services in the local areas would be beneficial. However, it was beyond the scope of this research to investigate the integration of the programme into the wider work in each local area.
This study is not without limitations. While the self-assessment measures used have demonstrated good psychometric properties of validity and reliability across a range of settings (Bernarda & Taffesseb, 2014; Utvaer et al., 2014; G. C. Williams et al., 2006; G. C. Williams et al., 2004), self-report assessments are inherently limited due to concerns of social desirability (the tendency to rate oneself according to socially approved behaviour; Nunnally & Bernstein, 1994). Furthermore, self-assessment tools are based on the assumption that they reflect pre-existing states of mind and not ones generated by the questions themselves. It has been argued that by completing a questionnaire, the items might frame the reference for participants, thereby creating cognitions that may not have existed (Ogden, 2012). There is also much evidence to demonstrate discrepancies between self-evaluations and evaluations made by others (Brown & Knight, 2002). Future research might consider including evaluations made by others, objective changes in behaviour, as well as longitudinal research to track sustained changes and outcomes, particularly with respect to employment and recidivism.
While some data suggests that prison-based employability programmes have a positive impact on a reduced likelihood of reoffending (May et al., 2008), more recent evidence indicates that the relationship between employment and offending is more complex, with such programmes often resulting in greater time in returning to prison than not reoffending, with a need to increase the motivation of prisoners in sustaining employment to reduce the likelihood of reoffending (Tripodi et al., 2010). Further research suggests that prisoners may especially benefit from initiatives that explore feelings, subjective reaction, and attitudes regarding careers with more information to support prisoners in matching individual skills with particular jobs (Hurry et al., 2006). The study provides evidence of the effectiveness of approaches designed to support prisoners and the long-term unemployed to define vocational goals, to enable offenders to define work and life objectives to encourage intrinsically motivated aspirations, and to enable personal growth—intermediate factors related to improved employability. The examination of how programmes achieve intermediate outcomes related to reducing reoffending is a method acknowledged by the National Offender Managements Services for England and Wales (Burrowes et al., 2013). Future research might explore the effectiveness of initiatives designed to facilitate vocational self-determinism on post-release employment and reoffending to determine the longer term impact.
Footnotes
Author’s Note
Laura Caulfield’s affiliation is now the University of Wolverhampton.
Declaration of Conflicting Interests
The author(s) declared no potential conflicts of interest with respect to the research, authorship, and/or publication of this article.
Funding
The author(s) disclosed receipt of the following financial support for the research, authorship, and/or publication of this article: This work was supported by a grant from the Leonardo Transfer of Innovation fund, which is part of the European Union (EU) Lifelong Learning Programme.