
Abstract
The Redeploy Illinois (RI) program was created to provide services to nonviolent, moderate to high-risk youth who were likely to be committed to the Illinois Department of Juvenile Justice (IDJJ), which oversees juvenile correctional institutions. Participating counties received financial support from the state to offer various community-based services to youth instead of incarceration. The current research evaluated the impact of the RI program in reducing recidivism from the four pilot sites during state fiscal years (FY) 2006 through 2010. Results showed that youth who completed the program had fewer convictions compared with pre-program (Pre-RI) youth as well as those who were deemed unsuccessful. The findings also demonstrated a longer survival time for RI successful youth relative to those who were unsuccessful and pre-program youth. A discussion of limitations, implications, and future directions was also provided.
Introduction
Over the past two decades, researchers and juvenile justice practitioners have implemented various juvenile diversionary programs, some of which were evidence-based or promising interventions, to reduce juvenile reoffending and the cost of juvenile incarcerations. The programs have ranged from pre-trial diversion to post-adjudicatory interventions offered in institutional or community settings. Although there was substantial evidence available that evidence-based programs reduced juvenile offending, fewer than 5% of eligible youth were placed in these programs (Greenwood, 2008).
According to Greenwood (2008), community-based programs that emphasize a family-oriented approach are some of the most successful programs. Others have reported that diversionary programs structured around risk and protective factors and youth needs tend to reduce reoffending (Dembo et al., 2008; Henggeler et al., 2009; McBride et al., 1999). Almost a million youth are processed through the juvenile justice system in any given year, yet only a handful of states have begun implementing evidence-based or other promising programs. Moreover, sending youth to juvenile institutions has placed an enormous financial burden on states. In 2014, approximately 975,000 delinquency cases were handled by the juvenile courts for criminal law violations in the United States. Of those cases, juveniles younger than 16 years accounted for 53% of all delinquency cases. The same age group accounted for 61% of offenses against persons, 53% against property, 50% involving public-order offenses, and 40% involving drug offenses. The most common court disposition was probation (63% of adjudicated cases, n = 183,200), followed by residential placement in detention, correctional, and shelter facilities (26%, n = 75,400; Hyland, 2018). In addition to juveniles being handled within the juvenile justice system, about 200,000 youth annually enter the adult criminal justice system, mostly for nonviolent offenses (Lahey, 2016). On any given day, anywhere from 10,000 to 12,000 youth are housed in adult prisons and jails (Lahey, 2016). Incarcerating these youth costs the United States $8 to $21 billion annually (Shock, 2015).
The high cost of incarceration and reports of abuse of youth in juvenile correctional facilities coupled with the limited success of incarcerating youth have caused some states to rethink their priorities and reallocate funding from state-funded youth prisons to treatment and services within the local community (The Annie E. Casey Foundation, 2011; Sakala et al., 2018). These funds are not intended to duplicate existing services, but to develop evidence-based community services. Despite the skyrocketing costs of juvenile incarcerations and the lack of evidence that incarceration reduces further offending, progress toward the implementation of effective programs has been slow (Greenwood, 2008; National Research Council, 2013). One of the main challenges has been involving the family in juvenile justice processes. The National Research Council (2013) indicates the need for further research on successfully involving parents in the juvenile justice processes.
Another problem is connecting risk/needs assessment with treatment. Studies have shown that interventions for low-risk offenders have not been as effective in reducing recidivism as they were for high-risk offenders (Lowenkamp et al., 2006; Lowenkamp & Latessa, 2002). In addition, many of the programs do not integrate comprehensive community-based programs using the wraparound process—“a long-term approach to planning and coordinating the provision of both formal and informal services in the community” (Burns et al., 2000, p. 283). Therefore, it is crucial to address whether programs that incorporate risk/needs assessment, individualized and family-centered approaches, and wraparound services are successful (or promising) in reducing or preventing juvenile offending and reoffending. The current research evaluates the impact of Redeploy Illinois (RI), a community-based program that emphasizes family-oriented approaches to treatment, in addition to structuring the program around youth’s risk and protective factors and needs as well as a wraparound process.
Evidence-Based Delinquency Prevention Programs
Researchers have recommended different approaches to implement evidence-based prevention and intervention programs for juveniles. Lipsey et al. (2010) suggested three methods: (a) conduct a direct evaluation of individual programs used in practice, (b) select a list of model programs used in practice with fidelity, and (c) implement a program that has shown to be effective from meta-analyses with at least an average effect. Each of these approaches applies to specific situations. Direct impact evaluations are used to test unique or innovative programs that have not been implemented or have been implemented in different circumstances. In the model program approach, selection of a well-developed and tested model programs, such as Functional Family Therapy (FFT) and Aggression Replacement Therapy (ART), is an ideal method. Another approach is to review meta-analyses of interventions that evaluate both brand-name and generic programs and select the ones with at least an average positive effect (Lipsey et al., 2010).
Generic programs mixed with model programs often show a positive effect. Lipsey (2009) conducted a meta-analysis of 548 delinquency intervention programs from 1958 through 2002. The study found large positive effects for group counseling, mentoring programs, behavioral interventions such as cognitive-behavioral programs, and family counseling programs. The family counseling programs covered both generic programs and model programs such as FFT and Multisystemic Therapy (MST). Although the model programs showed positive effects on recidivism, some of the generic programs had more substantial effects than the model programs (Lipsey et al., 2010).
Studies have shown that community-based diversionary programs, such as counseling (Latimer, 2001; Lipsey et al., 2010), cognitive-behavioral interventions (Landenberger & Lipsey, 2005), MST, and FFT (Borduin et al., 1995; Greenwood, 2008; Henggeler, 2004; Henggeler & Sheidow, 2002), are more effective in reducing reoffending than formal interventions based on deterrence, discipline, probation, and parole supervision (Andrews et al., 1990; Aos et al., 2001; MacKenzie, 2006; MacKenzie et al., 2001). For example, specific programs rooted in deterrence (e.g., Scared Straight) appear to have either no impact or a negative one on reducing reoffending (Petrosino et al., 2003). Moreover, examining multiple studies on juvenile boot camp programs, MacKenzie (2006) found that the negative impact of these programs was similar to those found for adults. In addition, diversionary programs that primarily rely on case management, monitoring, and sanctions were ineffective in reducing reoffending. Schwalbe et al.’s (2012) study of 28 juvenile diversion programs found those that included family-based interventions and restorative justice elements significantly reduced recidivism (Schwalbe et al., 2012) relative to those that relied on case management approach.
Despite evidence that some promising generic and model programs are effective in reducing reoffending, many of these interventions lacked a comprehensive approach to addressing youth offending. Some programs have utilized wraparound services, whereas others did not incorporate long-term services. Thus, it is vital to recognize whether or not community-based programs that apply risk and protective factors, include individualized and family-centered programs, and structure them around a wraparound philosophy have a positive impact and can be considered promising—or something that works.
Until recently, only a handful of different community-based programs had been developed to assist with the prevention and reduction of juvenile offending and reoffending using the approaches mentioned above. Two such programs are the Ohio youth program Reasoned and Equitable Community and Local Alternatives to the Incarceration of Minors (RECLAIM Ohio) and Youth Aids in Wisconsin. RECLAIM Ohio was created in 1993 as a result of House Bill 152. The program was able to reduce the Department of Youth Services (DYS) population from 2,600 in 1992 to fewer than 510 in 2013 (Ohio Department of Youth Services, n.d.). The program offered 647 different programs, including cognitive-behavioral programs, family preservation services, parental support training, mental health counseling, mediation to substance abuse treatment, and truancy services. The evaluation showed that the length of the program and the dosage are essential in determining the effect of the program (Latessa et al., 2014). For example, high-risk offenders tend to respond better “to a higher ‘dose’ of treatment …” compared with moderate or low-risk offenders (Latessa et al., 2014, p. 64). Due to the success of the RECLAIM program, DYS created Targeted RECLAIM (TR) in 2009, which provided incentives to counties with the highest level of youth commitments to divert them from DYS to community-based programs. Preliminary evaluation of the TR program showed a 39% decline in DYS admissions in 2010 and another 23% reduction in 2011 (Spiegel et al., 2018). Wisconsin’s Community Youth and Family Aids Program, also known as the Youth Aid, was established in 1981. The purpose of the program was to provide direct funding to counties to cover juvenile delinquency services, including the cost of sending the youth to juvenile correctional institutions. To further assist the counties, the legislators provided guidelines for reducing out-of-home placement of youth by developing guidelines for county-level intensive supervision programs (Legislative Audit Bureau, 1999).
The current article assesses the impact of the RI program in reducing recidivism (Illinois Department of Human Service [IDHS], 2010). The RI program was modeled after the success of RECLAIM Ohio and the youth aid programs in reducing juvenile incarcerations. They offered needed services in the community, incorporating both evidence-based programs as well as innovative programs to address the specific needs of the youth. Youth are accepted into the RI program after being formally charged. Data were compiled 3 years prior to the start of the RI program (Pre-RI) and 5 years after the implementation of the program (RI).
RI Program
To address the high cost of incarceration, as well as the lack of community-based alternatives for juvenile delinquents, Illinois legislators passed the RI law in 2003, with funding starting in 2005. The law provides counties with funding for community-based services for nonviolent youth, including education, recreation, community service, crisis and health intervention, substance abuse treatment, mental health assessment and treatment, and family counseling. The overall goal of the program is to encourage the deinstitutionalization of juvenile offenders through the reallocation of state funds from juvenile correctional confinement to local jurisdictions to provide community-based sanctions and treatment alternatives.
Before the start of the juvenile justice initiatives (e.g., RI), nearly 1,800 juveniles were incarcerated annually, costing the state more than $100 million a year. About 30% of juvenile commitments were for court-ordered mental health evaluations. In fiscal years (FY) 2005 to 2007, 63% of juvenile admissions to Illinois Department of Juvenile Justice (IDJJ) were for nonviolent offenses, 43% for property offenses, and 31% were for committing offenses against persons (Bostwick et al., 2013). Also, the 3-year recidivism rate before the start of the RI program was about 50% (IDHS, 2008).
Not all youth are eligible for the program; for example, it excludes youth who have committed murder or Class X forcible felonies (e.g., aggravated sexual assault, aggravated assault with a weapon, or robbery). At first, funding was given to four pilot sites, which were obligated to reduce the number of youths IDOC (later IDJJ) commitments by 25%, based on the average number of commitments for the previous 3 years (i.e., baseline). These counties initially received funding in FY2005 and started implementing the program in FY2006. The key players or entities included the program sponsors (IDHS, Illinois Criminal Justice Information Authority [ICJIA], and the RI Oversight Board), local advisory boards, juvenile judges, juvenile state’s attorneys, public defenders, probation departments, community restorative board, and service providers.
RI Program Content
The different sites evaluated in the current study include a variety of programs to address juvenile delinquency. Four strategies commonly used across redeploy locations include FFT, MST, ART, and Washington Aggression Interruption Training (WAIT). Sites are required to use at least one of the evidence-based family therapy programs in addition to cognitive-behavioral programs and wraparound services.
One commonality across all sites included here was FFT. FFT centers on prevention and intervention rooted in empirically supported concepts and clinical theory to address issues faced by juveniles (Sexton & Alexander, 2000). Findings from FFT research underscore the effectiveness of such programs. For example, Sexton and Turner (2010) found that when therapists adhered to FFT, the treatment group had significant declines in recidivism for felonies (35%), violent crimes (30%), and misdemeanors (21%) compared with a control group. Furthermore, a meta-analysis of 14 studies comparing the effectiveness of FFT versus alternatives for juveniles highlights the positive influence of FFT on problematic behavior. That research discovered that the impact of receiving FFT was more effective than control groups and alternative treatments, including cognitive-behavioral therapy (CBT) (Hartnett et al., 2017).
At its core, MST is a community-based treatment rooted in creating positive change in various social settings for juveniles with serious behavioral issues. The research underscores that MST is one of the most successful treatment options for addressing juvenile delinquency. A meta-analysis including 22 studies and more than 4,000 of MST discovered that although the influence was small, it was significant and consistent when examining not only delinquency but also substance use and placement outside of the home (Stowe et al., 2014). Moreover, the literature has identified that MST can have a lasting positive impact over time. Henggeler et al. (1993) discovered that when examining rearrests for juveniles after an average of more than 2 years following MST, those who had received the treatment were less likely to be arrested than juveniles who did not receive such treatment.
The final two programs, specifically ART and WAIT, have an underlying similarity regarding both focusing on the role of aggression. Both programs are cognitive-behavioral interventions and focus on three areas to combat problematic behaviors, including social skills, anger control, and moral reasoning. A systematic review of 16 studies focused on ART revealed that this program had a positive influence on reducing recidivism and issues with anger in successfully promoting the reasoning and social skills of juveniles (Brännström et al., 2016).
Method
The current study evaluated the impact of the RI program in reducing recidivism at the four pilot sites during state FY2006 through FY2010. The four pilot sites included three counties and a judicial circuit (encompassing 12 rural counties in southeastern Illinois). These counties represent both urban and rural areas in Illinois. As per the 2010 U.S. Census, African Americans represented 17.5%, 18.5%, and 30.5% of the population in counties 1, 2, and 3, respectively. In contrast, counties in the Judicial Circuit were overwhelmingly Caucasian (anywhere from 84% to 96%).
Demographic Profile of the Pilot Sites
County 1 is centrally located in the state, with a population of 110,730. About 23% of the population is below 18 years of age; African Americans represent about 16% of the population (U.S. Census Bureau, 2010). Most of their juvenile cases come from the city. It is home to a university, a community college, and a major agribusiness company and two major regional hospitals. It is considered a blue-collar community. County 2 also centrally located in the State of Illinois, with a population of 186,834. Persons below 18 years of age make up approximately 24% of the population, and African Americans make up about 18% of the population (U.S. Census Bureau, 2010). It is at the center of a multicounty region along the Illinois River, located midway between Chicago and St. Louis. It is home to two universities, two colleges, major business centers, and hospitals. Like County 1, a significant portion of youth who were involved in the juvenile justice system come from one of its major cities. County 3 has a population of 270,259. Like County 2, persons below 18 years of age make up approximately 25% of the population in County 3. African Americans represent about 30% of the population (U.S. Census Bureau, 2010). It is home to a correctional center, an Air Force base, and an airport. The County has high levels of poverty, unemployment, and high crime, including juvenile crime. The Judicial Circuit, made up of 12 rural counties, is in southeastern Illinois. The counties are considered very poor. The total population is approximately 203,412. As of 2005, the African American population made up 2.8%; 22% of the population was below the age of 18 (U.S. Census Bureau, 2010).
Description of RI Program in the Pilot Sites
Each of the pilot sites used intervention programs to meet the needs of their clients. Most importantly, all counties incorporated a family-centered approach to treatment. For example, all pilot sites used FFT or offered individualized services to youth and families, in addition to substance abuse, mental health, anger management, and cognitive-behavioral programs. In the first county, the RI program offered individualized services based on a youth’s identified risk level. Local community restorative boards, made up of a small group of local citizens, would meet with juveniles and their families to develop an agreement with them. These agreements were intended to restore the community relations as well as hold juveniles responsible for their actions. Before the RI program, the County was ranked ninth highest in the state for per capita juvenile commitments to IDJJ (Kethineni, 2013; U.S. Census Bureau, 2010). Youth placed in the RI program received services based on their individual needs such as mental health and substance abuse services, individual counseling, tutoring, and general education development (GED) preparation assistance, vocational and employment skills training, crisis services, parental groups, and participation in community garden project and mowing program in the summer. The program also developed community restorative boards (CRBs) whose goal was to assist in restorative justice by providing support to the victims, the affected community, and the youth and their families. Also, the county utilized evidence-based programs such as MST, ART, and WAIT.
In the second county, the RI program was a collaborative effort between county court services and the Children’s Home Association of Illinois (CHAIL). Juveniles entered the program through a referral from either a juvenile court judge or a member of the probation staff. One of the requirements of the program is that parents must agree to participate in program assignments. Instead of sending youth to the Illinois Department of Corrections, they were referred to a local residential facility for court-ordered evaluation. Each juvenile was assessed by CHAIL staff to develop an individualized service plan and a plan for the family. Finally, each youth was linked to resources in the community (IDHS, 2008) such as mental health and substance abuse services, individual counseling, tutoring assistance, life-skills training, mentoring, and domestic violence intervention. Also, the RI program utilized evidence-based programs such as WAIT, ART, and FFT.
In the third county, the RI program was supervised by the county youth coalition (CYC). The coalition consisted of over 100 community stakeholders and youth service providers. A court liaison assisted youths and their families with the court process and linked them to services. During the assessment process, youths were housed at a local detention center. Once the assessment was completed, the case plan was submitted to the judge, who made the final decision regarding eligibility for the RI program. County 3 provided mental health and substance abuse services, individual counseling, family counseling, tutoring assistance, crisis services, parenting program, vocational training, domestic violence intervention, as well as disability services, transportation services, foster care services, and equestrian therapy. The program also utilized evidence-based programs such as MST, ART, WAIT, and FFT.
In the judicial circuit, the RI program primarily focused on medium (moderate)- to high-risk juveniles. Probation officers and community-service providers monitored and provided services to youths based on individualized plans. A juvenile justice council served as a liaison between RI and the criminal justice stakeholders and service providers (IDHS, 2008). The circuit provided mental health and substance abuse services, individual counseling, family counseling, tutoring and GED assistance, crisis services, vocational training, domestic violence intervention, as well as sexual counseling, sex offender treatment, and wilderness program. Also, the circuit utilized evidence-based programs such as MST, ART, WAIT, and FFT.
Referral Process of RI-Eligible Youth
From FY2006 through FY2010, 1,121 RI-eligible youth were referred to the program. The referral may have come either from a juvenile court judge or a probation officer. Once the referral was made, either the probation, the juvenile justice council, or a service provider took the lead role in assessing youth risk and needs, developed a plan, and linked services to meet the needs of the youth and his or her family. In County 1, the probation department contracted out services to agencies in the county, including cognitive education and treatment, teen court, life-skills counseling, gender-specific programs, community restorative boards, substance abuse, and mental health treatment, mentoring, and needed services. In County 2, the youth was first evaluated by a clinical director, who reviewed the case with an assessment therapist. Parents and the youth were contacted, a service plan developed, and the case assigned to a youth worker. In County 3, a court liaison assisted youth and their families with the court process and linked them to services. During the initial assessment process, youth were housed at a local detention center. Upon the completion of the assessment, the case was referred to the juvenile court judge, who made the final decision on youth’s eligibility. Once determined to be eligible, the case was referred to as lead agency, which provided case management based on multidisciplinary assessments. The agency worked closely with other service providers. Although counties had the option of developing specific programs depending on demographics and the needs of the youth, they all had to use evidence-based programs such as ART, FFT, WAIT, and MST.
Data Collection Procedures
Data from multiple sources—probation, IDJJ, and service providers—were compiled. Arrest data were obtained from the counties’ electronic databases (such as TRACKER), manual searches in smaller counties, or other electronic systems available. The IDJJ entry and exit data were gathered from the ICJIA, who matched cases based on the data that they received from the IDJJ. If the entry and exit data were missing, they were cross-checked with each probation department files. The statewide arrest data—Criminal History Record Information (CHRI)—would have provided more accurate arrest data. However, due to delays in obtaining permission from the State Police, who maintain the statewide data, the research relied on county-level arrest information. Arrest data included age, gender, race/ethnicity, number of prior arrests, number of prior technical violations, class of prior offenses, prior dispositions, current offense, class of current offense, date of sentence for the current offense, type of current sanction, subsequent arrests, subsequent technical violations, class of subsequent offenses, disposition for subsequent offenses, referral to RI, risk levels using the Youth Assessment and Screening Instrument (YASI), subsequent adult offenses, and convictions for adult offenses. The YASI prescreen consisted of 34 items across nine domains, and the full assessment had ten domains with 90 items. Studies both in the United States and Canada have shown high predictive validity of YASI in predicting reoffending, including reoffending violent offenses (Jones et al., 2016; Orbis Partners Inc., 2007).
In addition to the criminal history information, the probation data included the date assigned to probation and IDJJ commitments (full vs. evaluation commitments). Misdemeanor and court supervision cases were excluded unless they were referred to the RI program or received IDJJ commitments. The list of youth referred to the RI program was compiled from probation departments as well as court records. The list was sent to service providers requesting the RI start and end date, type of service provided, completion status, and discharge reasons. Also, an 18-month follow-up (between July 1, 2010, and December 30, 2011) on recidivism was collected. Finally, we compared the data 3 years prior to the RI program (FY2003–FY2005) and 5 years from the start of the RI program (FY2006–FY2010) from the pilot sites.
The researchers have also compiled data from probation departments, circuit court clerks’ databases, and the IDJJ to determine if the RI program reduced rearrests, reconvictions, and reincarcerations. Follow-up recidivism data were gathered between July 1, 2010, and December 30, 2011. First, permission was obtained from the juvenile court judge and the director of county court services to allow the researcher access to quantitative data on the youths. Second, approval from the university Institutional Review Board (IRB) was secured. The IRB approved the procedures outlined in the protocol, including the use of the LEADS database (a state-level criminal history data) to compile criminal history information, county-level electronic databases, and hard files where an electronic database was not available; however, the LEADS data were not given to the researcher in a timely manner to be included in the report. Instead, the researchers compiled the county-level criminal information from individual counties. Once approvals were received from the juvenile court judge and the IRB, confidentiality agreements were signed. The researchers utilized multiple sources and data to maximize the validity of the results. Data were collected from county probation records, county circuit clerk data, the ICJIA, service providers, and online public access records of adult criminal histories. In rural counties, hard files and Microsoft Word documents were used to gather the above information. In addition to the county-level data, IDJJ entry and exit dates were obtained from ICJIA because counties did not keep track of when youth were admitted to IDJJ or when they exited the system. To calculate the length of stay, exit and entry dates were obtained from ICJIA. These dates were matched with the date of the sentence from county and circuit court records. Whenever there was a discrepancy of more than 30 days between the date of the sentence and the IDJJ entry date, the evaluation team went back to the county records to check the dates. The quantitative data were used to assess the number of youths placed in the RI program, their profiles, which included prior criminal histories, risk levels, and court orders, as well as the types of services offered and if the program was a success or failure.
The RI program and study sample
Data about services received by the youth and their families were gathered from multiple sources: service providers, county probation departments (in the Judicial Circuit), and consultants. In some counties, treatment data were not systematically gathered or documented. As a result, the evaluation team reviewed the sentencing order to identify youth who were ordered by the court to be placed in the RI program. Once the youth’s referral data were documented, service providers were contacted to determine if the services were received, and the exit status from each of the treatment. A total of 1,121 youth were referred to the RI program from the four pilot sites—County 1 (n = 227), County 2 (n = 245), County 3 (n = 161), and Judicial Circuit (n = 487). Of those referred, 972 were accepted and 149 were rejected due to ineligibility or refusal of the youth to participate in the program. The Pre-RI data were compiled from two counties—County 1 and County 3—and the Judicial Circuit. One of the counties did not have the data available for the time frame (FY2003–FY2005). Pre-RI data collection resulted in 749 youth who met the RI eligibility criteria.
Research Design
To measure the RI program effectiveness, the researchers compared outcomes for the groups that received the RI programs (successful, unsuccessful, and neutral discharge) as well as the group that did not receive the RI program (i.e., the Pre-RI group). The following is the description of the RI-eligible youth and comparison of recidivism of program completers and dropouts:
RI-eligible youth (i.e., RI-referred, RI-accepted, and RI-rejected youth) from four pilot sites during the research period (FY2006–FY2010). The RI law (Public Act 93-0641) defines RI eligibility by “excluding minors sentenced based upon a finding of guilty of first-degree murder or an offense which is a Class X forcible felony as defined in the Criminal Code of 1961” (730 ILCS110/16.1). Compare recidivism of RI program completers, unsuccessful discharge cases, and Pre-RI youth. Neutral discharge cases and not accepted cases were excluded from survival analyses because either they were sent to IDJJ, IDOC, or jail for noncompliance; left the jurisdiction, referred to other services. Follow-up offense history (both juvenile and adult) was compiled from July 1, 2010 to December 2011. This time frame gave a follow-up period of at least 18 months, although some youth may have had more than 3 years of reoffending information.
Dependent Variables
The current study included two dependent variables: subsequent offenses and reoffending time, the first of which involves juvenile status in the program. The first dependent variable was subsequent offenses. Subsequent offenses were measured as any adjudications after the RI current adjudicated offense and included both juvenile and adult offenses for 18 months from the start of the RI program. These offenses were categorized by offenses against person, sex, property, drug, weapons, other, and technical violations. The second dependent variable was reoffending time. The length of time to reoffend was calculated using the date of adjudication for those who participated and completed the RI program and reoffended compared with those who did not complete the program and reoffended. The adjudications included both new offenses and technical violations.
Independent and Control Variables
Several independent variables were included, such as prior offenses, prior adjudications, first adjudicated current offense, risk levels, and program status. Prior offenses included any adjudicated offense 3 years before the start of the RI program (before FY2006). These offenses are categorized into offenses against the person (coded 1), sex (coded 2), property (coded 3), drug (coded 4), weapons (coded 5), other (coded 6), and technical violations (coded 7). Prior adjudications included adjudications 3 years before FY2006 for the RI-eligible youth referred to the program. Categorized as juvenile continuance (coded 1), probation (coded 2), IDJJ evaluation (coded 3), IDJJ full commitment (coded 4), juvenile court supervision (coded 5), conditional discharge (coded 6), detention (coded 7), dismissed (coded 8), and information/pretrial (coded 9). For Cox regression, age, race, and gender were included as covariates.
The first adjudicated current offense was measured to include RI-eligible felony cases, technical violations that resulted in adjudication, and misdemeanor cases that resulted in an IDJJ commitment for court evaluation and referral to the RI program (i.e., FY2006–FY2010). These offenses are categorized into offenses against a person (e.g., aggravated assaults, assaults, domestic violence, battery, aggravated battery, mob action, resisting arrest, obstruction of justice, and harassment), sex (e.g., prostitution, criminal sexual abuse, and aggravated criminal sexual assault), property (e.g., burglary, residential burglary, theft, auto theft, and possession of stolen vehicle), drug (e.g., possession of controlled substance, DUI, selling liquor to a minor, possession of alcohol by a minor, manufacture and delivery of controlled substance makes up the drug-related offenses), weapons (e.g., aggravated unlawful use of a weapon, unlawful possession of a firearm, and unlawful use of a weapon), other (e.g., false alarm, using invalid Firearm Owners Identification [FOID] card, intimidating a witness), and technical violations. These included adjudicated cases rather than individuals (some youth were adjudicated more than once during this time period).
The YASI was administered to determine the risk level. There are 10 domains representing family, legal history, school, community/peers, alcohol/drugs, mental health, violence/aggression, attitudes, skills, and employment. Levels are documented as high (coded 3), moderate (coded 2), and low (coded 1) risk. The YASI assesses risk and needs as well as protective factors in the juvenile population. “Protective factors to help caseworkers build on the strengths of youth to buffer the negative impact of risk” (Orbis, n.d., para 1). The risk factors are used to identify the needs and develop an appropriate intervention strategy.
RI program status was categorized as successful completion (coded 1) and unsuccessful (coded 2). Neutral and Active cases were not included in the survival analyses. Successful completion includes program completion. Although some of the youth were adjudicated for committing a new crime while in the program, they were considered making a successful transition to completing the program. Unsuccessful completion includes failure to complete the program, refusal to participate, not following the program guidelines, or adjudicated for a new offense or a technical violation. Neutral cases are those where youth moved to a different jurisdiction, was dropped from the program due to an interruption in funding or was marginally successful. Active cases are those where youth are receiving services at the time of the study. In addition, RI program participants, Pre-RI youth were included as a third group (coded 3).
Multiple control variables were also included here, including age, race, and gender. Age was calculated using the youth’s date of conviction for the current offense for which the youth was placed in the RI program and the date of birth. The race of the juvenile was classified as Caucasian (coded 1), African American (coded 2), and Other (coded 3). The other category included Hispanic, Asian/Pacific Islander, biracial, and Other. The final analysis was conducted on three groups: the Pre-RI group, RI successful group, and RI unsuccessful group.
Analyses
This research incorporated multiple analyses, including descriptive statistics, Kaplan–Meier survival analysis (KMSA), and Cox regression. Descriptive analyses were used to examine demographic information, offense history, and the number of youth reoffending. Also, RI program information, including the number of youth referred to, services received, and the exit status, was compiled.
KMSA was used to examine the length of time it took to reoffend (time-to-event) among youth who participated and completed the RI program compared with those who were deemed unsuccessful and the Pre-RI youth (Kaplan & Meier, 1958; Lee, 1992). KMSA is an appropriate descriptive procedure for time-to-event variables when time is considered the only salient variable. KMSA also generates a log-rank statistic that tests the equality of survival functions by weighting all time points the same. Finally, Cox proportional hazards model (i.e., “Cox regression”) was conducted to ascertain the effects of independent variables (e.g., before and after RI) on time-to-fail (i.e., recidivate) over the 18-month period. The Cox regression is a standard method for analysis of time until an event or time between events in the presence of censored cases (Allison, 1984; Lee, 1992). Because the Cox regression model does not require specifying a baseline hazard rate or estimate of absolute risk (i.e., no distributional assumptions about recidivism) and allows the researcher to determine the effects of predictors (i.e., covariates) on a status (e.g., event) variable, it is preferred over other event history models such as exponential models (Lee, 1992).
Results
Gender, Age, Race, and Offense Information of Individual Pilot Sites
When comparing county-specific data, about two thirds of youth referred to the RI program were males. African Americans represented roughly three-fourths of all included youth in each of the three counties. However, the Judicial Circuit had most of the youth who were Caucasian (n = 419, 86%), and represented the demographics of the rural counties. The risk levels were not documented in all cases. Overall, most of the youth placed in the RI programs were either moderate or high risk (see Table 1). The county-specific data of the Pre-RI youth showed a similar racial representation of the RI counties (see Table 2).
Characteristics of RI-Eligible Youth Referred to the Program in the Four Pilot Sites (FY2006–FY2010).

Note. Information about one of the cases is missing. Due to rounding errors, percentages may not total 100. RI = Redeploy Illinois.
Characteristics of Eligible Pre-RI Youth From Three Pilot Sites (FY2003–FY2005).
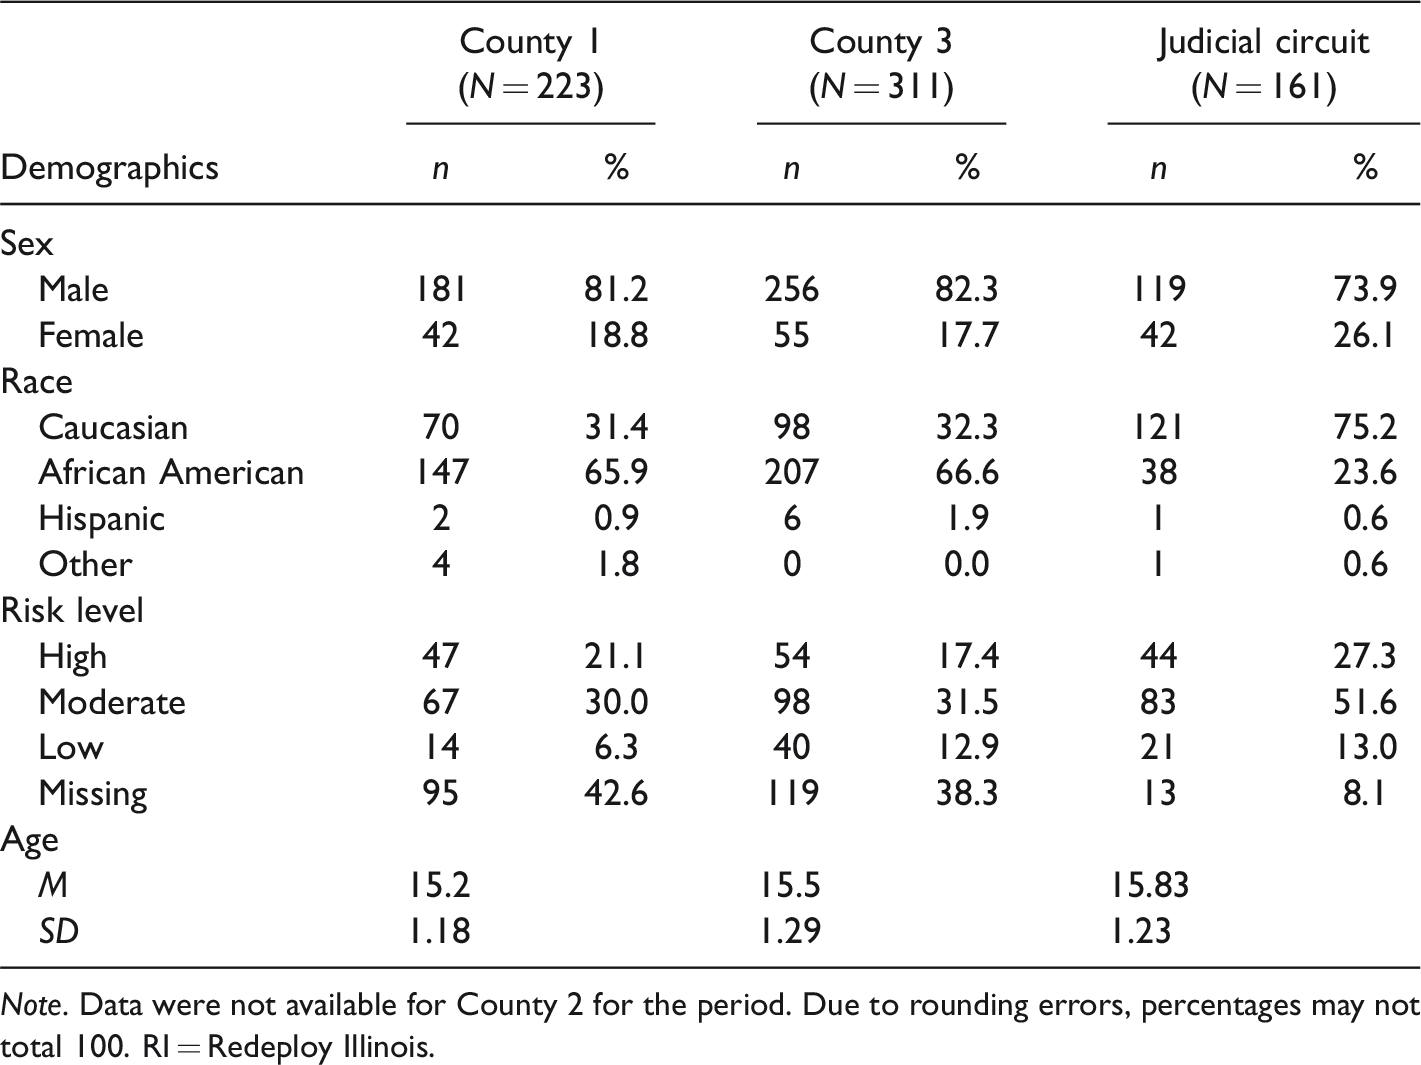
Note. Data were not available for County 2 for the period. Due to rounding errors, percentages may not total 100. RI = Redeploy Illinois.
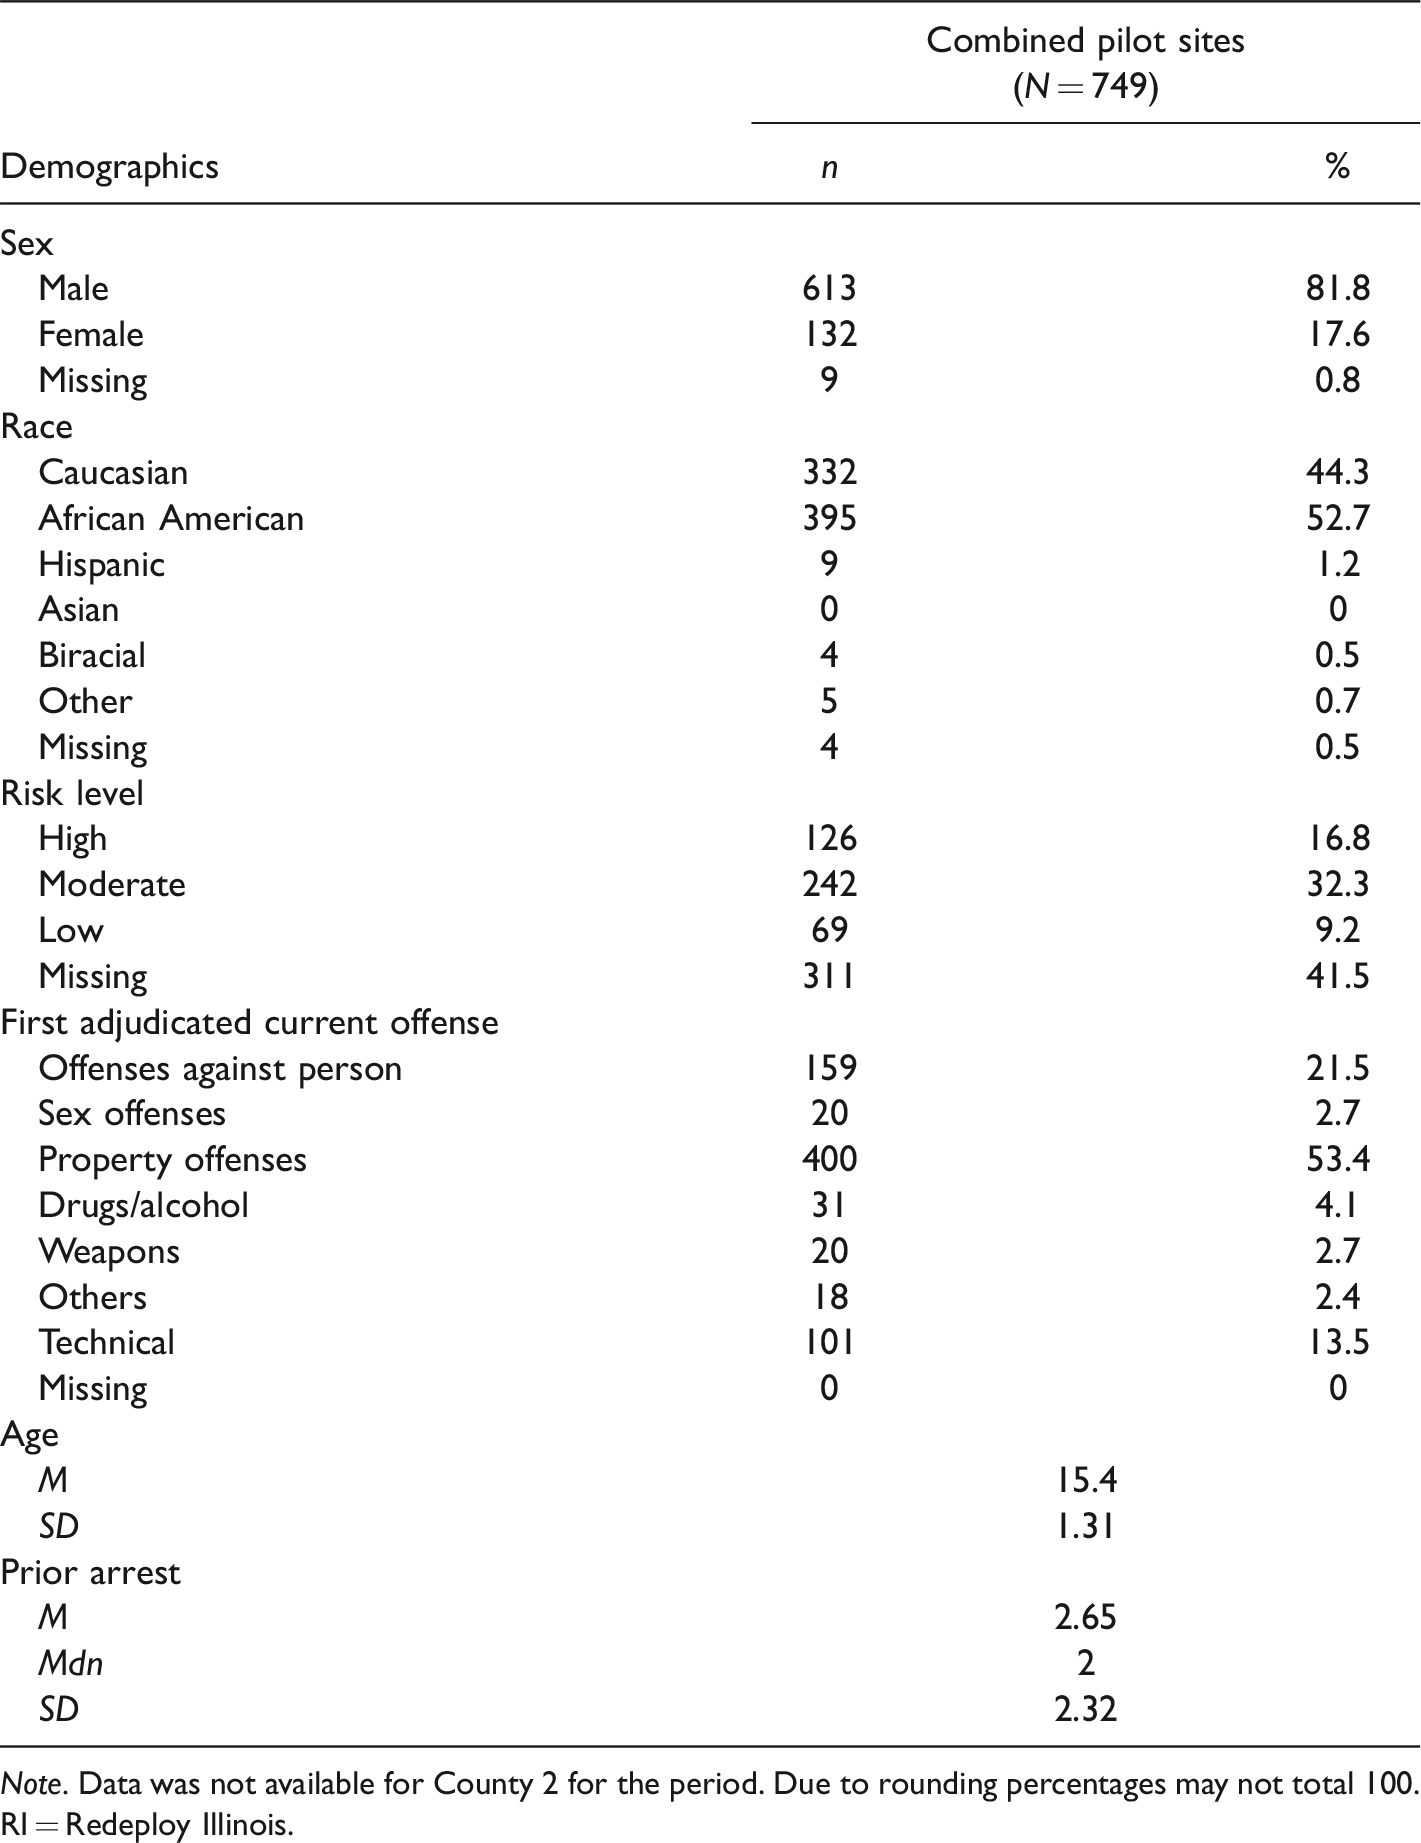
Gender, Age, Race, and Offense Information of Combined Pilot Sites
The combined cases referred to treatment for the four sites show that slightly more than 75% (n = 862) of the youth were males with an average age of about 15 years (see Table 3). African Americans represented 46% of the youth and Caucasians accounted for nearly 50% of the youth. The current adjudicated offense data for the youth referred to the program for the combined sites showed that property offenses were the most common, representing almost half of all adjudications (n = 501, 44.7%), followed by offenses against the person (n = 229, 20.4%) and technical violations (n = 193, 17.2%). Risk levels were documented for 84% (n = 940) of cases. Of the 940 cases, 474 (50%) were considered moderate risk, followed by 358 high risk (38%), and 108 (11.5%) low risk.
Characteristics of Youth Combined Pilot Sites, RI-Eligible Youth Referred to the Program (FY2006–FY2010).

Note. RI = Redeploy Illinois.
Overall, the RI and the Pre-RI groups had similar racial, age, gender representation, and the number of prior offenses. When it comes to risk levels, the Pre-RI and RI groups had a similar percentage of moderate-risk levels but a slightly higher percentage of high-risk levels in the RI group (Pre-RI = 28.8% vs. RI = 38%). This difference could be due to a large missing data in the Pre-RI group (41.5%) as well as the lack of documented risk information from one of the Pre-RI sites (see Table 4).
Characteristics of Eligible Pre-RI Youth From Three Pilot Sites (FY2003–FY2005).
Note. Data was not available for County 2 for the period. Due to rounding percentages may not total 100. RI = Redeploy Illinois.
RI Program Completion Status of Youth, FY2006 through FY2010
Of the 1,121 youth, 149 (13.3%) were not accepted into the program. Reasons for not accepting youth into the RI program were documented in 127 out of 149 (82.7%) referrals. Of the cases where documented information was available, 30 (24.2%) youth were sent to IDJJ because of pending warrants, age, temporary elimination of the program due to delay in state funding, refusal of services by the youth, or the youth were unfit. The most common reasons for non-acceptance into the program were commitment of youth to IDJJ (n = 30, 24.2%), referral to other services (n = 27, 21.8%), failure to meet program criteria/inappropriate referrals (n = 26, 21%), and refusal of services (n = 16, 12.9%). All of these youth (n = 149) had prior arrests, 55 (36.9%) had prior technical violations, with a mean prior arrest of 4.94 (SD = 3.6) and mean technical violation of .66 (SD = 1.13).
In contrast, 972 (86.7%) juveniles were accepted (see Table 5). Those who were accepted into the program (n = 972), 950 (97.7%) had prior arrests, and 271 (27.9%) had prior technical violations. These youths had a mean prior arrest of 2.87 (SD = 2.44) and mean technical violation of .47 (SD = 0.98). Of the 972 youth, 636 (65.5%) youth successfully completed the program, 265 (27.2%) were considered unsuccessful, 69 (7.1%) were discharged as neutral, and 2 (0.2%) were active in the program at the time of data collection (see Table 2). County 1 had the highest number of youths rejected (n = 95, 63.6%), followed by County 3 (n = 51, 34.2%). Two thirds of the youth in County 2 (70.1%) and the Judicial Circuit (71.1%) successfully completed treatment program(s), compared with half of the youth in counties 1 and 3.
Comparison of RI-Treatment Status of Pilot Sites (FY2006–FY2010).

Note. RI = Redeploy Illinois.
The rural counties from the Judicial Circuit referred cases to RI that are not typically accepted at the other three pilot sites. These cases included curfew violation (n = 4), possession of liquor by a minor (n = 31), consumption of liquor by a minor (n = 2), truancy (n = 8), school referrals (n = 4), and cases that were dismissed (n = 5). Judges in rural counties in the Judicial Circuit referred these cases to RI based on the risk levels, resulting in 912 cases. When comparing the percentages, including and excluding these cases, there were no major percentage differences in terms of prior adjudications, subsequent adjudications, successful completion, or failure to complete.
Of the youth who were unsuccessfully discharged from the program (n = 265), reasons were not documented in five (1.9%) cases. The most common reason for an unsuccessful discharge was for committing a new offense as a juvenile (n = 142, 53.6%), followed by being noncompliant (n = 70, 26.4%). Table 6 provides reasons for unsuccessful discharge from the treatment program.
RI Referrals and Reasons for Unsuccessful Discharge.
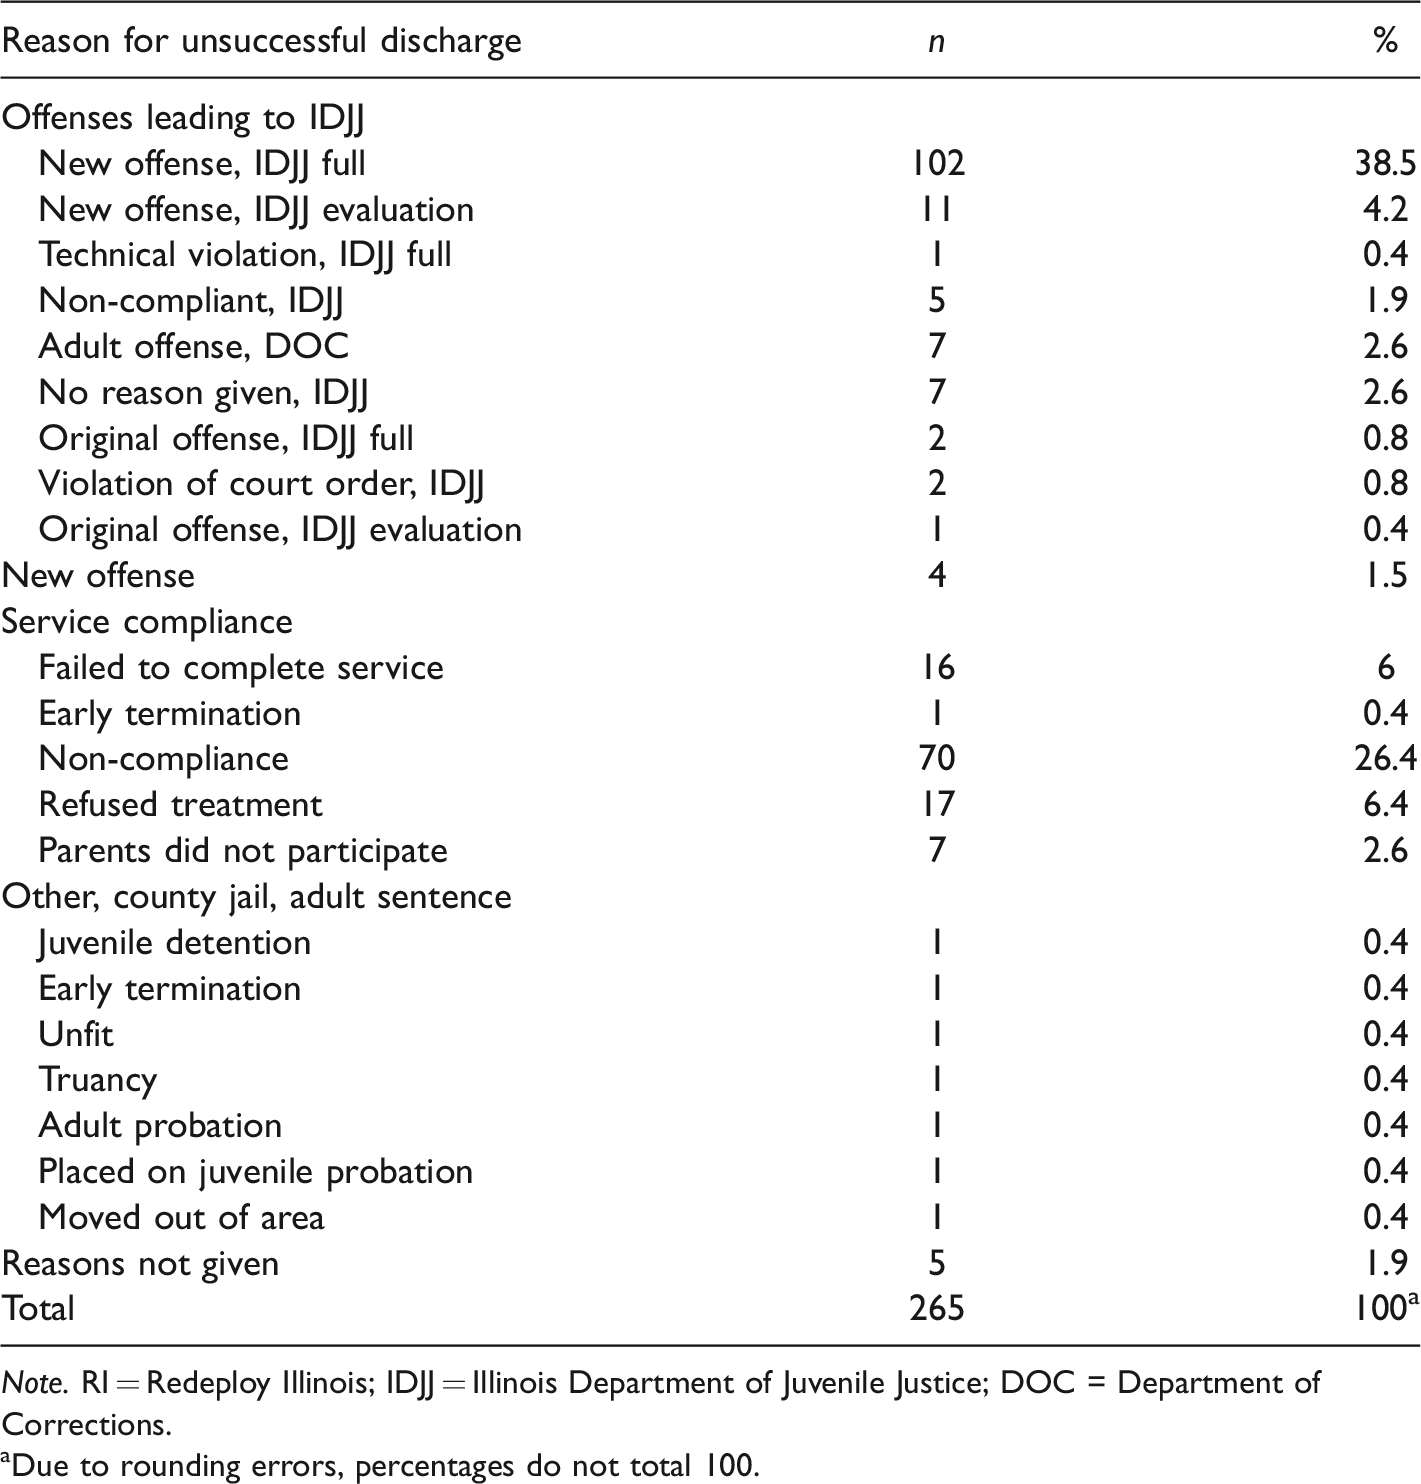
Note. RI = Redeploy Illinois; IDJJ = Illinois Department of Juvenile Justice; DOC = Department of Corrections.
Due to rounding errors, percentages do not total 100.
Youth were referred to both evidence-based programs as well as other interventions depending on the individual needs of youth and their families. Table 7 shows that most of the youth (anywhere from 59% to 71%) who had participated in mental health treatment, FFT, individual counseling, MST, mentoring, education and tutoring assistance programs, and anger management/WAIT completed the program successfully. In addition to these programs, youth were referred to a psychiatric hospital (n = 6), psychiatric services (n = 4), disability services (n = 1), foster care (n = 2), sex offender treatment (n = 3), sexual counseling (n = 2), Alcoholics Anonymous/ Narcotics Anonymous [AA/NA] service (n = 3), a community garden program (n = 1), equine therapy (n = 6), community service (n = 48), a wilderness program (n = 12), residential (i.e., inpatient) substance abuse treatment (n = 63), substance abuse case management (n = 38), and counseling (n = 2).
Intervention Programs and Status.
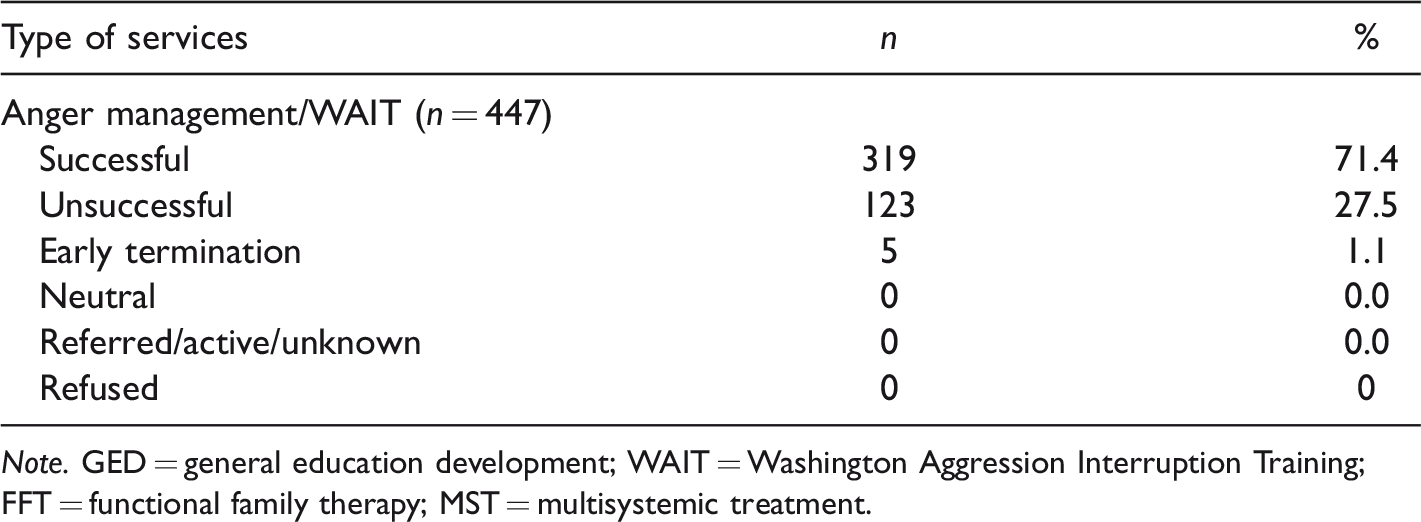
Note. GED = general education development; WAIT = Washington Aggression Interruption Training; FFT = functional family therapy; MST = multisystemic treatment.
Of the youth who successfully completed the program (n = 636), 28.8% (n = 184) were adjudicated for a new offense, whereas 51.7% (n = 137) of those who were unsuccessful were adjudicated for a new offense, resulting in discharge from the program. These offenses were considered new offenses when assessing the recidivism. In addition, of the youth who successfully completed the program, 16.4% (n = 104) were adjudicated for subsequent technical violations, whereas 23.4% (n = 62) of those who were unsuccessful were adjudicated for subsequent technical violations.
Recidivism and Length-to-Offend Among Three Groups: Pre-RI, Treatment Success, and Treatment Unsuccessful Groups
The Pre-RI data comprised individuals who met the RI eligibility criteria but did not participate in the program as the RI program did not exist during FY2003 through FY2005. Reoffending was measured across all three groups—Pre-RI, RI treatment unsuccessful, and RI treatment successful—using 18 months’ time frame because the youth entered the system at different points in time. We examined if and when the reoffending took place following the start of the RI program for treatment groups. For Pre-RI, we examined if and when the reoffending occurred following the date of conviction of the original offense with a follow-up period of 18 months. The analyses did not include individuals who were neutrally discharged because of too much variation within the group—some of them were considered neutral because they moved to a different county, or failed in one treatment but were successful in another, or were referred to treatments outside of RI program. In addition to neutral cases, individuals who were deemed ineligible were not considered because the majority of them were sentenced to IDJJ, jail, or were low risk. Some analysis excluded low-risk cases such as curfew violations (n = 4), truancy (n = 8), school referrals (n = 4), or minor offenses dismissed by the court (n = 5), even though they had completed the RI program successfully, resulting in a total of 638 cases.
Two statistical techniques—KMSA and Cox regression—were used to examine the effects of age, race, gender, and RI status on recidivism for the duration of 18 months. Due to missing values in some variables, the number of youth who recidivated may not exactly match the numbers listed in the descriptive statistics above. The final analyses included three groups—Pre-RI (n = 635), RI treatment successful (n = 639), and RI treatment unsuccessful (n = 268).
Figure 1 shows the Kaplan–Meier plot cumulative survival probabilities of youth recidivating or remains crime-free in the 18 months after the initial offense for the Pre-RI group, and from the start of the RI program for the participant. The results showed consistently higher survival rates for youth who successfully completed the RI program relative to youth who did not and youth who were considered Pre-RI, that is, 28.8% (n = 184) of youth who successfully completed the RI program were arrested and convicted for committing a new offense within 18 months compared with 59% (n = 158) of youth who failed to complete the RI program were arrested and convicted for committing a new crime within 18 months. Also, Pre-RI youth were more likely to be convicted (n = 292, 46%) for committing a new crime for the same duration compared with the treatment success group. In terms of time-to-reconviction over the 18 months after the original conviction, youth who did not successfully complete the RI program were more quickly reconvicted (within 180 days) than those who successfully completed the program (225 days) or Pre-RI youth (200 days). Finally, log-rank (Mantel–Cox) statistics confirmed that there is a statistically significant (χ2 = 11.46, df = 2, p < .01) evidence in length to reoffend among the three groups.
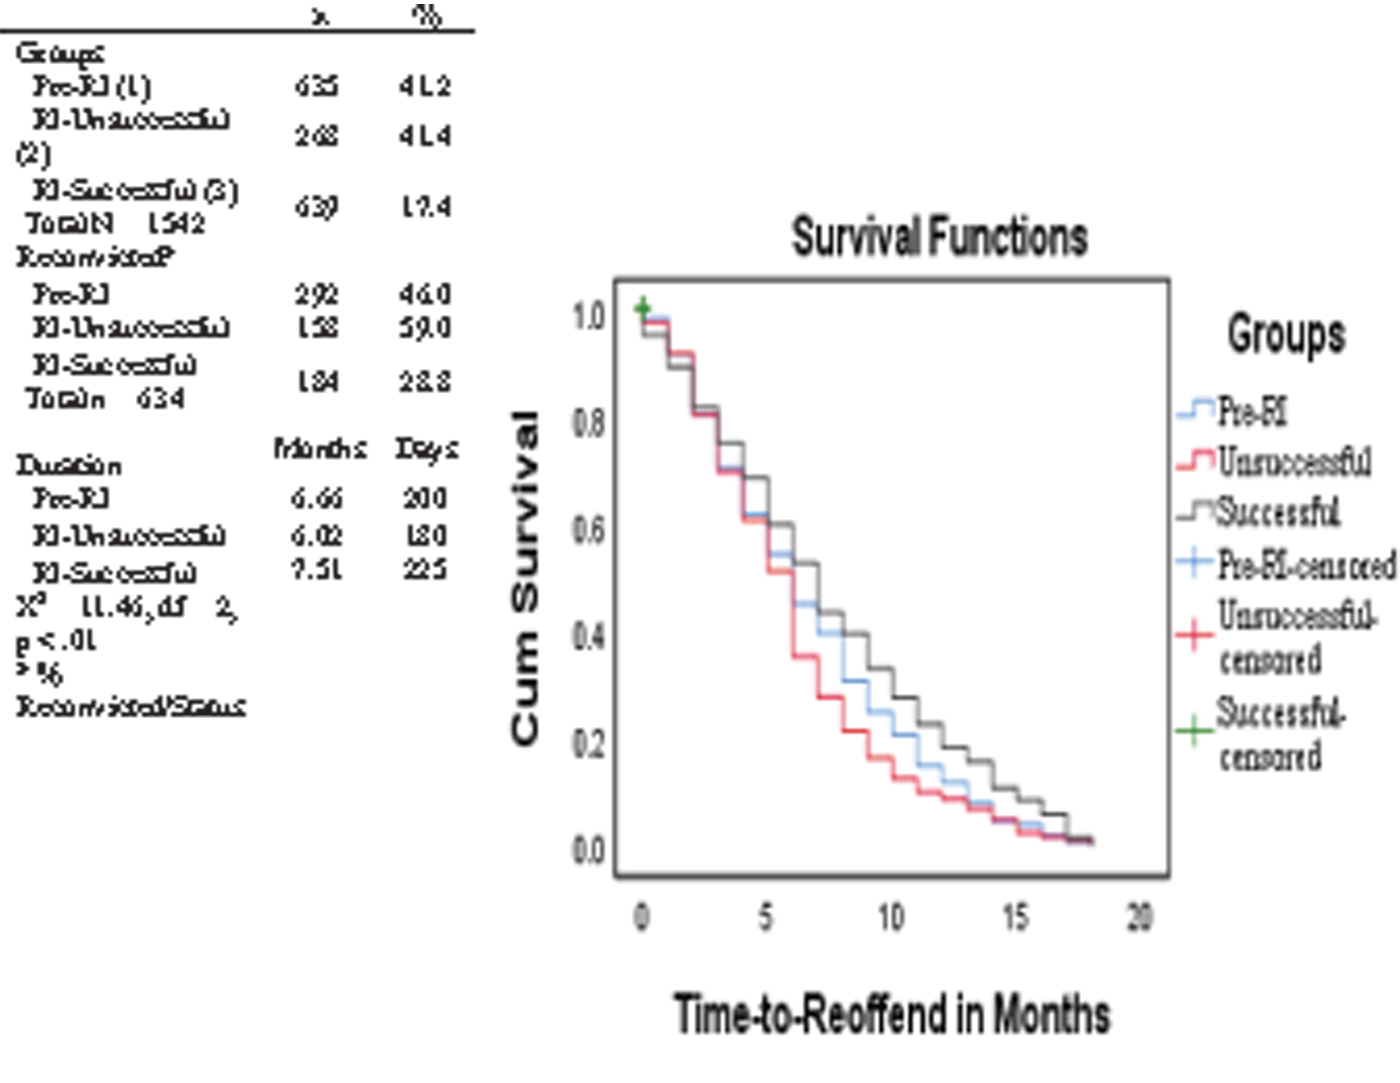
Survival function, reconviction of RI program successful versus Pre-RI and RI program unsuccessful cases with 18-month follow-up.Note. RI = Redeploy Illinois.
The Cox regression analysis included three covariates—age, race, and gender—to control for their influence on reoffending among the three groups. The Omnibus Test of Model Significance shows that the overall model is significant (χ2 = 21.668, df = 6, p < .01). Table 8 shows that older youth were more likely to reoffend (hazard ratio = 1.129, p = 001) compared with their younger counterparts. After controlling for age, race, and gender, the hazard of reconviction for Pre-RI youth was 1.238 times (p < .05), and for the unsuccessful youth was 1.363 (p < .01) compared with the treatment successful youth. For gender, the p-value was .590, indicating no evidence of a greater risk of reconviction following the initial arrest in either sex. Likewise, the p-value for Caucasians was .684, and for African Americans was .543, suggesting no evidence of greater risk of reconviction following the initial arrest.
Cox Regression Models, Pre-RI, RI-Program Successful and Unsuccessful Cases.

Note. Reference category for group = successful cases. RI = Redeploy Illinois.
*p < .05. **p < .01. ***p < .001.
Discussion
The current research evaluated the RI program’s effectiveness in reducing recidivism among youth in four pilot sites. These four pilot sites—three counties and a judicial district composed of 12 rural counties—received funding to develop and provide evidence-based interventions to reduce recidivism. Each location utilized a broad range of services in addition to the evidence-based programs that they found beneficial to youth in their respective jurisdictions. These included the mowing program and community restorative boards in County 1, a 21-day stabilization period in County 2, an equestrian program in County 3, and a wilderness program in the Judicial Circuit. The most commonly used evidence-based programs included MST, FFT, and WAIT. These findings support prior studies that utilized evidence-based programs, such as MST and wraparound services, in creating “a true alternative to usual outpatient or institutional care” (Burns et al., 2000, p. 306). In programs such as MST and FFT, a clinician develops a treatment plan for the parents who focus on the family, peers, school, and neighborhood. The wraparound, on the contrary, involves a team of stakeholders to develop a service and a support plan (Burns et al., 2000). The RI is a team effort involving many key stakeholders (e.g., judges, prosecutors, defense attorneys, law enforcement, court services, school administrators, and service providers). Although the state law required that the county shall include evidence-based programs, it left up to the counties to incorporate innovative programs.
Regarding the impact of RI, nearly two thirds of juveniles accepted into the program successfully completed it. Moreover, the results showed an almost 50% reduction in recidivism among juveniles who successfully completed the program. The RI was also found to assist in reducing reconvictions. The difference in reconvictions between juveniles who completed RI versus those who did not was roughly 30%, with individuals that did not successfully complete RI being reconvicted sooner than those that did complete the program. In the larger picture of community-based programs for juveniles, RI could be viewed as having at least a modest impact on recidivism. For example, incorporating 73 diversionary programs into their meta-analysis, Wilson and Hoge (2013) discovered that in 60 of the 73 programs, the recidivism rate was lower than that following processing in the juvenile justice system, for which a statistically significant decline in recidivism was discovered. That research also highlighted that diversionary programs targeting moderate- and high-risk offenders were effective for both intervention and caution-based strategies relative to programs focused on low-risk offenders. The RI program was primarily intended for moderate- to high-risk offenders with the exception of most serious offenders. When a few low-risk cases (e.g., truancy or runaway) from rural counties or very high-risk cases were referred to RI programs, they were considered ineligible by the program coordinators. This level of screening based on risk/needs resulted in the selection of more appropriate clients for the program. From this perspective, incorporation of moderate- and high-risk juveniles, as well as the use of specific evidence-based programming within RI, taps into successful methods discovered in multiple meta-analyses examining whether diversionary programs significantly reduce recidivism. The RI programs incorporated not only evidence-based programs as required by the funding agency but focused their programs on youth and the family.
Implications
The results of this study have multiple implications for policy and research. One recommendation is to consider current programming and consider the integration of other effective recidivism reduction strategies with those used here. For instance, although there was an 18% overall reduction in reconvictions among program completers, some counties did not show major improvements. Given program variations among locations, it is important to consider what specific aspects of RI are driving reduced recidivism rates across areas.
In addition, the results have implications for technical violation policies. In the pilot sites, technical violations made up a significant minority of commitments (17.2%). As technical violations are not inherently criminal, commitments stemming from them might create more problems than not. For example, analyses by Campbell (2016) indicate that technical violations, in general, do not necessarily serve as proxies for new crimes but rather only for a specific subset of violations. Thus, a review of technical violation policies to differentiate between those that could be considered “new crimes” versus those that do not could assist in retaining more individuals within RI and lead to a greater proportion of individuals successfully completing the program and not recidivating.
Limitations
A few limitations temper the success of findings from the pilot sites of RI. The first and arguably the most significant limitation is that the data used here do not include the most recent RI sites present. RI has expanded in the years following the data utilized for this research, and as of 2015, there were 13 program sites in 45 counties. For this reason, the analyses conducted here are only applicable to some of the first sites and may not accurately portray the impact of the RI across all locations and for all programs.
Another limitation relates to the geographic units incorporated in these sites. Although three counties were independently examined, the Judicial Circuit incorporated 12 counties in a rural part of the state. Based upon the aggregation of multiple counties into a single entity, it is unknown how the availability of services or recidivism might vary among counties in the Judicial Circuit. A county-by-county examination of the Judicial Circuit could further assist in recognizing the variation in successful completion and recidivism.
A final limitation is that specific information regarding the dosage of treatment is not available. The previous literature has indicated dosage (i.e., the length of treatment) plays a vital role in the effectiveness of programming (e.g., Sperber et al., 2013). For example, Lipsey et al. (2007) found in a meta-analysis of behavioral programs not only that programs targeting higher-risk individuals tended to be more successful but that increases in the hours of programming were linked to larger effect sizes. Thus, it is unknown if the dosage is similar or varies among programs included in RI, which might tap into differences in recidivism between locations. Although the pilot sites incorporated some of the same evidence-based programs, it was hard to delineate the real effect of each of the programs because many youths attended multiple programs at the same time.
Future Directions
Multiple directions for future research are presented based on the current study. First, analysis of specific programs within each area examined here could assist in recognizing if specific programs (or a combination of programs) accounts for reduced recidivism rates. Thus, controlling for individual program types, as well as interactive effects between programs, could provide a more holistic picture of RI programming effectiveness. Building on this previous point, a second direction would be investigating variations in program success or failure for males and females. The current study analyzed the general effectiveness of RI for reducing recidivism. Examining whether RI equally works for males and females would allow for recognizing if program modifications for specific sex could be beneficial.
An additional direction involves investigating the dosage levels of programs included in RI. As mentioned in the limitations section, the exact dosage level for RI and associated programs are unknown. Although this might not be an easy task, obtaining this data would allow for a comprehensive understanding of the time juveniles are involved in RI as well as variations in effectiveness based upon time in these programs. The final direction involves analyzing all current RI locations. As mentioned previously, the biggest limitation here is that a limited number of sites were included. Analysis of all locations would provide a more expansive picture of where and for what groups RI significantly reduces recidivism.
Conclusion
The current investigation addressed whether pilot sites for RI significantly reduced recidivism for moderate- to high-risk nonviolent juveniles. The study covered data from FY2003 through FY2005 (Pre-RI) from three pilot sites (one of the pilot sites did not transfer the data from the previous electronic database to the new database). The RI data were compiled for FY2006 through FY2010 (the start of RI) from the four pilot sites. In addition, the follow-up recidivism data were compiled for an additional 18 months (until December 30, 2011). The demographic characteristics are similar between Pre-RI and RI groups, with males representing slightly over 80% and African Americans slightly more than 50%. The average age among both groups was 15 years.
Regarding offense history, the RI-group, like the Pre-RI group, had about 40% prior property offenses, but fewer than 10% prior to technical violations, with an average of 2.70 arrests. Most of the youth in both groups belonged to moderate- or high-risk groups. Overall, the demographic and the offense characteristics show that the Pre-RI and the RI youth and their cases were very similar.
Overall, the RI program had been successful not only in reducing recidivism among program completers compared with Pre-RI and program RI noncompleters. In addition to evidence-based programs, such as ART, FFT, MST, and WAIT, the sites were allowed to use other services that they found beneficial to youth in their respective jurisdictions, such as the mowing program and CRBs, case management, crisis intervention, cognitive-behavioral intervention, individual and group counseling, wilderness program, and equestrian program. Although multiple limitations were present, juveniles who successfully completed the RI program had reductions in recidivism as well as longer times to recidivate compared with individuals who did not complete the program.
Since the implementation of the RI program in pilot sites in 2006, it has been expanded to 42 counties and diverted over 3,000 youth from the IDJJ and saved the state over $208 million that would have otherwise been spent on the incarceration of youth. In addition to cost savings, the program was able to decrease the risk factors by 71% and reduce new arrests by 85% (Illinois Collaboration on Youth, n.d.). Due to more recent legislation in Illinois, Public Act 99-0,268, youth who have committed misdemeanors are no longer be sent to the IDJJ. Only those who are considered felony offenders are eligible under the RI Statute (Public Act 098-0,060; Redeploy Illinois, n.d.). As we move forward, an examination of dosage levels, all RI locations, and nuanced aspects of programs included with RI could assist in determining which elements are most effective in reducing recidivism.
Footnotes
Declaration of Conflicting Interests
The author(s) declared no potential conflicts of interest with respect to the research, authorship, and/or publication of this article.
Funding
The author(s) disclosed receipt of the following financial support for the research, authorship, and/or publication of this article: This project was funded by the Illinois Department of Human Services (IDHS) and the Illinois Criminal Justice Information Authority (ICJIA) through the American Recovery & Reinvestment Act (ARRA). The views expressed in the study are purely those of the authors and may not, under any circumstances, be interpreted as stating the official position of the funding agencies.