



Abstract
Introduction
To establish the responsiveness of the Danish version of the Canadian Occupational Performance Measure (COPM-DK).
Method
A cross-sectional study was performed in three Danish settings, including 88 clients, 40 men, aged 16–90 years, with a variety of diagnoses. To determine construct responsiveness, the mean changes of the COPM performance and satisfaction score (COPM-P/S) were compared and correlated with the mean changes in the five-item World Health Organization (WHO) Well-Being Index (WHO-5) and the EuroQol–five domains–five levels questionnaire (EQ-5D-5L). To determine the responsiveness, data were analysed with ROC curves to establish the optimal cut-point values for the COPM-DK scores. Minimal important change (MIC) was assessed in relation to anchor-based questions.
Results
The mean change for COPM-P/S was 3.1 and 3.0, respectively. Small positive correlations were found between the COPM-DK scores and the WHO-5 and EQ-5D-5L scores. The AUC were 0.76 and 0.75, respectively. The optimal cut-point values for the COPM-P/S-scores based on either all positive answers or to the two highest, were 1.2 or 4.20 (COPM-P) and 1.67 or 5.80 (COPM-S), respectively
Conclusions
The capability of the COPM to detect changes in perceived occupational performance issues is supported. We recommend an MIC on 3.5 points on both scales.
Keywords
Introduction and literature review
The main goal of rehabilitation is to enable clients to retrieve their earlier function as best possible (Dekker et al., 2020; Wade, 2009). In order to evaluate whether this is the case or not, it is crucial to assess the clients’ wishes and needs pre- and post-intervention to document that goals have been achieved (Black, 2013).
In occupational therapy, intervention goals are related to clients’ wishes for their everyday life, that is, what people do to engage in meaningful occupations and occupy themselves (Townsend & Polatajko, 2013). Occupational therapy measurements focus on whether clients can do what they have to do, need to do or want to do within the concept of occupational performance (Law et al., 2019).
One measurement to examine the occupational lives of clients is the (COPM) (Law et al., 2019). It is based on the fundamental values of occupational therapy, including being client-centred and having an occupational perspective on life (Enemark Larsen, Rasmussen & Christensen, 2018). Through interviews between the occupational therapists and their clients, the COPM examines how clients perceive the occupational performance issues (OPIs) they want and need to change. This identification helps the occupational therapist and client to relate the upcoming intervention to what the clients find important in their lives. In the COPM, the clients score how they perceive their current ability to perform the prioritized OPIs (COPM-P) and how satisfied they are with that performance (COPM-S). To document whether the clients perceive an effect of the occupational therapy intervention, that is, if a change has occurred, the COPM is applied before and after an intervention (Law et al., 2019).
Since healthcare services constitute one of the biggest components on the gross domestic product (GDP), it is important to ensure that value for the money spent is achieved. Therefore, delivering interventions that aim to fulfil the clients’ satisfaction are requested, as healthcare professionals are obliged to document their services’ effect on the clients receiving them (Porter and Lee, 2013). The COPM’s ability to document relevant change for the better, that is, positive change, is therefore an important feature, even though the concepts outlined are in principle applicable to both directions of change.
Responsiveness refers to the ‘the ability of an instrument to detect change over time in the construct that is measured’ (De Vet et al., 2011: p.202). It is considered as a longitudinal aspect of validity. One way to demonstrate responsiveness is to establish the minimally important change (MIC) that is the smallest measured change in score that is perceived as relevant by the patients (De Vet et al., 2006, 2011). To examine responsiveness, a true measurement of change is needed. However, no measurement of a true change, that is, no gold standards exist in the area measured by the COPM, since it relies on the clients’ perception of their occupational performance. Therefore, we cannot establish the criterion responsiveness. Instead, we examine the construct responsiveness which relates ‘true change’ a) to changes in external measurements that partly examine the same area as the COPM, and b) to anchor-based questions, that is, questions on how the clients’ perceive their acquired changes with regard to their performance and satisfaction with performance on a six-points Likert’s scale. Including these anchor-based questions is a way to examine the MIC (De Vet et al., 2001, 2006, 2011).
The COPM has existed for more than 25 years and has been part of Danish occupational therapy practice since it was translated to Danish in 2000. However, as former versions were never examined for cross-cultural validity, this process was initiated in 2015 with a new translation, the COPM-DK (Enemark Larsen et al. 2019a). Since then, the COPM-DK’s utility (Enemark Larsen et al. 2019b), validity (Enemark Larsen et al. 2020c; 2020a) and reliability (Enemark Larsen et al. 2020b) have been found adequate. Now the intent of this study was to examine the responsiveness of the COPM-DK in a group of clients from different parts of Danish health care who all had an intervention. Thus, our goals were: 1. To establish the COPM’s capability to display changes over time, in forms of the calculated changes from the second COPM-P/S scores when compared to the first scores. 2. To examine the construct responsiveness by means of the extent of changes obtained with the COPM, when correlated to the changes obtained with the two validated measurements, WHO-5 and EQ-5D-5L. 3. To establish the Minimal Important Change (MIC) on the two COPM scales (P/S), that is, to demonstrate which cut-point on the scales can be recommended to illustrate that a true change has occurred.
Methods
The data in this study were collected as part of the overall cross-cultural validation process of the COPM-DK, in which all clients were offered intervention. Details of study flow and the overall design can be found in the papers on the COPM-DK’s validity (Enemark Larsen et al. 2020c; 2020a) and reliability (Enemark Larsen et al. 2020b).
Procedure, design and setting
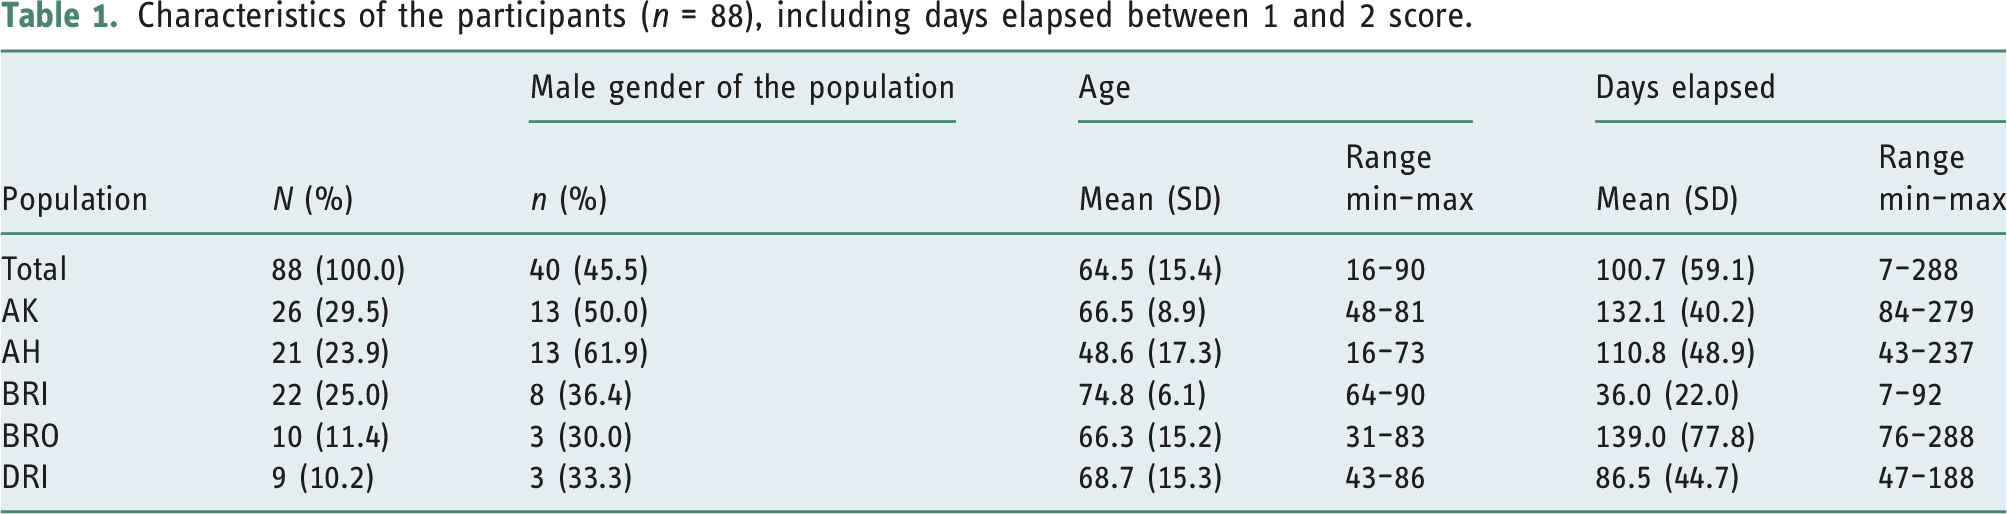
Characteristics of the participants (n = 88), including days elapsed between 1 and 2 score.
After having signed a written consent, the clients answered the two external measurement, the WHO-5 and the EQ-5D-5L, and no later than three working days hereafter, the COPM was administered. When the occupational therapist met the client either on the penultimate or last meeting, the client was asked to fill in the WHO-5 and the EQ-5D-5L, and re-scored the prioritized OPIs in the COPM. Both the occupational therapists and the clients were blinded for the scores of the earlier COPM assessment. Furthermore, the clients evaluated their perceived change on two six-point Likert’s scales with anchor-based questions. Anchor question P (AQ-P): ‘Considering how you performed you daily activities when we first met, how do you think you perform your activities today?’ Six: much better, five: better, four: slightly better, three: the same, two: slightly worse, one: worse. Anchor question S (AQ-S): ‘Considering your condition when we first met, how satisfied are you with the change achieved?’ six: very satisfied, five: satisfied, four: just a little satisfied, three: neither satisfied nor unsatisfied, two: unsatisfied, one: very unsatisfied.
Measurements
The COPM
The Canadian Occupational Performance Measure is administered as a semi-structured interview in five steps. Data from steps four and five are included in this study. In the first step, the clients identify their OPIs and secondly, score how important their OPI’s are. Thirdly, the clients prioritize up to five OPIs to be the focus of the upcoming intervention. Fourthly, these OPIs are scored regarding the COPM-P and the COPM-S, both on VAS scores going from ‘1’ representing the lowest performance or satisfaction to ‘10’ representing the best performance or satisfaction. In step five, the prioritized OPIs are re-scored on the COPM-P and COPM-S enabling to calculate the achieved difference (Law et al., 2019).
The WHO-5
The WHO-5 questionnaire measures clients’ perception of well-being within the last two weeks based on five statements: one. ‘I have felt cheerful and in good spirits’, two. ‘I have felt calm and relaxed’, three. ‘I have felt active and vigorous’, four. ‘I woke up feeling fresh and rested’ and five. ‘My daily life has been filled with things that interest me’ (WHO, 1998). The clients rate how well each of the five statements apply to them on a six-point Likert’s scale from ‘five’, ‘all of the time’, to ‘0’, ‘none of the time’. Adding the ratings together, the sum score can range from 0: ‘absence of well-being’ to 25: ‘maximal well-being’, which was be multiplied by four to translate to a percentage scale from 0: absent to 100: maximal (WHO, 1998). The WHO-5 has a threshold for a clinically relevant and statistically significant change considered to be 10 points (Topp et al., 2015).
The EQ-5D-5L
The EQ-5D-5L questionnaire measures health in two ways: the EQ-5D-5L descriptive system, and the EQ Visual Analogue scale (EQ VAS). Since no Danish norms have been published on the EQ-5D-5L descriptive system, which is needed to retrieve a sum score, we cannot compare this part to our Danish population; consequently, we only included the EQ VAS. In this, a quantitative measure of health from 0 to 100 point is found. This is based on how the clients rate their health on a 20cm VAS scale. The scale’s endpoints are labelled ‘the best health you can imagine (100 points)’ and ‘the worst health you can imagine (0 points)’ (EuroQol van Reenen and Janssen, 2015; Sørensen et al., 2009). Estimation of MIC in EQ-5D utility and VAS scores in cancer were 8–10 points (Pickard et al. 2007). We therefore used a MIC interpretation of 10 points in this study. Permission to use the EQ-5D paper version has been granted with the ID no 32,886.
Analytic procedures and statistics
On gold standards and D+ (true positive change)/D−(true negative change)
Relating Canadian Occupational Performance Measure (COPM)-P/S to the self-rated change (AQ-P/S), World Health Organization (WHO)-5 and EQ VAS categorizations (n = 88 participants).

Presented here are the wordings of Anchor Question P (AQ-P), the clients’ perception of their changed performance. The equivalent wordings of (AQ-S), the clients’ perception of their satisfaction with the change was: very unsatisfied, unsatisfied, neither satisfied nor unsatisfied, just a little satisfied, satisfied and very satisfied.

The upper two boxplots relate the COPM-P (left) and the COPM-S to (right) to the anchor questions (AQ-P/S). The four lower scatterplots relate the COPM-P (left) and the COPM-S (right) to the WHO-5/EQ VAS categorizations (n=88 participants).
Receiver operating characteristic (ROC) curves
We presented the ROC curves which plot the true positive rate (sensitivity) versus the false-positive rate (specificity) for all possible cut-points, that is, all observed change scores (Figure 2). Note that the Area Under the Curve (AUC) relates to the probability that the sum-score changes of two randomly drawn clients, where one is from D+, true positive change and one from D−, true negative change, are in the correct order; if so, the change score of D+ is larger than change score of clients from D−. An AUC of 0.5 indicates that the sum-score change does not contain relevant information about D+ and D−, whereas an AUC of 1.0 implies perfect ability of the sum-score change to distinguish improved from unimproved. One figure of all ROC curves for changes in COPM-P (left) and COPM-S (right) with respect to three different binary ‘gold standards’: upper = sharper anchor-based; middle: WHO-changes; lower: EQ changes.
Choice of cut-points
The Canadian Occupational Performance Measure (COPM)-P and COPM-S with respect to four different binary supposedly ‘true’ categorizations (gold standards): D+, D−, AUC (95% CI) and estimated cut-points (CP70, CP80, CP90, CP-Youden) with 95% bootstrap confidence intervals (1000 bootstrap samples).

Note. AQ-P/S: Anchor question P, performance or S, satisfaction. D+ (true positive change). D− (true negative change). AUC: Area Under the Curve. CP: Criterion predictive value for specificity.
The significance was set to p < 0.05. All analyses were performed using Stata version 16.
Ethics
The study complies with the ethical principles set by the Danish Ministry of Higher Education and Science, the data protection principles, and the Helsinki Declaration (ICMJE.org, 2019; World Medical Association, 2013). The study is registered at the Copenhagen University College with id. no 18–025. All participating occupational therapists and clients were provided with a participant information pamphlet and oral explanations of the study, before they gave their informed and written consent (Kruk, 2013; Sundheds-og ældreministeriet (Ministery of health and elderly), 2020). In keeping with Danish legislation, the approval of the Danish Ethical Committee was not required (Ministry of Science, 2014).
Results
In all, 194 clients were invited to participate in the study. Of these, 106 were not included in the analysis for the following reasons: n = 6, no first measurement; n = 78, no second measurement; n = 13, no WHO-5 measurement (both times); n = 9, no EQ-5D-5L measurement (both times), leaving 88 clients included in the analysis. Table 1 shows the characteristics of the participants, of whom 53.4% came from regional setting and 46.6% came from the community, 40 were men and 48 women, with ages varying from 16 to 90 years (mean 64.5 years, SD 15.5). In average, there were 100 (SD: 5.19, range: 7–288) days between the 1. and 2. score.
The COPM’s capability to display changes over time
The mean change for COPM-P (the individual change between first and second measurement) was: 3.1 (SD: 2.8, range: −3 to 8) and for COPM-S: 3.0 (SD: 1.8, range: −5 to 9). The changes of the WHO-5 and EQ VAS were, respectively, 8.9 (SD: 20.8, range: −48 to 64) and 8.8 (SD: 19.5, range: −44 to 65).
Table 2 depicts how the mean changes for COPM-P/S related to the changes measured with the anchor questions, the WHO-5, and the EQ VAS. For instance, the COPM-P/S’s mean changes increased with the reported answers to the anchor answers, so that the COPM-P’s mean change on 3.2 related to the anchor answer ‘better’, while the mean change on 4.5 related to the answer ‘much better’.
The COPM’s construct responsiveness
The COPM’s construct responsiveness were evaluated by the extent that the COPM correlated with changes obtained with the WHO-5 and EQ-5D-5L. When related to the WHO-5, only the higher end of changes was related. Thus, the +20 change of the WHO-5 was reflected in a higher change in the COPM (4.3 for COPM-P, 2.6 for COPM-S), whereas lower changes in the measures were unrelated. On the opposite, only the lower end of the EQ VAS showed a relation with an insignificant change in the COPM-P. No relation could be seen between the EQ VAS and the COPM-S.
These tendencies are replicated in the boxplots and scatterplots in Figure 1, illustrating that the increased mean changes measured with the COPM-P/S were consistent with the self-reported improvement, that is, the answers to the anchor questions. Correlations between the mean changes of the COPM-P/S and of the WHO-5 and the EQ VAS, respectively, were rather low, the WHO-5 being: rs: 0.22; 95% CI 0.01–0.41/rs: 0.33; 95% CI 0.13–0.51; and the EG-VAS being: rs: 0.32; 95% CI 0.12–0.50/rs: 0.36; 95% CI 0.17–0.53.
The COPM’s MIC
The COPM’s MIC, that is, that a clinical important change has occurred, is interpreted via the recommended cut-point on the two COPM scales (P/S). In Table 3 and Figure 2, the COPM-P/S mean changes were evaluated with respect to the four different binary, supposedly ‘true’ categorizations to estimate a cut-point. Using the AQ-P/S that included all the positive answers, that is, no. four to six, we found a COPM-P/S cut-point at CP80 on 1.20 (−2.59; 4.99)/1.67 (−2.12; 5.46). Whereas using the sharper self-rated changes (AQ-P/S-sharp), that is, including no. five and six, to maximize the certainty of only including the true positive answers, that is, excluding the false negative answers, we estimated a higher COPM-P/S cut-point for the criteria CP80 on 4.20 (2.19; 6.21); 5.80 (3.79; 7.81), respectively. Cut-points with respect to WHO-5 or EQ were in the same range: 5.85 (4.78; 6.92); 6.80 (5.73; 7.87), respectively. The cut-points for EQ VAS were 4.80 (3.45; 6.15); 5.90 (4.55; 7.25), respectively.
Figure 2 shows the ROC curves in relation to the three ‘gold standards’, the sharper anchor questions (upper part of figure) and the WHO-5 (middle) and EQ VAS (lower) for both COPM-P and COPM.S. Corresponding numbers are shown in Table 3. For the COPM-P, the AUC for the second (sharper) anchor-based question ranges by 0.76 (0.63; 0.88), and for the COPM-S, the AUC ranges by 0.75 (0.63; 0.88) while we found a lesser AUC based on WHO-5/EQ VAS, 0.57 (0.45; 0.69) (WHO-5 for COPM-P) and 0.68 (0.57; 0.80) (EQ VAS for COPM-P), with roughly the same picture seen for COPM-S.
Discussion
Knowing whether, or to what extent, a client has improved or deteriorated in their function following rehabilitation is fundamental to clinical practice. This study has demonstrated that the COPM-P and COPM-S are sensitive to change and able to identify client-reported improvements. The clients in this study measured a mean change from the first to the second COPM-interview of about three for both COPM-P and COPM-S, which differs from other studies where the changes in the COPM-S were 0.5–1 point higher than the changes of the COPM-P (Enemark Larsen and Carlsson, 2012; Eyssen et al., 2011). This could be due to a broader variety of clients included in this study opposed to more narrow populations in other studies.
Since the ability to document change is an important part of the COPM, the small number of studies which have measured these changes is surprising. Four studies demonstrated adequate results regarding the measurement’s responsiveness, that is, ability to demonstrate change (Eyssen et al. 2011; Tuntland et al., 2016; Roe et al 2019; Wressle et al. 1999), while in the study of Nieuwenhuizen et al., they did not find adequate responsiveness (Nieuwenhuizen et al., 2014). Given that there is no gold standard related to the scores of the COPM, we examined the responsiveness with external criterions, that is, measurements examining a construct like the construct of the COPM. Based on the conceptual foundations on occupations in our profession, we decided to relate occupational performance to health and well-being. However, the measurements’ latent constructs proved to be fundamentally different. The correlation between the COPM and the WHO-5 only partly reflected the changes of the COPM, while the changes of the EQ VAS either showed an insignificant relation (COPM-P), or no relation (COPM-S). As our former study on the COPM’s validity showed low and insignificant correlations between the COPM, and the WHO-5 and the EQ VAS (Enemark Larsen et al. 2020c), the magnitude of these correlations was expected. Understanding the responsiveness as a longitudinal aspect of validity, this too confirms, that if we as occupational therapists want to measure our clients’ achievements related to the core of our profession: occupational performance, we must use a measurement tool that examines precisely that, for example, the COPM.
Even though this approach has limitations itself, we set out to consider the COPM’s ability to demonstrate a ‘true change’ that enabled interpretation of how much clients need to improve function to perceive a change that has a clinical impact on their lives, that is, estimating the MIC. As the MIC tells us how big a change should be for us to be certain that is does reflect a true difference in the client’s situation, we chose to interpret MIC in terms of the estimated cut-point CP80 in relation to the sharpened version of anchor questions (AQ-P/S-sharp). This mean, that we aimed for a high certainty. Besides Tuntland et all., who recommended a cut-point on three points to distinguish between older adults who achieved important change and those who did not (Tuntland et al., 2016), we have not found other studies that interpreted the changes obtained with the COPM.
In our examination of the MIC, separating the clients with worse/no change from the clients with a positive change was an easy task, therefore, the resulting estimated cut-point (in terms of COPM-points) was low and corresponding sensitivity and specificity high. As presented in Table 2, with a change of at least two points, we can be fairly confident that the clients had some sort of positive change. Because this is partially supported by the CP80 cut-point of our ROC analysis, we could consider a cut-point as low as 1.2 as the ‘true change’. However, being conservative and realistic, a larger cut-point is needed to ensure a ‘true’ change. Consequently, we related the COPM scales to the higher end of the anchor answers, and found a mean change on 3.2 points on the COPM-P scale related to the anchor answer of ‘better performance’, and a mean change on 4.5 points related to ‘much better performance’. On the COPM-S scale, we found a mean change on 3.1 points related to the perception of both being ‘satisfied’ and being ‘very satisfied’. Thus, in both the COPM-P and the COPM-S scales, the mean changes had to be above 3.2 points to indicate a change which the clients considered important. This corresponds both to our results on estimated cut-points (COPM-P, Table 3: 4.20 (2.19; 6.21) and with findings when examining the reliability of the COPM-DK, where the coefficient of repeatability and limit of agreement both indicated that a random change could occur in plus/minus 3.0 points (Enemark Larsen et al. 2020b). Former versions of the COPM manual stated a change on two points to be clinically significant, however based on a balanced clinical evaluation of our findings, we recommend a change on 3.5 point as the cut-point of a true change on both scales, although the COPM-S cut-point could be interpreted to be higher.
Strength and limitations
In this study we included the WHO-5 and the EQ VAS to evaluate the construct responsiveness, although they might be unsuitable to capture changes in the COPM as they measure different constructs. However, given the entire study design collecting data for the validation of the Danish version on the COPM simultaneously (Enemark Larsen et al. 2020b; 2020c), despite our earlier results, we still used data from these measurements to examine the responsiveness. To compensate for this lack and enable further examination, we therefore included the anchor question method.
An acknowledged challenge in psychometrics when working with the COPM is that the fundamental client-centred construct of the COPM might have influenced our findings. Furthermore, it could be argued to be a limitation, that the Likert scale on the anchor-based questions was biased to the positive side. We constructed the scale like this to differentiate the positive answers as our goal was to establish whether the COPM could be used to determine the effect of intervention. However, this might have had an unintentional biased effect on our results.
The aim of this study was to provide occupational therapy practice with a cut-point with the COPM that can be used to determine and document a clinically relevant change after an intervention. However, we did not include a control group and all participants received an intervention. Therefore, there was no possibility to separate the effect from ‘time passed by’ from the intervention; thus, the measured changes might have come in all cases, having an intervention or not. Furthermore, we did not evaluate the association of the length of ‘time passed by’ on our results. While such an analysis would be valuable, it would require a different design, incorporating details on the clients’ diagnosis and precise intervention as well as the relevant dates.
Further research is needed to examine the consequences of the high cut-point for the value of the COPM to measure change considering the ceiling effect.
Conclusion
This study has established the responsiveness of the COPM-DK through a cross-sectional study. The COPM-P/S are sensitive to change in accordance with the changes detected by the WHO-5 and EQ VAS. Based on a balanced clinical evaluation of our findings, we therefore recommend a change on 3.5 point as the cut-point of a true change for both scales COPM-P and COPM-S. This means that to be certain that a true change has happened, we recommend the average changed score to be 3.5 point or above.
Key findings
• The COPM-DK’s responsiveness has been established, and the scales, COPM-P/S, are sensitive to change. • An MIC on 3.5 points is recommended on both scales.
What the study has added
The Danish version of the COPM can determine true change from pre- to post-assessments. Changes should preferably be above 3.5 points.
Footnotes
Acknowledgements
The authors would like to thank all OTs, OT-S and clients included in this study for their participation in the research process.
Declaration of Conflicting Interests
The author(s) declared no potential conflicts of interest with respect to the research, authorship, and/or publication of this article.
Funding
The author(s) disclosed receipt of the following financial support for the research, authorship, and/or publication of this article: This work was supported by the University College Copenhagen; the University of Southern Denmark; and the Danish Organization of Occupational Therapy (grant numbers PP2-15–02 and R19-A697).
Ethical approval
The study was registered at the Copenhagen University College with id.no 18–025. This study has been conducted in accordance with the ethical principles set by the Danish Ministry of Higher Education and Science and the Helsinki Declaration (World Medical Association, 2013). Accordingly, ethical approval of the Danish Ethical Committee or the Danish Data Protection Agency was not required for this study.
