
Abstract
This study uses an equal population cartogram to plot the intercity railway network in Mainland China.
In China, railways play a major role in inter-city travel. Since 1978, passenger traffic has increased, reaching 1257.93 billion person kilometers in 2016, when it accounted for 40% of China’s total transport traffic, the largest in the world (ASKCI, 2017). For a long-term national economic strategy, China is investing heavily in high-speed railways. The structure of railway network and the distribution of traffic demand show the spatial pattern of China’s economic development and regional interaction. However, the distribution of the railway network in China is uneven. According to the traditional equal land area map, the density of distribution varies significantly across regions. The density of the railway network is much higher in East China than West China. In the meantime, there is also a great imbalance in economic development between these regions. The western regions are mostly mountainous, with vast land areas but very low population densities. Their economies have been left behind by the eastern regions. In this situation, traditional equal land area maps of the railway network fail to take into account the supply and demand for rail travel.
This study uses an equal population cartogram to plot the intercity railway network in Mainland China (SRG, 2017; Gastner and Newman, 2004). The data comprises two parts: (1) the vector GIS data, obtained from the Thematic Database for the Human-Earth System of the Chinese Academy of Sciences, and the 1:4,000,000 Database of the National Fundamental Geographic Information System of China and (2) population data, sourced from the ‘China City Statistical Yearbook, 2016’, Population and Employment Statistical Yearbook, 2016’, etc.
The map (Figure 1) was developed by substituting the population of all cities (municipalities, provincial capitals and prefecture-level cities) for land areas in a map of the national railway network. The geometry of the map was rescaled in proportion to the population to represent the spatial distribution of Chinese railway network relative to that of the population. The names of municipalities and provincial capitals are labeled in the figure. For comparison purposes, a traditional equal land area map of Chinese railway network is displayed in Figure 2.

China’s railway network on an equal population cartogram.
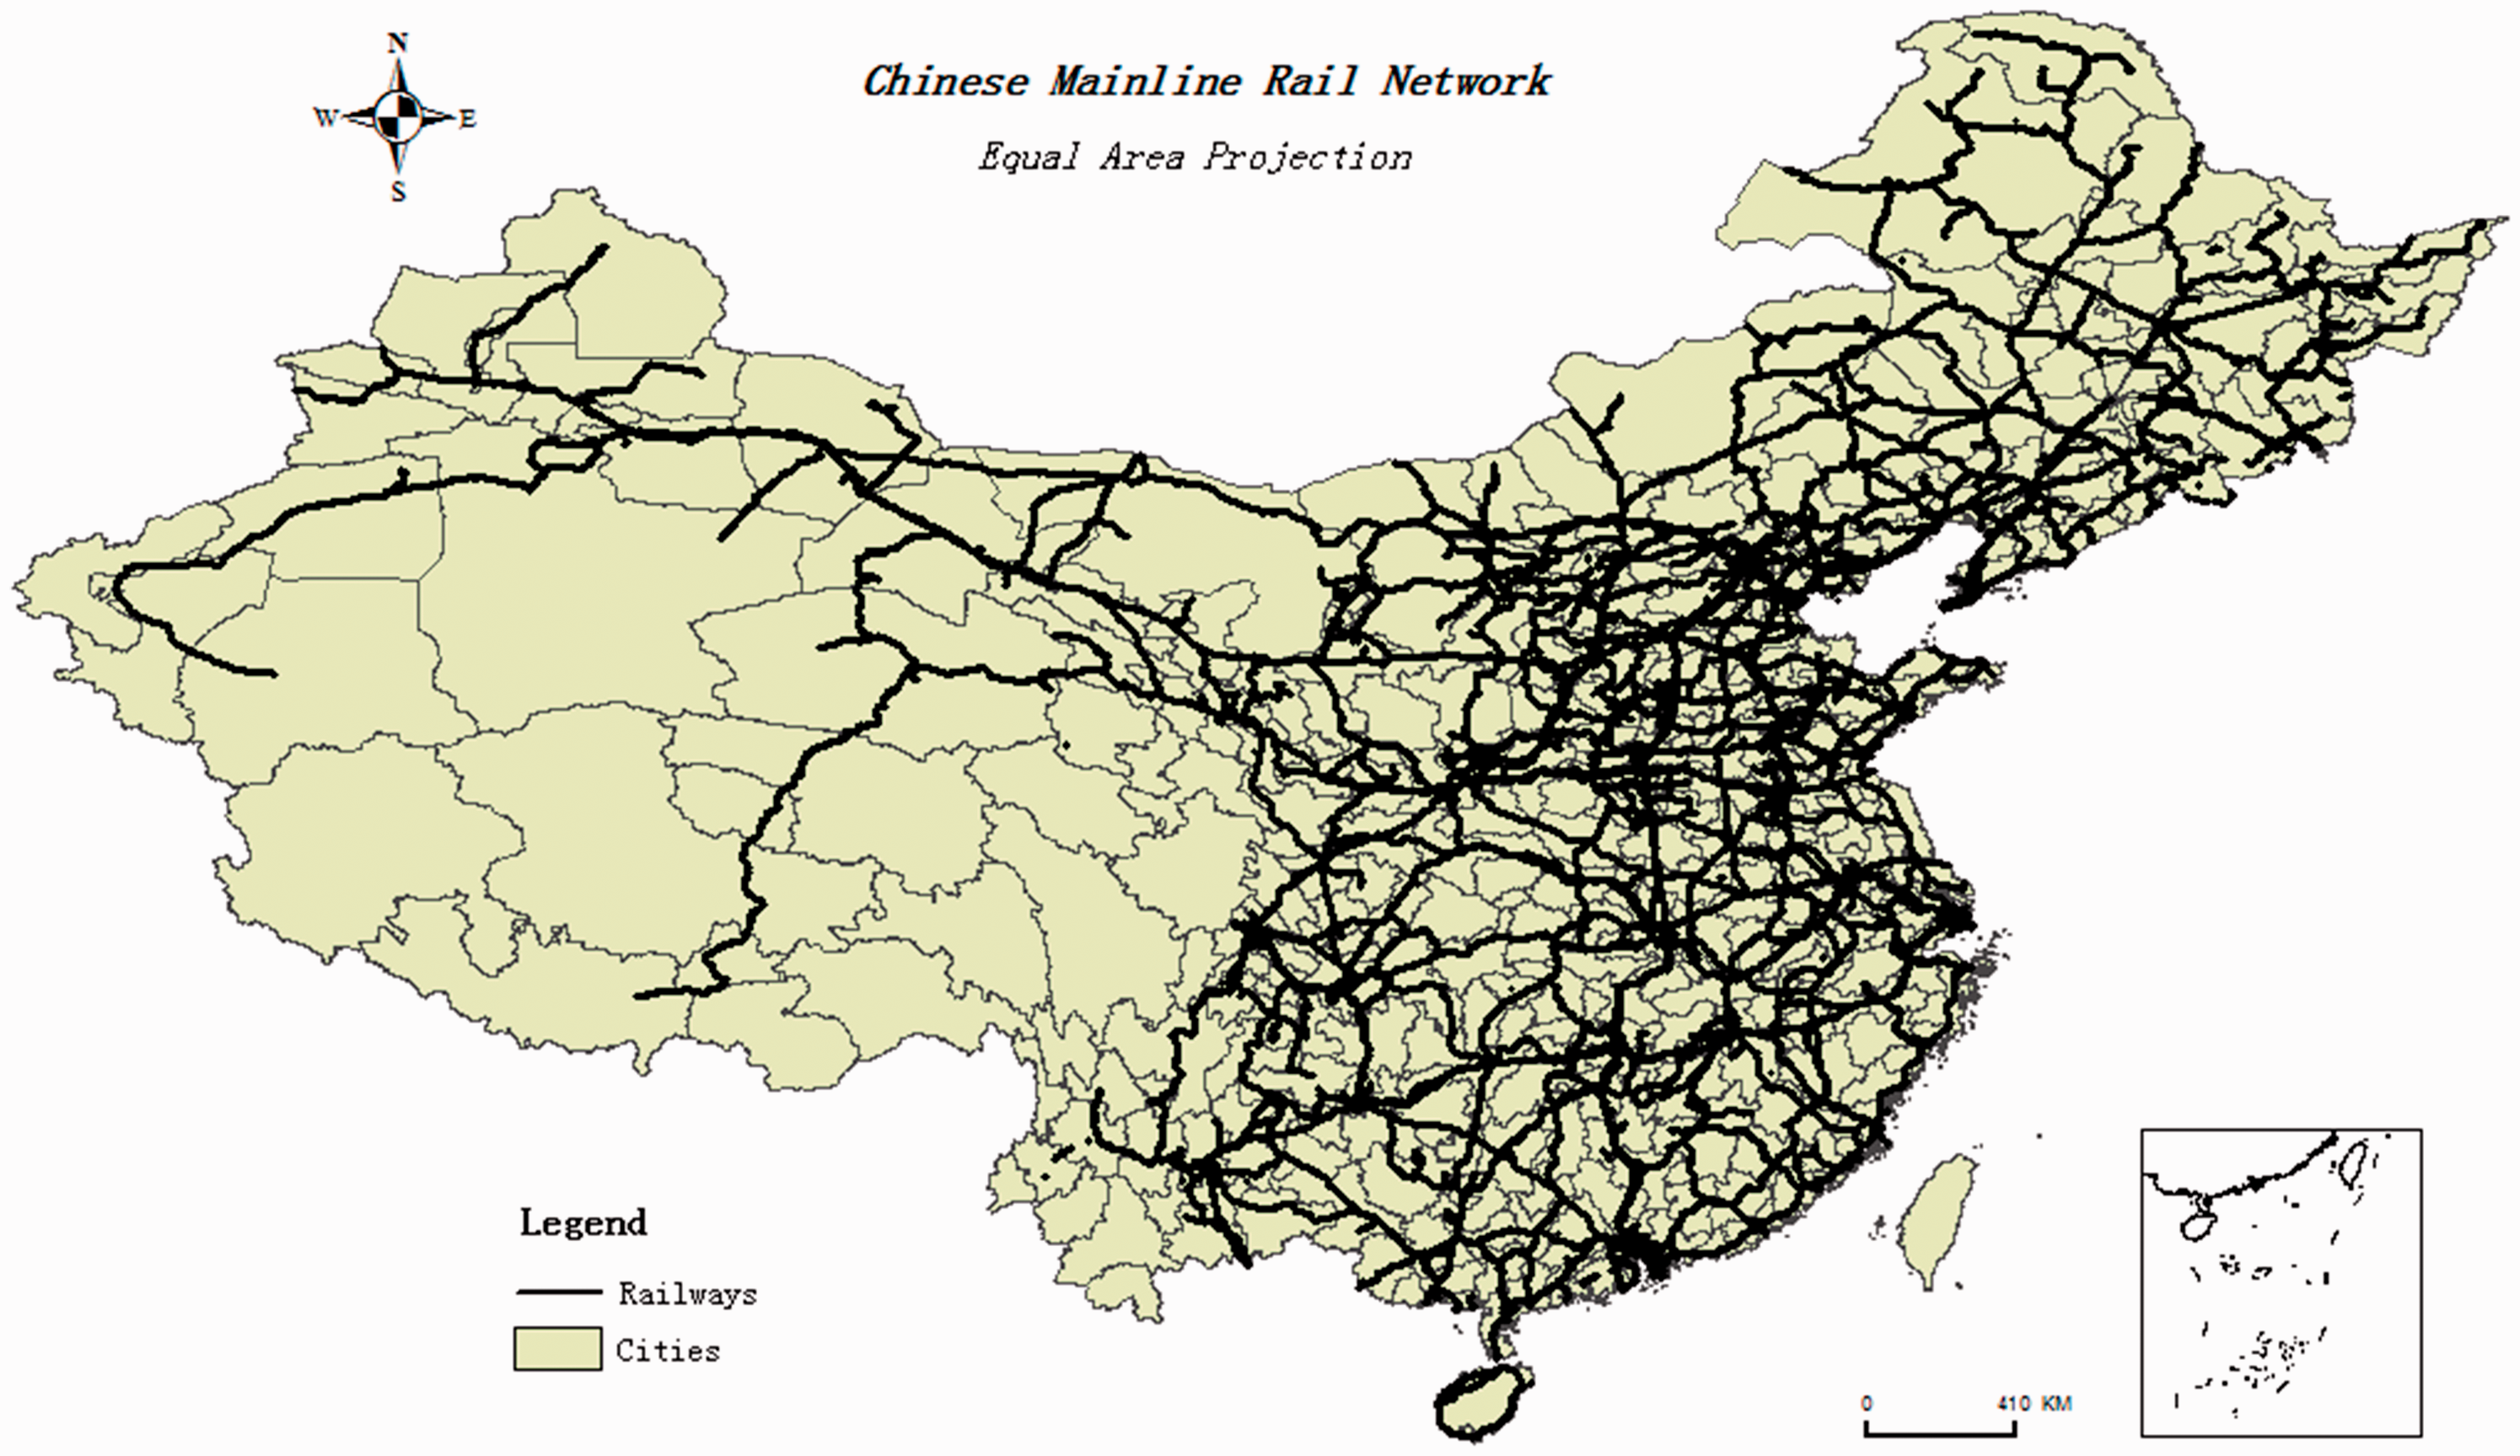
Equal land area map of the railway network in China.
The map shows that the distribution of railways in China is similar to the population distribution. In this map, the distribution appears rather uniform. Due to the denser population, the areas in East China are enlarged on this map, while the size of the western regions (e.g. Xinjiang, Tibet and Qinghai with provincial capitals of Urumqi, Lhasa and Xining, respectively) is reduced, reflecting their low population densities. The distribution of railway lines in West China is sparse in a traditional map, while on the population cartogram it does not greatly differ from that of East China. The railway distribution in the municipalities of Shanghai, Beijing and the capital of Guangzhou is more concentrated, as these cities are junctions in the national East China network with a number of stations.
Footnotes
Declaration of conflicting interests
The author(s) declared no potential conflicts of interest with respect to the research, authorship, and/or publication of this article.
Funding
The author(s) disclosed receipt of the following financial support for the research, authorship, and/or publication of this article: This research is under the auspices of the Strategic Priority Research Program of the Chinese Academy of Sciences (Grant No. XDA19040401), National Key Research and Development Plan (No. 2016YFC0503506).