



Abstract
China is accelerating its high-speed transportation network development. According to the National Bureau of Statistics of China (2016a), China’s total highway mileage had reached 120,000 km as of 2015, on par with the railway’s operating mileage. The highway is the major means for long-distance transportation between provinces and cities in China. A country’s highway structure and traffic demand distribution is a representation of its economic development level spatial pattern and the interaction between regions. China’s highway network is developed unevenly and its density varies significantly across regions. In general, the density of its eastern region is much higher than that of the western region. Likewise, China’s population is also distributed unequally. The western mountainous region is sparsely populated, with low economic development. The traditional equal land area highway map does not truly reflect the uneven distribution of passenger travel supply and demand.
This study develops an equal population map of mainland China and subsequently projects its intercity highways onto the map (Gastner & Newman, 2004; Sasi Research Group, 2018). The datasets used for the development consist of two parts: (1) the GIS data of China, obtained from the Thematic Database for the Human-Earth System of the Chinese Academy of Sciences and the 1:4M Database of the National Fundamental Geographic Information System of China; and (2) Chinese population data, obtained from the China City Statistical Yearbook 2016 (National Bureau of Statistics of China, 2016b) and Population and Employment Statistical Yearbook 2016 (National Bureau of Statistics of China, 2016c).
The map is produced and shown in Figure 1 as Mainland China’s highway network distribution relative to its population distribution. The municipalities and provincial capital cities are labelled on the map. The regions (including municipalities, provincial capitals and prefecture-level cities) are rescaled according to their respective populations to produce a map with evenly distributed population density. Then, the national highway network is adjusted and superimposed on the map in proportion.
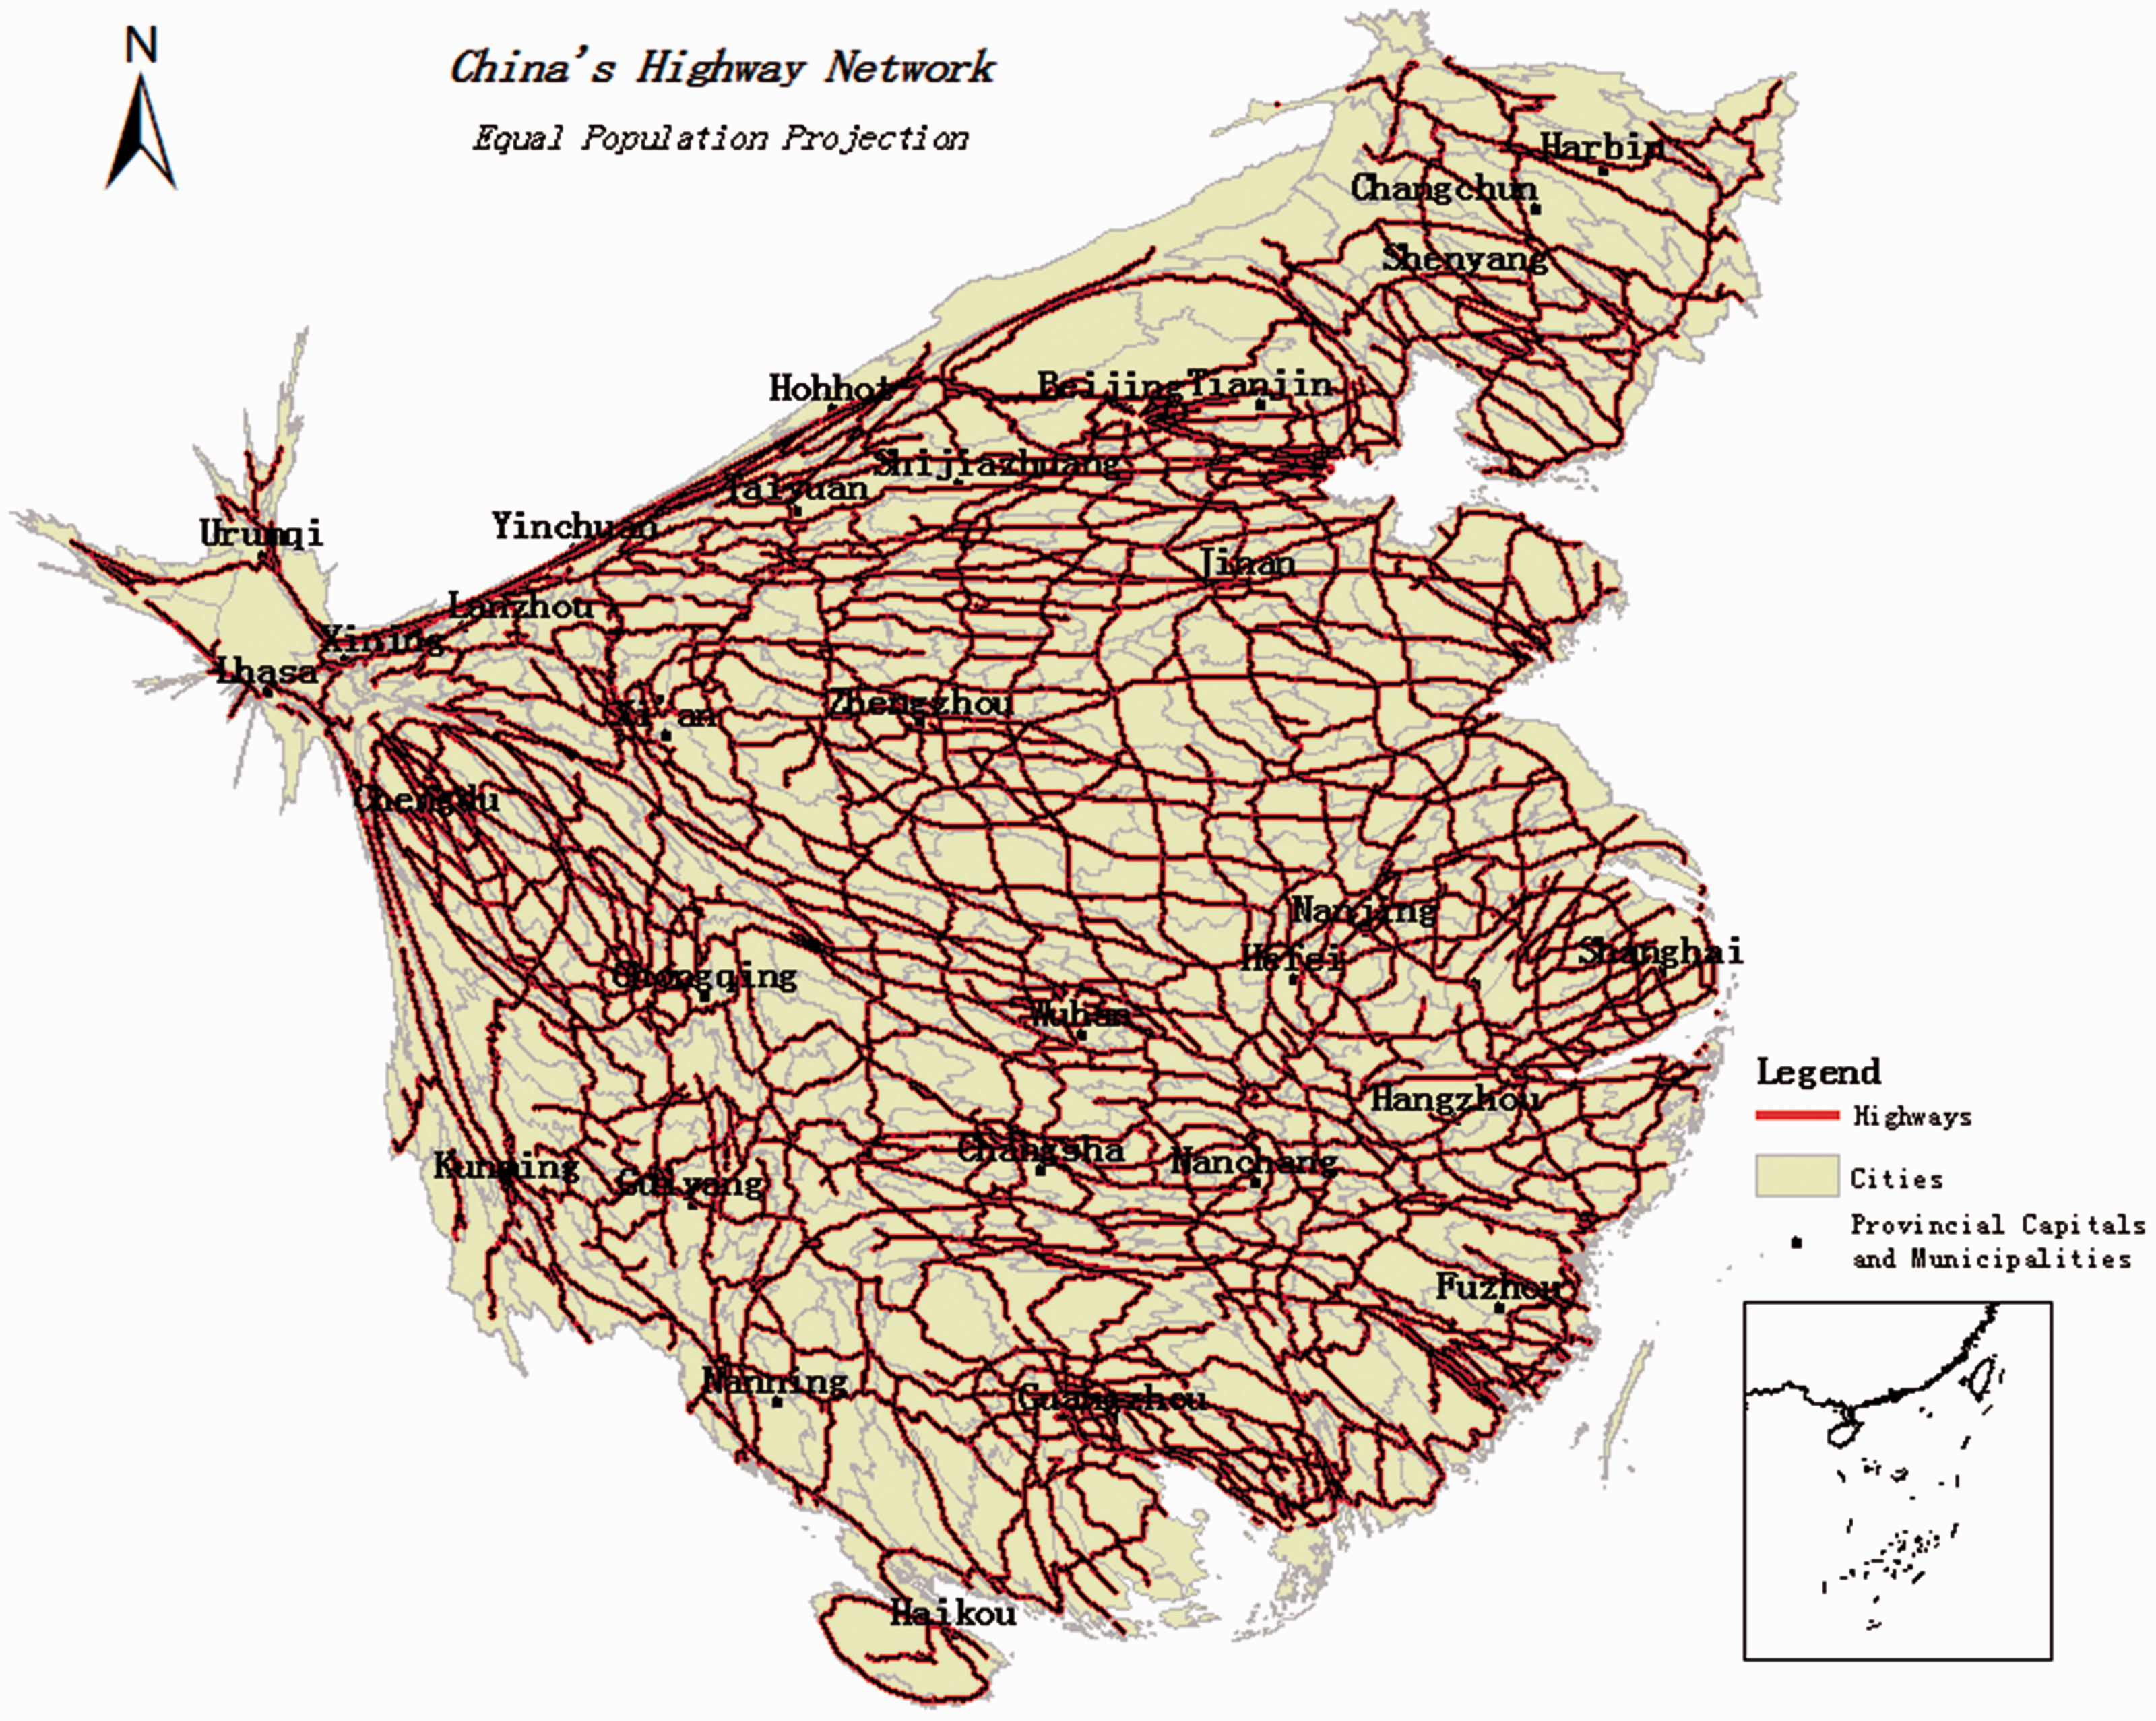
China’s highway network on an equal population cartogram.
In Figure 1, the deformation of the map is significant compared to the equal area cartogram shown in Figure 2 of the Appendix generated using the same highway data, which demonstrates the large difference in the spatial distribution of China's population. In the figure, the distribution of highways matches the distribution of the Chinese population. The eastern region is magnified due to its dense population; on the other hand, the size of the western region (including Tibet, Xinjiang, Qinghai and Inner Mongolia provinces, as shown on the map with their capitals, namely Lhasa, Urumqi, Xining and Hohhot) is significantly reduced due to its sparse population distribution.
The highway networks in metropolitan cities such as Beijing, Shanghai and Guangzhou are relatively dense, but surprisingly, the figure shows that the distribution of highways is relatively uniform with respect to the population distribution. The figure also demonstrates that the highway networks in northern Beijing are relatively sparse, which is consistent with the fact that the area is mountainous and its population density is lower than other areas of Beijing.
Footnotes
Declaration of conflicting interests
The authors declared no potential conflicts of interest with respect to the research, authorship and/or publication of this article.
Funding
The author(s) disclosed receipt of the following financial support for the research, authorship, and/or publication of this article: This study was funded by the National Key Research and Development Program of China (No. 2016YFC0503506) and Programme of Bingwei Excellent Young Scientists of the Institute of Geographic Sciences and Natural Resources Research, CAS, No. 2015RC202.