



Abstract
The Brexit vote is the most significant political event in recent British history. We present bivariate choropleth maps comparing the Leave vote share with age-adjusted secondary educational attainment. This provides an immediate visual representation of the spatial and bivariate correlations between these variables, as well as their geographical distribution. Only 12 of the 85 local authorities that voted Remain had lower than expected age-adjusted educational attainment; only 10 of the 95 local authorities in which the Leave vote share exceeded 60% had higher than expected age-adjusted educational attainment. While the effectiveness of choropleth maps for exploring the spatial characteristics of bivariate relationships has been discussed by a number of authors, our technique of using borders to highlight a threshold value appears to be under-utilised.
Keywords
The vote for the UK to exit the European Union is the most significant geopolitical event in recent British history, dominating domestic political activity for the last three years. Among the narratives that have emerged to explain the drivers of the UK’s vote to leave the European Union, five broad sets of causal factors can be identified:
Factors specific to the Leave and Remain campaigns, including misleading claims, campaign misspending and outside influence via social media. Cultural factors, such as English nationalism, affinity for authoritarian values, xenophobia or anti-European sentiment. Distributional factors stemming from globalisation, most notably the creation of a ‘left-behind’ group of the economically disenfranchised. Economic factors unrelated to globalisation, including rising inequality and austerity. Demographic factors, such as voting cleavages between the old and the young or those with and without a university education.
Evidence for each of these narratives has been presented since the referendum, and each would no doubt find a place in any comprehensive analysis of the causes of the vote (Becker et al., 2017; Dorling, 2016; Goodwin and Heath, 2016; Swales, 2016).
Notwithstanding the plurality of possible drivers of Brexit, political scientists have understood for some time that sociodemographic factors such as education, class and geography are fundamental in forming political and cultural identities (Campbell et al., 1960). These identities are relatively inelastic, and thus sociodemographic characteristics are often regarded as one of a small number of deep exogenous variables driving political outcomes: ‘sociodemographic factors and identities are causally prior to, and shape, political attitudes that in turn are the proximate cause of vote choice’ (Hobolt, 2016: 1266). The graphic presented in Figure 1 illustrates the power of this hypothesis for a key demographic variable: educational attainment at secondary school level.
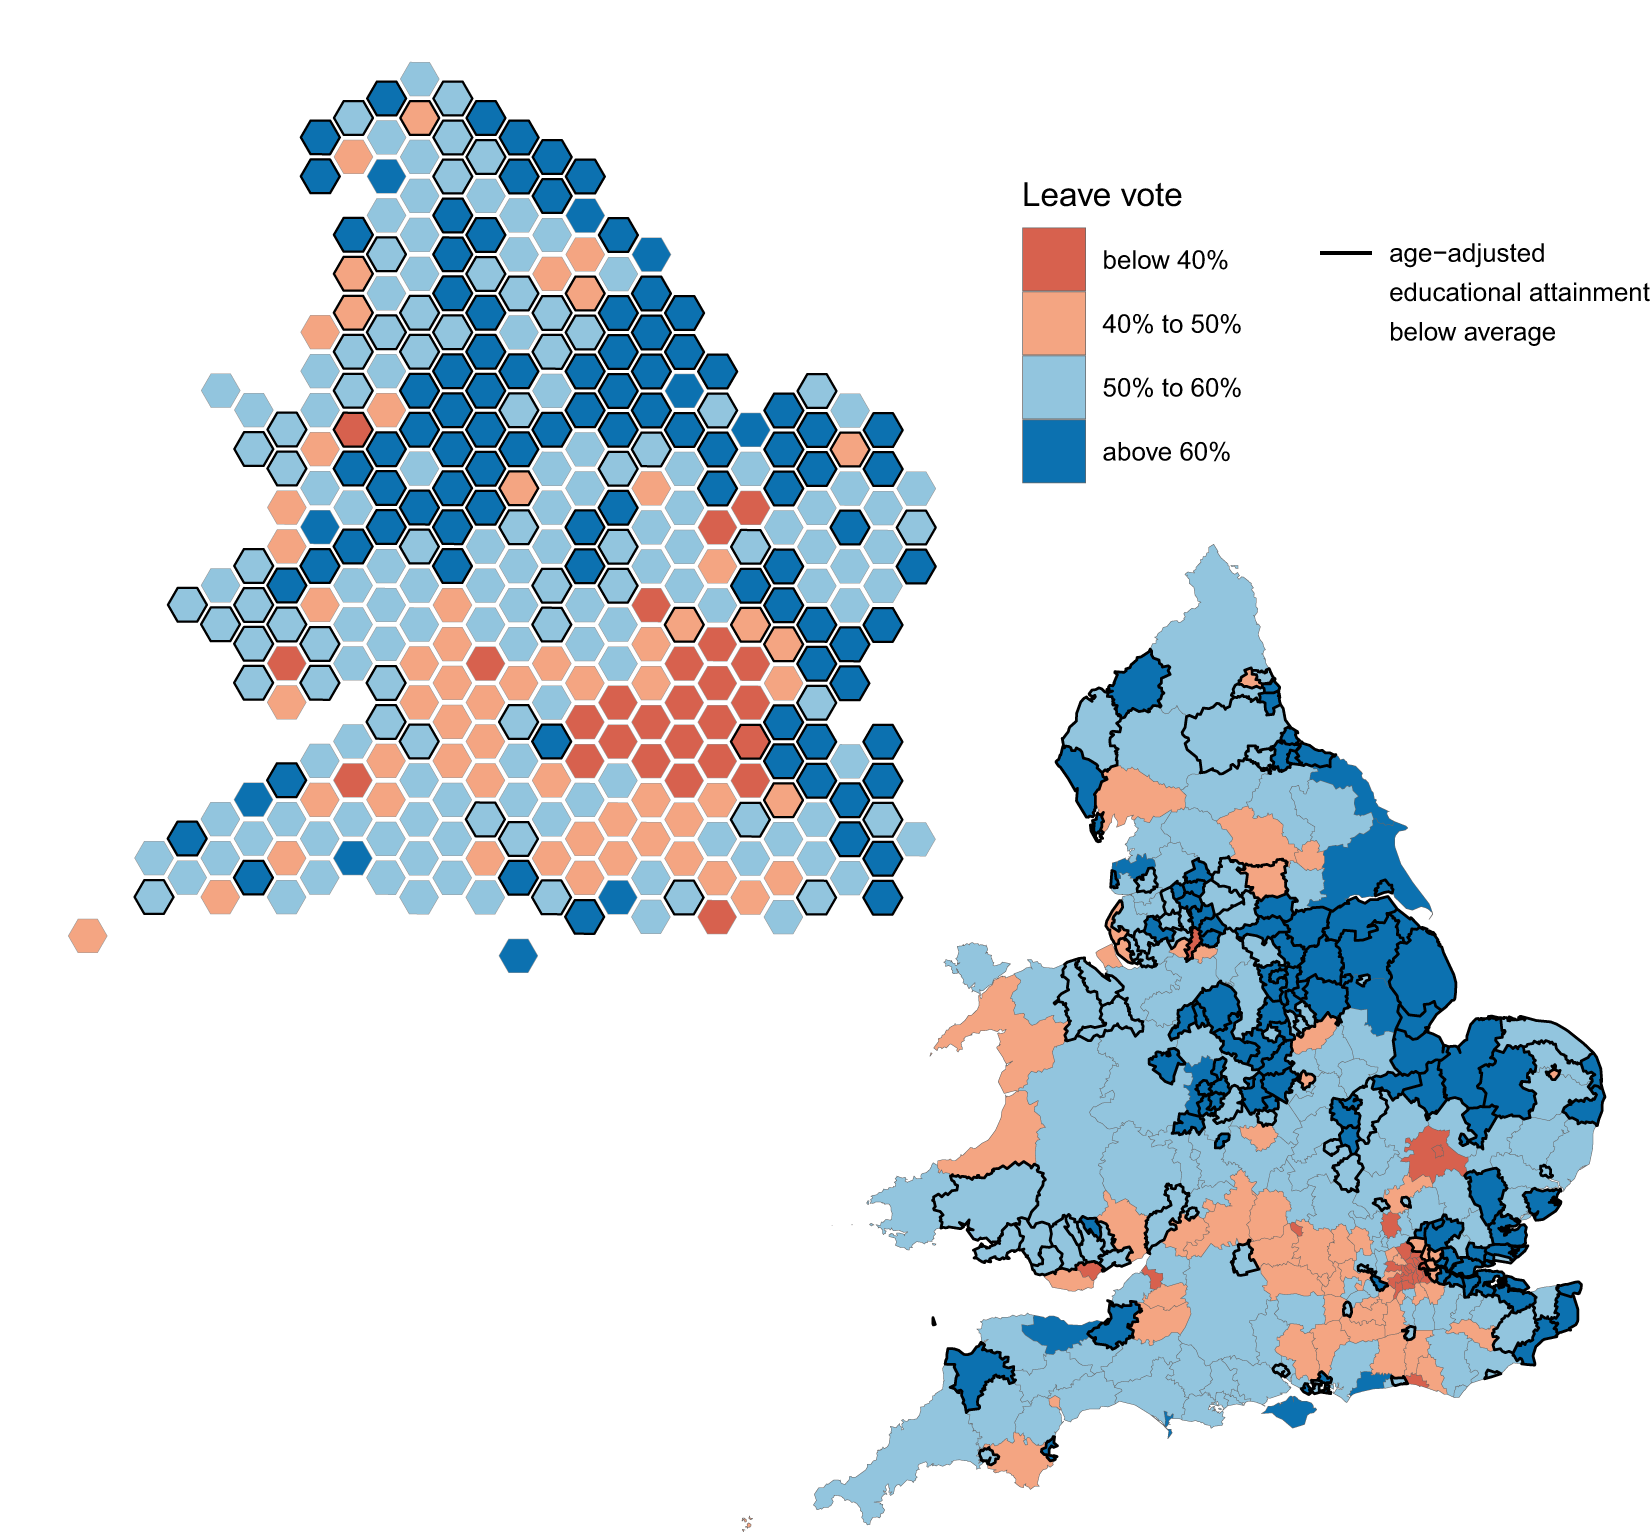
Choropleth map and cartogram hex map of Leave vote share and age-adjusted educational attainment in England and Wales by local authority.
The plots are bivariate choropleth maps of England and Wales constructed using (a) cartographic local authority border data, and (b) a stylised map in which each local authority is represented as a hexagon of equal size. The colour of each local authority indicates the proportion of the voting population that voted Leave, and a black border indicates local authorities where secondary educational attainment is lower than expected based on the distribution of the population by age and sex.
The age-adjusted education indicator is calculated using the standard approach (e.g. Ahmad et al., 2001) as follows. For each local authority in England and Wales, the percentage of the adult population with fewer than five GCSEs or equivalent is calculated from census data, giving a raw indicator. Since educational attainment will be influenced by the demographic structure of the area in terms of age and sex – each of which are significant covariates of the Leave vote – the raw indicator is adjusted to account for the underlying age structure of each local authority. First, for each five-year age and sex cohort (for example, females aged 19 to 24) across the entire population of England and Wales, the population percentage with fewer than five GCSEs is calculated. 1 A weighted average of these cohort percentages is then used to predict educational attainment for each local authority, using the age and sex structure of the local authority to derive the weights. Finally, the age-adjusted educational attainment indicator is the ratio of actual GCSE attainment to predicted GCSE attainment in each local authority. Areas where this ratio exceeds one (the population percentage with fewer than five GSCEs exceeds the expected percentage) are indicated with a black border.
The plots visualise both the geographical distribution of Leave votes and relative educational attainment, and the bivariate and spatial correlations between the two variables. The utility of choropleth maps in illustrating bivariate relationships has been emphasised by Olson (1981) and Leonowicz (2006), among others, although our particular combination of colour and highlighted borders appears to be rare.
The plot reveals strong correlations, both spatially and between educational attainment and Leave votes. Local authorities where the Leave vote exceeded 60% are clustered in the Midlands and the east coast. This clustering is closely matched by our educational indicator: in only 10 of the 95 local authorities in which the Leave vote share exceeded 60% was age-adjusted educational attainment higher than expected. Conversely, only 12 of the 85 local authorities that voted Remain had lower than average high school educational attainment. Seven are cities: Leicester, Norwich, Manchester, Liverpool and Sefton, Newcastle and Leeds; the remaining five are boroughs in east London that are geographically contiguous with the large cluster of strongly Leave-voting areas in Kent and Essex.
These observations support existing analyses of the relation between education and voting patterns (e.g. Becker et al., 2017; Swales, 2016), and the importance of sociodemographic characteristics as key drivers of the UK’s vote to leave the European Union.
Footnotes
Acknowledgements and software
We are grateful to Danny Dorling for helpful comments and suggestions on an earlier version of this visualisation. Local authority boundary shapefiles were downloaded from the Office for National Statistics Open Geography Portal at http://geoportal.statistics.gov.uk/. The local authority hexagon cartogram shapefile was created by Ben Flanagan and made available under a Creative Commons Licence at  .
.
Declaration of conflicting interests
The author(s) declared no potential conflicts of interest with respect to the research, authorship, and/or publication of this article.
Funding
The author(s) received no financial support for the research, authorship, and/or publication of this article.