



Abstract
Suburbs are subject to numerous stereotypes, including that they lack density, diversity and inclusivity. While these stereotypes have largely been dispelled, the deficit around anti-poverty infrastructure remains understudied. The focus of this paper is to systematically investigate the ostensible mismatch between (a) the emerging suburbanization of poverty, and (b) the potential lack of anti-poverty infrastructure to serve it, with a focus on suburban voluntary sector provision. These aims address the potential infrastructural deficit around voluntary sector provision in suburban areas of prosperous global cities in the Global North. Using Metropolitan Sydney as the case study, we investigate the extent of the suburban infrastructure service deficit across metropolitan space in 2016, comparing poverty patterns and supply of voluntary sector organizations. We find that poor inner and outer suburbs featured fewer services than the inner city, both per capita and per low-income residents, confirming an anti-poverty infrastructural gap.
Introduction
Suburbs may be defined as ‘the combination of non-central population and economic growth with urban spatial expansion’ (Ekers et al., 2012: 407). Peripheral growth is now virtually universal and constitutes the ‘dominant mode of urban existence’ (Walks, 2013: 1471), although there still lacks a single global model. Given the absence of a global model, suburbs have been subject to a variety of stereotypes (Harris, 2015): that they are low density; that they lack diversity; that they are strictly middle-class and above; and that they are secondary to urban cores in terms of constructing urban theory (see also Keil, 2018). However, these stereotypes have largely been dispelled through an emerging literature around ‘post-suburbia’ (Phelps, 2015; Phelps et al., 2010) and the ‘in-between city’ (Sieverts, 2003, 2011; Young and Keil, 2014), in which some suburbs increasingly have the functions (i.e. economic gravity, infrastructure, class and racial diversity), but not always the form, of more established cities (Phelps and Wood, 2011).
But there is one enduring stereotype that has so far eluded systematic study and critique – that of the anti-poverty infrastructure deficit in suburbs, particularly via the voluntary sector providing housing, mental health, employment, substance-abuse treatment and so forth for poor people in situ. Phelps et al. (2010: 375) noted that as certain suburbs age and become impoverished, the original lack of collective consumption infrastructure becomes a deep and persistent gap, leading to ‘political tension centred on balancing continued economic growth with corresponding expenditure on physical and social infrastructure’. The focus of this paper is to systematically investigate this ostensible mismatch between (a) the emerging suburbanization of poverty and (b) the potential lack of anti-poverty infrastructure, with a focus on voluntary sector provision. These aims seek evidence of an infrastructural deficit around voluntary sector provision in suburban areas of prosperous global cities in the Global North, using the example of Metropolitan Sydney. Our empirical work builds on Allard (2017), who carried out a comparative study of Chicago, Los Angeles and Washington, DC in terms of the suburbanization of poverty and its implications for the local social safety net. However, in this paper we move beyond the American context, which is unique among developed nations in terms of the severity of poverty and the porous nature of the social safety net. We instead consider an Australian case study that is arguably more applicable to other developed nations – such as Canada and Continental Europe – where poverty is less racialized, less severe and generates an ostensibly more robust state response. From this basis we ask: what is the extent of the suburban anti-poverty infrastructure deficit across metropolitan space in developed countries such as Australia? And with what implications for the concept of post-suburbia?
In the remainder of the paper, we outline the case study and methods for answering this question, using Metropolitan Sydney as a case study. Sydney works well for this kind of study, given that its population in poverty has long been concentrating in western suburbs under conditions of pervasive inner-city gentrification (DeVerteuil, 2015). Poverty patterns for the metropolitan area are first presented from 1991 to 2016, to see evidence of changing dynamics, followed by a presentation of voluntary sector geographies for 2016. The 1991 and 2016 poverty geographies are then compared for 2016, using a typology of (a) high and low services combined with (b) recent and continued prosperity versus recent and continued poverty. This yields a picture in which the recent and continued poor postal areas were under-serviced when compared to the recent and continued prosperous postal areas. This suggests temporal and spatial lags in service provision to some (impoverishing) suburbs. Future research on these understudied empirical gaps is then presented, along with discussion of how the results contribute to our conceptual understandings of post-suburbia, collective consumption and social infrastructure.
Conceptual review: Post-suburbia and its gaps
The emerging literature on post-suburbia (e.g. Keil, 2018; Phelps et al., 2010; Tzaninis, 2019; Walks, 2013) goes beyond longstanding city–suburb dichotomies and directly challenges a variety of suburban stereotypes, arguing that suburbs are in fact quite variegated and multi-directional, dense (or at least densifying), diverse (and have been for quite a while), sometimes impoverishing, and crucial to understanding the 21st-century city in its entirety (De Jong, 2014; Harris, 2015; Keil, 2018). This is also set within a context of a more blurred suburban governance, that is the ‘constellation of public and private processes, actors, and institutions that determine and shape the planning, design, politics, and economics of suburban spaces and everyday behaviour’ (Ekers et al., 2012: 406), producing urban spaces that are neither an established downtown nor new suburbs, but in between, with mixed density and diversity (Young and Keil, 2014). Using the Toronto case study, Harris (2015) contends that suburbs are diverse enough to distinguish between, at a minimum, older ‘inner’ suburbs that are subject to densification and decline, and newer, car-oriented, lower-density ‘outer’ suburbs and exurbs.
This connects to an increasingly deconcentrated poverty geography at the metropolitan scale that suggests a more varied set of trajectories for suburbs, with some clearly becoming destinations for central-city poverty populations pushed out by gentrification and high prices while others maintain their original class-based exclusivity (Allard, 2017; Anacker, 2015; Kneebone and Berube, 2013; Murphy, forthcoming). In particular, inner-ring suburbs in the developed world are now facing many of the same challenges (e.g. low tax base, ageing infrastructure, influx of poverty populations) that once bedevilled inner-city areas. This is becoming the trend in certain American cities. For instance, in Baltimore, certain inner-ring suburbs from the immediate postwar period were already showing signs of down-filtering by the 2000s (Hanlon, 2008; Hanlon and Vicino, 2007), all set within severe fiscal imbalances at the metropolitan scale where governmental expenditures and infrastructure usually benefit already well-off cities (Joassart-Marcelli et al., 2004). The American discourse around emerging suburban poverty intertwines with old fears around urban decline and blight (Hartt and Hackworth, 2018; Schafran, 2013). Taking the Bay Area as an example, Walker and Schafran (2015) note that far-flung suburbs are taking in the working poor and the working class that would otherwise live closer to their central-city jobs, thereby binding the prosperity of coastal areas to the relative decline of less expensive exurban suburbs. What goes unmentioned, however, is that this exodus goes to places largely bereft of established anti-poverty infrastructure, a crucial conceptual and empirical gap that forms the centrepiece of this paper.
What resources are there to combat this emerging suburban poverty? This question connects the post-suburban literature with an older, more established one around collective consumption and social infrastructure (see also Niedt, 2013; Phelps, 2017; Phelps et al., 2015). Arguably written at Fordism’s high-water mark, Castells (1983) saw anti-poverty infrastructure as something provided by the state, and sometimes at the behest of local communities (‘grassroots politics’). Even in the early 1980s, there were a variety of anti-poverty infrastructures that could be arrayed – some of which clearly focused on individuals (e.g. welfare payments, pensions, unemployment benefits), but others clearly place-based, including social housing (Joassart-Marcelli et al., 2004; Mitchell-Brown, 2013). The place-based anti-poverty infrastructure is what Klinenberg (2018: 5) called everyday ‘social infrastructure’, which is the ‘informal, incremental, peopled … infrastructure that supports social reproduction in cities’. He goes on to underline that social infrastructures are ‘physical places and organizations that shape the way people interact’, not social capital, but the physical conditions that determine whether social capital develops. When social infrastructure is robust, it fosters contact, mutual support, and collaboration among friends and neighbors; when degraded, it inhibits social activity, leaving families and individuals to fend for themselves. (Klinenberg, 2018: 5)
As an increasingly important platform for place-based anti-poverty measures, the voluntary sector is very much a hybrid institution, ‘distinguishable from the state by its independence; from the market by its emphasis on the non-profit principle, mutualism and altruism; and from the family/community by its formality’ (DeVerteuil, 2015: 41). Since the early 1980s, the (welfare) state in the developed world has increasingly transferred its direct provision of many collective resources to the voluntary sector, although certainly not all (e.g. education). This devolution has been framed within a ‘shadow state’ structure in which the state funds and orchestrates the voluntary sector (Wolch, 1990), yet no longer directly provides many day-to-day services (see also DeVerteuil, 2015). This process has been criticized on many levels, including the fact that the voluntary sector can never hope to replicate the universality and spatial coverage that the (national) welfare state once provided. Voluntary sector provision has long been recognized to be highly uneven (DeVerteuil, 2011, 2015; Fyfe and Milligan, 2003; Wolch, 1990). This should hardly come as a surprise, given that voluntary sector geographies are largely unplanned, uncoordinated and unregulated by the (welfare) state, yielding an organic service geography. The pattern is not, however, entirely haphazard – the voluntary sector must work under certain constraints, including community opposition (NIMBY, or Not In My Backyard) to services for stigmatized groups (e.g. homeless, individuals with mental illness or substance-abuse issues) which tends to shunt services to poorer, inner-city and heterogeneous areas, but also that the sector actively seeks centrality to make their services as accessible as possible to as many clients as possible (DeVerteuil, 2015). In sum, anti-poverty infrastructure is very much place-based and place-bound, requiring co-location with vulnerable clients who tend not to travel far for services, and is increasingly provided by the voluntary sector yet roughly coordinated by the state via funding.
Combining the post-suburban with collective consumption, Phelps et al. (2015: 512) underline that ‘Castells spoke of the urban as a unit of collective consumption’, and his examples spanned inner-city areas (e.g. Mission District in San Francisco) to more peripheral locations (e.g. suburbs of Santiago de Chile, Madrid). More than 35 years later, collective consumption infrastructure remains quite variegated across urban areas, but a general pattern remains firmly in place, with anti-poverty infrastructure clustering in the older, more established cores of cities and less as one moves to the newer, more suburban and exurban locations, a process marked by inertia, exclusion and fiscal (in)capacity. Joassart-Marcelli et al. (2004) found that for Southern California, redistributive spending and infrastructure tend to co-locate in older, poorer and inner-core cities, but not in impoverishing cities at the exurban fringe with the most limited fiscal capacity (e.g. Inland Empire). This calculus reflects a key tension; as Phelps (2017: 5) states, ‘in many respects the “suburban question” has been one – more so than the urban question – of making good shortfalls in infrastructure and service provision’. This deficit is not just due to inertia within the built environment, but also conscious decisions taken by newly suburbanizing areas in the 1950s through to the 1990s to minimize public infrastructure and investment. As such, many suburbs are now playing catch-up when it comes to certain ‘soft’ infrastructure, including anti-poverty resources. In effect, there has been only limited ‘splintering’ of anti-poverty service provision (via the voluntary sector) across the metropolitan area, with a disproportionate amount remaining firmly in the inner core, a monocentric model that is perhaps now under threat in an era of mass inner-city gentrification (DeVerteuil, 2015). Just as suburbanism has largely been ignored within theoretical debates within urban studies in favour of the core (Keil, 2018), so too have the incipient geographies of a more scattered, deconcentrated voluntary sector geography been ignored (DeVerteuil, 2017; DeVerteuil et al., 2019a).
One way to ground these theoretical propositions and empirical realities is to examine prosperous cities at the top of the urban hierarchy in the developed world, places such as London and New York, but also Chicago, Los Angeles and Washington, DC (Allard, 2017). In these metropolitan areas, there has been a dramatic renewal of the urban core and subsequent displacement of poor people out to suburbs (and beyond), sometimes through market mechanisms and other times through direct public policy, especially the destruction of large, centrally located social housing (Elliott-Cooper et al., 2020). This displacement has important consequences for how poor people access services. In the book Resilience in the Post-Welfare Inner City: Voluntary Sector Geographies of London, Los Angeles and Sydney, DeVerteuil (2015) found that on a per capita basis, the inner cities of London, Los Angeles and Sydney consistently featured substantially more voluntary sector organizations than did suburban areas. For London in particular, the pressures upon the inner-city poor include consolidation of established areas of wealth (see also DeVerteuil and Manley, 2017), pervasive gentrification, demolition of council estates and the pernicious impacts of the cap to housing benefits, serving to evict poor tenants – but that most Outer London boroughs were woefully unprepared for the emerging exodus (DeVerteuil, 2017). Beyond fundamentally reconfiguring the traditional urban geography of poverty in most Global North cities, this purported deficit maroons traditional concentrations of voluntary organizations in the (gentrifying) inner city just as its clients are displaced outwards. This spatial shift in poverty threatens to become a deleterious mismatch at a time when the sector is increasingly called upon to fill the gaps of a receding and austere welfare state. This deficit pattern is replicated even in urban areas with relatively strong public provision of anti-poverty infrastructure and even more pronounced suburban disadvantage, such as in the case of Paris (Dikec, 2007; Lehrer and Tchoukaleyska, 2017; Wacquant, 2008). In the next section, we propose a case study of Sydney, which largely mirrors this London model, but also shows the gradual ‘flattening’ of poverty across the metropolitan area (De Jong, 2014) while its service geography clings stubbornly to the inner city.
Case study of Metropolitan Sydney: Poverty and voluntary sector geographies
Metropolitan Sydney was chosen as a case study precisely because it illustrates some of the post-suburban and voluntary sector dynamics covered in the previous section. It also offers an apt example to explore the extent of the suburban anti-poverty infrastructure deficit across metropolitan space that mirrors conditions in cities in Canada and Continental Europe, while potentially diverging from the American model of a porous safety net combined with deep-seated, racialized poverty. Following Burawoy et al. (1991) and their extended case study method, we use Sydney to both deconstruct some of the assumptions around the relationship between post-suburbia and anti-poverty infrastructure, and also to reconstruct the relationship with the empirical results.
More contextually, Sydney is Australia’s undisputed global city, the main command-and-control centre for the economy and the main gateway airport, and this has been consolidated during the 1991–2016 period that this paper covers. But as Sassen (2001) and Massey (2007) noted, being a global city also means suffering from growth in high and low earners (or job quality) at the expense of the middle, and these conditions are largely a function of their status as immigrant magnets. Sydney is no exception here, with plentiful evidence of social and spatial polarization (Baum, 1997; O’Neill and McGuirk, 2002; Randolph and Holloway, 2005). At the intra-urban scale, Sydney is seen to have a prosperous centre and eastern coastal suburbs, and a more diverse and sometimes quite impoverished inner and outer suburban landscape heading west to the interior (Connell, 2000; Raskall, 2002). Sydney’s inner city is quite compact, combining what Aplin (2000: 69) deemed the CBD (City of Sydney) and the inner-core Local Government Areas of Inner West; Mosman, North Sydney; Woollahra. Together, Inner Sydney’s population in 2016 was 540,790, slightly more than 10% of Metropolitan Sydney. These areas were developed in the late 19th century, and have experienced steady gentrification and densification (Aplin, 2000; Engels, 1999; Shaw, 2007) to the point where ‘inner Sydney appears as a sea of renewal punctuated by individual properties awaiting rehabilitation’, the most concentrated area of wealth in Australia (Horvath, 2004: 102). Conversely, poverty is increasingly pooling in certain western suburbs of the metropolitan area, such as Liverpool, Kingswood, Mount Druitt and Penrith, but also areas of high immigration, such as Auburn and Parramatta (Australian Government, 2018). The Dropping off the Edge study (Jesuit Social Services and Catholic Social Services Australia, 2015) confirmed a clear pattern of ‘most disadvantaged’ postal areas in these same western Sydney suburbs.
In Figure 1 we retain the Sydney inner-core definition used by DeVerteuil (2015), and propose an inner–outer suburb delineation following DeVerteuil et al. (2007) and their study of Winnipeg, using residential density to distinguish the older built-up suburbs (and some newly redeveloped ones, such as Cumberland) from the lower-density suburbs, as well as the more far-flung nodes that were built up as separate communities before being engulfed by generalized sprawl (see Harris, 2015 for Toronto). This relational approach unpacks the traditional city–suburb dichotomy into a more granulated set of landscapes.

Map of Metropolitan Sydney’s inner core,a and inner and outer suburbsb by Local Government Area.
The existing voluntary sector geography of Sydney remains quite centralized, at least according to previous studies. Using 2011 census data and 2013 voluntary sector data (ACNC, 2013), DeVerteuil (2015) found a total of 3435 registered not-for-profits in Metropolitan Sydney, with 1638 of them in Inner Sydney. This gave a per capita measure of 0.79 organizations per 1000 persons in Metropolitan Sydney, and 3.73 organizations per 1000 persons in Inner Sydney. Registered not-for-profit charities were defined by the Australian Taxation Office as ‘not operating for the profit or gain of its individual members’ (www.ato.gov.au/Nonprofit) and registered with the Australian Charities and Not-for-profits Commission (ACNC), and are equivalent to the voluntary sector elsewhere. This also suggests, in a non-systematic fashion, that there is an existing service gap between over-provisioned Inner Sydney and under-provisioned, impoverishing western suburbs. What is now needed is a less piecemeal, more formal analysis of this purported gap so as to grasp the current extent of the suburban anti-poverty infrastructure deficit across metropolitan space in Sydney. We use a combined supply-and-demand analysis that will be more systematic but also temporally dynamic, looking at poverty trends between 1991 and 2016, and then add services both per capita and per 1000 low-income residents to sharpen the analysis.
Data and methods
Overall, we use spatial and statistical analysis to determine the suburban anti-poverty infrastructure deficit in Metropolitan Sydney and qualitative semi-structured interview analysis to unpack the implications for post-suburbia. The data sources for the Sydney case study include (a) census data on poverty (1991–2016); (b) voluntary sector data for 2016; and (c) four ‘big picture’ interviews in suburban Sydney that speak to current voluntary sector and poverty patterns. While limited in number, the big picture interviews expressly aimed to bridge the gap between pattern (census data, voluntary sector data) and explanation of anti-poverty infrastructural gaps. For poverty data, Australian census data was used. The Australian Bureau of Statistics (ABS) conducts the census every five years, and it is compulsory for all households to participate (ABS, 2016a). The Socio-Economic Indexes for Areas (SEIFA) dataset provides a summary of census data relevant to understanding socioeconomic advantage and disadvantage in Australia (ABS, 2016a). The 1991 SEIFA dataset was selected as the starting point for this research due to the consistency of data categories included following the 1986 census, allowing analysis of the same categories between 1991 and 2016 (the most recent census).
The SEIFA dataset includes a number of indexes focused on relative disadvantage, education and occupation, and economic resources. The indexes in SEIFA are developed by analysing the correlations that exist between characteristics using principal component analysis (ABS, 2016a). This research draws on data from the ‘Statistical Areas level 1’ census geography, which can then be aggregated based on the postal area data contained within the SEIFA data set. Poverty was considered a good proxy for need, given that vulnerable populations who use the voluntary sector tend to be poor, or at least socially and spatially precarious (Jordan et al., 2017). To focus the poverty data, we relied on taxation statistics from the Australian Taxation Office at the postal area level for the 2014–2015 income year. This data set draws on the information submitted by Australian citizens and businesses as part of their annual tax return submission to the Australian Taxation Office. All residents who qualified for a low-income tax offset were considered to be in poverty. Although an imperfect measure as tax records may undercount the targeted population, it is the most suitable alternative at the required spatial scale.
Voluntary sector data was sourced from the ACNC register (ACNC, 2017). The ACNC is the national regulator of charities in Australia, and requires charities and not-for-profit organizations to report to them annually in order to access tax concessions (since 2012). The ACNC contains a summary of all registered charities, as well as financial information regarding their income, investments, expenses, grants, and assets; in 2016 there were 9717 organizations registered in Metropolitan Sydney (ACNC, 2017). There is limited data surrounding the existence or spatial location of charities or not-for-profit organizations prior to 2012, and for this reason it was not possible to trace the trajectory of not-for-profit geographies over the same 1991–2016 period as for poverty. Similar to the above-mentioned data sets, the voluntary sector data is spatially delineated by Australian postal area.
Postal areas are an ABS approximation of postcodes that enable the comparison of ABS data (such as poverty data from the census) with other data collected using postcode geographic references (such as voluntary sector data collected by the ACNC). Postcodes are a numeric descriptor used to describe a postal delivery area in Australia introduced by Australia Post (the national postal service) in the 1960s to aid with the efficient delivery of mail. Postcode boundaries are determined by the ‘distribution of dwellings within a spatial area’ (ABS, 2016b). Postal areas are an ABS approximation of postcode boundaries used to aggregate and analyse address-based data collected as part of the Australian census. The terms postcode and postal area are used interchangeably in the literature referring to Australian address-based data. Postcode and postal area boundaries can be amended based on changes to the distribution of dwellings within them over time; however, there have not been any changes to postcode boundaries since the early 1990s (ABS, 2016b). The size of the population residing in a single postal area can vary considerably from a few thousand to upwards of 100,000. As such, this paper relies on relative, rather than absolute, variables throughout the analysis. While perhaps not perfect, postal areas are sufficient to gain insight into the overarching spatial changes in the Metropolitan Sydney area over time.
Finally, the ‘big picture’ interviews were with executive directors for Mission Australia and Islamic Relief Australia, both in January 2018, and two with board members of the Western Sydney Community Forum in March 2020, whose main focus is overall service provision across all western suburbs. We sampled from the population of voluntary sector organizations identified from the ACNC database for 2016. Recruitment was done by email, and the sampling frame was designed more to obtain an overall sense of trends than to provide an exhaustive overview – we felt that four interviews would be sufficient for this purpose. The interviews focused less on the details of the particular organizations, and more on the larger interplay between poverty and service provision across the entire Metropolitan Sydney area. This information was bolstered by several policy documents and studies (Australian Government, 2018; Jesuit Social Services and Catholic Social Services Australia, 2015).
Data analysis drew inspiration from Wolch and Dear (1993), who undertook a systematic analysis of demand for services (measured by the number of extremely poor people) overlapping with the supply of anti-poverty services (measured by the density of voluntary sector organizations) in Los Angeles County. The advantage of this approach is its straightforward application to other locales. The dominant findings in 1990s Los Angeles County showed an incredibly uneven service landscape, with deficits not just in suburban nodes of poverty but also central ones where services were plentiful (‘service hubs’), but not plentiful enough for the large demand. This effective mapping method was again used to map the supply of voluntary sector organizations and demand by work-precarious migrants in Hong Kong and London (Jordan et al., 2017). Of course, there are disadvantages to this approach, namely that all organizations were equally weighted regardless of their importance to vulnerable populations, their size or their budgets.
More specifically, to answer the larger question of the extent of the suburban anti-poverty infrastructure deficit across metropolitan space in Sydney, we (a) analyse poverty trajectories from 1991 to 2016 for Metropolitan Sydney by postal area, and (b) analyse the supply of voluntary sector services vis-à-vis need for 2016. For the first step of the analysis, we present a full data set of relative poverty for 217 postal areas for each five-year period between 1991 and 2016. However, because of how the indexes are calculated, it was not appropriate to compare the absolute index results over time as the constituent variables and variable weights for the index are likely to have changed, the distribution of the standardized index values will have changed (e.g. a score of 800 does not represent the same level of disadvantage in different years) and there are likely to be changes in the ways the variables are defined. Therefore, we calculated the weighted average of the entire metro and then recalculated the individual indexes as location quotients. In short, the relative poverty of each postal area is measured against the metro average. A score greater than 1.0 means the area has relatively low poverty compared to the metropolitan areas as a whole, and a score of less than 1.0 means the area has relatively high poverty. With these scores in place, we can then examine how poverty for each postal area relative to the metro has changed over time. This was done in a two-step fashion, taking into consideration 1991 and 2016 data for poverty, emerging with four categories:
Continued poverty: high poverty in both 1991 and 2016 Recent poverty: low poverty in 1991, high poverty in 2016 Recent prosperity: high poverty in 1991, low poverty in 2016 Continued prosperity: low poverty in both 1991 and 2016.
For the second step of the analysis, we first present the 2016 voluntary sector landscape, noting postal areas of high and low services per capita. High–low service density is defined as voluntary sector organizations per 1000 low-income residents as measured by the low-income tax offset. Similar to the poverty operationalization, a relative measure was used to assess service density. Location quotients were calculated for each postal area relative to the service density of the entire metropolitan area. Service density location quotients greater than 1.0 were considered ‘high’, 1.0 or less considered ‘low’. From there, we a priori typologized the supply and demand according to four different scenarios:
high poverty, low services (the aim of the paper is to find such gaps and existing place-based infrastructure deficits) high poverty, high services (appropriate level of services in poor postal areas) low poverty, high services (marooned service hub in prosperous postal areas) low poverty, low services (appropriate level of services in prosperous postal areas).
In the ensuing analysis, we examine dynamic poverty changes across the 25-year study period and static service density using spatial and statistical analysis.
Sydney case study: Results and analysis
For poverty trajectories from 1991 to 2016, certain trends are immediately apparent in Figure 2. First, the postal areas of high poverty (in black) are clustered in the western suburbs, while the isolated areas of high poverty in Inner Sydney have disappeared during this same 25-year period – effectively becoming ‘recent prosperity’ postal areas. This suggests the deconcentration of poverty at the metropolitan scale (DeVerteuil, 2015) and its displacement towards inner and outer suburbs, as well as the (unmeasured) potential that poor households are emerging in situ in the suburban areas, or moving directly there from beyond Sydney as immigrants or in-migrants. Northern and eastern postal areas remain largely in the ‘continued prosperity’ category, suggesting a consolidated arc of wealth (defined in this instance as a lack of poverty) along the coast and north-eastwards.
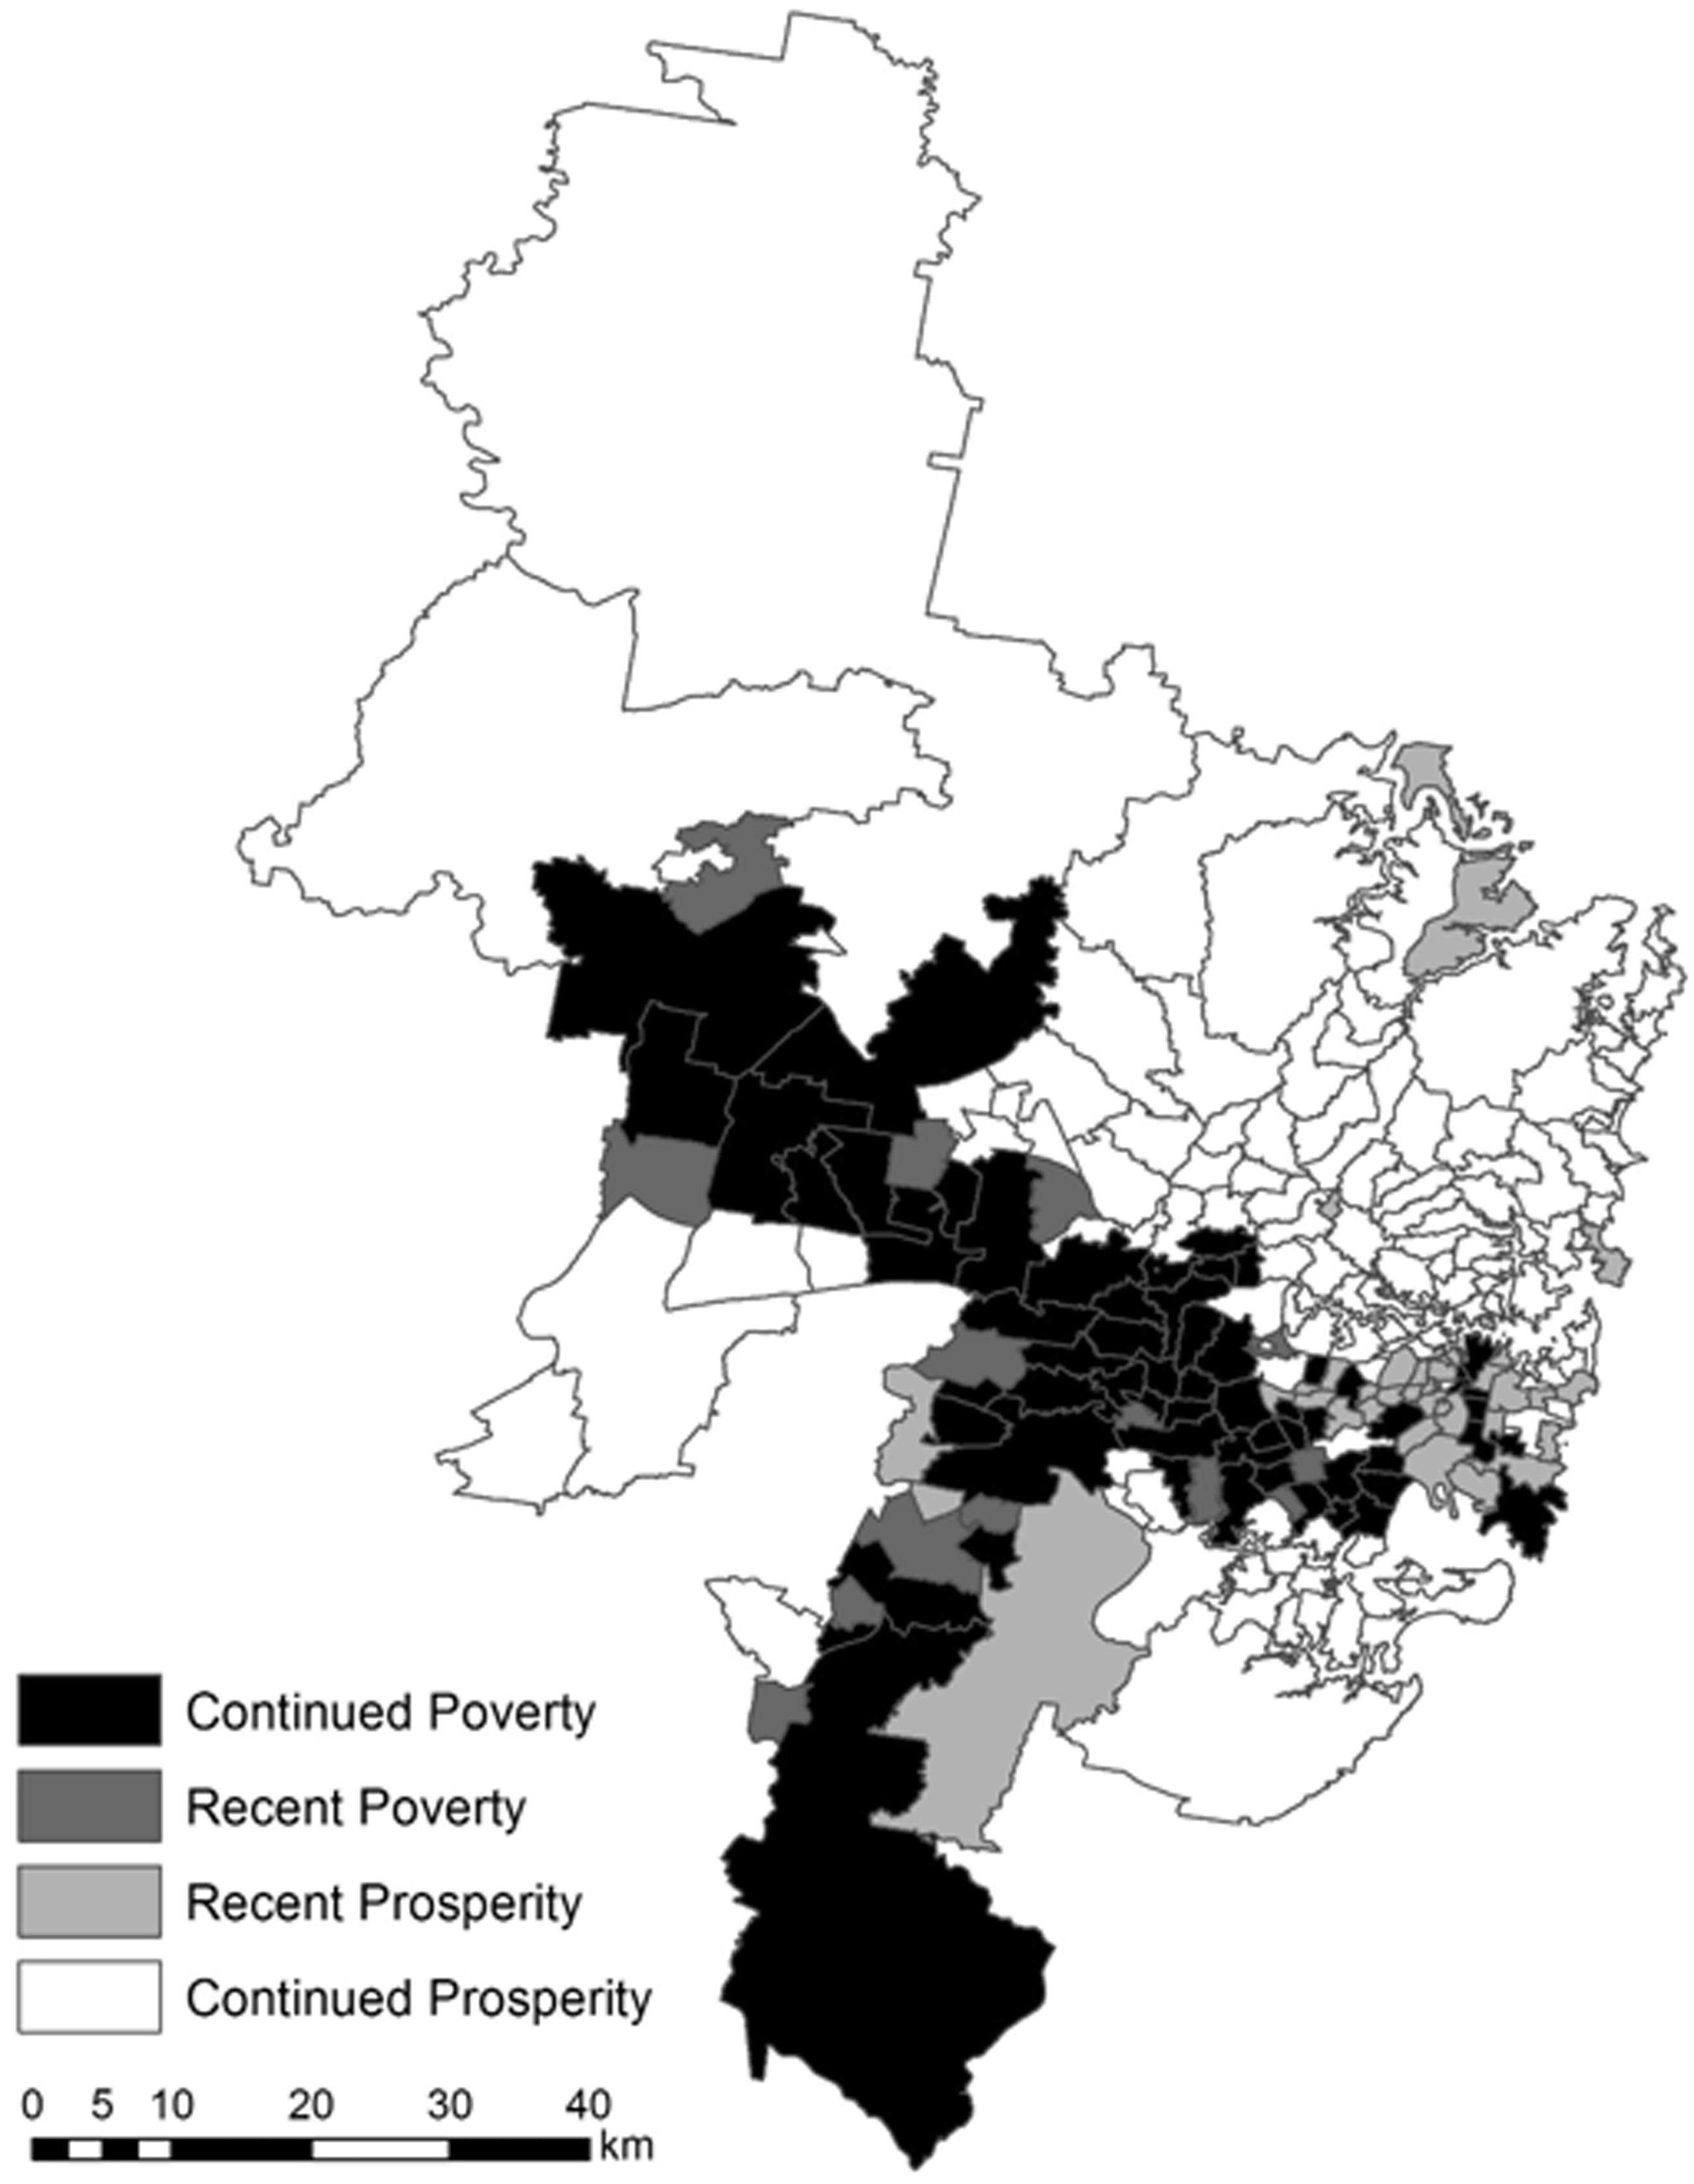
Map of poverty–prosperitya neighbourhoodb trajectoriesc in Metropolitan Sydney, Australia, 1991–2016 by postal area.
Figure 2 clearly shows not only the western suburbanization of poverty and its spatial consolidation, but also an emerging eastern/northern consolidation of prosperity. Returning to the typology of 1991–2016 poverty, we can say that there has been an increase in poverty in the western suburbs and an increase in prosperity in central areas of Sydney, especially the inner core of Sydney. But how do these overall trends play out when set against the 2016 service geography of Sydney? Figure 3 gives an initial indication of the key pattern – low services in the west and south, and high services in the inner core.
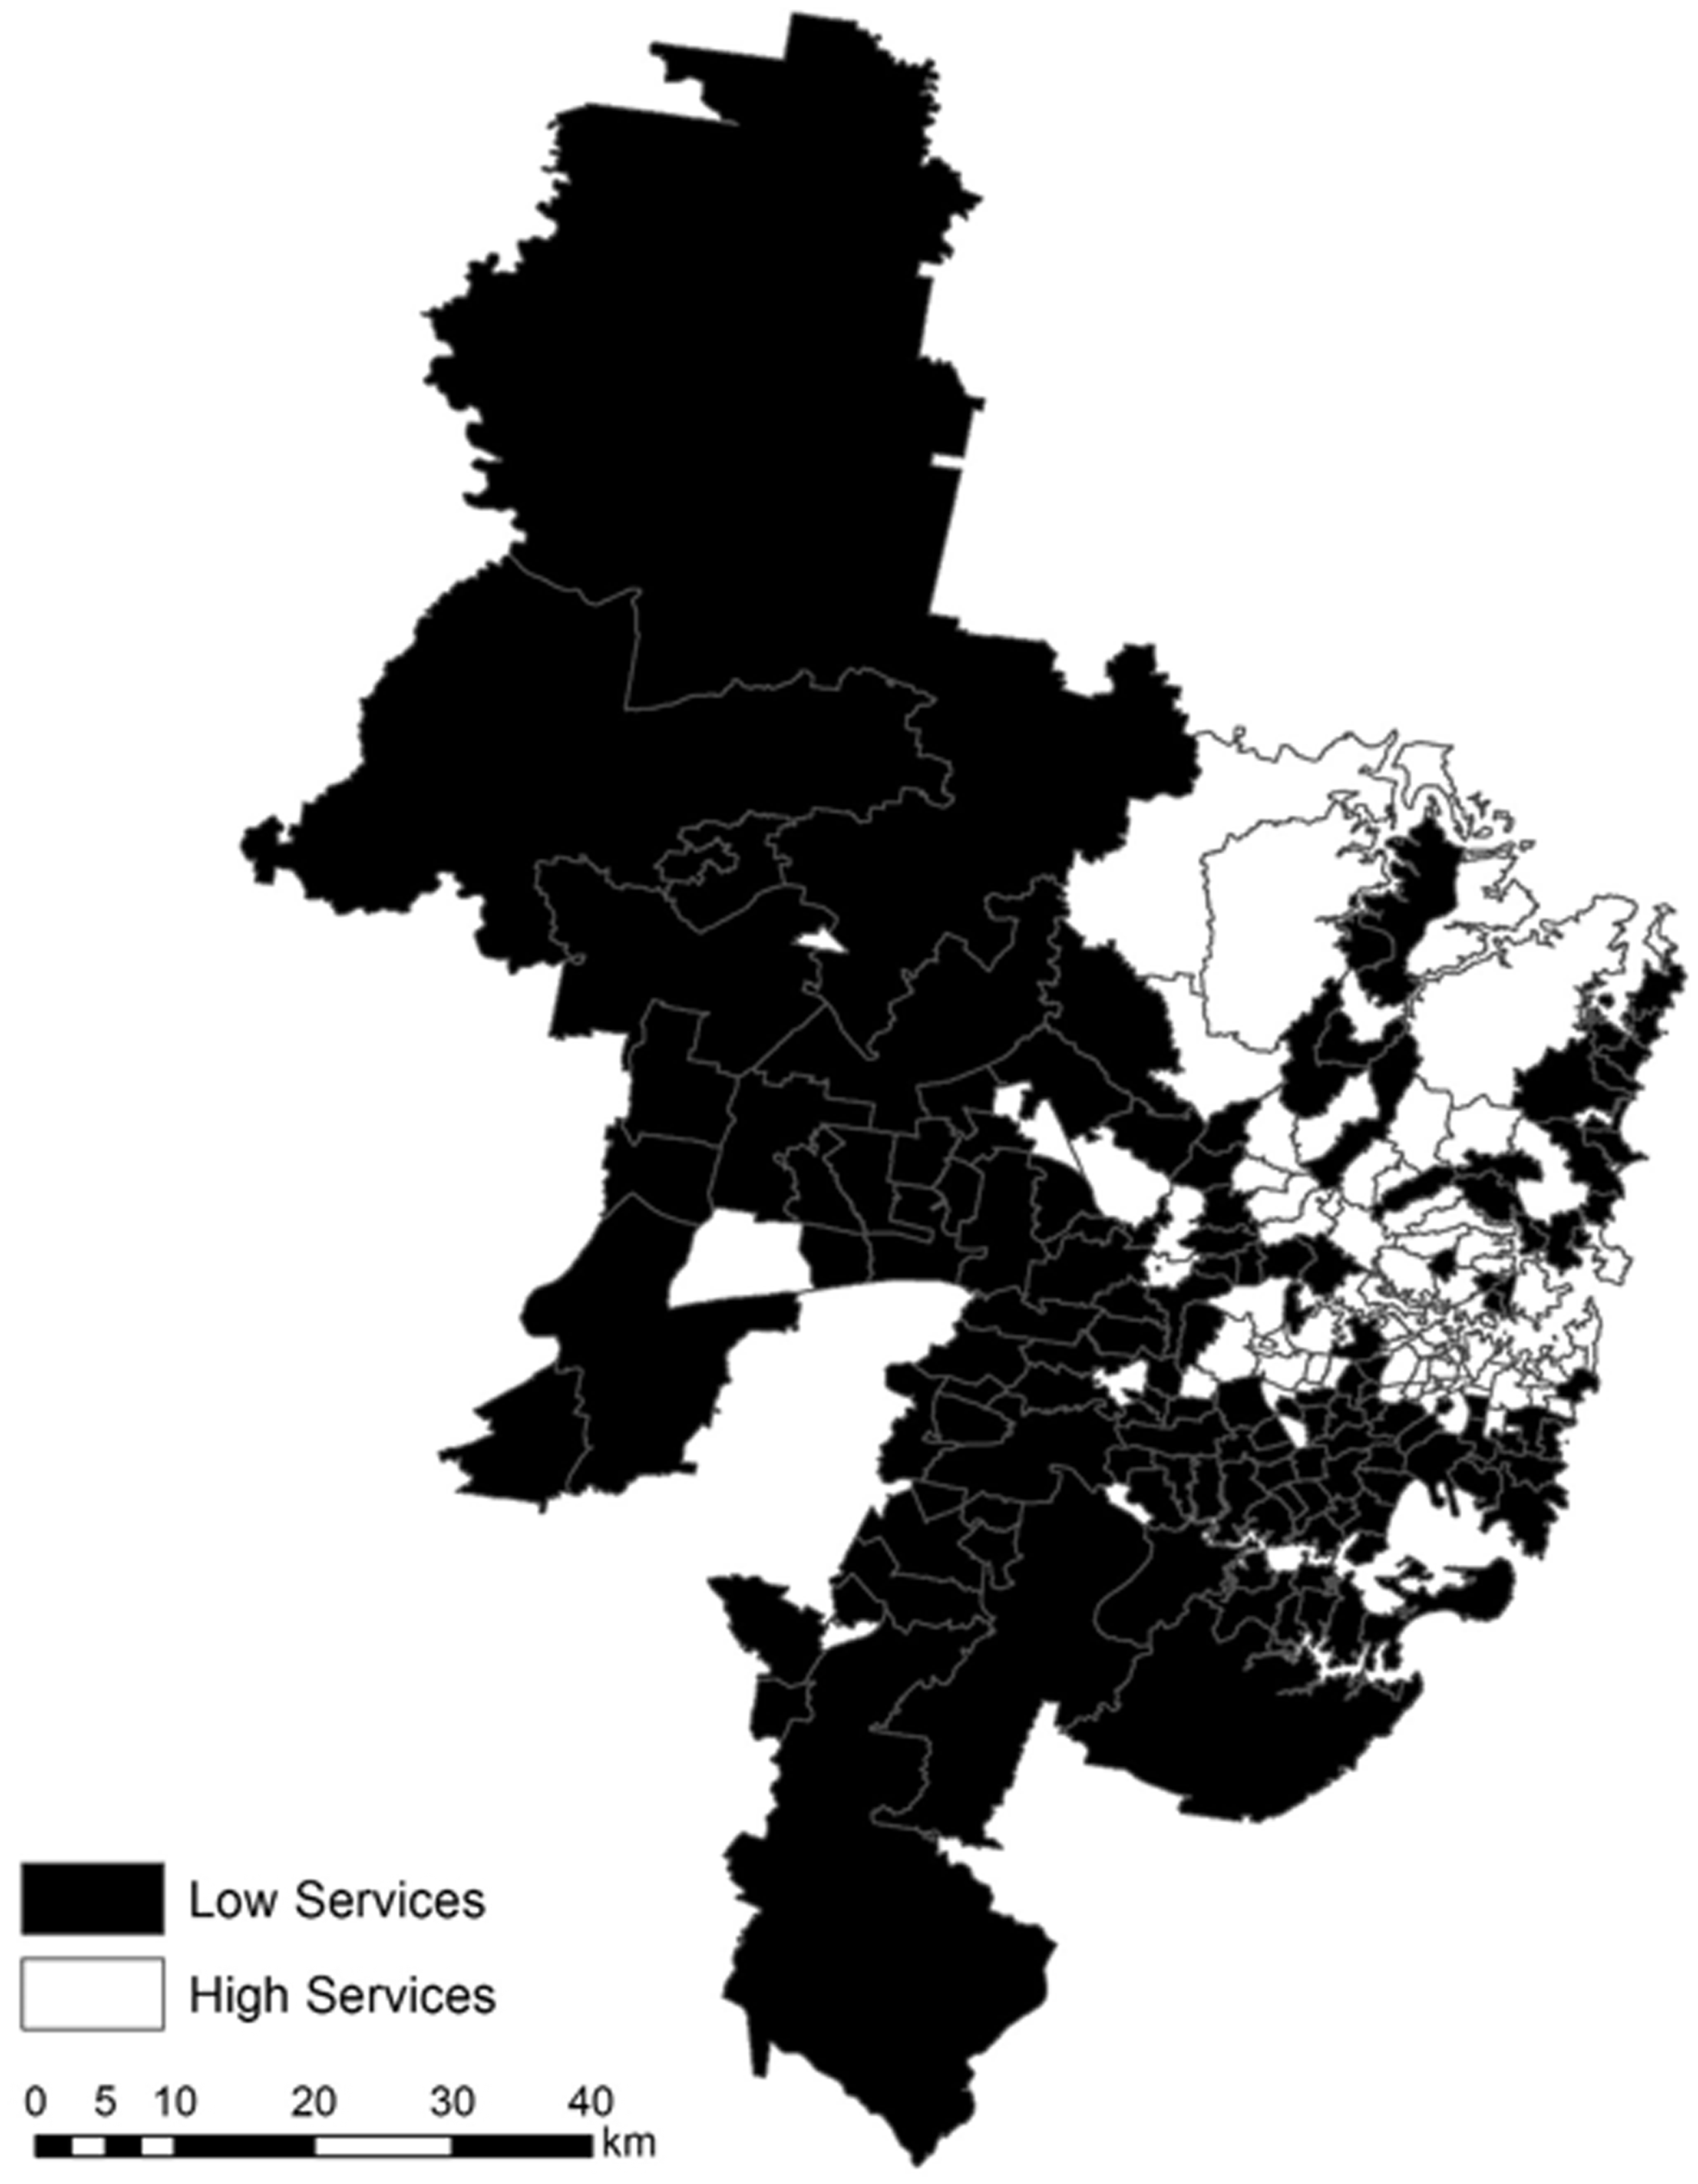
Geography of neighbourhooda servicesb in Metropolitan Sydney, Australia in 2016 by postal area.
Table 1 introduces the trajectory of poverty/prosperity from 1991 to 2016 when mapped onto the service landscape of Sydney. A chi-square test is used to assess the relationship between service level and poverty level in the 217 postal areas, and a Kruskal–Wallis test is used to examine differences in median service density in the different neighbourhood types (continued poverty, recent poverty, recent prosperity, continued prosperity).
Neighbourhood type and service provision by postal area.
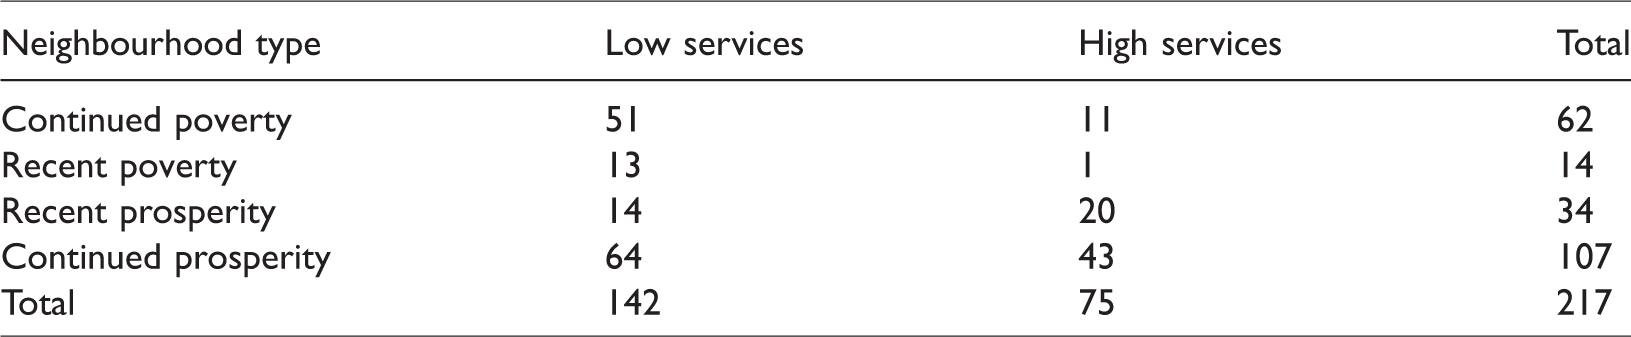
Chi-square results (χ2(3) = 22.76, p < 0.001) indicate a statistically significant association between neighbourhood change and services. Table 1 suggests that the Metropolitan Sydney area has a disproportionately high number of continued and recent prosperity neighbourhoods with high services (63 of 75 high-service postal areas are prosperous), and a disproportionately high number of continued and recent poverty neighbourhoods with low services (64 of 76 poverty postal areas are low-service). This suggests a lag in the service landscape, which is reinforced by Table 2. Table 2 shows that areas of continued and recent poverty continue to suffer from median service densities that are lower than those in recent and continued prosperity postal areas. This was true when measuring median service density both per 1000 residents and per 1000 low-income residents.
Neighbourhood type by median service density by postal area.

A Kruskal–Wallis test was conducted to examine differences in median service density in the different neighbourhood types. We found a statistically significant difference (H (3) = 19.55, p < 0.001) between all the average service densities. Following the results from the chi-square test, the findings also indicate a clear demarcation between the services available in poverty versus prosperity neighbourhoods. Not only were there fewer services available per capita in continued poverty neighbourhoods, there were significantly fewer services available per 1000 low-income residents. Continued and recent poverty neighbourhoods had on average just over five voluntary sector organizations per 1000 low-income residents, whereas the recent and continued prosperity neighbourhoods average over nine and seven, respectively. The median service density was lowest in continued poverty neighbourhoods and highest in recent prosperity neighbourhoods. Interestingly, recent prosperity postal areas – perhaps a proxy for gentrified areas – had the greatest median service density of all, followed by continued prosperity, which we would assume has many of the well-established (but now marooned) service hubs in Sydney that emerged when poverty itself was more centralized and more clearly overlapped with a centralized service geography.
Returning to the fourfold typology proposed in the previous section, we can see an existing and pronounced infrastructure deficit for continued poverty postal areas and recent poverty postal areas. Overall, only 12 of 76 poor postal areas in 2016 had sufficient services for demand (‘high poverty, high services’), as measured by 1000 low-income residents. Conversely, 63 of the 88 prosperous postal areas had high services, suggesting that these neighbourhoods contained (and have retained) an important number of voluntary sector organizations for vulnerable people in Sydney, despite the fact these same neighbourhoods were losing poor people, or at least not gaining them, since 1991. We deem these 63 postal areas as perhaps having appropriate levels of services, probably even too high.
Returning to Figure 1, evidence pointed to a persistent gap in both the inner and outer suburbs of Sydney. For inner suburban Sydney, poverty is very much linked to international immigration, while for outer suburban Sydney, poverty is more linked to Australian-born populations that have become economically and socially isolated over time (Jesuit Social Services and Catholic Social Services Australia, 2015). This consolidated suburban poverty between 1991 and 2016 has not been accompanied by an adequate supply of services, however. Rather, there has been a marooning of services in parts of Sydney that no longer necessarily need them. While the paper does not dwell on the processes behind these dynamics, there are some obvious culprits. We can speculate that many suburbs are unwilling to evolve into something more urban when it comes to serving vulnerable populations, or lack the built-up legacies and resources that many inner-city areas have. Further, there is a lack of direct governmental intervention, perhaps given a fear of becoming poverty magnets from other parts (see also Deener, 2012; Wolch and Dear, 1993). So while the need for retrofitting is obvious, the barriers are immense, ranging from NIMBYs to the lack of density, diversity, and an amenable built environment (Phelps and Wood, 2011).
In large part, the ‘big picture’ interviews reinforced but also nuanced these points. The Mission Australia executive director explained that the suburban service gap is long in the making, and that despite the use of ‘Local Connection’ rules (NSW Government, 2014) that attempt to anchor (homeless) clients to the places they are from, drifting to the service-rich inner city continues apace. This is set within a context in which certain western Sydney outer suburbs are increasingly poor and isolated, as well as under-served with unmet needs, especially supportive housing Australian Government (2018). In her words, the ‘service footprint is lacking’ in these places; they were never built to accommodate large numbers of very poor people. The executive director of Islamic Relief was more focused on the ‘inner suburbs’, such as Auburn in the Cumberland LGA (see Figure 1), with its large immigrant populations that seek very specific services with cultural, linguistic and religious competencies (see also DeVerteuil (2011) on the ‘immigrant-serving non-profit sector’). In effect, these populations are unlikely to drift into the inner city, in that the services do not cater to them – nor have they been directly displaced out of the inner city, in that most immigrants now move directly to Sydney (inner) suburbs. As such, the provision of culturally appropriate services becomes crucial. However, the executive director underlined the relative lack of services for the amount of (increasing) demand, suggesting certain inner suburbs suffer from the anti-poverty infrastructure gap. The two board members from the Western Sydney Community Forum underlined how the broader lack of employment, education and transportation infrastructure in outer western suburbs served to trap poor residents, compounded by an inadequate and fragmented service geography. To one of the board members, the lack of travel options means that ‘local can be still inaccessible due to the nature of transport disadvantage long affecting many communities having to rely on a car or highly irregular bus services if they are lucky’. Neither saw migration of populations in poverty from eastern to western Sydney as an issue – rather, the poverty in the inner western suburbs of Sydney was increasingly due to immigrant groups moving directly there.
Discussion and conclusions
This paper has contributed to bringing suburbs into conversation with the uneven geographies of anti-poverty infrastructure via the voluntary sector, and measuring the extent of the deficit at the metropolitan scale, which was found to be considerable. In this respect, the stereotype of suburban spatial mismatches was certainly borne out in the case of Sydney. This situation compromises accessibility to the voluntary sector at a time of greater need, and suggests that both inner and outer suburbs are facing major challenges in terms of place-based anti-poverty infrastructure, albeit for different poverty populations. For inner suburbs, it is more immigrant-based, while for the outer ones, it is an increasingly isolated and homegrown poverty population. Suburbs are becoming frontier spaces for both poverty and voluntary sector geographies, but are also volatile spaces: the 2011 London unrest (Harvey, 2012) and 2005 Paris unrest (Dikec, 2007) both showed how under-served suburbs can imperil the ability to cope with poverty and social exclusion.
The results also contribute to our understandings of ‘post-suburbia’, particularly the limits to the potential that suburbs are becoming more urban. The persistent anti-poverty infrastructure gap speaks to an important lag, of how inertia and other constraints contribute to these ‘charity deserts’ in poor and impoverishing suburbs. Put differently, some of the poor are being consigned to the periphery of Sydney or emerging in situ, but accompanying services have not kept pace, producing a spatial lag. This counters the idea of spatial ‘flattening’, to use De Jong’s (2014) term, between the urban and the suburban – while many suburbs are indeed converging in terms of poverty, decline, density and diversity, our results around Sydney’s service geography suggest significant temporal lags and spatial limits to the process of ‘urbanizing suburbs’, and connect to the sense that collective consumption and social infrastructure remain deficient. The results also confirm the importance of the place-based nature of addressing poverty, moving beyond individuals to actual bricks-and-mortar services, uneven as they were across the Metropolitan Sydney area.
Returning to the idea of post-suburbia, in-between cities and suburban governance, and splintering urbanism, the results did not confirm that suburbs had gained a more established urban vocation and function with regards to anti-poverty infrastructure. However, certain Sydney suburbs could be conceived as in-between cities, neither new nor old but something in between in terms of poverty and density, particularly the inner suburbs that cater to immigrants. And while there were some suburban services, there was limited evidence to suggest that the voluntary sector, like many other urban resources, had decisively splintered across Metropolitan Sydney. Rather, the voluntary sector is resiliently tied to the inner city (DeVerteuil, 2015; DeVerteuil et al., 2019b), building upon longstanding legacies that are not so easy to unmake or rebalance. Both the inner and outer suburbs of Sydney suffer similar deficits but have different populations in need. This implicates the larger issue of how infrastructure is provided across metropolitan regions, and with what impacts. According to Rodgers and O’Neill (2012: 402), ‘infrastructure is a key factor shaping people’s direct relationships both with each other and with their environment in cities; it demarcates both literally and figuratively which points in urban contexts can and should be connected, and which should not’. As such, infrastructure emerges as ‘embedded instruments of power, dominance and (attempted) social control’ (Graham and Marvin, 2001: 1).
There is much need for future research, beginning with more comparative studies in other cities using a similar approach, in places where the city–suburban divide is especially intense, such as Paris and London, but also American examples such as San Francisco and New York as well as beyond the Global North entirely (e.g. Golubchikov and Phelps, 2011). But even within Metropolitan Sydney, a more in-depth study ought to be conducted that circumvents some of the empirical limitations of this study, especially the need to weigh voluntary sector organizations by clients served, or budget, or employees – or a combination of all three – that is nonetheless challenging given almost 10,000 organizations in the current database. Moreover, all voluntary sector organizations were sampled, rather than those expressly focused on the most vulnerable populations, including the homeless, mentally ill and substance abusers. More qualitatively, there is a need to see how clients and service providers experience the infrastructural gap, including those displaced from Inner Sydney, but also immigrants in situ. This latter population leads to the sense that ‘ethnic infrastructure’ as Phelps et al. (2017) called it, could constitute a crucial emerging social infrastructure in inner suburbs, filling the gaps from the (uneven) mainstream voluntary sector and an increasingly absent welfare state (see also DeVerteuil, 2011). Following Joassart-Marcelli et al. (2004) and Allard (2017), a more comprehensive mapping of anti-poverty infrastructure could be undertaken that would include direct local government anti-poverty spending and state and federal government subsidies, rather than solely place-based infrastructure. Finally, studying less prosperous cities where suburbanization is more strongly associated with class exclusion – such as Detroit – would help fill some of the gaps in terms of less dynamic urban centres, as well as suggest the role of self-provisioning and DIY services (Kinder, 2016).
Footnotes
Acknowledgements
We wish to acknowledge funding from the Cardiff University School of Geography and Planning Urban Challenges Initiative seed funding, as well as the time given to us by the interviewees in Sydney.
Declaration of conflicting interests
The author(s) declared no potential conflicts of interest with respect to the research, authorship and/or publication of this article.
Funding
The author(s) received financial support for the research, authorship and/or publication of this article: Cardiff University School of Geography and Planning Urban Challenges Initiative seed funding.
