



Abstract
The flows of international students are like the currents of the oceans, not only affecting the individuals adrift in them but the global circulation of policy, economics and academics as a whole, bearing pros and cons for each country or region along the way. To date, there has not been a detailed and elaborate description of the fluxes of international students over decades. In light of the research gap, the article utilises the chord diagram to draw threads between each pair of origin and destination of international students in the last 20 years and divides the periods into four main phases. With each phase exhibiting its specific features, we have tentatively concluded that the global student mobility structure has evolved from Arterial (1999–2003), Breakthrough (2004–2008) to Catch-Up (2009–2013), and lastly, Diversification (2014–2018). Corresponding reasons underpinning each change of the migration flows are also discussed briefly in the article.
As the globalisation process deepens, international students’ size in the contemporary world has grown considerably from 2.0 to 5.6 million between 1999 and 2018, according to the United Nations Educational, Scientific and Cultural Organization (UNESCO, 2021). The understanding of the patterns and determinants of International Student Mobility (ISM) is considered significant for policy-making, academics and entrepreneurial operations around the world (Yang, 2020), especially being pivotal in enhancing developed nations’ brain gain and reversing developing countries’ brain drain (Siekierski et al., 2018). While the social network analysis results by Hou and Du (2020) and others generally show clustering and regionalisation within the ISM structures, most of them only involve cross-sectional versus longitudinal analysis. As such, country- and period-specific investigations into the ebbs and flows of ISM are genuinely needed (Figure 1).
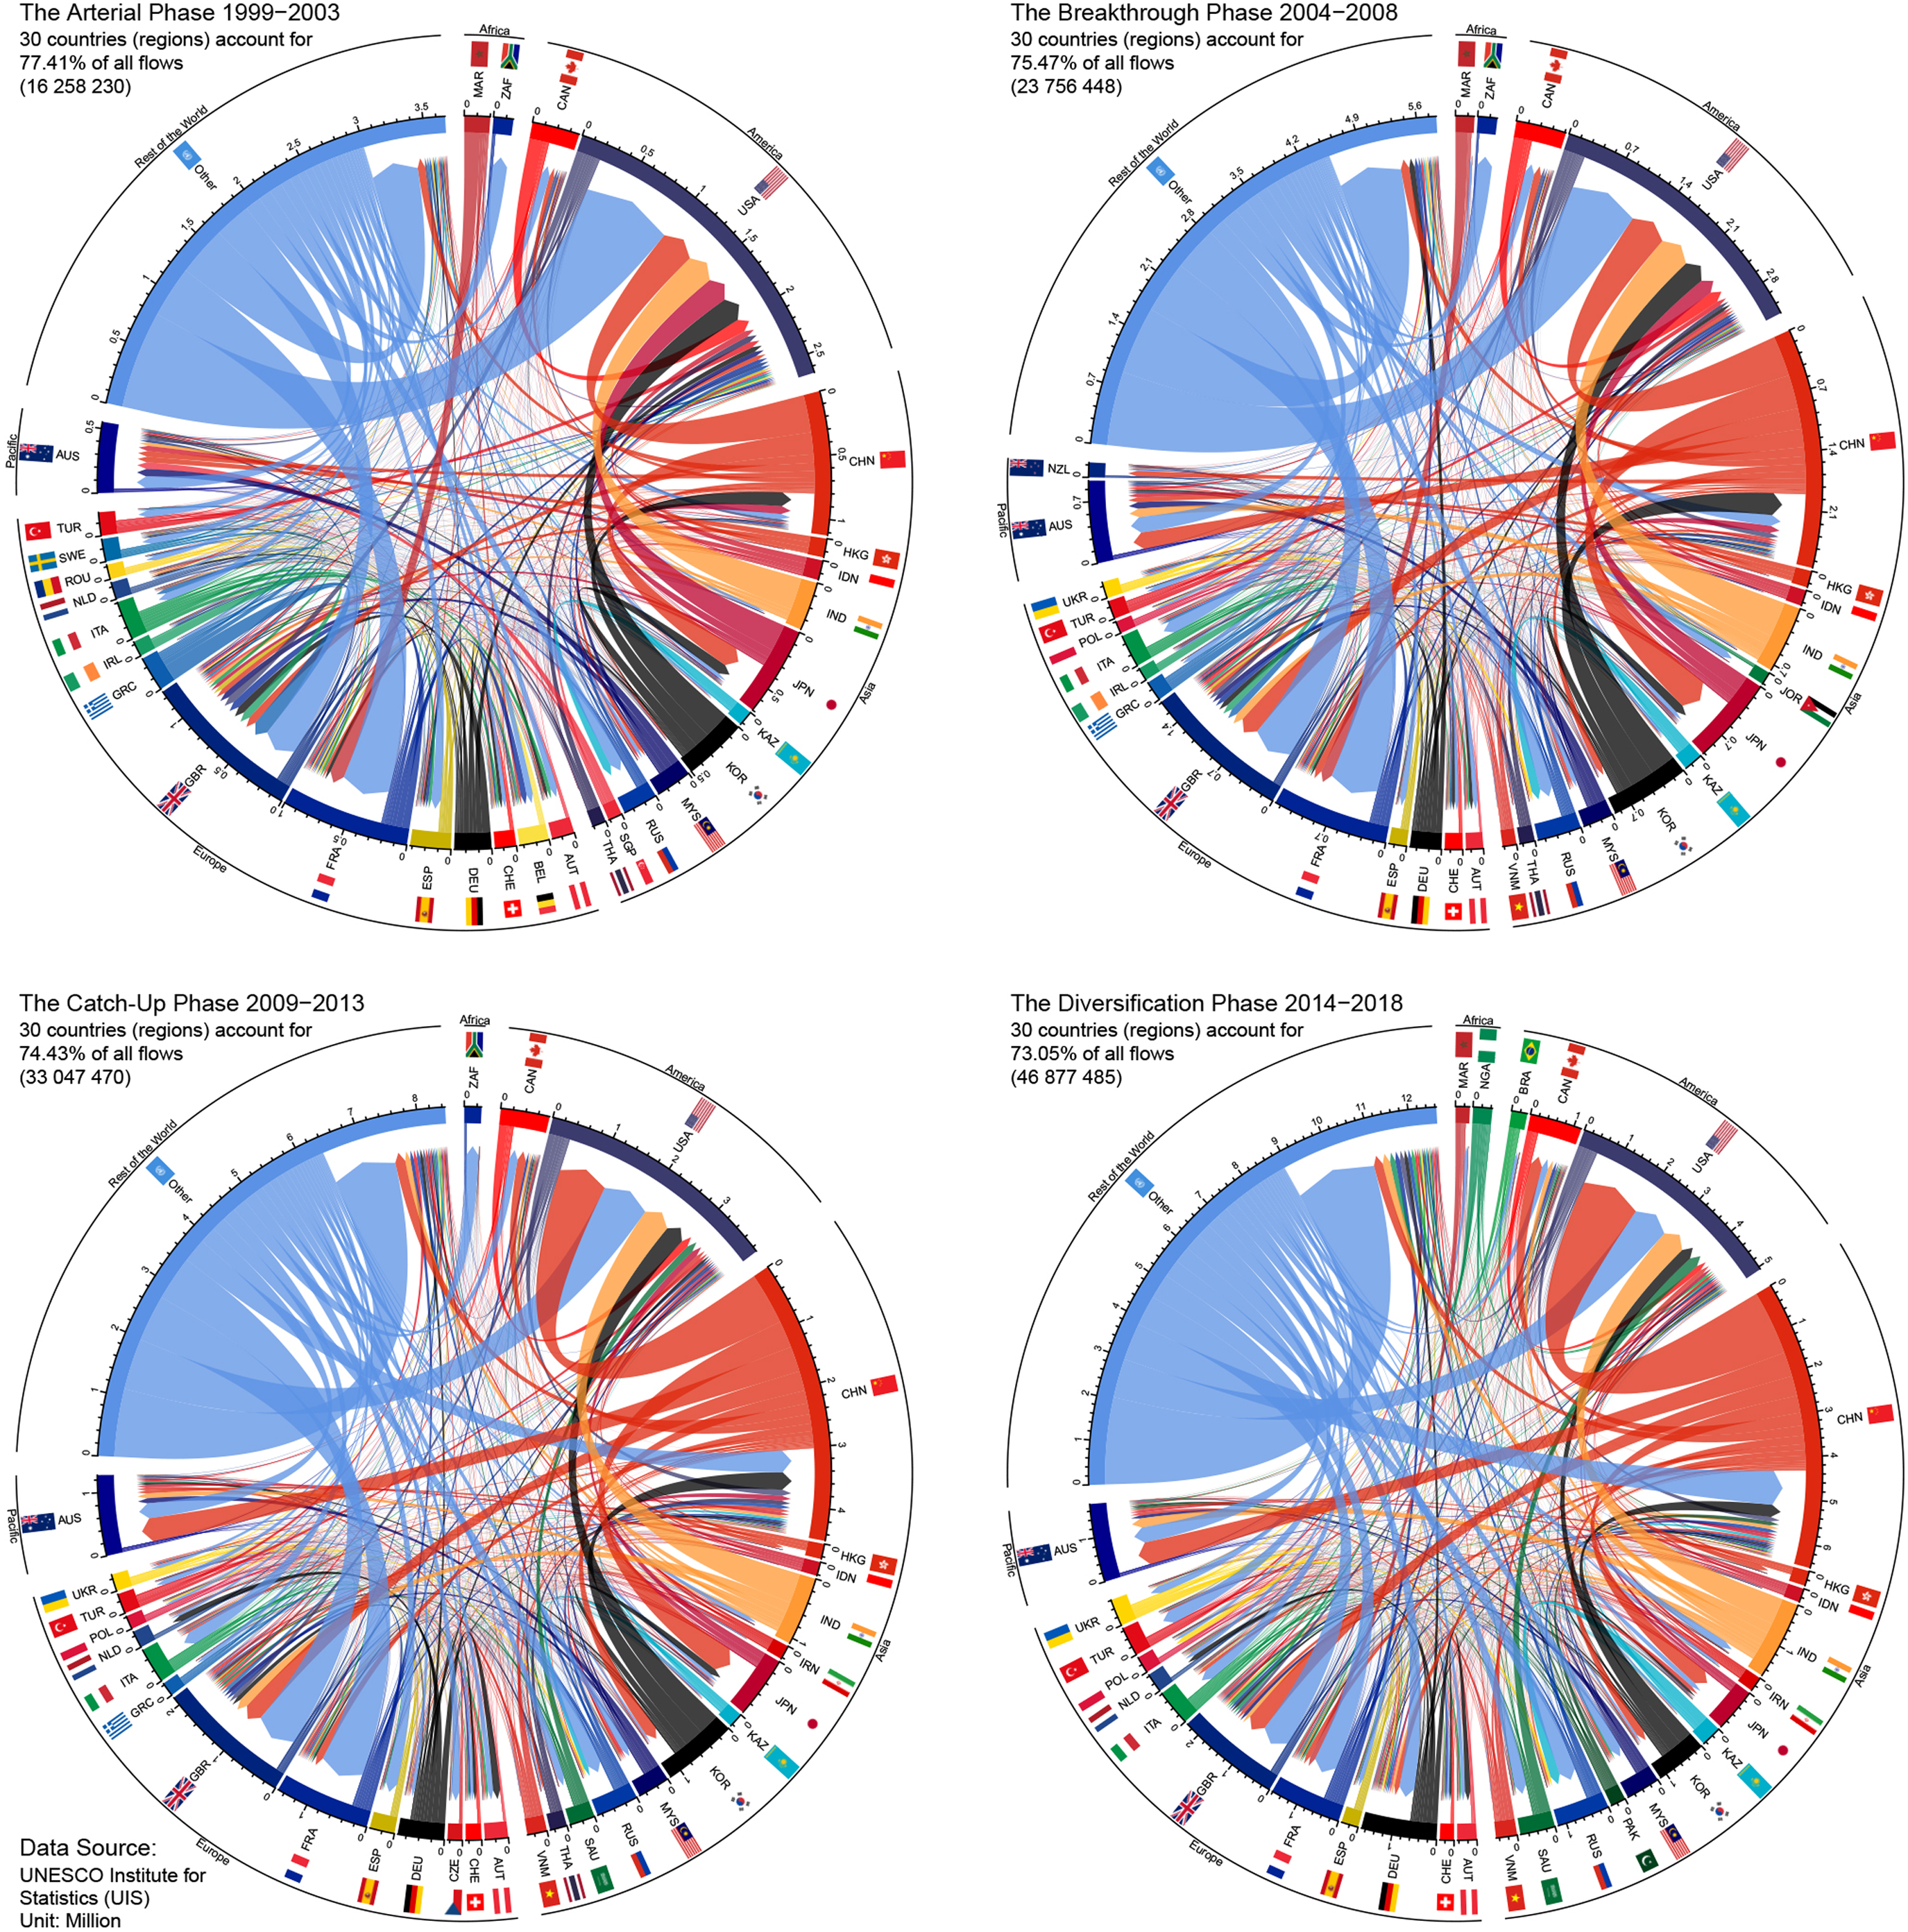
International student migration flows between 1999 and 2018.
The chord diagram helps to facilitate comparisons of migration flows amongst different areas and during a serial of periods, providing the size and direction of each unit's flow (Abel and Cohen, 2019; Abel and Sander, 2014; Qi et al., 2017). Applying the updated migest package in R (Abel, 2021), we arrange the 20-year ISM flows into four diagrams by a five-year interval with the top 30 regions and propose a seminal framework by attributing conclusive names to each phase based on their spatiotemporal characteristics, i.e., phase A (the Arterial), phase B (the Breakthrough), phase C (the Catch-Up), and phase D (the Diversification).
In phase A (1999–2003), almost all ISM flows terminated at the US, UK, France, Australia and Canada (62.69%), as if they were the main “arteries” of the body, with other European countries like Spain, Belgium, Austria, Switzerland and Italy acting as smaller “branches” (9.96%). Although the total European ISM flows outnumbered Asia in phase A (35.86% >30.07%), the relationship (30.05% <38.41%) had reversed in phase B (2004–2008) when a breakthrough was seen in the ISM outflows from Asian countries, with China (16.05%), Korea (6.65%) and India (6.20%) emerging as primary senders of international students. A more dramatic change happened in phase C (2009–2013), as China's share of total flows (13.62%) caught up with the US (11.76%) for the first time, while the ISM proportions of developed countries had shrunk, arguably because of the impacts of the financial crisis (Macrander, 2017). Also, the share of the rest of the world had been following up gradually from 22.59% to 26.95%. Finally, the Diversification phase (D) was a milestone characterising the trend of globalisation and multilateralisation. The US (19.61%) and the UK (9.17%) served as benchmark destinations for the whole world, while China (9.38%) mainly attracted Asian countries like Korea, Thailand and Pakistan. The proportions of Germany and Russia strengthened, and new contributors like Brazil appeared, offering a more comprehensive range of choices for international students.
Altogether from a 20-year perspective, the ISM flow structure, although condensed, as usual, has become less centralised with its Gini coefficient dropping from 0.793 to 0.775 and the share of Top 30 decreasing consecutively due to emerging participants. The US still holds the largest net migration (4.13 M), but the attraction has begun to diffuse and may involve more factors like the increasingly intense international competition and capricious pandemic, lining the path for a more challenging future.
Software
Adobe Photoshop 2021; R/Python Language; MS Excel 2019.
Footnotes
Declaration of conflicting interests
The author(s) declared no potential conflicts of interest with respect to the research, authorship, and/or publication of this article.
Funding
The author(s) disclosed receipt of the following financial support for the research, authorship, and/or publication of this article: This work was supported by the the Major Program of the National Social Science Foundation of China (grant number 17ZDA055).
