



Abstract
In the context of the developed economies, recent political economy scholarship has highlighted the growing role of intangible assets (brand equity, software, business processes, patents etc.) in corporate portfolios. Much of this literature has emphasized how intangible assets erect barriers to entry, produce artificial scarcity of key inputs, enhance the pricing power of firms and thus lead to greater and greater levels of concentration. Being as they are monopoly rights and privileges, intangible assets represent the relational power of their owner vis-à-vis those excluded from their ownership. While much of this literature has focused on the developed world, this paper turns its gaze to the case of a developing country and analyzes the patterns and trends of intangible assets for a sample of Indian firms for the period 2000–2022. The analysis reveals a substantial acceleration in the weight of net intangible assets relative to net physical assets, especially after 2008. It also suggests that the largest and most powerful corporations are the ones that have contributed to this spike. Ranked by assets, sales and ownership category, the results show that intangible asset accumulation has been the strongest in the highest echelons of the corporate hierarchy. Moreover, the patterns of intangible asset accumulation have been such that they have not been restricted to the traditional “rentier” sectors in the sense that their presence in the “productive” sectors has been as important if not more so. By focusing on firm-level patterns of intangible asset accumulation, the results show the internal and necessary connections between accumulation and value capture that undergirds modern day capitalism in the Southern peripheries.
Introduction
Recent literature in the context of the developed economies, has highlighted the growing role of rentierism, defined as “a broad-based shift toward economic activities conducted by “rentiers” . . .structured around the control of, and generation of income (“rents”) from, scarce assets” (Christophers, 2023: 2; Birch, 2020; Birch and Ward, 2023; Hudson, 2015; Mazzucato, 2018; Sayer, 2015; Standing, 2016). Such assets include financial ones, but increasingly, rentierization “has entailed the disproportionate growth of rents derived from assets extending far beyond finance. . .” (Christophers, 2023: 2). Of particular importance in this regard has been the phenomenal rise of intangible assets like patents, copyrights, brand equity etc. in corporate portfolios, which have enabled their owners to “exert direct and/or indirect control over the wider division of labor” and “capture value produced elsewhere within the circuit of capital” (Baglioni et al., 2023: 2; Orhangazi, 2019).
It is in this context that this paper investigates the patterns of intangible asset accumulation using firm-level data from India for the period 2000–2022. Intangible assets have only garnered attention recently, so much so that even in the US, national accounts only incorporated information regarding intangibles assets in the 1990s (Haskel and Westlake, 2018). But recent estimates suggest that intangible assets have started to eclipse investments in tangible assets in leading European and North American economies. “In 2020, the NFC [non-financial corporation] investment in IPPs [intellectual property products] represented almost 40% of their non-residential gross fixed investment, that is, the same percentage as investment in equipment” (Liagouras, 2023: 13). In some sectors, such as the pharmaceutical industry in the US, intangible assets as a proportion of total productive assets (cash plus net physical assets) increased by 265% between 2002 and 2014 (Baranes, 2017). Although there is no widely acceptable definition, in general intangible assets refer to “identifiable non-monetary assets without physical substance which may provide benefits in the form of increased revenues, reduced costs or other benefits” (Serfati, 2008: 36). As noted by Corrado et al. (2006), they may be categorized as computerized information (such as software), property rights involving ideas and knowledge (such as patents) or other organizational/economic abilities (such as brand equity). Intangible assets erect barriers to entry, produce artificial scarcity of key inputs, and enhance the pricing power of firms through branding. In all these moments, intangible investments contribute to firm rents thereby enhancing surplus without the need for investments in tangible, productive capacity (Crouzet and Eberly, 2018; Orhangazi, 2019). Being as they are monopoly rights and privileges, they represent the relational power of their owner vis-à-vis those excluded from their ownership. Thus monopoly power is inscribed into intangible assets (Baglioni et al., 2023). Not surprisingly, intangible accumulation has been associated with industrial concentration (Crouzet and Eberly, 2019). In the context of Global Value Chains (GVCs) studies have shown that lead firms’ access to intangible assets has become a key channel through which they are able to marginalize smaller firms and capture value generated by them elsewhere in the production chains (Durand and Milberg, 2020; Quentin, 2022; Starosta, 2010; Tups and Dannenberg, 2023). Along similar lines, studies have investigated the role played by intangibles- like patents- in cementing the position of intellectual monopolies like Amazon, Apple, Facebook, Google, and Microsoft in digital markets (Rikap, 2022, 2023; Rikap and Lundvall, 2022).
Given this broad background, the main aim of this paper is to empirically assess firm-level patterns of intangible asset accumulation for the Indian economy in the 21st century. The emerging scholarship in India has highlighted the intricate connections between capital accumulation and value capture in a variety of contexts. With the slowdown of investment rates and the setting-in of deindustrialization after 2010, influential liberal voices have flagged, with great alarm, the transformation of the “good” capitalism of the 1990s to the “bad” capitalism of the 21st century marked by a proliferation of patronage-chains tying business elites with politicians (Crabtree, 2018; Economic Survey, 2020; Subramanian, 2018; Subramanian and Felman, 2022; Walton and Gandhi, 2012). Beyond the liberal world, several Marxists have highlighted the deepening reliance of accumulation on expropriation of peasantry and petty producers (Levien, 2011, 2018; Walker, 2008). A common theme underlying this body of work is the identification of value appropriation with the deployment of institutional power of the state. Thus for Kar and Sen (2016) “source of the rents can usually be traced to discretionary government policies or action” just as for Levien (2011: 964), accumulation by dispossession, “is above all a political process whereby states (or other bearers of coercion) exercise extra-economic power to transfer to capitalists means of production, subsistence or common social wealth that are difficult or impossible to obtain on the market.” Left out from these descriptions are a range of extractive processes that do not necessarily rely on the direct institutional intervention of the state and yet constitute important channels through which power is exercised and values are redistributed (Birch and Muniesa, 2020; Graz, 2019; Harvey, 2006). From franchises and branding, to the informational asymmetries derived from digitized supply chain management, there are numerous examples of how actors can “exercise authority over a defined domain and population without the plain attributes of power imparted by sovereign rights” (Graz, 2019: 29). The role of intangible assets in this context has drawn the attention of political economy scholarship in recent years, but by and large the focus of these studies has been the Western world (Ganguly and Vasudevan, 2023). Few, if any, have looked at the case of India, which is surprising given the country’s economic weight in the global economy and its membership into an elite club of 20th century “growth accelerators” (Hausmann et al., 2005; Nagaraj, 2023). An analysis such as the one this paper intends to undertake can therefore provide important insights regarding the patterns of intangible asset accumulation for an important non-Western country.
This paper draw on the Center for Monitoring Indian Economy’s (CMIE) Prowess database to study the firm-level evolution of intangible assets. The results indicate that the weight of intangible assets in corporate portfolios has risen steadily during the period, with a marked rise after the Global Financial Crisis of 2008. Striking still is the finding that the share of intangible assets of the largest firms has been steadily increasing, suggesting that it is the large firms that have been the ones that have contributed the most to the sharp acceleration in intangible asset accumulation. Finally, the results also show that the growth of intangible assets have not been confined to firms in “rent-thick” sector alone and that the phenomenon has been far more pervasive, extending across the “productive” sectors as well.
Intangibles and value capture
According to the International Financial Reporting Standards (IFRS) intangible assets refer to “identifiable non-monetary assets without physical substance.” Similarly, Haskel and Westlake (2018: 22) define intangible assets as those assets which share the common characteristic “that they are not physical.” In all these instances intangibles are defined in terms of “what they are not, namely tangible” (Kristandl and Bontis, 2007: 1512). The valuation of intangible assets has therefore typically taken the form of a residual: between market value and book value of firms or in the form of the residual of returns to tangible inputs and total value added (Chen et al., 2021; Sahay and Pillai, 2009). 1 However as has been widely recognized in the management literature, in addition to their identity as non-tangibles they also share specific “characteristics and attributes. . .that lead them to become strategically important” to firms (Wade and Hulland, 2004: 115; Itami and Roehl, 1991). In order to succeed, firms must have “the ability to sense and then to seize new opportunities, and to reconfigure and protect knowledge assets, competencies, and complementary assets and technologies to achieve sustainable competitive advantage” (Teece, 1998: 72). Sustainable competitive advantage hinges on firms being able to cultivate strategic resources which are both valuable but also highly appropriable in the sense that they are “able to earn rents exceeding the cost of the resources” (Kristandl and Bontis, 2007: 1512). Intangible assets therefore refer to a subset of the firm’s resources which are highly appropriable, enabling it to sustain competitive advantage over the long run and thus inscribe its monopoly power over its rivals (Buckley et al., 2022; Wade and Hulland, 2004). To be appropriable, intangible assets must be inimitable as well (Buckley et al., 2022). Inimitability, in turn, is contingent on factors external to the firm such as on property right enforcement, the availability of appropriate storage technologies and so on (Crouzet et al., 2022a, 2022b). But inimitability can also be inherent to the asset, such as in cases where the asset is so deeply embedded within firm networks and firm-specific histories, that it becomes difficult for rivals to replicate it (Barney, 1991; Bharadwaj, 2000; Wade and Hulland, 2004).
Although the resource based view of intangible assets can be traced back to the 1980s and 1990s, one of the earliest economists to think through the intricate connections between power, accumulation and assetization was the noted American institutionalist thinker, Thorstein Veblen (Ahumada, 2023; Baranes, 2020; Hake, 2004; Nesvetailova and Palan, 2013; Nitzan and Bichler, 2009). To him, the role of rent-generating, intangible assets had to be understood in the context of the giant joint-stock firms that had begun to emerge in the late 19th century. What made these modern business enterprises truly different from the small-scale production units of the previous epochs was that they were not really “industrial” entities that optimized production and costs, but “pecuniary” ones whose raison d’ etre was the control of market conditions and the maximization of returns to shareholder (Veblen, 1904, 1921, 1923). What these entities accumulated was therefore not just tangible, physical capital but the ability to stratify, differentiate, appropriate and “hinder the full efficiency of a business rival” all of which was crystalized in the form of intangible assets which served “no materially productive work, but only a differential advantage to the owner” (Veblen, 1908: 107, 115). In the form of patents, copy rights or goodwill, intangible assets were the “capitalization of inefficiency” because they rewarded their owners on the basis of the kind of damage that they inflicted on the production process of their rivals (Veblen, 1908: 108). Veblen (1904: 72) stated the inextricable relationship between the modern business enterprise and intangible assets in the following terms:
“When a corporation begins its life history without such a body of immaterial differential advantages, the endeavors of its management are early directed to working up a basis of good-will in the way of trade-marks, clientele, and trade connections which will place it in something of a monopoly position, locally or generally. Should the management not succeed in these endeavors to gain an assured footing on some such ‘immaterial’ ground, its chances of success among rival corporations are precarious, its standing is insecure, and its managers have not accomplished what is looked for at their hands. The substantial foundation of the industrial corporation is its immaterial assets.”
Although Veblen wrote at a time when the very idea of the knowledge economy was unknown, his central ideas have passed the test of time. The ongoing debates about the form, measurement and definition notwithstanding, it has widely been recognized that intangible assets serve to create scarcity, provide sustained competitive advantage to firms and hence help corporations “secure sustainable abnormal returns from their resources” (Kristandl and Bontis, 2007: 1512; Crouzet et al., 2022a, 2022b). In the context of GVCs, Tups and Dannenberg (2023) outline the manner in which fertilizer multinationals use digital marketing, platforms, PPP partnerships and a network of local agroeconomists to create entire agro-industrial value chains connecting farmers, input suppliers and crop buyers. In these supplier-driven value chains, multinationals are able to position themselves as lead firms using their intangible assets. Similarly studies on big-tech companies, show that intangible assets have been crucial channels through which these firms predate on knowledge produced by publically funded universities, open source software and start-ups in emerging economies (Rikap, 2022, 2023; Rikap and Lundvall, 2022). In general, there is strong evidence to suggest that intangibles tend to increase market concentration. Looking at data from the US, Orhangazi (2019) argues that investments in intangibles allow firms to increase their profitability despite stagnating capital investments. Moreover, industries that are intangible-intensive exhibit higher mark-ups and profitability than others. Crouzet and Eberly (2019) study the retail sector in the US and make a similar argument linking productivity effects of intangible investments and rising market concentration. Understood more broadly, these patterns have been interpreted by Liagouras (2023) as evidence of a qualitatively new form of capitalism where value is produced through newer means beyond the factory, whereas for Baglioni et al. (2023), Christophers (2019a, 2023), and Quentin (2022) the shifting gravity toward intangible assets merely represent new modes of value appropriation in which rents have come to predominate.
Empirical analysis
Description of the data
In order to analyze the patterns of intangible asset accumulation for the period 2000–2022, the paper draws on the Centre for Monitoring Indian Economy’s (CMIE) Prowess database, which contains detailed firm-level data for publicly-listed and unlisted firms. Although it covers only 4.5% of registered firms, the companies in the database account for 85% of India’s GDP and more than half of the non-agricultural and non-governmental services sector output, put together. The firms are classified according to broad ownership groups, industries based on the Indian National Industrial Classification (NIC) system and other identity markers. For this study we use annual financial statements of non-financial firms which report a wide variety of firm-specific information. Although there are 42,000 such firms in the database, for the period under consideration there is a lack of data availability and thus the analysis that follows restricts itself to a smaller sub-sample. In particular, of the 42,000 firms, only 3654 have data on intangible assets for at least 50% of the period under consideration. This is the firm sample that is employed for the empirical analysis.
Intangible assets: Trends and patterns
Following Baranes (2017) the first and most basic indicator of the weight of intangibles in corporate portfolios is the ratio of net intangible assets (NIA) to net property, plant and equipment (NPPE). The CMIE data dictionary defines NIA as “net value of all of a company’s intangible fixed assets, after deducting the value of accumulated depreciation thereon from the gross block of the said assets” (Center for Monitoring Indian Economy, 2023: 2175). NPPE is a subset of the firm’s fixed assets that is either used to supply goods and services or used for administrative/rental purposes by firms. Previous studies have often used NPPE to proxy tangibility of firm assets (Desai et al., 2004). But for our purposes what is important is index itself which reflects the relative role of net intangible assets vis-à-vis net physical assets and thus serves as a possible signpost of their ability to extract “something for nothing” from the production process (Veblen, 1923). Accordingly, Figure 1(a) charts out the year-wise average of the ratio of NIA to NPPE for the sample of firms described above. 2 Figure 1(b) outlines the year-wise average of the ratio of NIA to “productive” capital (defined as NPPE plus cash equivalents held by the firm at the end of the financial year; see Baranes, 2017). Figure 1(a) indicates that the share of intangibles as a proportion of “serviceable” assets of firms, remained rather muted until 2008 after which it accelerated rapidly. This is similar to the trends detected by Ganguly and Vasudevan (2023). The acceleration was particularly striking after 2011 until it reached its peak in 2018. After a brief lull followed by a drop during the initial phase of the Pandemic, the ratio accelerated once again to new highs in 2022. A somewhat similar pattern is exhibited in Figure 1(b), where after a sudden acceleration after 2008, the ratio reaches a peak in 2011 from whereon out, it flattens but maintains its share vis-à-vis productive capital until 2022.
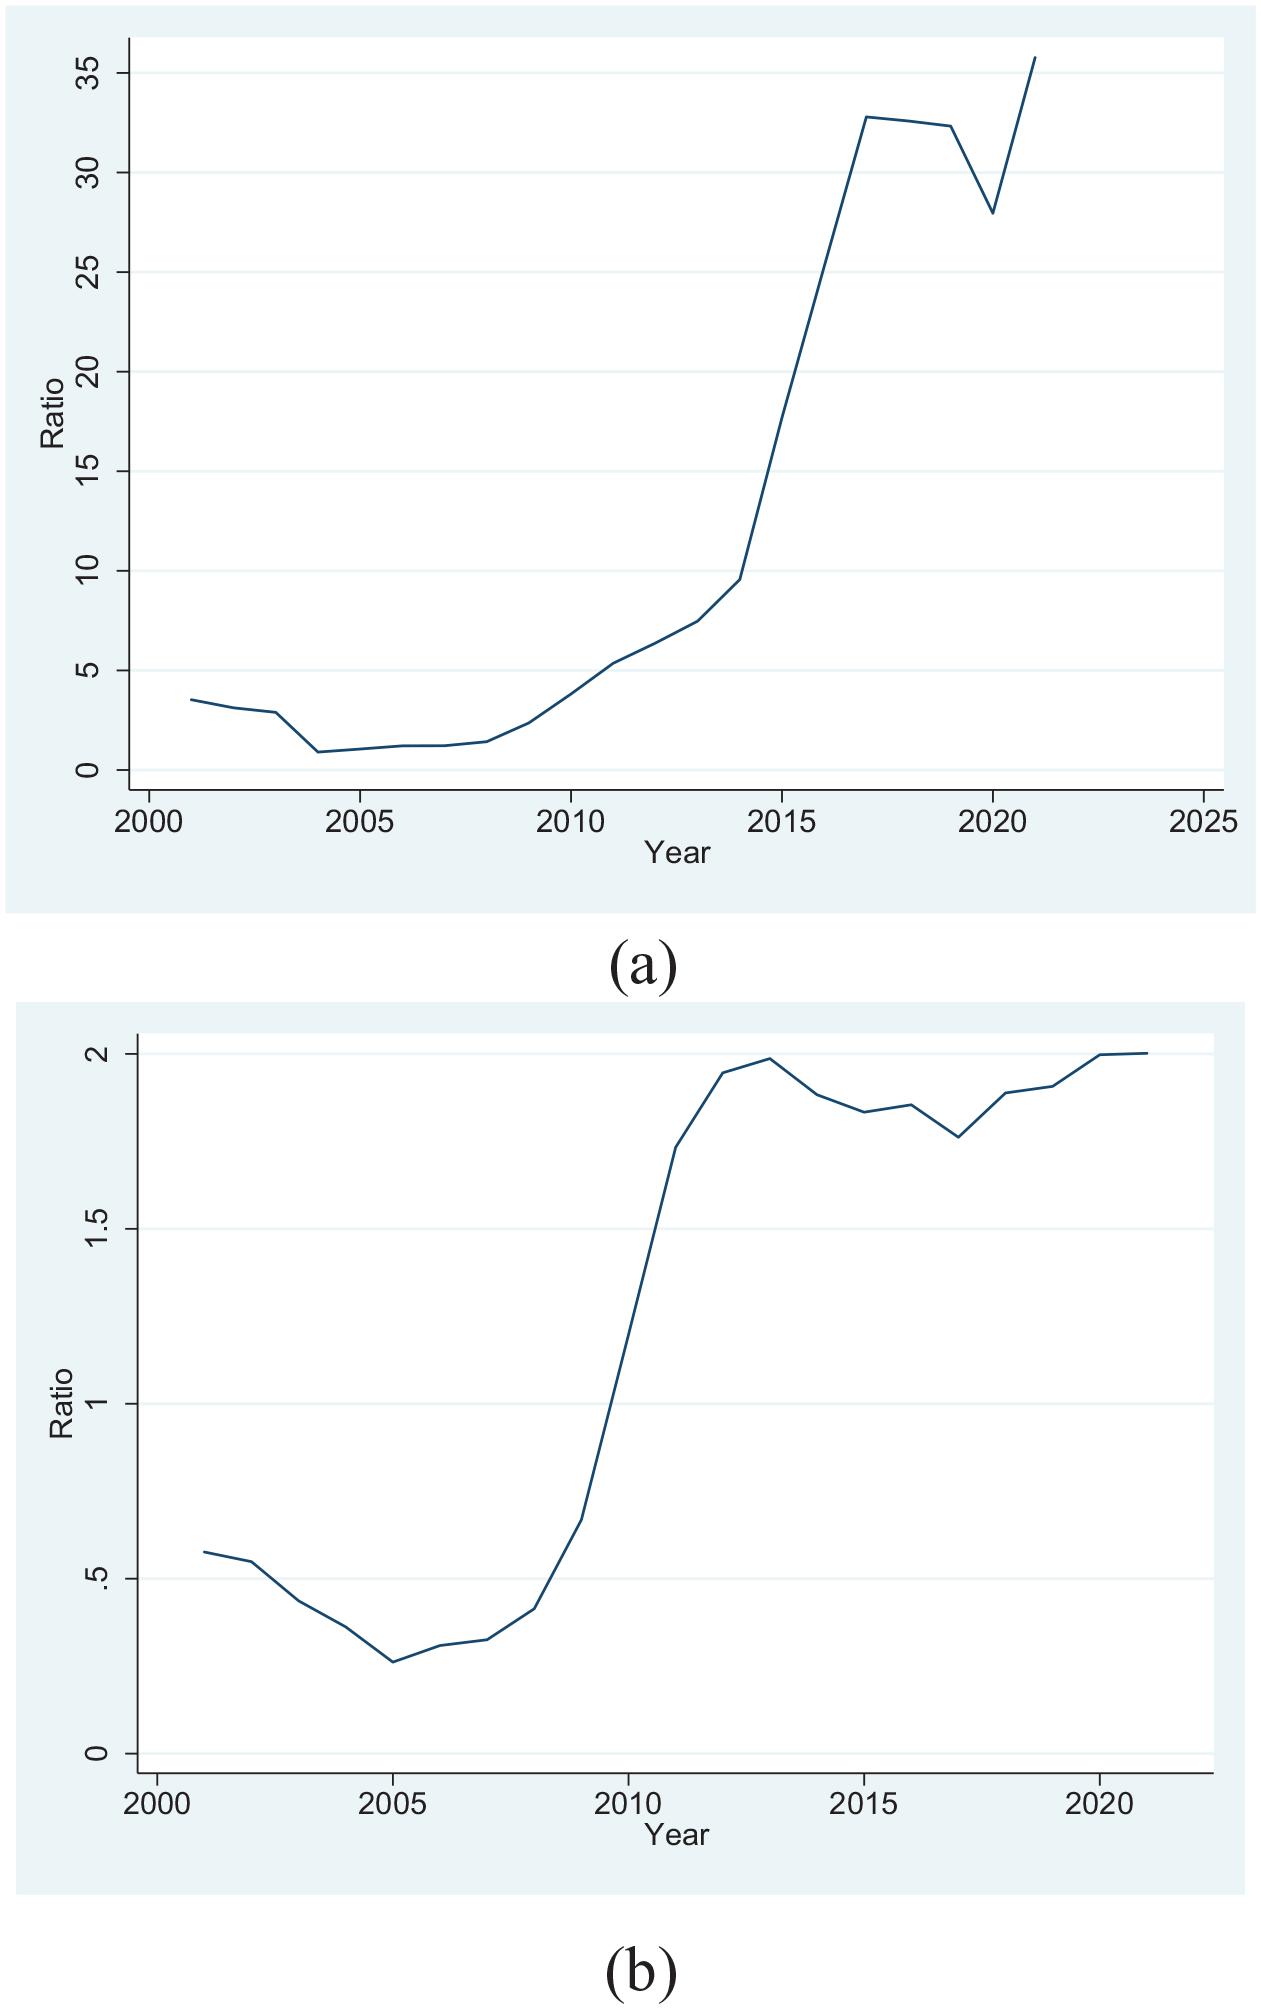
(a) Ratio of NIA to NPPE and (b) ratio of NIA to productive capital.
Intangible assets and corporate power
The shift of gravity toward intangibles that has been highlighted in the figures above has gone hand in hand with intensified inequality and monopoly concentration. With only nine billionaires in 1990s, by 2022 India was home to 119. In terms of market structure, the “big five” business houses have steadily increased their share of total assets and sales and account for an increasing proportion of the mergers and acquisitions taking place in the economy (Acharya, 2023). The result of this consolidation has been a significant increase in surplus share of dominant capitalists (Kothakapa and Sirohi, 2023). As of 2014 one estimate suggests that the top 1% of Indian tax payers controlled 22% of its national wealth, while a recent Oxfam report has estimated that the top 10% of India’s rich controlled 45% of its wealth in 2022 leaving it with the dubious distinction of having “more billionaires than France, Sweden, and Switzerland combined” (Chancel and Piketty, 2019; Chandra and Walton, 2020; Oxfam, 2022: 7).
To analyze some of these connections further, the year-wise shares of NIA of the top 100 firms ranked by assets/sales are calculated based on the figures reported in the annual financial statements for all firms in the sample in Figure 2(a) and (b). Figure 2(a) shows the share of NIA of the top 100 firms ranked by assets for each year. The ratio rises unevenly until 2008, from where it accelerates at a rapid pace until 2011. After a brief dip, the NIA share once again exhibits an increasing trend, almost accounting for three-fourths share of NIA in 2022. More generally, these trends do not change if instead of the top 100 firms, the top quartile of firms (ranked by assets) are taken into consideration. In this case as well, there is a sharp increase in the share of NIA of the top quartile of firms while the shares of NIA of the rest of the remaining firms exhibit a consistent decline throughout the period.

(a) Share of NIA of the top 100 firms ranked by assets, (b) share of NIA of the top 100 firms ranked by sales, (c) share of NIA of the “big five.”
Figure 2(b) shows similar results for the top 100 firms ranked by sales. The increase in the shares in Figure 2(b) is more rapid and uniform—barring the short dip after 2010—with the most significant accelerations occurring after 2014. Although it is not depicted here, these patterns are similar if the top quartile of firms (ranked by sales) are considered, instead of the top 100 firms. There is a dramatic increase in the share of NIA during the period for the top quartile. On the other hand, the shares of NIA of the remaining firms exhibit a sharp decline during the same period.
In several Asian economies, the industrial organization is dominated by large family-owned business houses like the Chaebols in South Korea and the Ziabatsus in Japan. In India too, family-owned businesses have been a prominent feature of its capitalist development (Damodaran, 2008; Khanna and Palepu, 2000; Masrani et al., 2021; Mazumdar, 2015; Roy, 2017). In this context, Figure 2(c) shows the same ratios as depicted in Figure 2(a) and (b), but for the “big five” business houses which have risen to prominence in recent decades (Acharya, 2023). The figure indicates that the shares of NIA follow a cyclical boom-bust pattern until 2013–2014 after which there is a sharp increase, peaking at 60% in 2020. 3
The accelerating shares of the “big five” business houses have another interesting set of implications. These large business houses are typical of many emerging economies and often take the form of “collections of publicly traded firms in a wide variety of industries, with a significant amount of common ownership and control, usually by a family” (Khanna and Palepu, 2000: 867). The rising share of these diversified units in aggregate NIA suggests that rentierism far from being a deviant, anomalous process restricted to the dark spaces of the economy, is actually a predominant mechanism through which diversified business units, with stakes in several different sectors, draw their power and resources. 4 Thus the liberal, moral economy dualism between “bad” rentiers and “good” capitalists may not be tenable in the Indian case (Baglioni et al., 2023).
Intangible assets: A sectoral view
To further investigate this, Figure 3(a) depicts the ratio of NIA to NPPE, differentiated according to sector of origin. The “rent-thick” sector here consists of what Kar and Sen ( (2016: 25) define as powerbroker and rentier firms which include firms that “are likely to strike up close personalized relationships with the political elite, to capture the process of license allocation or to create artificial barriers to entry.” We include real estate, construction, utilities, telecommunications, mining and quarrying in the “rent-thick” sector. All other sectors are combined together under the heading of the “productive” sector. 5 Between 2000 and 2003 the index deviates across the two sectors but after that the two series more or less coincide, crisscrossing at several instances. From 2017 onward there is a major jump in the NIA to NPPE ratio in the “rent-thick” sector even as the “productive” sector falls behind but by 2022 the ratio once again coincides across the two sectors. Figure 3(b) produces a completely different pattern of the ratio of NIA to productive capital (NPPE plus cash equivalents). The figure shows that the accumulation of NIA has been far more pervasive by firms in the “productive” sector as compared to the “rent-thick” sector, throughout the period under consideration. Although the two sets of patterns are very different, they upend the liberal distinction between productive and rentier spectrums of the economy and serve as a useful entry point into ongoing debates about the Indian economy.

(a) Ratio of NIA to NPPE by sector and (b) ratio of NIA to productive capital by sector.
As has been widely noted, after decades of robust growth, clouds of stagnation have started gathering on the horizons of the Indian economy as investment rates have slowed down, manufacturing and agricultural sectors have come to a standstill and unemployment levels have skyrocketed (Bosworth and Collins, 2015; Dasgupta, 2020; Nagaraj, 2020, 2023). Although several competing explanations have emerged, prominent liberal voices have blamed cronyism, corruption and broadly speaking, rentierization, of Indian capitalism for the current state of affairs (Chandra and Walton, 2020; Rajan, 2014; Subramanian, 2018; Subramanian and Felman, 2022; Walton and Gandhi, 2012). The irony of this should not be lost because the earliest ideological justifications for Indian neoliberal reforms stemmed from a romantic, almost moral, imagery of a struggle for individual freedoms and competitive markets against a rent-seeking, tyrannical state (Bhagwati and Desai, 1970; Krueger, 1974). In a speech to the Indian Parliament in 1991, for example, the then Finance Minister and India’s future Prime Minister, Manmohan Singh, made his case for economic reforms by drumming up precisely such an imagery (Singh, 1991). In his historic address, which would formally put an end the system of checks and controls established by post-War policymakers, Singh argued that decades of government intervention had created “barriers to entry and limits on growth in the size of firms” leading to a “proliferation of licensing and an increase in the degree of monopoly” on the one hand, and an “inadequate emphasis on reduction of costs, upgradation of technology and improvement of quality standards” on the other (Singh, 1991: 3–4). It was therefore crucial, he asserted, that the Indian government step back from its traditional role in the economy and instead focus on finding ways to “increase the degree of competition between firms in the domestic market so that there are adequate incentives for raising productivity, improving efficiency and reducing costs” (Singh, 1991: 4). The moralistic imagery of a progressive market confronting a tyrannical, wasteful state has remained a leitmotif of liberal arguments ever since, so much so that decades after Singh’s (1991) Budget Speech and several economic reforms later, liberal voices today have once again taken refuge in old moral economy distinctions of “bad” statist rentiers pitted against “good” free-market capitalists to explain India’s failing economic fortune (Crabtree, 2018; Economic Survey, 2020; Subramanian and Felman, 2022; Walton and Gandhi, 2012). Lost in these dualisms between good capitalist/bad rentier, politics/economics or accumulation/appropriation, are the dialectical connections that have always tied the two processes (Baglioni et al., 2023; Baines and Hager, 2023; Ghosh, 2015; Patnaik, 2008). By focusing on firm-level patterns of intangible asset accumulation the results above show the internal and necessary connections between accumulation and value capture that undergirds modern day capitalism (Bagchi, 1993).
Discussion and summary
To summarize, intangible assets have gained prominence in corporate portfolios over the last three decades and this phenomenon has attracted significant attention in the political economy literature in the context of the developed world. This paper turns its gaze to the case of a developing country and analyzes firm-level intangible asset accumulation for a sample of Indian firms. The analysis reveals a substantial increase in intangible assets relative to productive assets especially after 2008. It also suggests that the largest and most powerful corporations are the ones that have contributed to this spike. Ranked by assets, sales and ownership category, the results show that intangible asset accumulation has been the strongest in the highest echelons of the corporate hierarchy. Moreover, the patterns of intangible asset accumulation have been such that they have not been restricted to the traditional “rent-thick” sectors in the sense that their presence in the “productive” sectors has been as important, if not more so.
All of this has practical as well as theoretical implications of profound importance to developing countries like India. The discussion above compels us to re-conceptualize our understanding of capital accumulation in so called emerging economies. It is true that countries like India have experienced impressive growth rates and until recently, very high levels of investment to go along with it. This has led to an uncritical celebration of India’s growth trajectory even amongst the most vocal critics of neoliberalism who have singled it out for its shrewd management of liberalization and for its uncanny leapfrogging toward a service sector-led economy (Ban and Blyth, 2013; Pedersen, 2000; Rodrik, 2001). But the results of the firm-level analysis undertaken in the pages above reveal that more than revolutionizing production, what Indian capitalists have increasingly sought to do is to reshape and control the social structures around which the production process is organized.
The control and power of absentee owners is exerted through channels that are both direct and indirect, that involve material sanctions as well as monetary rewards, that involve collective actors as well as dyadic interactions. The phenomenal accumulation of intangible assets—be they in the form of branding, software or patents—represents the capitalization of this power. It is also crucial to recognize that the control that powerful corporations exert go well beyond these traditional firm-specific “resources” and that ultimately what corporations do is seek to control “established social structures and habits of thought” as well (Gagnon, 2016: 234). Of critical importance to a regime of absentee ownership is the cultural disciplining of society by controlling its media, by hounding dissident civil society actors into submission, by revamping educational institutions along neoliberal lines and by deploying the intoxicant of nationalism to cloak corporate greed in the language of national interest. A society built upon division and stratification, Veblen had noted a long time ago, is socially unstable and the rule of the absentee owner requires that the community members be culturally disciplined and society be converted into a large military organization based on ranks, gradations and norms of servility, so that the rule of the minority is accepted unquestioningly (Veblen, 1904). “The largest and most promising factor of cultural discipline” was the spirit of predatory nationalism (Veblen, 1904: 185). Nationalism, Veblen argued, provided the glue that helped bind people together in a society that was fundamentally built upon rivalry, differential gain and competitive emulation (Veblen, 1904: 186). It cloaked corporate greed in the language of national interest and deflected popular attention from questions of public welfare. Instead of actual material gains, predatory nationalism dished up the “psychic income” of national honor to the common populace and thus left intact the pillars of corporate power over society (Veblen, 1917: 71). In all these forms it performed the same function as did other intangible assets, in the sense that just like any other immaterial asset, nationalism had a “metaphysical” form “not of a physical nature. . .not known to serve any material or otherwise useful end apart from affording a practicable grievance consequent upon its infraction” (Veblen, 1917: 29). More importantly, like any other immaterial asset, it strove to secure “invidious success, which must involve as its major purpose the defeat and humiliation of some competitor” and “differential advantage by injury of the rival rather than by an increase of home-bred well-being” (Veblen, 1917: 33).
Indeed, in the Indian case there has been a striking convergence between authoritarianism, nationalism and growing corporate power. Crucial to this convergence has been the nexus between big corporate houses and the religious right-wing (Chacko, 2020; Desai, 2014, 2016; Kothakapa and Sirohi, 2023). Although the religious right has a long history dating back to the late colonial era, it was only in the 1980s and 1990s that it began finding its feet in the electoral arena and it was not until the thumping electoral victory of 2014 that it truly rose to acquire a hegemonic position (Basu et al., 1993; Bhatt, 2001; Chacko, 2018; Sirohi, 2019; Varshney, 2022). It’s relatively late rise to prominence was a result of a complex set of processes, but undoubtedly crucial was the support it received from the corporate elites who were irked by the early 2000 center-left experiments of “inclusive neoliberalism” and who yearned for a more pro-corporate regime in power that could do it’s bidding (Nilsen, 2021). This they found in the form of the Bharatiya Janata Party (BJP) who won the support and financial backing of India’s largest corporates in the run up to the 2014 elections, leading one journal editorial to call the 2014 results, “the biggest corporate heist in history” (Economic and Political Weekly, 2014). This support continued into the 2019 elections when, according to one estimate, 95% of funds raised via electoral bonds were captured by the BJP enabling it to spend close to 4 billion USD in one election alone (Jaffrelot and Verniers, 2020; Nilsen, 2021). 6
As big business houses poured billions into the kitties of the rightwing, they, in turn, skillfully combined religious nationalism with rabidly pro-corporate economic policies and did so with great political success (ADR, 2023; Chacko, 2018; Kaul, 2021; Sambhav and Ranganathan, 2022; Varma, 2019). A party whose traditional electoral base consisted of upper-class and upper-caste voters, was able to transform its support base in the 2014 elections when it cornered 24% and 38% of Dalit and Adivasi votes respectively. By 2019, the estimates suggest that the figure increased to 33% and 44% respectively (Jaffrelot, 2019). Seen in terms of class as well, there was a groundswell shift toward BJP with the party being able to attract 36% of votes from poorer voters in 2019 at the all-India level (Jaffrelot, 2019; Varshney, 2019).
That a party- typically associated with propertied elites and under whose rule there have been drastic cuts in welfare expenditures, rising unemployment and a phenomenal increase in income and wealth inequality- has been able to create such dense cross-class and cross-caste alliances has to a large extent been on account of its unique brand of majoritarian cultural politics (Chowdhury, 2023; Palshikar, 2015; Roy Chowdhury and Lahiri-Dutt, 2021; Sinha, 2021). For as Veblen had once stated, without common material interests, “the collective prestige remains as virtually the sole collective interest which can hold the sentiment of the group in a bond of solidarity” (Veblen, 1917: 54). Central to this project of building group prestige in India’s case, has been the demonization of religious minorities whom the religious right has long held as undeserving of citizenship rights (Golwalkar, 1939; Savarkar, 1923). From policing inter-religious marriages, to encouraging cow protection campaigns and fomenting religious riots against Muslims, the BJP has been successful in the “banalization” Hindu nationalism thus turning into commonsense an illiberal, exclusionary and unitary conception of the nation (Jaffrelot, 2015). But equally importantly, even as this intoxicant of religious nationalism has served to demarcate “the nation” from its “enemies,” it has also served to blur the lines between the interests of large corporations and those of the community taken as a whole, which, as Veblen had once asserted, was a key characteristic of predatory nationalism. So much so that when the Adani Group was recently accused of fraud and financial malpractice in a high profile report by Hindenburg Research, the company had no qualms in responding to the allegations by calling it “a calculated attack on India” 7 .
As the rewards have handsomely poured into the coffers of the rich, it is the poorest and most vulnerable who have suffered. Although the government has clamped down on publicly available household-level data, the evidence that does exist suggests an unprecedented reversal in the quality of lives of millions of Indians. Not only has there been a literal stall in structural change leading to large increases in unemployment and stagnation of wages, but India has also been witnessing increasing levels of hunger, child malnutrition and poverty (Drèze, 2023; Mehrotra and Parida, 2021; Nagaraj, 2023; Singh, 2020; von Grebmer et al., 2021). Striking still, is the possibility that infant mortality declines have slowed down and even reversed in some parts of the country well before the pandemic related shocks set in (Drèze et al., 2021).
Democracy too has been a casualty. From the unleashing of state-sponsored vigilante mobs aimed at hapless minorities, to the promulgation of expansive anti-terror laws which “can now designate any individual a terrorist based on personal writings, speeches, social-media posts, or even literature found in one’s possession,” India has been witnessing an unprecedented assault on its democratic traditions and its history of syncretism (Varshney, 2022: 115). And while it is tempting to explain these transformations in terms of deviant policies, institutions or primordial instincts, our results also indicate how these changes are inescapably related to the intensifying structural power of corporations. It follows therefore that the resolution of these cumulative woes cannot stop merely at transforming “bad” capitalism to “good” capitalism as suggested by the liberals. The central contradictions that India faces today have a structural dimension, the resolution of which will require an expansive, structural overhaul of its society. 8
Footnotes
Acknowledgements
I’m very grateful to the two anonymous reviewers for their useful comments. All remaining errors are mine.
Declaration of conflicting interests
The author declared no potential conflicts of interest with respect to the research, authorship, and/or publication of this article.
Funding
The author received no financial support for the research, authorship, and/or publication of this article.