
Abstract
This paper examines the dynamics of employment in the financial sector in the European Union and the United Kingdom since the early 1990s. Using the EU Labor Force Survey at the national (NUTS0), regional (NUTS1), and subregional (NUTS2) levels, we document several stylized facts about the evolution of financial centers. Despite the global financial and sovereign debt crises, the total number of workers in the financial sector has increased from less than 5 million in 1993 to more than 6.5 million in 2020. At the same time, however, the share of employees in the financial sector has decreased from 3.5% to 2.8%. We find large regional differences in the degree of financial specialization, with Luxembourg at the top end (11% of their total workforce), followed by Ireland and the United Kingdom (4%), then France, Germany or Italy (around 3%). We also explore the dynamics of concentration. The main conclusion is that the degree of concentration depends on the scale of measurement employed. We show a contrasting concentration trend: centripetal at the national level and centrifugal at lower levels (regional or sub-regional). Furthermore, newer financial centers showed faster growth.
JEL codes: E44, G2, R1
Introduction
Since the 1990s, the European financial sector has experienced a series of substantial transformations, acting through technological, political, and economic channels. If history is any guide, these shocks will have had profound impacts on the landscape of financial activity across the continent. Times of great upheaval have proven to be those in which great financial centers rise and fall, and the past 30 years have been rife with change. The explosion of new information and communication technologies, enlargement of the European Union, global financial crisis, Eurozone sovereign debt crisis, Brexit, and the disruption caused by the Covid-19 pandemic all have the potential to disrupt the longstanding geography of the financial activities and the hierarchy of financial centers, typically characterized by inertia and entrenchment.
In this paper, we examine the dynamics of employment in the financial sector in the European Union (EU) and the United Kingdom (UK) since the 1990s. It seeks to examine the clustering of financial services, the impact of shocks on market concentration, and the role of technological changes in shaping the geographical distribution of financial activities. Principally, we ask whether the myriad shocks to the European financial system over this period have served to either geographically concentrate or disperse activities. Our short answer is that the answer is a matter of scale. At the national level, new financial centers have emerged, spreading financial activity to new regions of Europe. At the subnational level, however, we document increasing concentration into regional financial hubs.
Our study contributes to the existing literature on the geography of financial activities in several key areas. Firstly, we enhance the sample coverage by considering all EU countries, including the UK. This broader scope allows for a more comprehensive analysis, as previous studies often focused on a limited number of countries due to data comparability issues. To achieve this, we have carefully collected, harmonized, and consolidated data on financial employment provided by the EU Labor Force Survey (the details of the procedure is available in the Supplemental Appendix). The EU provides an ideal laboratory for exploring the geography of financial activities. This is particularly significant given the presence of several global financial centers (London, Paris, and Frankfurt), but also important regional financial centers (Prague, Warsaw, Milan, Dublin, and Luxembourg). In addition, there is significant heterogeneity across countries in terms of economic development, financial systems (bank- or market-based), legal systems (civil or common law), cultures, and languages. Furthermore, a review of previous studies, including the United Kingdom and Germany (Klagge and Martin, 2005; Wójcik and MacDonald-Korth, 2015), France (Capelle-Blancard and Tadjeddine, 2007), Poland (Hashimoto and Wójcik, 2021a) and the Visigrad four (Hashimoto and Wójcik, 2021b), shows that the degree of geographical concentration is highly variable across this sample of countries.
Secondly, our study extends the temporal dimension by covering three decades. This temporal breadth is essential because the strongest force governing the relative importance of financial centers is inertia (Haberly and Wójcik, 2022). That is, absent a large shock of historical importance, the global financial system tends to be stable, static, and stationary. Over the past 30 years, however, other forces appear to be acting against this inertia to reshape the financial geography. First, as Klagge and Martin (2005) point out, there has been a growing trend toward the geographical concentration of financial activities due to globalization, technological innovation, and intensifying international competition. These findings stand contrary to initial fears about “the end of geography” (O’Brien, 1992). At the same time, the emergence of new regional financial centers (RFCs) swim against the strong current of concentration. The network of financial centers is broadening. Although London and New York remain on top, there are more and more opportunities for small RFCs to fill niches in the global financial system (Morris et al., 2020; Poon et al., 2004; Sagaram and Wickramanayake, 2005; Vo and Nguyen, 2021). By considering a long timeframe, we capture both periods of stability and change in financial geography, providing insights into the enduring nature of established financial centers and the emergence of new ones.
Thirdly, our analysis incorporates the impact of external shocks on the geography of financial activities. It is likely that financial crises and policy shocks have been reshaping the geography of finance (Wójcik and MacDonald-Korth, 2015). These external shocks include the US subprime crisis, which impacted the world economy in 2007–2008, the ensuing Eurozone sovereign debt crisis, and the new stability regulation at the national and supra-national level. These shocks, and the systematic changes and mutations they engendered, lead to a falling degree of global financial integration, referred to as “balkanization” of banking (The Economist, 2014). Moreover, some countries in Europe have unilaterally implemented national laws on financial stability, leading to balkanization of supervisory policy (Nedelchev, 2015). Taken together, these economic shocks might have led to geographic dispersion of financial activity in Europe. Moreover, the EU has been subject to major political changes. In particular, the waves of enlargement of the EU enabled a wider geographic distribution of activities, while Brexit has created the conditions for a competition between European member states and financial centers (Fromentin, 2021; Howarth and Quaglia, 2018; Lavery et al., 2019).
Lastly, our study emphasizes the significance of considering multiple geographical scales in analyzing the distribution of financial sectors. The geographic distribution of financial sectors is the result of the interplay between centripetal and centrifugal forces (Contel and Wójcik, 2019), but disentangling the interplay between these two contradicting forces remains an open research question. On the one hand, the transmission of information over distance is subject to considerable entropy, and the cost of distance is an important agglomerating factor. These centripetal forces act on the financial sector exactly as Marshall (1890) described them acting on industry: access to a skilled workforce (Jakobsen and Onsager, 2005; Pompili, 1992), development of subsidiary services (Coe et al., 2014; Faulconbridge, 2004), and diffusion of specific knowledge “as it were in the air” (Cook et al., 2007). On the other hand, structural barriers, notably legal (Nedelchev, 2015), but also cultural and linguistic (Cook et al., 2007) create countervailing centripetal forces. We argue in this paper that these two forces are unlikely to operate on the same scale: centripetal forces are powerful within countries, while centrifugal tend to operate between countries. Therefore, when it comes to geographical concentration, it is essential to consider the scale at which the study is being carried out.
While the previous literature draws from history, political science, economics, urban studies, or law, this paper takes a statistical approach, and focuses on the measure of concentration and dispersion. Our analysis aims to present the opposite (but complementary) dynamics of concentration, at macro (country) and micro (region and sub-region) levels, with combined temporal and cartographic analyses. The availability of high-quality data (via Eurostat) and a geographic hierarchy comparable across countries (NUTS at level 0, 1 and 2) makes the EU uniquely amenable to such an analysis. To measure financial concentration, we use two summary statistics proposed by the existing literature: the Herfindahl-Hirschman (HH) concentration index and the location quotient (LQ). To draw out the various influences on concentration proposed above, we apply several statistical techniques, including OLS and variograms.
Using our comprehensive dataset, we conducted an EU-wide assessment and ranking of the most significant countries and regions in terms of the number of employees within the financial sector. In 2020, the EU and the UK combined had approximately 6.5 million employees in the financial sector, up from less than 5 million in the early 1990s. In 2020, financial employees represented 3% of the total workforce. Trends in financial sector workers have largely followed those of the total workforce, but the share of financial sector employment has gradually declined over the past two decades. But this high-level view is not the whole story. Digging deeper, we find a panoply of unique dynamics in different countries and regions. Some highly dedicated, small countries, such as Luxembourg, have experienced significant increases in financial sector employment over the sample period, despite being relatively minor contributors to total European employment figures. The four largest countries (Germany, UK, France, and Italy) collectively account for nearly a third of financial sector employment, but show no evidence of being relatively more specialized in finance than other EU countries. Conversely, at the regional level, major urban areas such as Île de France, London, Frankfurt show higher levels of specialization, albeit to varying degrees.
Next, we investigated the dynamics of spatial concentration in European financial activities since the 1990s. We found that the degree of concentration depends on the scale of measurement employed. At the national level (NUTS0), financial sector job concentration had been gradually increasing up until the global financial crisis, after which the trend reversed. This pattern was not, however, robust to the choice of metric, nor to geographic resolution. To better understand the dynamics, we extracted regional time-trends using a panel OLS estimator. This analysis confirmed a contrasting concentration trend: centripetal at the national level and centrifugal at lower levels (regional or sub-regional). Furthermore, we examined the correlation between a region’s initial concentration level (regional fixed effect or intercept) and its subsequent growth (regional slope coefficient). Our findings (excluding Luxembourg) suggest that newer financial centers – those which were less concentrated at the beginning of the sample period – are growing at a faster rate compared to the oldest and largest centers, aligning with a centripetal force narrative at the country level. Finally, we compute variograms of financial concentration for each year in our sample. We observed an increase in similarity between regions as geographic distance increases, contrary to typical geospatial effects where closer regions exhibit greater similarity. Over time, however, this effect has been diminishing, suggesting that closer regions are becoming more and more similar.
Overall, our findings highlight the complex dynamics of spatial concentration in European financial activities. By uncovering contrary trends at the national and sub-national levels, we emphasize the importance of scale in measuring concentration. These insights contribute to a deeper understanding of the evolving geography of finance.
The structure of the paper is as follows. Section 2 provides a brief literature review. Section 3 presents the measures and data used. Section 4 details the aggregate dynamics over the period 1993–2020 in Europe, and the distribution of countries and regions. Section 5 shows the dynamics of concentration and dispersion at different scales. Section 6 concludes and discusses the results.
A brief literature review
A broad and interdisciplinary field
The geography of financial activities is a multifaceted field of study that intersects with economics, geography, history, and urban planning, among others. 1 The concentration of financial services in certain cities, regions or countries has been a focal point in academic literature. As a result, several key insights into the mechanisms and implications of this phenomenon have been found. In this sub-section, we review some of the main insights.
History and path dependence
Many financial centers have developed because of historical advantages and path dependence. For instance, the roots of the dominance of the City of London trace back hundreds of years, to the Glorious Revolution and the establishment of the Bank of England in the 17th century, as well as England’s first-mover advantage in the industrial revolution and subsequent naval dominance (Carlos and Neal, 2011; Neal, 1990). Across the Atlantic, Reed (1981) notes the importance of the World Wars in the ascendance of New York.
Global networks and political power
Financial activities are generally highly concentrated in a small handful of cities (Cassis, 2010; Cassis and Wójcik, 2018; Sassen, 1991, 1999), generally viewed as the command-and-control centers of the global economy (Friedmann and Wolff, 1982; Jacobs, 1985). A vital component of modern economies, the financial sector serves as an economic backbone, facilitating the efficient allocation of resources, promoting investment and entrepreneurship, and supporting economic growth. Moreover, hosting a global financial center (GFC) or a smaller regional financial center (RFC) has direct benefits for the host country (Yıldırım and Mullineux, 2015), including job creation, human capital formation, and wealth generation. The presence of a global financial center also enhances a country’s reputation and soft power on the global stage (Cassis, 2010). A well-regulated and transparent financial center contributes to a country’s credibility, trustworthiness, and attractiveness as a destination for investment and business. It can boost a country’s influence in international financial institutions, and allow it to actively participate in shaping global financial regulations and standards.
Last but not least, GFCs and RFCs are interconnected. 2 The relationships forged between these cities create “assembly lines” that form decentralized global financial networks (Haberly and Wójcik, 2022).
Agglomeration economies and inertia
The seminal contributions of Krugman (1991) and Glaeser et al. (1992) highlight how economic activities, including financial services, tend to cluster due to network effects and increasing returns to scale (Fujita and Thisse, 1996). Financial firms benefit from being close to each other due to reduced transaction costs, easier access to information and clients, the pooling of labor markets dedicated to financial services, and dissemination of knowledge, and the sharing of experiences (Contel and Wójcik, 2019; Leyshon and Thrift, 1998; Taylor and Walker, 2001).
The availability of skilled labor is critical to financial enterprises. They require workers trained not only in finance, but also in related skills such as law and business. Dominant financial centers attract talent from around the world, creating a local talent pool. This concentration enhances productivity and innovation within financial centers (Cook et al., 2007), and catalyzes a self-reinforcing cycle that reinforces the center’s dominance. As more firms and skilled professionals cluster in a financial hub, it becomes increasingly attractive for other to do so as well. This is due to the depth of the labor market, the availability of specific services, and the resulting ease of conducting business.
Regulatory and tax regimes
The regulatory environment and tax policies of cities and countries significantly influence the concentration of financial services. Favorable regulatory conditions and tax incentives can attract banks, hedge funds, and other financial institutions to specific locations. The rise of offshore financial centers has been particularly linked to low tax regimes and light-touch regulation (Bouvatier et al., 2017; Hines and James, 2010; Palan et al., 2010). 3
Concentration and dispersion
While the “broad picture” painted by academic literature on financial geography places the concentration of financial activities and the inertia of financial centers in the foreground, several studies highlight dispersion effects and changes due to external shocks. Spatial dispersion, linked to centrifugal forces, can be explained by information asymmetry and the need for spatial proximity (Dixon, 2011). In particular, financial activities might move closer to customers, both to know them better, and also to better filter and monitor them. Therefore, the dynamics of concentration and dispersion of financial activity can be intertwined, with interactions between centripetal and centrifugal forces (Cook et al., 2007). For example, banks are subject to more centripetal forces, since they benefit from agglomeration of in interbank activities. Meanwhile, retail banks or venture capital are subject to centrifugal forces, with incentives to decentralized retail structures and move closer to customers and investors (Grosse, 2005; Lutz et al., 2013; Powell et al., 2008). A survey by Deloitte (2023) also highlights a recent trend according to which “strategic and interaction-heavy” functions in the financial sector are increasingly outsourced.
Like all economic systems, the geographic arrangement of financial centers are subject external shocks. These shocks have the potential to rearrange which force, centripetal or centrifugal, prevails. Recent examples include the global financial crisis (Hashimoto and Wójcik, 2021b; Heneghan and Hall, 2021) or the Covid-19 pandemic (Wójcik and Ioannou, 2020). New information and communication technologies also enter as exogenous shocks, and can encourage the dispersion of financial centers, and the scattering of the production chain of financial services (Capelle-Blancard and Tadjeddine, 2007). Finally, changes in the political or regulatory environment can promote local and regional financial services industries (Verdier, 2003).
Such shocks can trigger cycles. Indeed, according to the new economic geography, periods of increasing concentration or dispersion are expected to slow over time as countervailing forces play out. Take the shock of modern information technology for example. A new territorial division of labor in the financial sector emerged in its wake, with a dispersion of back- and middle-office functions from the main financial centers (Grote and Täube, 2007). This process of dispersion culminated in the creation of “sub-centers” (e.g. Luxembourg, Dublin, Munich, Geneva) which concentrate on product niches (Walther et al., 2011), such as capital-investment, mergers and acquisitions, or hedge funds.
Empirically, several studies have assessed the joint dynamic of concentration and dispersion of financial activities: Rossi et al. (2007) and Contel and Wójcik (2019) for Brazil; Capelle-Blancard and Tadjeddine (2007) for France; Migozzi et al. (2023) for India; Hashimoto and Wójcik (2021b) for the Visegrad group; Heneghan and Hall (2021) and Panitz and Glückler (2022) for the UK, or Wójcik et al. (2022) on a global scale.
The issue of the concentration of financial activities is not only important for understanding the way globalized finance works. Such concentration in certain cities or regions can exacerbate spatial inequalities, both within countries and globally. Wealth and opportunities generated by financial centers can lead to disparities in economic development, contributing to issues of access to financial services, housing affordability, and regional economic disparities. As a result, understanding the dynamics that lead to financial concentration has consequences far beyond financial history or labor economics, including for development and equality.
Data and measurement
The sample
This study examines the evolution of the financial sector in Europe between 1993 and 2020. The definition of the perimeter and the sample period are constrained by the availability of comparable and compatible data, at several scales.
We dedicate our empirical analysis on Europe. Europe has the most cities on the Global Financial Centers Index 4 : 49 in 2023, compared with 14 in North America, and 30 in Asia/Pacific. To have a consistent sample, we use EU Labor Force Survey (EU-LFS) data. Our choice of dataset excludes several European countries (Iceland, Norway, and Switzerland), but in exchanges provides a time-consistent measure of financial activity across the EU. The EU-LFS provide data on worker by occupation at the NUTS0 (27 countries), NUTS1 (98 regions), and NUTS2 (262 sub-regions) level for all countries in the EU (including the UK, pre-Brexit). The national data were available from 1993 to 2020, while regional data were available only from 1999 to 2020. 5
We consider employment data. The advantage of this metric is to be homogeneous. We focus on the financial sector, which is more restrictive than the sector “financial and business services” (FABS). We define financial sector workers as those working in banking, finance, insurance, and auxiliary financial services, 6 which corresponds to NACE v2 section K (comprising divisions 64 and 66), and NACE v1 section J (comprising divisions 65–67). 7
We performed significant pre-processing of the data in order to account for geopolitical changes, revision to NUTS regions, and missing data at finer geographic resolutions. The EU underwent several rounds of enlargement throughout the period 1999–2020, and data for countries that “accessed” (joined the EU) in this period is inconsistent prior to 2004. To prevent that our indicators are not arbitrarily influenced by data availability, and to ensure that aggregate values always reflect the historical EU at a particular date, we drop all values from a country prior to its EU accession. In addition, ten NUTS 2 regions were revised between 2010 and 2020. In order to make data comparable across the entire period, we re-aggregated these revisions to match the most recent NUTS revision prior to disaggregation. As a result, some units we consider are no longer present in the NUTS system of classification. Finally, we identified several hundred missing values for NUTS1 and NUTS2 regions that could be interpolated by exploiting the hierarchical structure between NUTS0, NUTS1, and NUTS2. In particular, we filled missing values that could be inferred from the adding up constraint that must prevail between levels of the geography hierarchy. 8
The methodology
In order to examine the spatial distribution of financial sector employment in Europe, we use two measures of concentration: the Herfindahl-Hirschman concentration index (
Define
Formally:

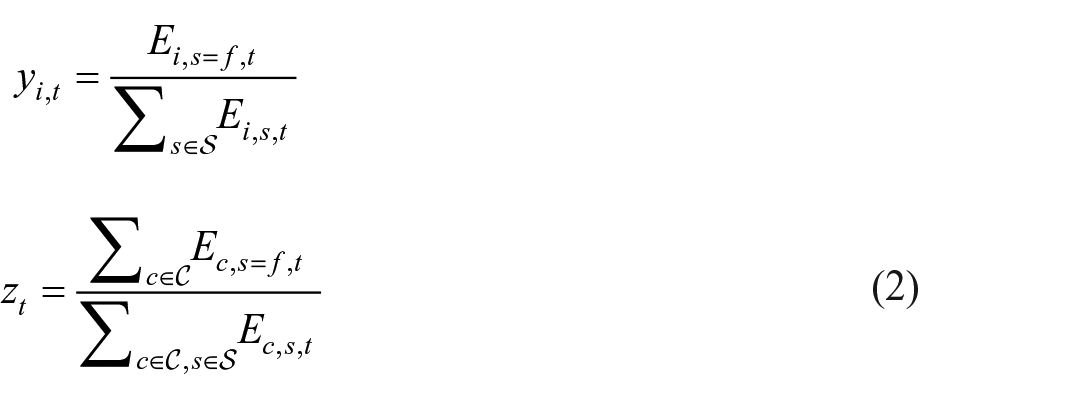
where
Using these ratios, we define two measure of concentration. The first is the widely-used Herfindahl-Hirschman concentration index:

While the second is the so-called “location quotient,” also known as the specialization index (Balassa-type):
The use of these two metrics is motivated by several factors. First, there is a lack of agreement among researchers in the field of financial geography on how to measure financial concentration. Hashimoto and Wójcik (2021a, 2021b) use the LQ, Wójcik and MacDonald-Korth (2015) use the HH index, while Contel and Wójcik (2019) use both. In addition, each metric provides somewhat different insight. While the HH index is a sum over sub-regions, the LQ scores each region individually. This means we are able to compute an LQ score even for EU member states with regional financial centers but zero or few NUTS sub-regions, such as Luxembourg. Finally, the different functional forms of the two metrics mean that they score financial concentration in different ways. In particular, smaller regions with total share of employment (
The geography of the European financial sector: A first look
In this section, we present some stylized facts about the employment in the financial sector in the EU, including the UK (EU+UK hereafter). We consider the aggregated dynamics over the period 1993–2020, and then the distribution of the country and the regions.
Employment in the financial sector in Europe over the last three decades
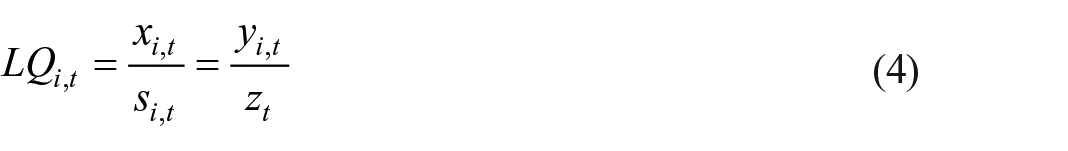
In the EU+UK in 2020, the number of employees in the financial sector was around 6.5 million, compared to less than 5 million in the early 1990s. It represents around 3% of the total workforce, although this share has been steadily declining over the past 20 years. The number of workers employed by the financial sector in the EU+UK tracks closely with the total workforce. Figure 1 Panel A plots total EU+UK financial sector workers and total workers. The strong correlation between the two series (Pearson’s r = 0.95), is clear. Both see a period of steady increase from 1993 until 2003, with more rapid increases following the eastward EU enlargements in 2003 and 2007. Recall that the data have been preprocessed to reflect the historical state of the EU at a given date, so enlargement must mechanically increase total employment. Following the global financial crisis in 2008, both total employment and financial sector employment enter a period of long-term stagnation, which persists until 2020. At the national level, the effect of the global financial crisis has been only to halt growth, without causing any significant decline.
The size of the financial sector in the EU+UK, 1993–2020. Panel A. Number of workers, in thousands. Panel B. Number of workers, as fraction of total labor market. “B” indicates a banking crises, while “SD” indicates a sovereign debt crisis. “E” indicates an EU enlargement. “X” indicates Brexit referendum vote. Banking crises dates are from the System Banking Crises Database of Laeven and Valencia (2018). Banking crises refer to the UK (2007), Global Financial Crisis (2008), and Cyprus (2011). Sovereign debt crises refer to Greece (2012) and Cyprus (2013). EU enlargements include the addition of Finland, Austria, and Sweden in 1995, Cyprus, Latvia, Lithuania, Estonia, Malta, Poland, Hungary, Slovakia, Slovenia, and Czechia in 2004; Bulgaria and Romania in 2007, and Croatia in 2013. Source: EU-LFS.
Despite a steady increase in the levels of financial workers, the share of financial workers has been in steady decline. Figure 1 Panel B, plots the fraction of financial workers in the EU+UK labor market; that is, the ratio of the black and red lines in Panel A. The 2004 EU enlargement is the largest shock, as the new member countries had relatively small financial sectors. Notwithstanding this discontinuity, there is a clear, unbroken downward trend in financial sector labor market share over the sample period. Paradoxically, the 2008 global financial crisis appears to have been a net positive for financial employment, and the wake of this shock provides the only period of trend reversal in the sample.
In addition to the global financial crisis, the European financial system was also subject to shocks during the sovereign debt crisis in 2012. In their database of financial crises, Laeven and Valencia (2018) encode this crisis in Greece and Cyprus, although scholars of sovereign debt crisis, for example Lane (2012), implicate Greece, Ireland, Italy, Portugal, and Spain (the so-called “GIIPS”). While there appears to have been a structural break in employment trends following the global financial crisis, there is no obvious corresponding effect following the sovereign debt crisis.
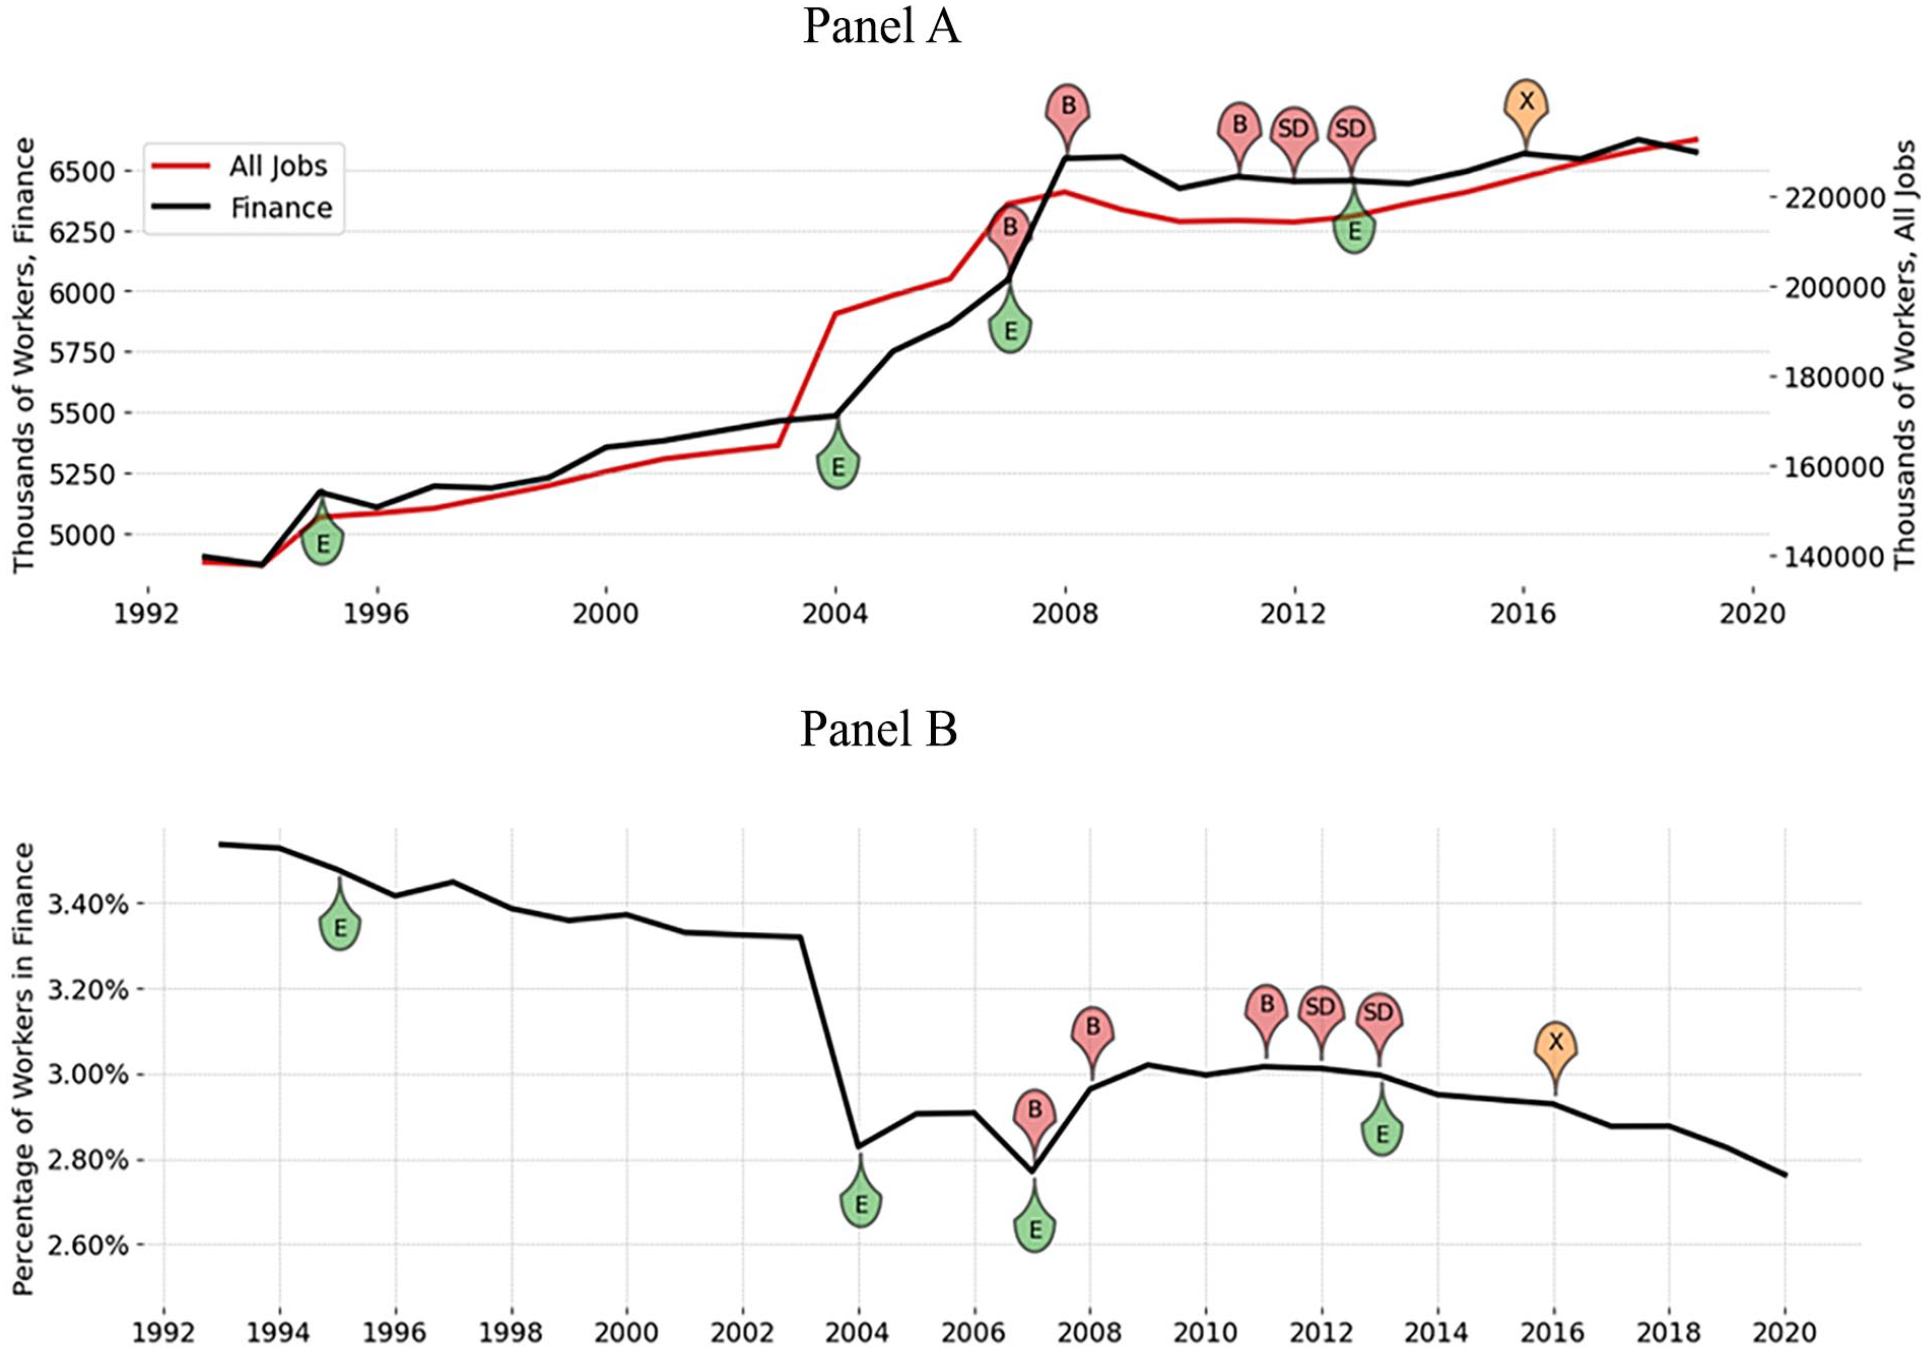
The declining trend in aggregate EU+UK financial sector labor market share conceals a great deal of heterogeneity at more disaggregated levels of geography. To explore general trends across geographies, we estimated a series of deterministic trend regressions,
Estimated time trends in the share of financial sector employment. Panel A. Distribution of the estimated time trend coefficients. Panel B. Estimated time trend coefficients and total regional job market size. Estimated trends are the slope parameter from a deterministic trend regression:
Figure 2 Panel B somewhat resolves the contradiction by plotting the estimated trend coefficients against the total workforce of each region. Taking this view, it becomes clear that the largest upward trends in financial employment over the sample period have been occurring in the smallest financial job markets. Malta (MT), Luxembourg (LU), Lithuania (LT), and Latvia (LV) show the strongest upward trend in financial sector employment growth, but are also themselves the smallest job markets in the EU. Among the largest job markets, Germany (DE), the United Kingdom (UK), France (FR), Italy (IT) and Spain (ES), financial sector growth was either negative or flat over our sample period. Thus, at the national (NUTS0) and regional (NUTS1) level, there is a negative correlation between the deterministic growth coefficient and the size of region’s labor market. But, in our first sign of a scale effect, this correlation reverses at the sub-regional (NUTS2) level. Here, the largest job markets are split between positive and negative growth. Thus, a paradox of resolution, if not of size, remains.
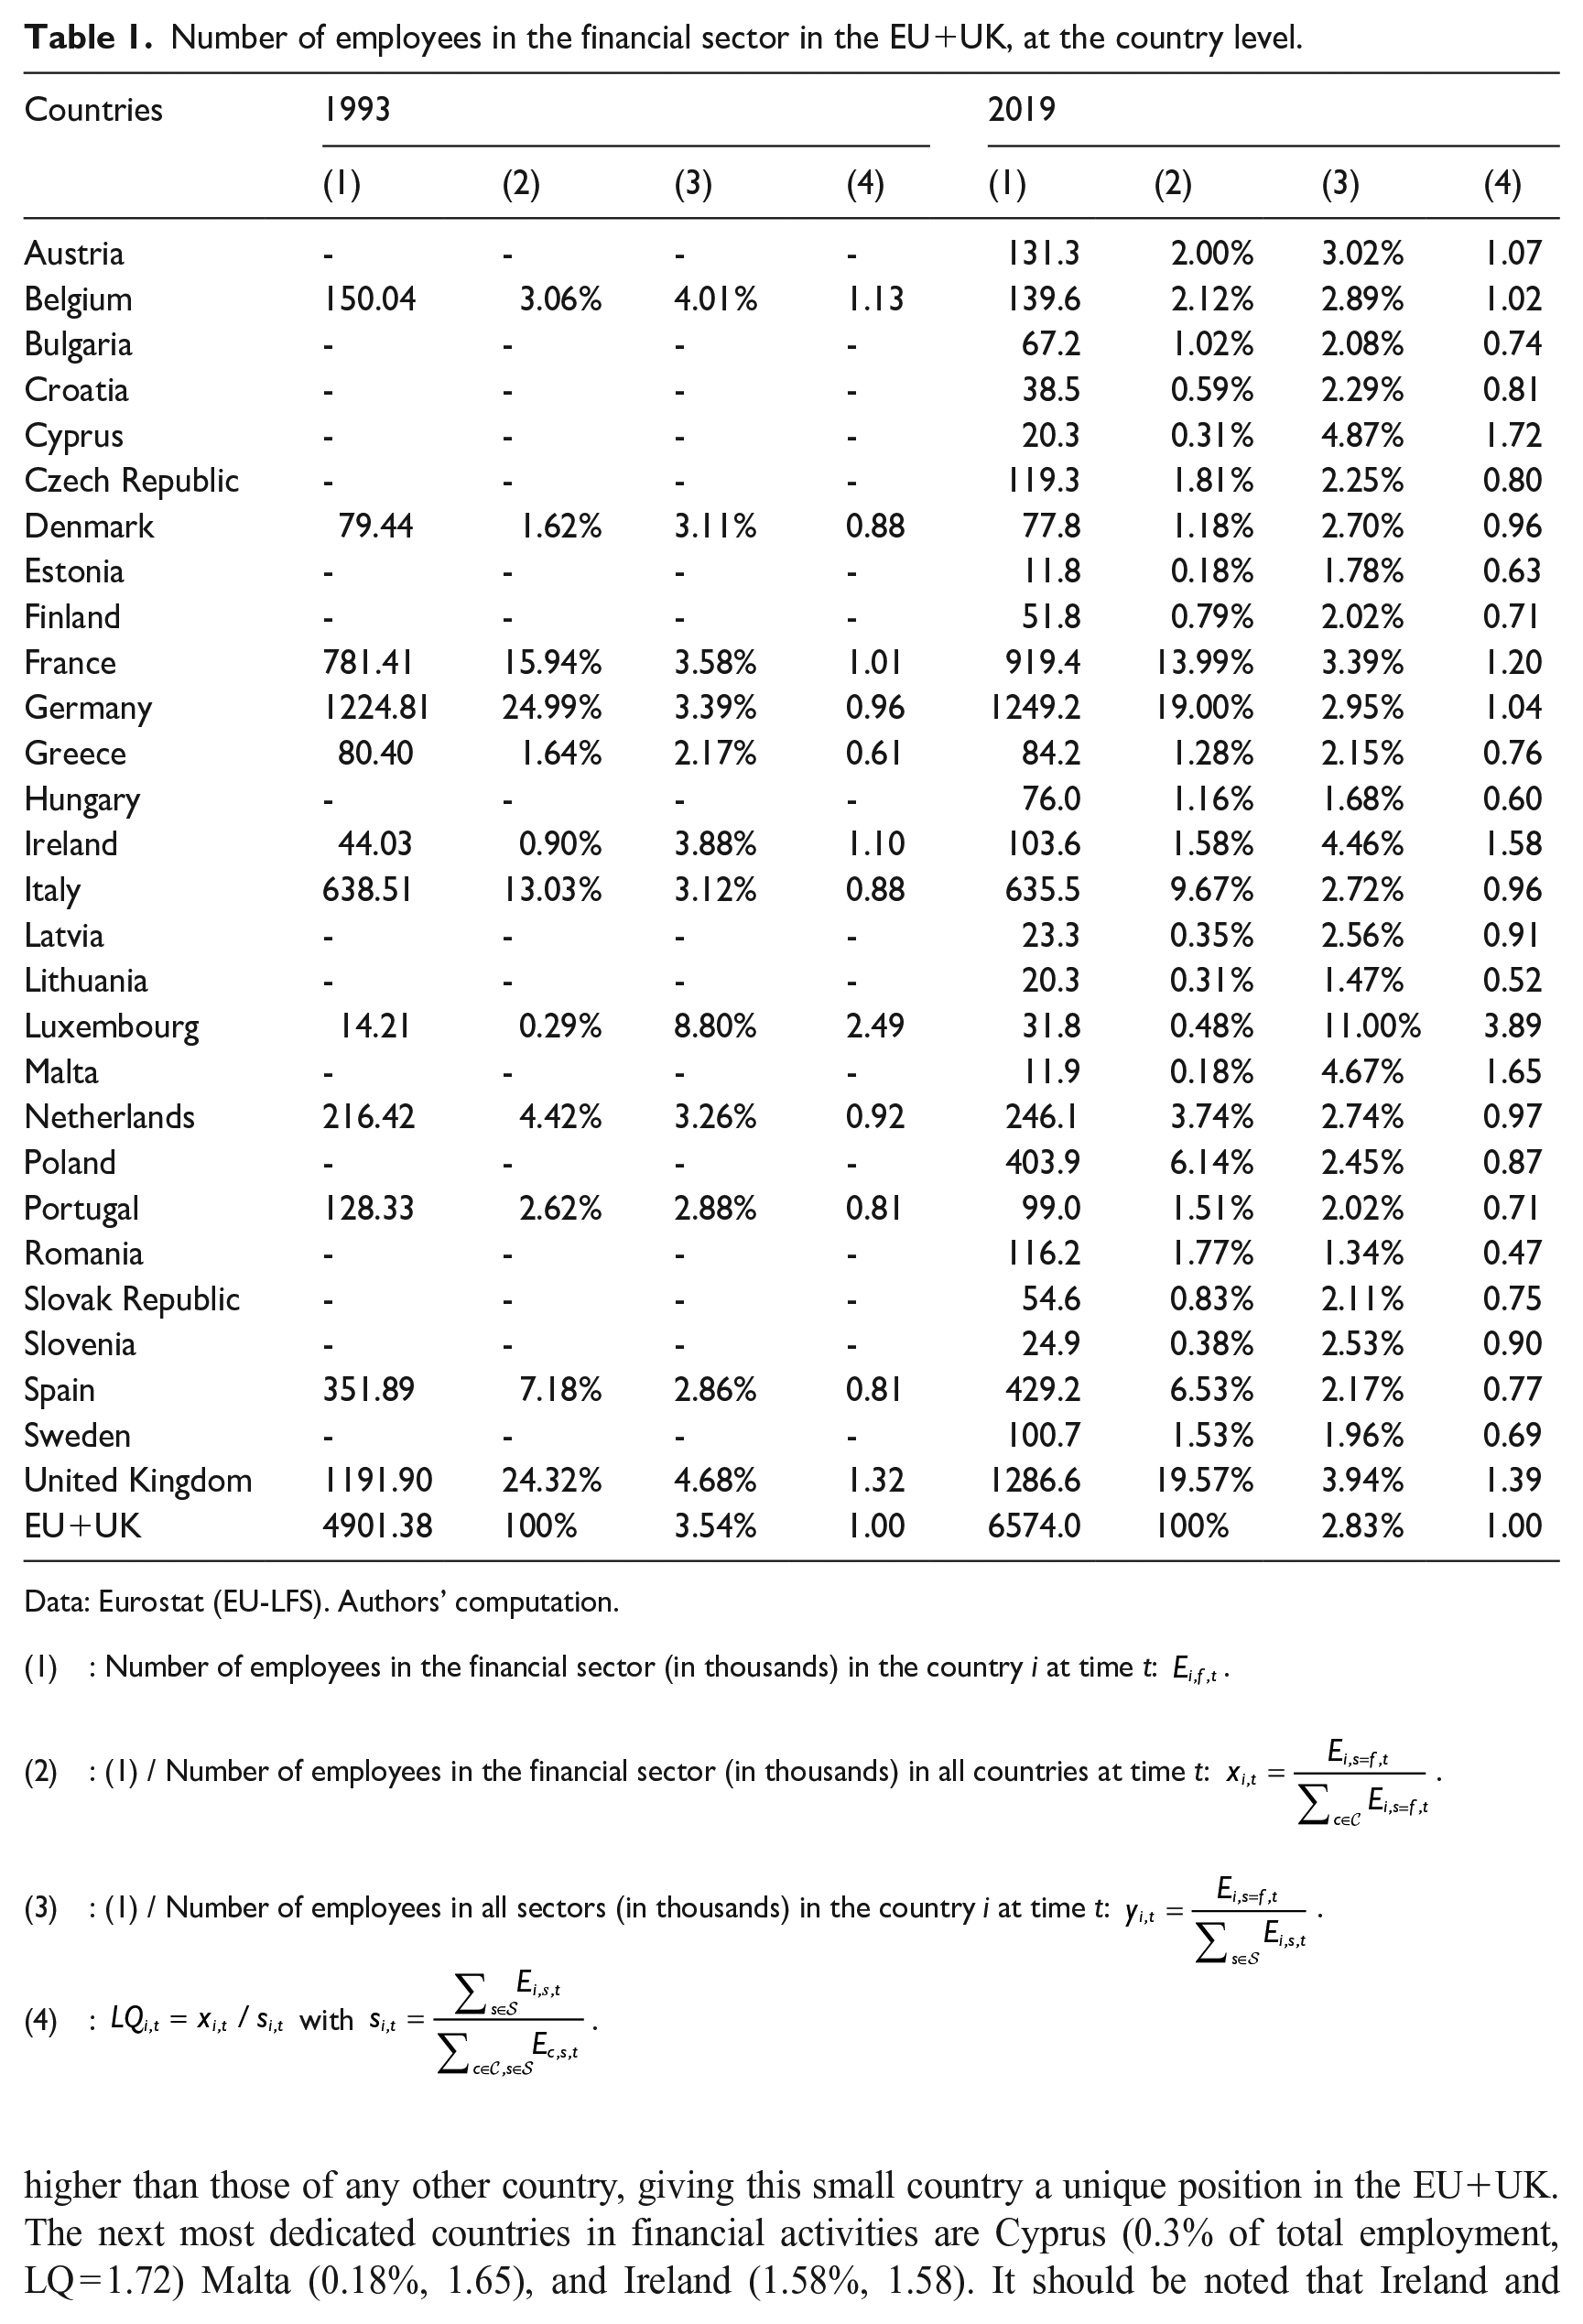
Distribution of financial sector employment in the EU+UK, at the country level
Table 1 collects a number of summary statistics about financial sector employment among countries in the EU+UK. Column 1 reports the total number of financial employees, column 2 is the share of the country’s financial sector relative to the total number of financial employees in the entire EU+UK (defined in equation (1)), column 3 is the share of the financial sector relative to the country’s total labor market size (defined in equation (2)), and the column 4 is the LQ, defined in equation (4).
Number of employees in the financial sector in the EU+UK, at the country level.
Data: Eurostat (EU-LFS). Authors’ computation.
(1) : Number of employees in the financial sector (in thousands) in the country i at time t:
(2) : (1) / Number of employees in the financial sector (in thousands) in all countries at time t:
(3) : (1) / Number of employees in all sectors (in thousands) in the country i at time t:
(4) :
In 2019, the last year before Brexit, Germany alone accounted for 19% of total financial sector employment in the EU, while the UK accounted for 19.6%. Together, these two countries account for 38.6% of total employment. France (14.0%) and Italy (9.6%) follow behind, bringing the share of financial sector employment located in the four largest countries to over 62%. Over the period 1993–2020, while the number of employees in finance remained largely stable, some countries experienced a high growth: Ireland (+154%), Luxembourg (+131%) and to a lesser extent Spain (+26%), France (+23%), and small Eastern European countries.
The above observations reflect a size effect: larger economies have larger financial sectors because they have larger everything. To correct for this size effect, we consider a relative measure using the weight of financial activities in the country’s total activities (column 3) and the LQ (column 4). In Luxembourg, financial activities represented 11% of total employment in 2019 (the orders of magnitude are identical in 1993). However, Luxembourg’s financial sector represents only 0.5% of the total workforce across all EU+UK countries. Thus, its LQ is close to 4, meaning that Luxembourg’s weight in financial activities is 4 times its weight in total economic activity. These figures are much higher than those of any other country, giving this small country a unique position in the EU+UK. The next most dedicated countries in financial activities are Cyprus (0.3% of total employment, LQ = 1.72) Malta (0.18%, 1.65), and Ireland (1.58%, 1.58). It should be noted that Ireland and Luxembourg both have implemented policies to proactively attract and cultivate financial institutions, notably through tax incentives.
The largest countries by financial employees tend to have more diversified economies, which leads to lower LQs: The UK (19.6%, 1.39), France (14.0%, 1.2), Germany (19.0%, 1.0), and Italy (9.7%, 0.96) all have LQs below well below smaller, more specialized countries noted above. Indeed, despite being considered as global or regional financial hubs, these countries have LQs very close to 1, indicating that their financial sector is neither over- nor under-sized relative to the rest of the EU.
Distribution of financial sector employment in the EU+UK, at the region level
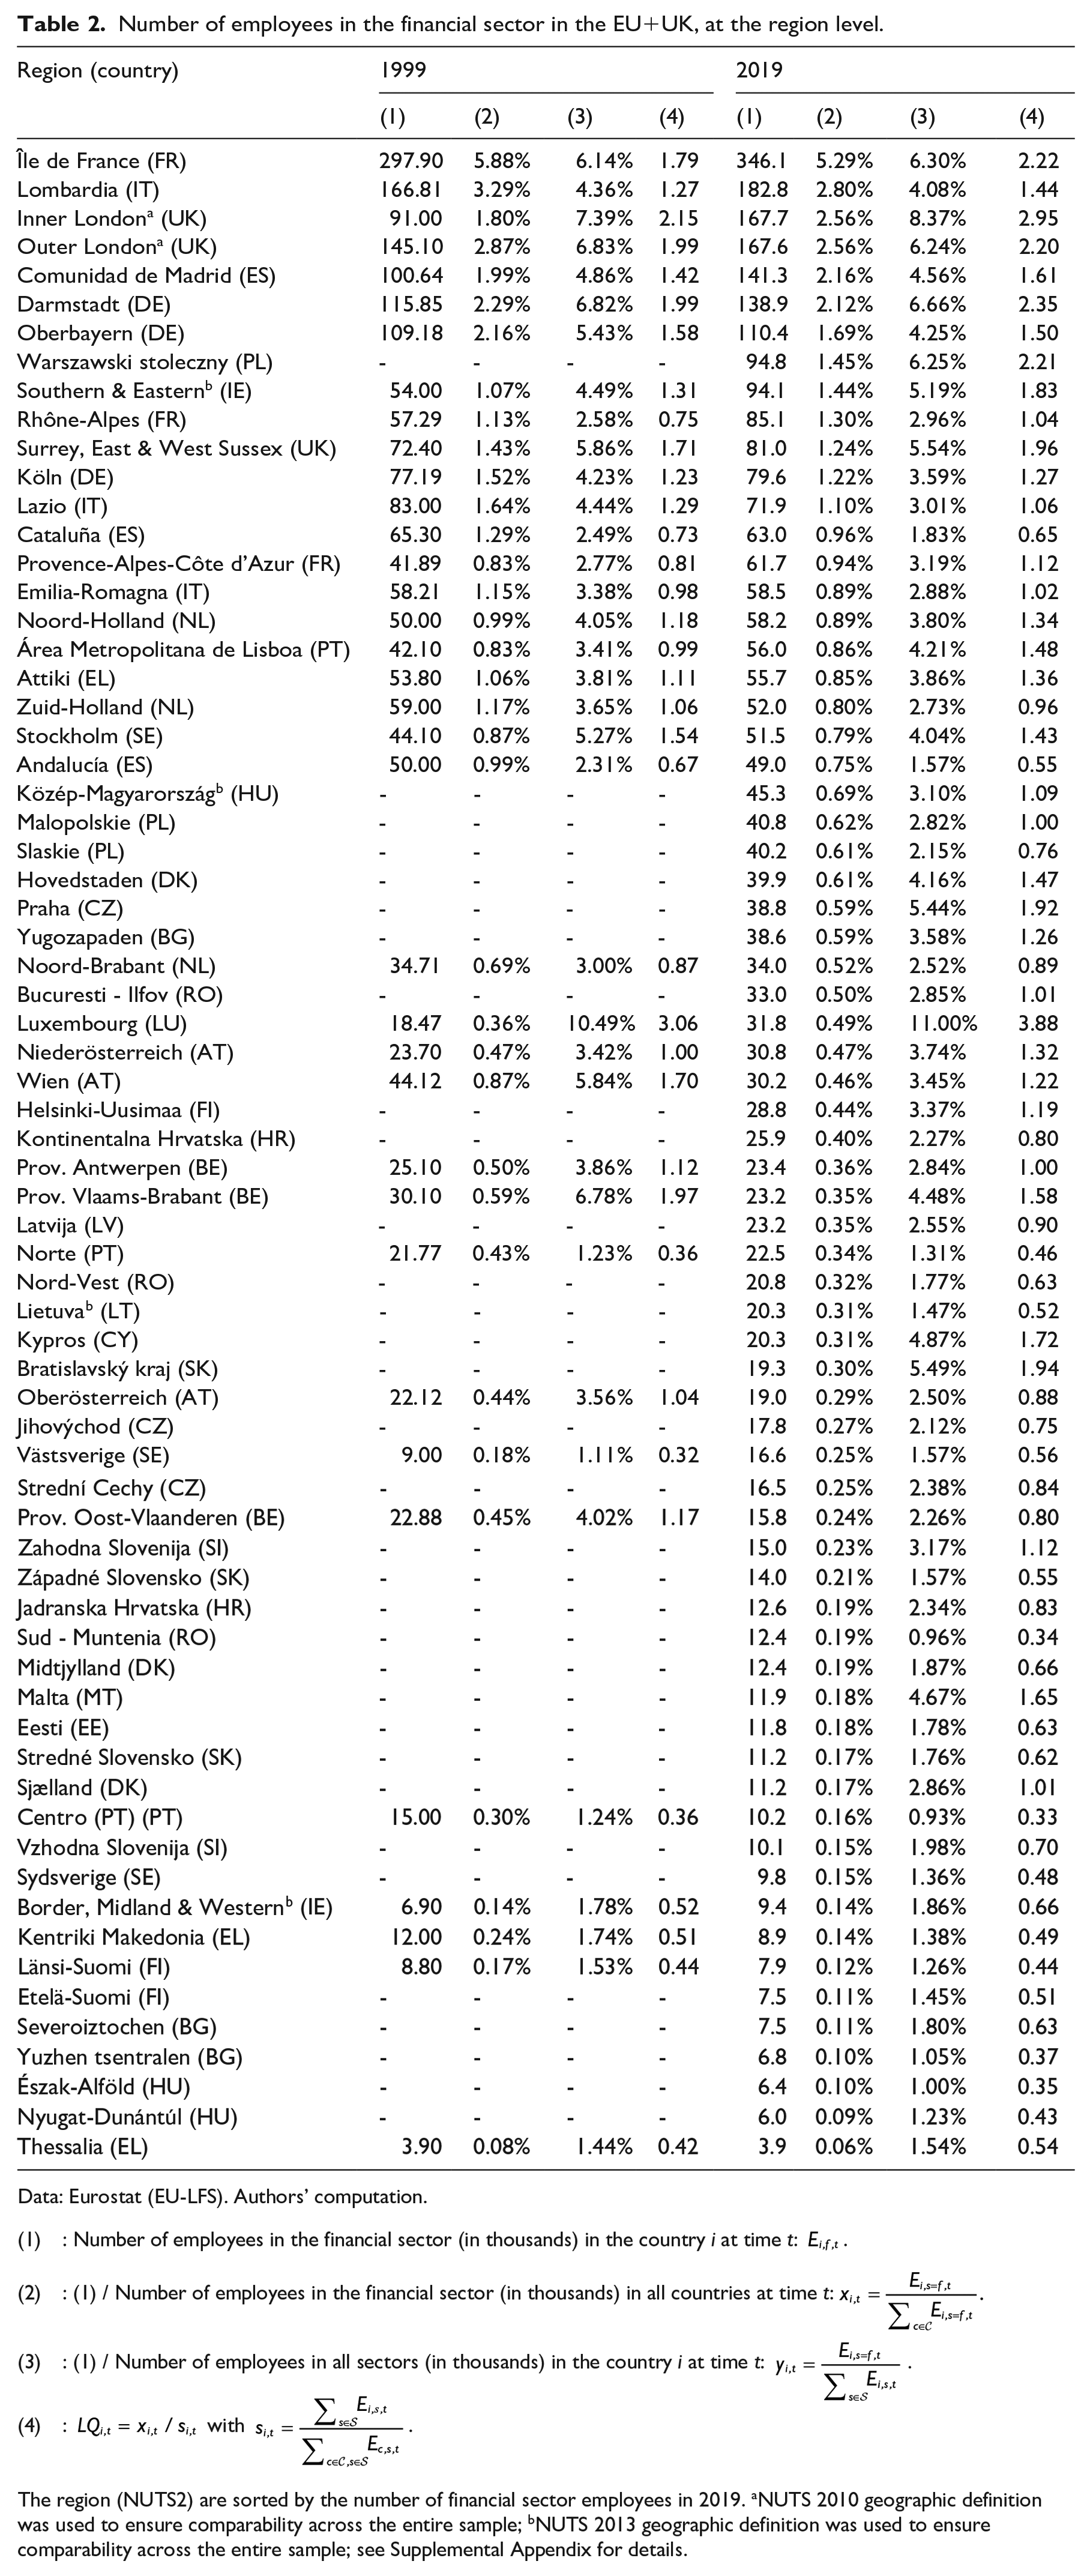
Table 2 repeats the statistics presented in Table 1 for NUTS2 sub-region units. As there are more than 200 NUTS2 units in our sample, we present only the three from each country with the highest number of financial employees in 2019. For countries with fewer than 3 sub-regions, we show all regions. Regions are then presented in order of number of financial employees in 2019.
Number of employees in the financial sector in the EU+UK, at the region level.
Data: Eurostat (EU-LFS). Authors’ computation.
(1) : Number of employees in the financial sector (in thousands) in the country i at time t:
(2) : (1) / Number of employees in the financial sector (in thousands) in all countries at time t:
(3) : (1) / Number of employees in all sectors (in thousands) in the country i at time t:
(4) :
The region (NUTS2) are sorted by the number of financial sector employees in 2019. aNUTS 2010 geographic definition was used to ensure comparability across the entire sample; bNUTS 2013 geographic definition was used to ensure comparability across the entire sample; see Supplemental Appendix for details.
The ordering in terms total financial workers did not greatly change between 1999 and 2019, with a Kendal’s Tau 0.80. The major metropolitan areas are, unsurprisingly, home to the largest number of financial workers. These include Paris (Île-de-France), Milan (Lombardia), London, Frankfurt (Darmstadt), Munich (Oberbayern), and Madrid (Comunidad de Madrid). 11 Unlike at the national level, however, these large areas are also among the most dedicated, with LQ ranging from 1.49 in Lombardia to 2.95 in Inner London. All scores in the group are above the mean 2019 a LQ of 1.1. Luxembourg (3.88) and Ireland (“Southern and Eastern,” 1.83) remain highly concentrated at this resolution, but the difference between them and the major financial hubs is greatly diminished
Concentration or dispersion: A matter of scale
The dynamics of the HH index
To assess the trends of concentration or dispersion of the financial sector and financial centers in Europe, we first use the HH index. Trends in concentration, using the HH index described in equation (3), are significantly different between the national, regional or sub-regional levels. Figure 3 illustrates this difference by plotting, at the three geographic resolutions, the HH index for the entire EU+UK. When viewed at the national level, concentration of financial sector jobs was progressively increasing until the global financial crisis, suggesting centripetal forces were prevailing. The global financial crisis appears to have halted and reversed this trend. Post 2008, national concentration decreases back to levels of the 1990s. This chart suggests that, at the national level, the global financial crisis ushered in centrifugal forces that were potentially buffeted by the sovereign-debt crisis.

The HH index of financial sector jobs in the EU and the UK, 1993-2020. “B” indicates a banking crises, while “SD” indicates a sovereign debt crisis. “E” indicates an EU enlargement. “X” marks Brexit referendum in 2016. Banking crises dates are from the System Banking Crises Database of Laeven and Valencia (2018). Banking crises refer to the UK (2007), Global Financial Crisis (2008), and Cyprus (2011). Sovereign debt crises refer to Greece (2012) and Cyprus (2013). EU enlargements include the addition of Finland, Austria, and Sweden in 1995, Cyprus, Latvia, Lithuania, Estonia, Malta, Poland, Hungary, Slovakia, Slovenia, and Czechia in 2004; Bulgaria and Romania in 2007, and Croatia in 2013. Source: EU-LFS. Authors’ computation.
Regional or sub-regional data paints an entirely different picture. When the HH index is computed from NUTS1 or NUTS2, there is no visible centrifugal force acting prior to the global financial crisis, and no obvious shift to a centripetal regime after 2007/2008. At the NUTS1 level, there appears to be a long-term centripetal trend from 1999 to 2013, but this trend is not visible at the NUTS2 level. At each resolution there is a sudden drop following the sovereign-debt crisis, which appears to trigger a centripetal regime. From 2013 to 2020, concentrations increase, and the rate of increase appears to accelerate following the Brexit vote in 2016. It seems that even as financial sector jobs become more and more spread out at the national level, within each country these jobs are becoming increasing concentrated into a few regional financial centers.
The dynamics of the LQ
To better understand the geographical dynamics of financial employment, we decompose the LQ series using a Least Square Dummy Variables (LSDV) estimator, encoding country fixed effects, year fixed effects, and a country-specific trend. Equation (5) shows the estimator. For national data, the

There is a slope and intercept unique to each country, NUTS1 region and NUTS2 region, plus time fixed effects. So there are 2*(No. country – 1) +T in the Nuts 0 (81 parameters), 2*(No. country + No. NUTS 1–2) +T in the NUTS 1 (215 parameters), and 2*(No. country + No. NUTS 1 + No. NUTS 2–3) +T in the NUTS2 (543 parameters). 12
The top panel of Figure 4 shows, for each country, the estimated values for each slope parameter
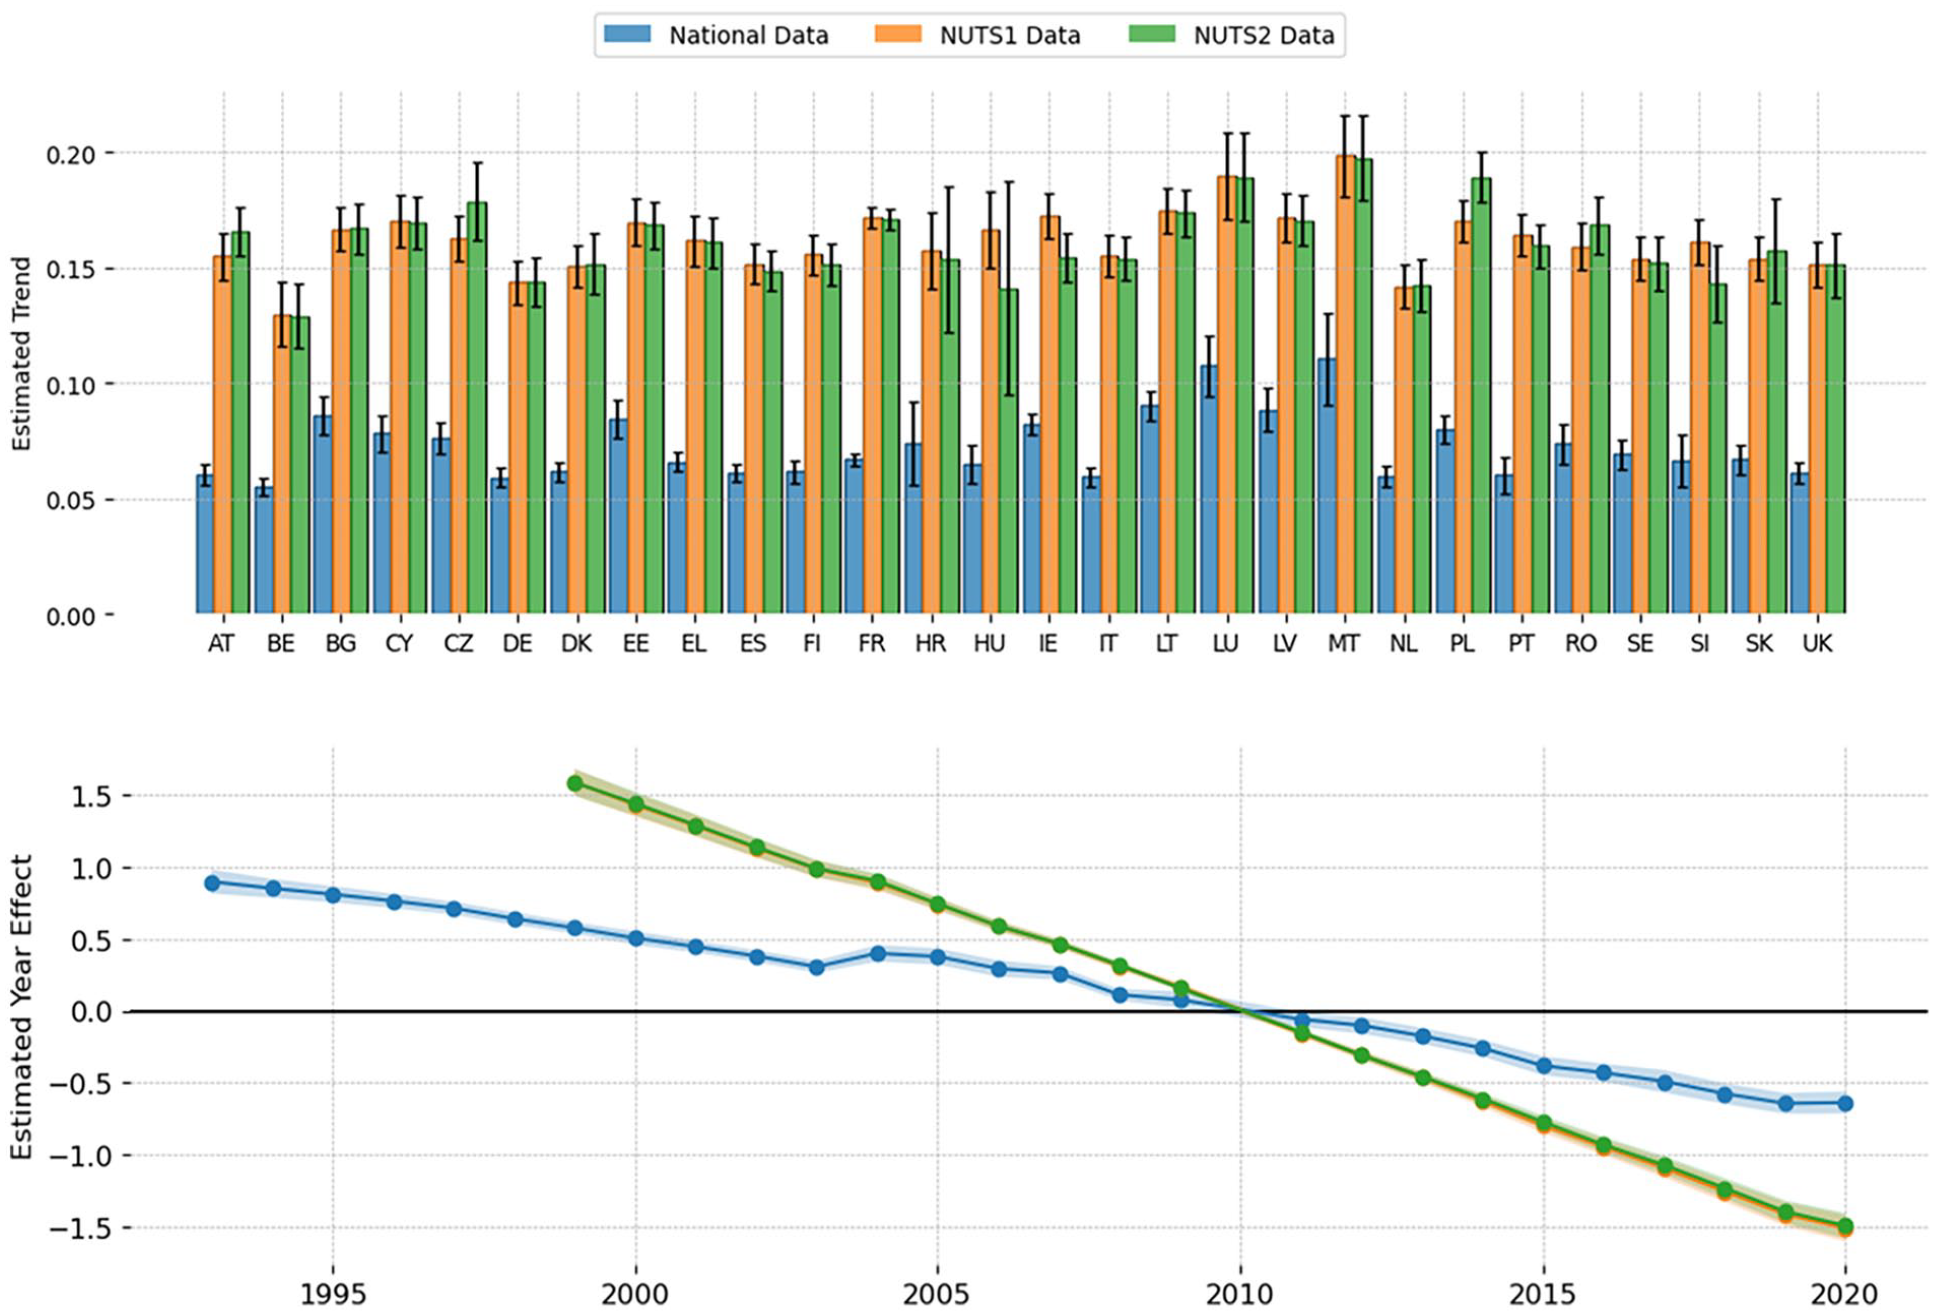
Estimated trend coefficients in concentration of financial employment in Europe, 1993–2020. Estimated linear time-trend coefficients of national/NUTS1/NUTS2 LQ (top panel) and estimated year fixed effects (bottom panel), with 95% confidence intervals. Sample: 1993/1999–2020, for 28 EU member states plus the UK. Data: EU-LFS. Authors’ computation.
With the exception of 2004, the year fixed effects (lower panel) are monotonically decreasing in all datasets, indicating that at the level of the EU+UK, there is a global centrifugal trend in financial employment, common to all regions, that appears after controlling for regional fixed effects and idiosyncratic regional trends. On the other hand, the estimated slopes of these regional trends (top panel) are positive and significant, and these trends remain whether or not we control for additional geographic fixed effects at the NUTS1 and NUTS2 levels. Although the trend in concentration is decreasing at the national level, it is increasing at the regional level.
Like our findings in section 5.1, we once again encounter a contrasting trend in concentration: centripetal at the highest geographic levels, and centrifugal at all lower levels. This suggests that, on one hand, financial centers in Europe are indeed spreading out, decreasing concentration at the national level, but they are spreading out only to a few regional financial centers, increasing subnational concentration. This makes sense, as financial services require access to business services and infrastructure that are only available in metropolitan areas.
By decomposing the LQ into trend and intercept (fixed effect) components, we can also test for correlation between a region’s level of concentration at the beginning of the sample, the intercept, and the regional slope coefficient. A positive correlation would indicate a “winners keep winning” effect, in which regions with the largest concentrations of financial employment also grow that concentration at the fastest rate. This would be consistent with a centrifugal force story. On the other hand, a negative coefficient would indicate that the largest financial centers are growing more slowly than newer centers, consistent with a centripetal force story.
The top panel of Figure 5 plots country-level slopes and fixed effects, along with a simple line of best fit, both including and excluding Luxembourg, for each dataset and model combination. In all cases, Luxembourg is an outlier. As discussed above, the LQ is sensitive to financial concentration in regions with small overall labor share. This turns out to be relevant for Luxembourg, which consistently has the highest LQ and the largest residuals in all three of the models and datasets we consider. When Luxembourg is included, there is no relationship between the slope and fixed effects. When it is removed, however, the relationship becomes negative and statistically significant. The bottom panel of Figure 5 shows a bootstrapped confidence interval for the correlation coefficient between a ’region’s idiosyncratic intercept, (

The convergence of the concentration of financial employment in Europe. Estimated country fixed effect and country-specific slope coefficients using LQ data, with lines of best fit including and excluding Luxembourg (top panel) and fixed effect-trend correlation coefficient with bootstrapped confidence interval, excluding Luxembourg (bottom panel). Sample: 1993/1999–2020, for 28 EU member states plus the UK. Data: EU-LFS. Authors’ computation
These results suggest that although financial employment is becoming more concentrated at all geographic levels, the rate of increasing concentration is slower in the most concentrated regions. As in our analysis of the HH index, the story appears to be more nuanced than a simple increase of concentration into the largest global financial centers like Paris, London, and Frankfurt. While concentration is increasing in these cities, it is doing so at a slower pace than in up-and-coming regional financial centers.
Variogram analysis
To address this issue more formally, we turn to the literature on geographic spatial processes, and especially the work of Diggle (2013). This literature makes use of the variogram, a plot of spatial distance against outcome dis-similarity, to explore the relationship between geography and an outcome of interest, in this case financial concentration as measured by the LQ. Construction of a variogram requires that data be zero mean and stationary with respect to location. To meet these criteria, we use the residuals from the regression described in equation (5). As a measure of dissimilarity, we use the metric of Mathéron (1962). Finally, to account for the fact that we do not have samples of LQ over a uniform grid of spatial locations, we group regional pairwise geographic distances into one of 20 bins, and plot the average pairwise Mathéron dissimilarity for each bin. Thus, each point on the variogram is computed as:
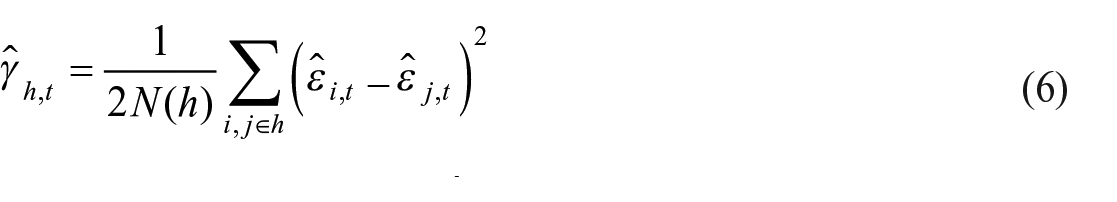
where
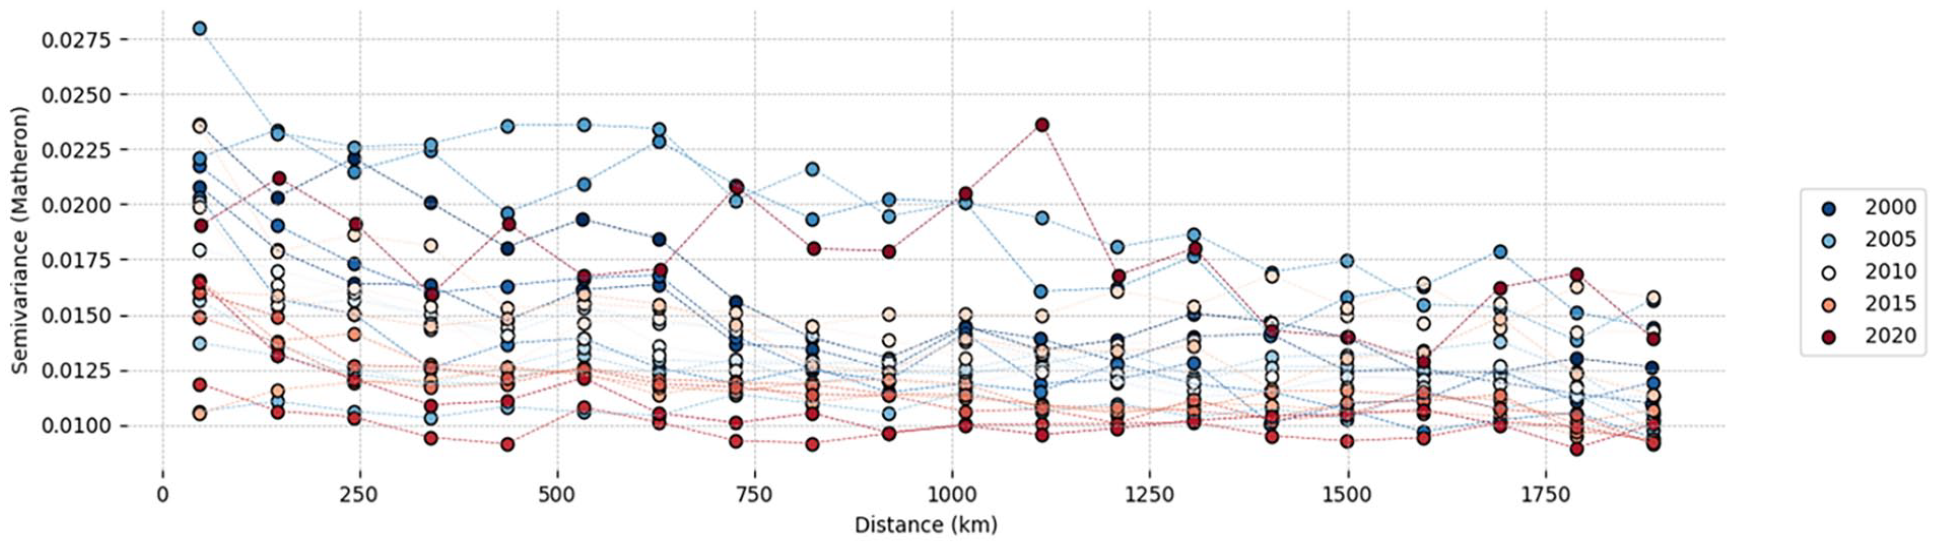
Variograms of financial concentration in the EU and UK by NUTS2 regional LQ residuals, by year. Sample: 1993/1999–2020, for 28 EU member states plus the UK. Data: EU-LFS. Authors’ computation.
Two important phenomenon are visible in Figure 6. First, unlike usual geospatial effects where closer regions are more similar, here we see that as two regions become closer, they become, on average, more dis-similar. This is evidenced by the downward sloping trend in all of the annual variograms plotted. Second, the size of this effect has been shrinking over time. The level at which the lines intersect the y-axis, the so-called “nugget effect,” decreases year after year, suggesting that over time and on average, regions have been becoming more and more similar to their neighbors.
It is important to point out that pair regions can become more similar in one of two ways: financial jobs can flow out of the relatively more concentrated region, or financial jobs can flow into a relatively less concentrated region. We previously saw evidence of the second phenomenon, where regions with a lower initial level of concentration were found have more rapidly growing concentrations than those with an initially high level of concentration. The results of the variogram analysis appear to confirm this finding. As the regions with initially low concentrations “catch up,” they become more and more similar to their more concentrated neighbors, causing the nugget of the variogram to shift downward year over year.
Discussion and conclusion
What are the trends in financial concentration in the EU? Several papers have approached this question on a country-by-country or region-by-region basis. We present the first comprehensive analysis for the entire EU+UK over a 28 year period (1993–2020), at three levels of geographic resolution, using different metrics of financial concentration. Our key finding is “it depends.”
At the level of the entire EU+UK, it appears that finance has been becoming less concentrated since the global financial crisis in 2008. More and more cities have been appearing as regional financial hubs on the Z/Yan Global Financial Center Index, and the Herfindahl-Hirschman index of financial concentration has been monotonically decreasing since 2008. But the latter is only true when computed using national level data. When regional level data is used, be it at the NUTS1 or NUTS2 level, the picture is more complex. From this view, 2008 was no turning point, and there has been a trend of increasing financial concentration since the last wave of EU enlargement in 2013.
The financial concentration of financial employment is very much dependent on the scale at which concentration is measured. Dynamics at the national level appear to be affected by the global financial crisis but not by the sovereign debt crisis, while at the regional level the reverse is true. In addition, we did not observe any change in concentration dynamics following EU enlargement. Following Brexit referendum in 2016, however, concentration scores increased significantly in well-established financial hubs. Decomposing the regional scores that comprise the HH index, we found that as we look deeper into the geographic hierarchy, fewer and fewer member states contribute to the index: from eight at the national level, to seven at the regional level, and to just five at the sub-regional level. Although we observe some evidence of increasing financial dispersion in the expansion of the GFCI, financial concentration, as measured by the HH index, appears to be holding steady or increasing. To refine the picture of where European finance is taking place, we next consider trends at the national level, by looking at the LQ.
Prior to the global financial crisis, financial jobs were increasingly concentrated at the national level, but within those countries, financial jobs were moving spreading out from historic financial centers (Capelle-Blancard and Tadjeddine, 2007). While the global financial crisis triggered a centripetal regime at the national level, within countries the trend in concentration was flat. This suggests the forces unleashed by the global financial crisis acted unevenly at the national level, but evenly at the regional level. The sovereign debt crisis, on the other hand, appears to have acted unevenly across regions, but evenly across countries. The evolution of the cities on the GFCI shown in Map 2 also support this theory of differential effects at the national and regional levels. In the years following the global financial crisis, new regional centers have emerged in countries which already hosted global or regional financial centers, including Glasgow, Hamburg, Stuttgart, Bratislava, and Berlin. Using the LQ, we have seen that high initial financial concentration is associated with a slower rate of increase.
By examining the geographic distribution of financial concentration, we seek to test the predictions of the centripetal and centrifugal force theories of financial geography. The centrifugal force theory predicts a small number of regions with extremely high concentrations, while the centripetal force theory predicts more regions of moderate concentration. Importantly, however, the centripetal force theory is silent on the question of what type of geographic distribution we should expect. On one hand, it might imply a smooth gradient of concentration away from traditional financial centers, such as Frankfurt, London, and Paris, as FABS jobs move into the suburbs and exurbs of these regions, but continue to benefit from being in close geographic proximity to the global and regional financial hubs. The concentration of capital markets in a specific region has a detrimental effect on the allocation of funds and resources (Degl’Innocenti et al., 2018). On the other hand, owing to the rise of telecommunications technology and the discontinuous space of national regulatory policy, we might expect that centrifugal forces will cause many concentrations to distributed all around the EU, but without any geographic continuity between them. In this second case, realizations from the centripetal and centrifugal processes will be extremely difficult to distinguish.
The number and attractiveness of financial centers are the result of a compromise between economies and diseconomies of scale, reflecting the intrinsic tensions between centripetal and centrifugal forces (Kotz and Schmidt, 2007). These forces are conditioned by various factors: economies of scale, critical mass effect, historical inertia, centralities (depicted in the Global City theory), existence of a global financial network, information influx, externalities of a large market, market access costs, regional development policies (Klagge and Martin, 2005), skills, knowledge and mobilization of human resources, mergers and acquisitions in the financial industry, efficiency of the business environment, localized information and complexity of information access (Gehrig, 1998).
As with all complex economic systems, what we observe on the surface obscures a turbulent and often chaotic system; a delicate dance between conflicting forces. In our case, these forces take the form of centripetal and centrifugal forces. Our work highlights the interplay of these forces not only through time, but also through scale. Future research on geographic concentration should take serious the question of what geographic resolution a given sample exists on, and think critically about what effects might be coming from above or below that resolution. Concentration is, after all, a matter of scale.
Supplemental Material
sj-docx-1-epn-10.1177_0308518X241269363 – Supplemental material for The geography of European financial centers: 1993–2020
Supplemental material, sj-docx-1-epn-10.1177_0308518X241269363 for The geography of European financial centers: 1993–2020 by Gunther Capelle-Blancard, Vincent Fromentin and Jesse Grabowski in Environment and Planning A: Economy and Space
Footnotes
Credit statement
G. Capelle-Blancard: Conceptualization, Methodology, Validation, Writing-Reviewing and Editing. V. Fromentin: Supervision, Project administration, Resources, Funding acquisition, Writing-Original draft preparation. J. Grabowski: Data curation, Software, Investigation, Visualization, Methodology, Writing-Reviewing and Editing
Declaration of conflicting interests
The author(s) declared no potential conflicts of interest with respect to the research, authorship, and/or publication of this article.
Funding
The author(s) received no financial support for the research, authorship, and/or publication of this article.
Supplemental material
Supplemental material for this article is available online.
Notes
References
Supplementary Material
Please find the following supplemental material available below.
For Open Access articles published under a Creative Commons License, all supplemental material carries the same license as the article it is associated with.
For non-Open Access articles published, all supplemental material carries a non-exclusive license, and permission requests for re-use of supplemental material or any part of supplemental material shall be sent directly to the copyright owner as specified in the copyright notice associated with the article.