
Abstract
The dust cycle can play an important role in the land–atmosphere–ocean system through interaction with biogeochemical cycles and direct and indirect radiative forcing of the atmosphere. One of the limiting factors for existing global models of dust transport, atmospheric processing and deposition is the quality and availability of data to allow evaluation and validation of emission schemes against in situ data from source regions. This review provides a critical overview of recent studies of aeolian processes from within or on dust sources, and focuses on studies dealing with retrieval of dust emission data, quantification of the contribution and variability of dust emissions from specific landforms, and the use of remote sensing data to reconcile dust storm inventories by direct comparison to dust source geomorphology. These case studies highlight significant advances in both field measurement and regional understanding of important components of the dust cycle derived through use of remote sensing data. However, recent research also demonstrates that most source regions exhibit significant spatial and temporal heterogeneity in dust emissions from candidate geomorphologies, which has direct implications for strategies aimed at inclusion of dust emission schemes at a scale relevant to climate models. To accommodate these factors and other significant scaling issues, additional research is needed to increase our quantification of a wider range of dust source types and geomorphological contexts over longer time periods.
Keywords
I Introduction
The emission of dust (also termed mineral aerosol) can play an important role in the land–atmosphere–ocean system (e.g. Field et al., 2010; Forster et al., 2007; Knippertz and Todd, 2012; Okin et al., 2011b; Ravi et al., 2011; Washington et al., 2009) through interaction with biogeochemical cycles (e.g. Gabric et al., 2010; McTainsh and Strong, 2007; Maher et al., 2010; Mahowald et al., 2009; Okin et al., 2011a; Schultz et al., 2012; Tan et al., 2011; Wientjes et al., 2011), and direct and indirect radiative forcing of the atmosphere (e.g. Mahowald, 2011; Painter et al., 2012; Shao et al., 2011a; Skiles et al., 2012). The relative impact of dust in the Earth’s system depends on characteristics such as particle size, shape and mineralogy (e.g. Kok, 2011; Mahowald et al., 2009). While these characteristics can change during dust transport (e.g. Carslaw et al., 2010) they are initially determined by the terrestrial sources from which the particles are entrained (e.g. Kohfeld and Tegen, 2007; Shao et al., 2011b; Shi et al., 2012).
Our principal means of predicting the impacts of dust emission on future weather and climate are through the use of numerical models (e.g. Knippertz and Todd, 2012; Mahowald et al., 2011; Shao et al., 2011b). However, Bullard (2010) illustrates how the relative sophistication of existing global models of dust transport, atmospheric processing and deposition (e.g. Global Model of Aerosol Processes (GLOMAP); Mann et al., 2010) outstrips the manner in which they adopt and validate emission schemes against in situ data from source regions (e.g. Lawrence and Neff, 2009; Formenti et al., 2011). Large-scale source areas for dust which have displayed a persistent emission signature have been detected and mapped using remote sensing data (e.g. Prospero et al., 2002; Washington et al., 2003). However, the inherent spatial and temporal heterogeneity of sources in terms of potential controls on dust fluxes and dust chemistry is often poorly constrained at the scale of these remote sensing observations (e.g. Bullard et al., 2011; Mahowald et al., 2007; Zender et al., 2003). Huneeus et al. (2011) summarize some of the limitations of dust models, including their spatial and temporal constraints, disparities in dust emission calculations, and understandable bias in output estimates of aerosol burden and size distribution. Belnap et al. (2011) emphasize the importance of improved understanding of links between fluvial and aeolian processes (emphasizing fluvial controls on dust emission and dust transport) and highlight the need to work at a range of scales across disciplines in order to constrain key processes and feedbacks; a factor also echoed by Shinoda et al. (2011) in their review of dust emissions from temperate grasslands (see also Marcella and Eltahir, 2010).
There are a number of recent comprehensive reviews of the dust cycle (e.g. Bullard, 2013; Maher et al., 2010; Ravi et al, 2011; Shao et al., 2011b; Shi et al., 2012) which highlight both its importance and its complexity. The purpose of this progress report is to focus on recent advances that have taken place within the context of dust source processes, and to focus upon recent approaches that have been utilized to quantify the dust emission process at a range of scales. In attempting to address the range of scales at which observations have been made, this report will investigate three principal aspects of recent research: (a) use of remote sensing data that might allow us to reconcile dust storm inventories with source geomorphology; (b) observations of dust emissions and flux measurements within source or on source regions; and (c) improved quantification of the contribution and natural variability of dust emissions from specific geomorphic surfaces, and understanding of how these sources impact on the temporal variability in regional dust emissions. Given the nature of this report, the use and interrogation of recent research in these areas, although deliberately selective, is aimed at focusing on specific advances and informative case studies from dust source regions. The approximate locations of case studies mentioned in the next three sections are summarized in Figure 1.
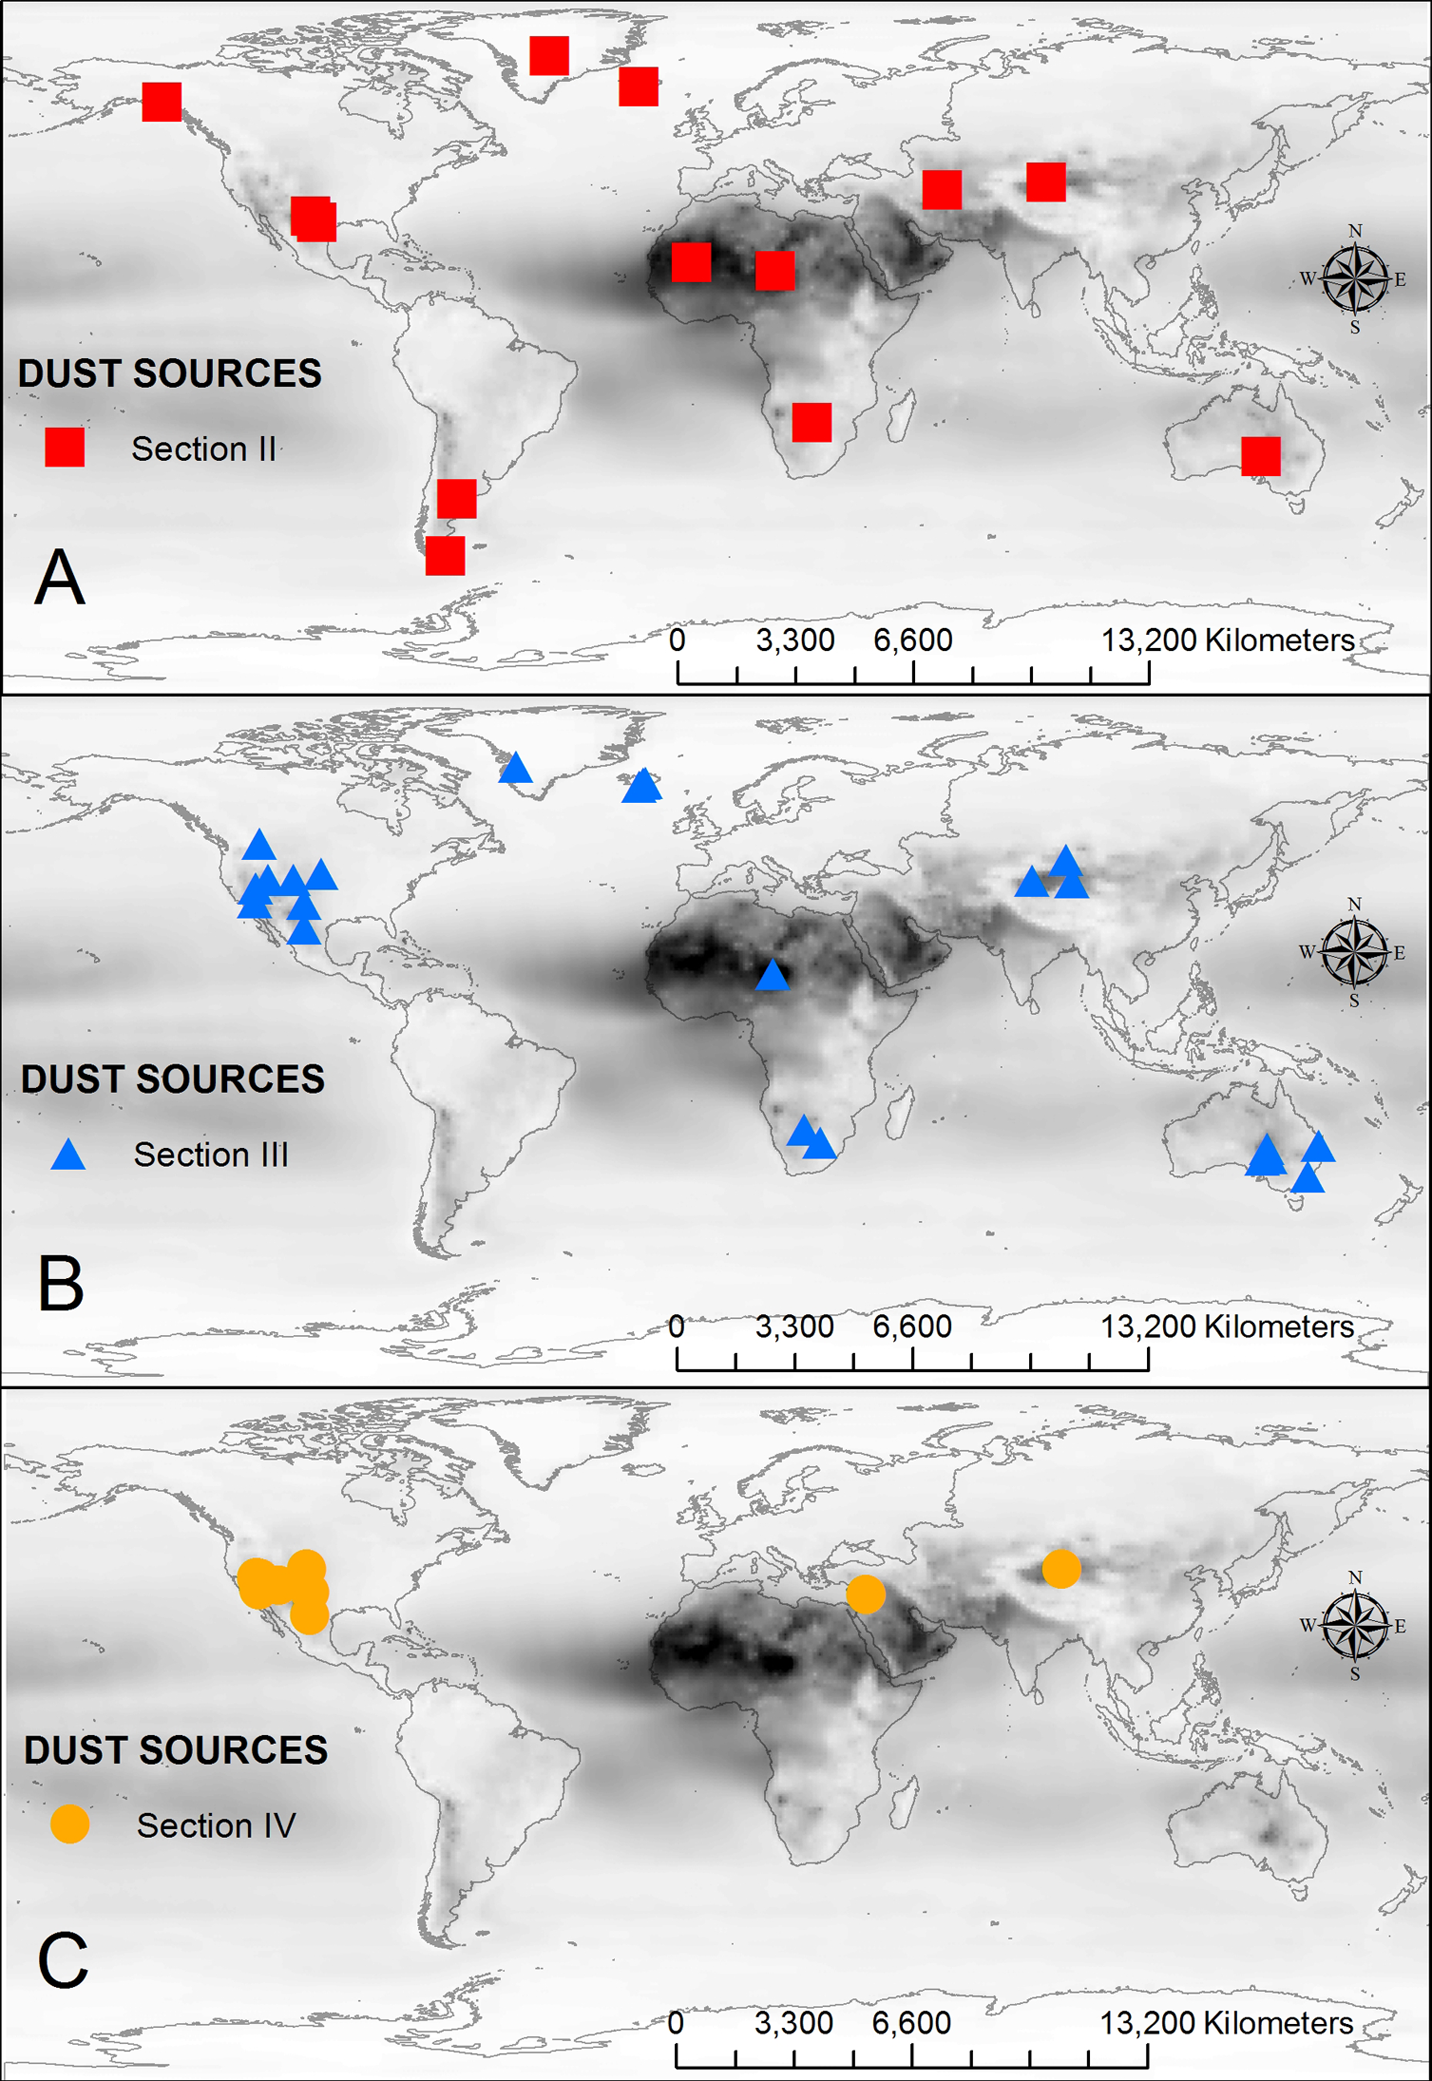
Approximate global distribution of case studies that are either mentioned or discussed in sections II (A), III (B) and IV (C) of the manuscript overlain on the long-term monthly average TOMS Aerosol Index values (Prospero et al., 2002, v8 for the period 1980–1992). As can be seen, the number and distribution of recent process studies focused upon the relative emissive nature of surfaces in source regions is largely restricted to southwest North America. Where possible, an expansion of this sampling approach to include other dust hot spots and source regions should be a key research priority.
II Mapping and monitoring of dust storm events and locations
At the global scale, remote sensing data (e.g. Total Ozone Mapping Spectrometer (TOMS); Prospero et al., 2002; Washington et al., 2003; and more recently Ginoux et al., 2010, 2012) have been instrumental in allowing sources of dust, and aspects of their behaviour over time, to be identified, albeit at a spatial scale that precludes straightforward comparison with field-derived data (e.g. Alonso Pérez et al., 2012; Bryant et al., 2007; Koven and Fung, 2008). For example, Ginoux et al. (2012) present a detailed synthesis of global-scale high-resolution (0.1°) dust source locations based on MODIS (Moderate Resolution Imaging Spectroradiometer) estimates of dust optical depth. Alongside global gridded MODIS Deep Blue aerosol measurements (Hsu et al., 2004, 2006), these workers have utilized ancillary data (e.g. land use) and have suggested that natural dust sources globally account for 75% of emissions, with anthropogenic sources accounting for the remaining 25%. Regionally, they found that North Africa accounted for 55% of global dust emissions with only 8% being anthropogenic, whereas anthropogenic dust emissions were much higher in other regions (e.g. 75% in Australia). While these headline figures are extremely important to consider, it is clear that the work of Schepanski et al. (2007) and others, principally using geostationary Meteosat Second Generation (MSG) Spinning Enhanced Visible and InfraRed Imager (SEVIRI) data with an approximately 15-minute sample rate (see Figure 2), has quantified some of the spatial and temporal bias inherent in remote sensing data of this type and scale (e.g. TOMS/MODIS have overpass times that may observe dust in transport rather than at the point of emission). Studies using MSG-SEVIRI in northern Africa point towards a series of approaches that may be taken to match remote sensing data of dust storm events or more generally ‘dustiness’ to the temporal signature of meteorological drivers of emission (see Ashpole and Washington, 2012; Schepanski et al., 2009, 2012). However, these data are not available for all dust source regions, and it is clear from the recent literature that a number of workers have also expended considerable effort to use remote sensing data from globally available MODIS and similar polar orbiting sensors alongside station meteorological records to record regional inventories of spatial and temporal variability in dust storm locations (e.g. Abdi Vishkaee et al., 2011; Walker et al., 2009). While care clearly has to be taken in order to account for (1) performance of dust detection algorithms with varying dust thickness, height and mineralogy (e.g. Baddock et al., 2009), (2) aforementioned lags that may exist between the timing of satellite overpass and dust emission, (3) cloud and water vapour effects, and (4) subjectivity in identifying events and pinpointing dust storm emission locations (e.g. Baddock et al., 2009; Brindley et al., 2012), these approaches have enabled a number of researchers to seek to link the geomorphological context and dust emission event locations within source regions using similar approaches. Examples of the data used in this manner are provided in Figure 2, and recent examples of this work that have emanated from dust sources in North Africa, the Gulf of Alaska, Iceland, Australia, Asia and southern USA/Mexico (see Figure 1) are detailed below.
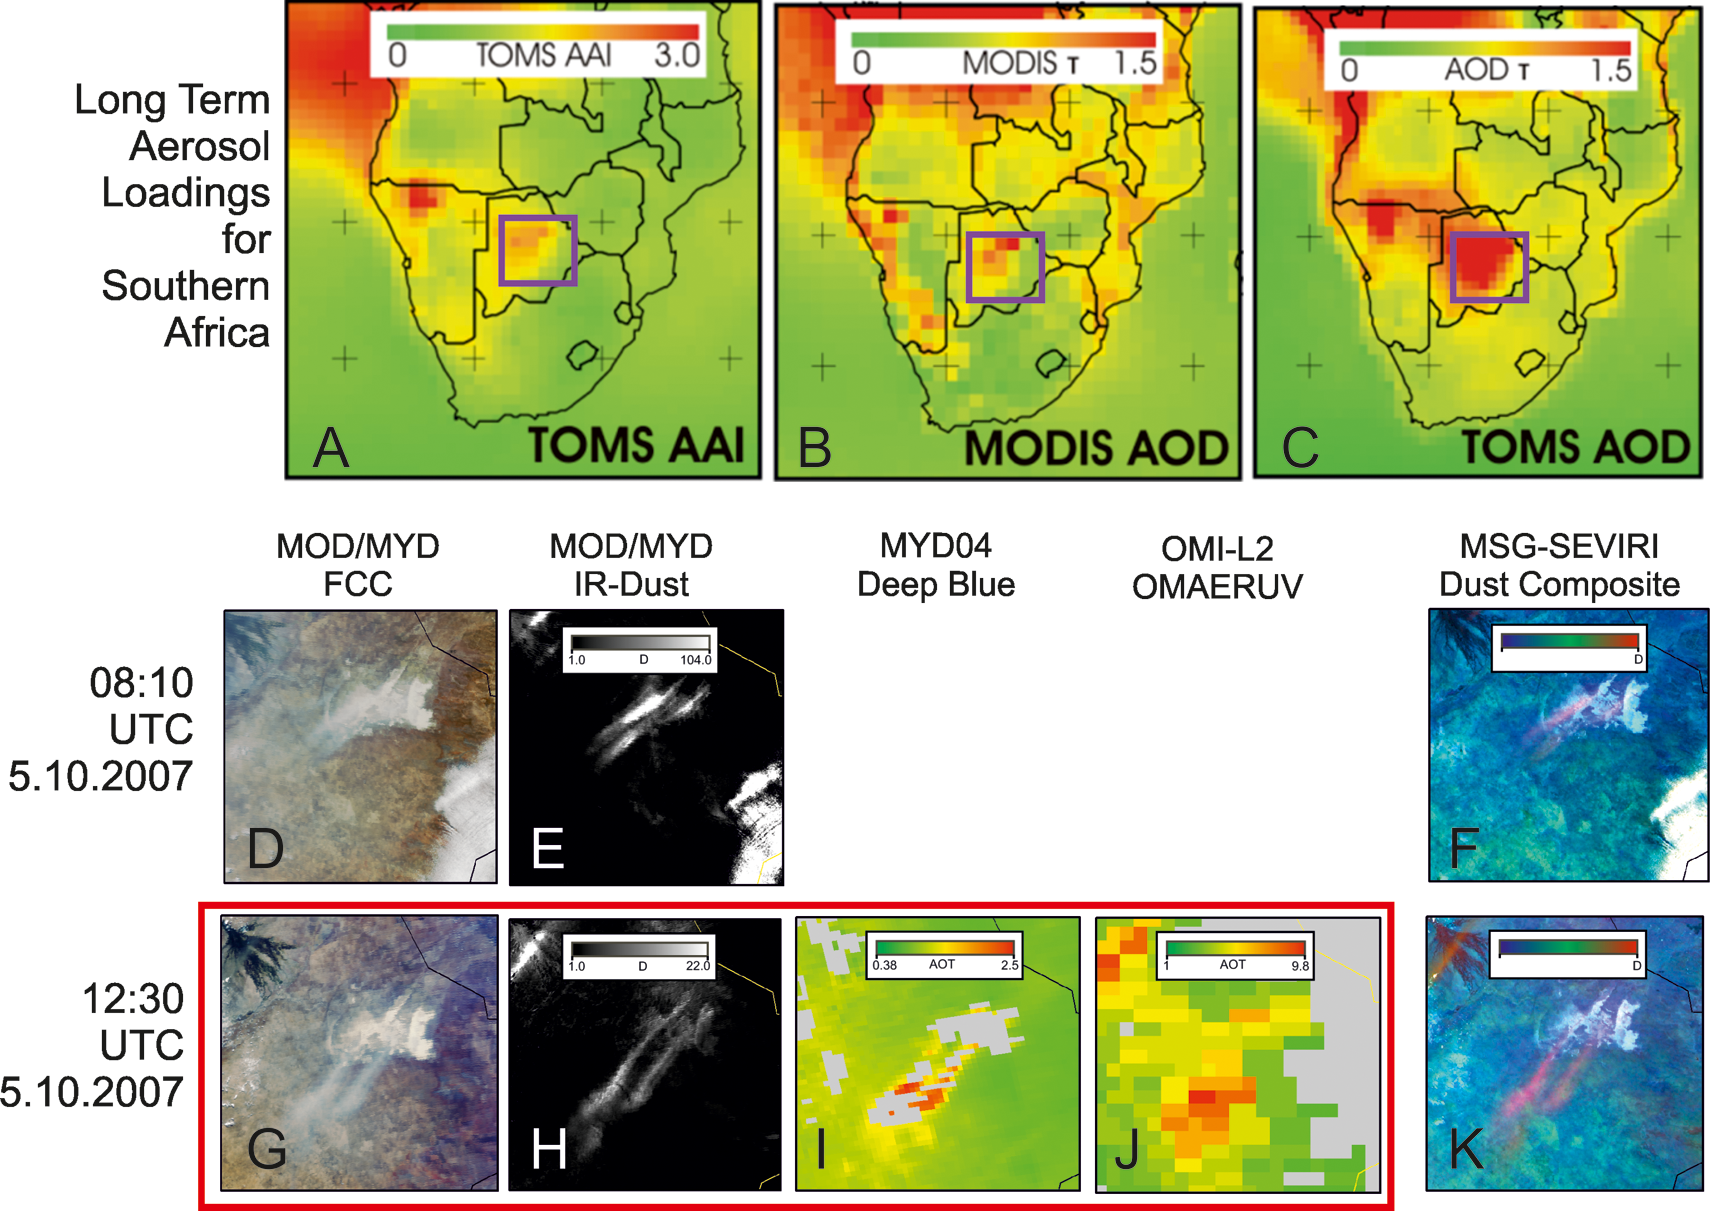
(A), (B) and (C) show typical global aerosol data for southern Africa (Makgadikgadi Pans, Botswana, are indicated by the purple rectangle), and highlight the gulf in scale that exists between those data that enable dust source detection and those that depict dust events and source locations (see Bryant et al., 2007, for further details). (D) and (E) depict typical MODIS Terra detection of a dust storm emanating from the Makgadikgadi Pans (see Baddock et al., 2009, and references therein for methods). (D) is a true colour composite (1 km bands 13, 12 and 10 as RGB). (E) highlights dust detection using the Thermal Infrared Red. (F) provides an example of comparable detection of the same event via MSG-SEVIRI (where dust is depicted as pink). (G) and (H) show the same event captured later in the day by MODIS (Aqua) and the A-Train constellation of satellites (outlined by the red rectangle). This time slice provides additional calibrated dust event detection and quantification using the MODIS-Deep Blue Algorithm (I) (Ginoux et al., 2010, 2012) and OMI (J). MSG-SEVIRI also captures this event (K). It is clear from this example that observations at different times of day can involve both different suites of data, and different degrees of source characterization. MSG-SEVIRI data, although not available globally, have the advantage of comparable spatial and spectral resolution to MODIS and are able to sample these events with an approximately 15-minute sample interval.
As mentioned previously, significant efforts have been made to use MSG-SEVIRI data products to elucidate dust source location in northern Africa (e.g. Schepanski et al., 2007; 2009, 2012). Generally, these data build significantly on observation made using TOMS (e.g. Prospero et al., 2002) and MODIS (e.g. Ginoux et al., 2012), but only broad inferences have been made concerning the geomorphic implications of mapped dust source locations. However, recent research by Crouvi et al. (2012) highlights how source locations in this region might be linked to broad geomorphic zones. Interestingly, in the study period (2006–2008) they found that approximately 90% of observed dust storms and high wind speeds could be spatially linked to sources such as active sand dunes, leptosols, calcisols, arenosols, and rock debris. From these data, Crouvi et al. (2012) have proposed sandblasting, which removes sharp corners and clay coatings from sand grains, as the dominant dust-emission mechanism for sources associated with extensive sand-rich regions of the Sahara.
In East Asia, Waggoner and Sokolik (2010) used MODIS data and soil textural information to determine seasonal dynamics of dust source regions. Although they were able to provide some insights into source behaviour, they found that their remote sensing time series of five months was too short to fully observe the seasonal and interannual behaviour of the dust-emitting regions, and thereby uncover any detailed interaction with regional climate. Abdi Vishkaee et al. (2011, 2012) used a combination of MODIS data, ground-based AErosol RObotic NETwork (AERONET) data, Light Detection And Ranging (LiDAR) data, reanalysis data and regional meteorological records to determine processes leading to dust emission over Syria and Iraq, in response to a strong winter Shamal event (22–23 February 2010) as well as the subsequent transport of dust over Iraq and northwest Iran. During this event, it was possible to detect and map significant uplift and transport of dust from dry lakes at the western edge of the Dasht-e Kavir desert and regions of Syria and northern Iraq. Within the Sistan region of Iran, Rashki et al. (2012) also used a combination of remote sensing data (Ozone Monitoring Instrument (OMI), TOMS and MODIS), meteorological observations (visibility, wind speed/direction, dust storm duration) and passive dust samplers to constrain dust emissions from the Hamoun source region (located on the borders between Iran, Pakistan and Afghanistan). The authors note that severe drought has caused desiccation of the Hamoun lakes in the post-1999 period, making the basin one of the most active sources of dust in southwest Asia, although work by Middleton (1986) suggests that it has been a significant dust source for a much longer period. From this study, remote sensing data were clearly able to highlight the Hamoun Lake as a regional hot spot for mineral aerosol emissions. While this study falls short of interrogating this playa lake source in any further detail, the authors were able to note significant spatiotemporal variability in regional dust loadings associated with their dry lake sources. For some of the largest dust storms (duration >40 hours), they observed significant dust concentrations (>2 kg m−2 TSP) approximately 30 km downwind of the source. They also noted that air quality in the town Zabol, near to the sources, exhibited air pollution levels that exceeded national air quality standards (PM10 >155 μg m−3; where PM10 is particulate matter suspended in air with an aerodynamic diameter of up to 10 µm) for 61% of the sample period between September 2010 to July 2011.
VanCuren et al. (2012) used a combination of time/size-resolved aerosol samples from Summit Station, Greenland, alongside detailed air mass trajectory analyses to provenance aerosols transported to the Arctic. They found that three major aerosol types were present in their samples: mineral, combustion, and a well-mixed Arctic background. Furthermore, they were able to extract geochemical signatures for Asian and Saharan dust from their mineral aerosol samples. For one recorded event at this site on 17 March 2006, the combined use of OMI data and back trajectories enabled the identification of a specific contributory north African dust event; although the actual source of this event within the region was unidentified. Crusias et al. (2011) used meteorological data sets and a range of MODIS remote sensing products to examine source regions of dust, hydrologic and meteorological controls on dust plume formation, scales of transport, and the seasonality of dust inputs into the Gulf of Alaska. They have observed substantial fluxes of glacial flour–derived dust transported annually and perhaps more frequently from sediment deposits of the Copper River and other nearby rivers. They found that most events occurred during autumn when decreasing water levels expose sediment and strong winds blow over riverbed sediments derived from glacial river valleys. Arnalds et al. (2012) and Thorsteinsson et al. (2011) also utilized MODIS data to pinpoint plume locations on Iceland, and have attempted to relate events to specific geomorphologic surface types. Arnalds (2010) had previously mapped the major dust source regions within Iceland, and found that dust emissions result from frequent high wind speeds combined with large sandy desert areas that are susceptible to wind erosion, and therefore Thorsteinsson et al. (2011) were able to use imagery and trajectory analysis to track the specific dust source locations which impacted on air quality in the Reykjavik region. Prospero et al. (2012) also utilized MODIS and Sea-viewing Wide Field-of-view Sensor (SeaWIFS) data in order to validate dust flux measurements made in southern Iceland, and were able to constrain source locations consistent with those highlighted by Arnalds (2010). Collectively, their observations concur with those of Crusius et al. (2011) in that they observe that many of the plume areas are associated with surfaces that are subjected to frequent flooding (e.g. proglacial lakes and sandur floodplains). From these studies, the association of dust plume locations with areas that were found to be subjected to frequent or past flooding is also consistent with dust observations made at regional and global scales (e.g. Washington et al., 2003).
Using a combination of Geostationary Operational Environmental Satellite (GOES) and Polar Operational Environmental Satellite (POES) data, Lee et al. (2009) and Rivera Rivera et al. (2010) were able to examine the context of Chihuahuan Desert dust outbreaks observed between 2001 and 2009. In particular, they were able to monitor the detailed contribution of dust emissions from playas, agricultural land and the edges of agricultural land, which were identified as focus areas for dust emissions in the region during the most intense events. Baddock et al. (2011a) provide further levels of geomorphological context for these data. While these data are semi-quantitative, depicting plume location and not dust fluxes, they have found that although ephemeral and dry lakes cover only a small proportion of the region (<4%) they account for nearly half (48%) of the dust plumes in the Chihuahuan Desert (see also Lee et al., 2009). In contrast to this, only 21% of the dust plumes mapped were found to be associated with high relief alluvial systems. Using MODIS data (and methods described in Baddock et al., 2009, and Lee et al., 2009), Lee et al. (2012) used a similar approach to determine geomorphic and land cover characteristics of aeolian dust sources in West Texas and eastern New Mexico, USA. Importantly, in this instance, they have found that most of the observable dust plumes originated from anthropogenically disturbed lands, and they have therefore argued that human modification of the landscape is a significant driver of dust emission in the region.
The regional significance of dust emissions and transport in the Southern Hemisphere are discussed in detail by Li et al. (2008). They have used a modelling approach to suggest that dust deposition in this region is dominated by emissions from sources in Australia (see also Gabric et al., 2010), Patagonia and, via inter-hemispheric transport of dust, from the Northern Hemisphere. In southern South America, Gasso et al. (2010) also studied dust emission and transport pathways using combined and complementary use of satellite retrievals (e.g. Multiangle ImagingSpectroRadiometer (MISR), MODIS, POLarization and Directionality of the Earth’s Reflectances (POLDER) and OMI), a transport model simulation (e.g. Hybrid Single Particle Lagrangian Integrated Trajectory Model (HYSPLIT)), surface observations near the sources, and aerosol measurements from Antarctica. For two specific emission events, their careful analyses successfully pinpointed plumes that emanated from dry lakes along the coast of Tierra del Fuego and from the shores of the Colihue Huapi Lake in Central Patagonia. These observations of dust source activity matched closely areas of contemporary aeolian activity in this region mapped by Zárate and Tripaldi (2012). Importantly, this work also highlighted the potential limitation of using any of these approaches individually to characterize sources and transport corridors for dust in heavily clouded regions (see also Gasso and Stein, 2007).
Based upon initial work in the Lake Eyre Basin and the Chihuahuan Desert (e.g. Bullard et al., 2008; Lee et al., 2009), Bullard et al. (2011) have proposed and tested a generic, robust framework for the geomorphological classification of dust sources, and suggest this as a basis for dust source characterizations within regional climate models. They combined observations of dust storm/plume frequency from a number of source regions with a simple geomorphological scheme, and have provided an initial comparative analysis of emission characteristics, with additional estimates for sources in the Sahara and Taklamakan. Clearly, in attempting to constrain geomorphological controls on dust emission at the sub-basin scale, their approach has allowed initial links to be made between our understanding of spatial trends in the dust emission potential of surfaces, and concepts such as their known temporal attributes with regard to, for example, being either supply-limited (i.e. relating to the availability or otherwise of sediment of a suitable grain size for saltation or emission) or transport-capacity-limited (i.e. relating to the sediment-carrying capacity of the wind at any given time; Bullard et al., 2008; Kocurek and Lancaster, 1999). To provide a comparison of dust emissions from geomorphological units for the Lake Eyre Basin (LEB) and the Chihuahuan Desert (CD), they calculated the relative number of plumes per km2 emanating from each geomorphic type in the CD and LEB. For example, in comparing the regions, they observed twice as many dust plumes from sand dunes in the LEB as in the CD, perhaps reflecting differences in the history and activity status of the dunes, and three times as many plumes from ephemeral lakes in the CD as in the LEB, possibly reflecting differences in the hydrology, chemistry and/or sedimentology of these lakes. Bullard et al. (2011) have made great strides in improving the current prescription of preferential sources in dust-cycle models, but they have also noted that an important component of the dust emission process which is perhaps hard to constrain through remote sensing and geomorphological classification alone is the relationship that may exist between potentially emissive surfaces (e.g. playa lakes or palaeo lake surfaces) and availability (or otherwise) of an upwind source of saltating sand that bombards the surface, thus liberating dust-sized particles (Baddock et al., 2011b; Houser and Nickling, 2001a; Macpherson et al., 2008).
III Monitoring of dust emissions and dust flux measurements both on and downwind of source regions
Process monitoring and flux measurement both on and downwind of dust sources often have to account for significant spatial and temporal variability in dust emission frequency and magnitude (e.g. Goudie and Middleton, 2001; Middleton et al., 1986). Notable examples of field approaches used to characterize dust entrainment on sources and transport pathways from them include studies of: (1) measurements made on dust sources of real-time saltation flux measurements, allied with wind profile and ambient dust monitoring (e.g. Gillette et al., 2004; Niemeyer et al., 1999; Washington et al., 2006; see Figure 3 for examples of typical instrumentation); and (1) dust deposition and estimates of dust fluxes downwind from source regions (e.g. Reheis, 2006; Reheis and Kihl, 1995; Reheis et al., 2009) derived through careful field instrumentation and data collection using passive dust traps, the relative efficiencies of which are discussed by Goossens and Offer (2000), Sow et al. (2006) and Goossens and Buck (2012). However, Bullard (2010) and Shao et al. (2011a) have indicated that the number of studies in which data of this nature have been collected and collated are relatively few, and they also suggest that most source regions are relatively under-represented (see also Lawrence and Neff, 2009). The increasing volume of recent research in the last few years suggests that some of these issues are being addressed, thereby providing insights into a wider range of dust source surface types and associated processes and emission scenarios. To explore some of these advances, results from a selection of recent regional case studies are reported here which involve investigation of both point-source and regional dust emissions and fluxes from specific source regions (see Figure 1B for locations).
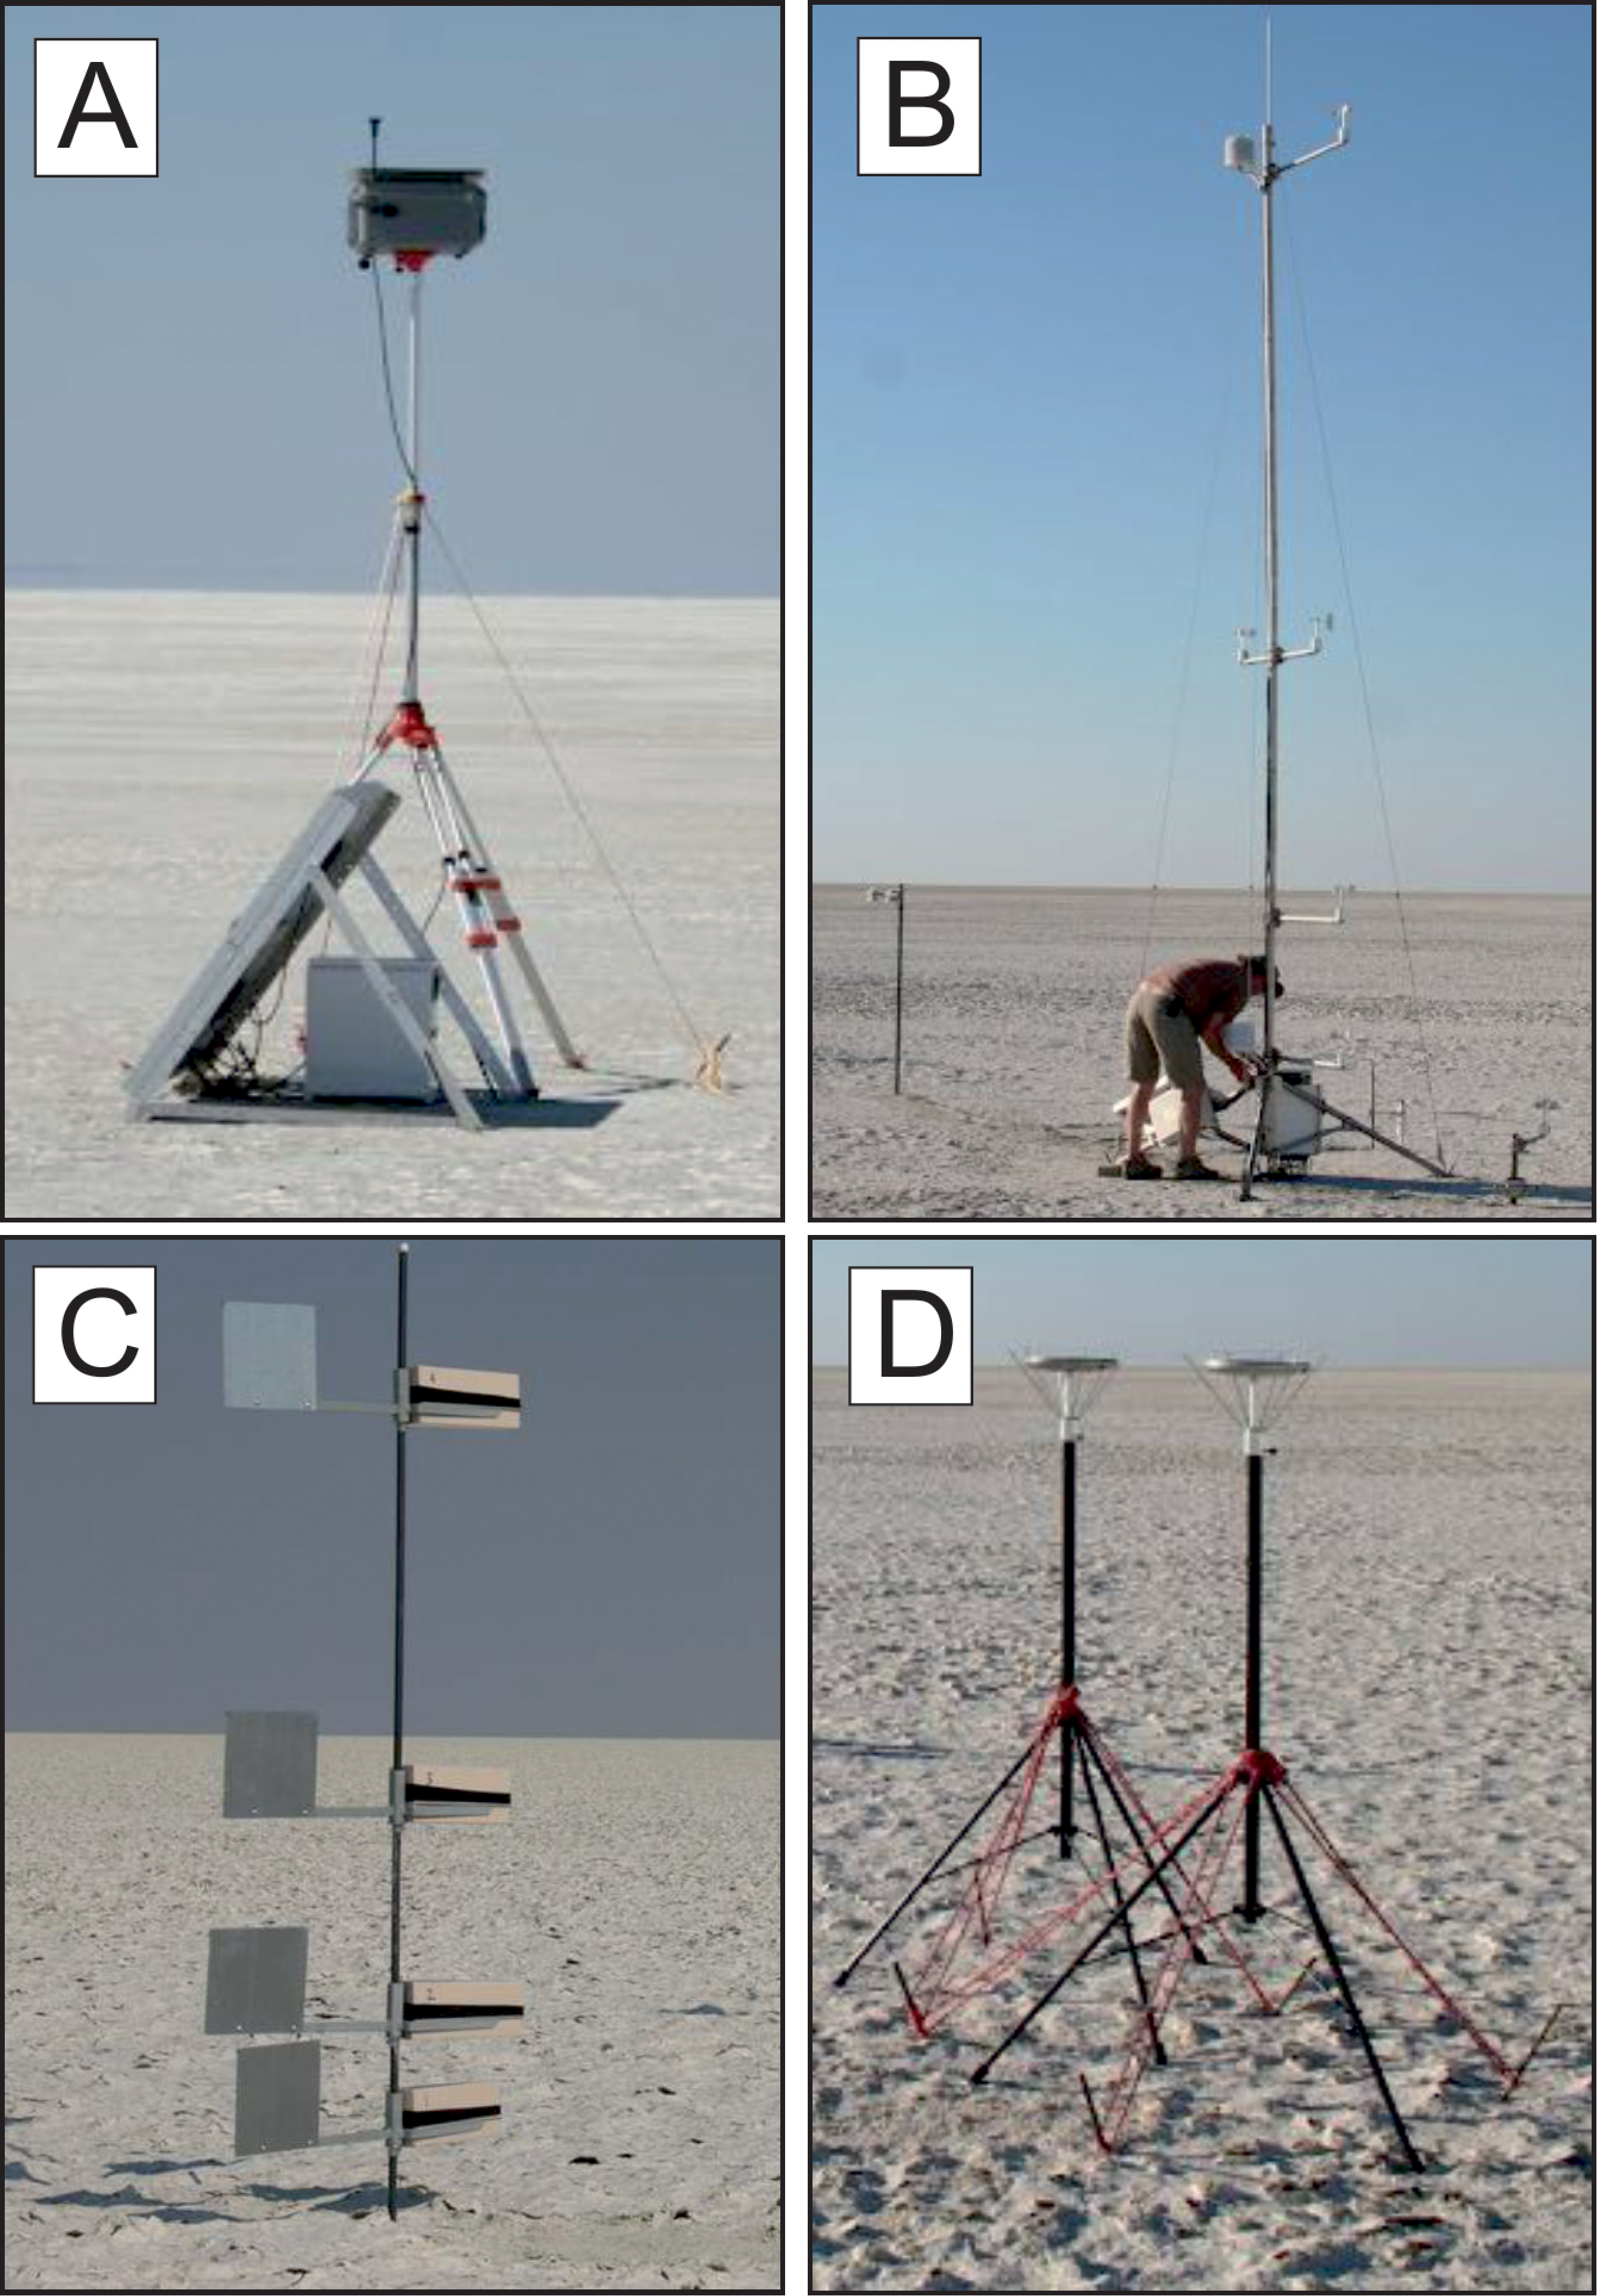
Examples of equipment used in the field characterization of dust emission, flux and deposition (see also Zobeck et al., 2003). (A) DustTrak sampler (see Goossens and Buck, 2012). (B) Typical meteorological station and anemometer mast (including a Sensit probe). (C) BSNE sampler. (D) A pair of Hanby inverted Frisbee dust samplers (see Sow et al., 2006). Photographs are all from the author’s collection.
A consistent outcome from all dust emission records derived from remote sensing data (e.g. Ginoux et al., 2012; Koren et al., 2006; Prospero et al., 2002; Schepanski et al., 2007; Washington et al., 2003) has been the primacy of the Bodélé Depression as a major regional and global source of dust. Pioneering initial fieldwork at this location (e.g. Washington et al., 2006) highlighted climatological controls on dust generation and the importance of variability in the Low Level Jet (Washington and Todd, 2005). Key insights into the emission process itself involved greater understanding of interactions between aeolian bedforms and availability of erodible diatomite, leading to an inherently localized emission pattern within the basin (see Bristow et al., 2009; Warren et al., 2007). Clearly, work by Crouvi et al. (2012) has further emphasized the importance of observing interactions between aeolian bedforms and dust emissions in this manner. Recent research in the transport pathway of this source region has included further detailed understanding of meteorological controls on emission and transport (e.g. Knippertz and Todd, 2012), long-term trends in windiness (e.g. Vermeesch and Leprince, 2012) and biogeochemical impacts of emitted dust (e.g. Bristow et al., 2010). Hobby et al. (2012) have also highlighted recent efforts that are being made to produce a comprehensive understanding of the Saharan climate system and the role of dust aerosols, involving a unique surface and aircraft field campaign.
Recent examples of process observations and observations at dust sources are also apparent from North American source regions which serve to elucidate natural and anthropic controls on dust emissions. For example, using a network of Cox Sand Catchers (e.g. Gillette et al., 2004), Sensit probes (e.g. Gillette et al., 1997) and a Tapered Element Oscillating Microbalance (TEOM) PM10 analyser, Ono et al. (2011), working in and around the exposed lake shore of Mono Lake, USA, found that PM10 emissions varied dramatically with changing surface conditions, an observation consistent with dust emission observations from other playa lake source surfaces (e.g. Reynolds et al., 2007). During the study period (July 2009 through June 2010), the maximum hourly and daily PM10 emissions were 76 g m−2 hr−1, and 450 g m−2 day−1, and annual emissions were estimated at 1095 g m−2 yr−1. Goossens and Buck (2011a, 2011b) used a network of wind towers (3 m and 10 m high), dust samplers (Big Spring Number Eight (BSNE) samplers; Fryrear, 1986; see Figure 3C) and meteorological stations to monitor anthropic dust emissions from Nellis Dunes Recreation Area, Nevada, USA. They used field data from a number of surface types (from active sand through to more stable rock-covered areas and drainage surfaces) to explore: (1) concepts of gross and net erosion, highlighting the role that different surfaces might play in the susceptibility of particles to wind erosion; and (2) spatial and temporal patterns of PM10 concentration emanating from (in particular) sand dunes, compacted silty strata, and observed off-road vehicle (ORV) activity (Goossens and Buck, 2009). Interestingly, despite the high observed PM10 concentrations, and the general availability of emissive sediment, these workers found that much of the temporal variability in dust flux from the source area was not accounted for by wind speed variability at the site alone, and was instead more likely to emanate from local ORV activity.
Following on from the work of Bergametti and Gillette (2010), Floyd and Gill (2011) attempted to link horizontal aeolian fluxes to land cover trends within the Jornada Basin, Chihuahuan Desert, New Mexico, USA. Using data (including particle size distributions, mass fluxes, and percent of dust-sized mass flux) from a network of 15 BSNE samplers located in contrasting vegetation zones within Jornada, they found it possible to equate potential changes in intensity of aeolian processes with vegetation change (e.g. through anthropic disturbance, or variability in vegetation orientation with respect to bare soil areas). Building on a comprehensive evaluation of controls on dust emission from the Mojave Desert (Urban et al., 2009), Reheis and Urban (2011) measured vertical dust deposition from 1999 to 2008 in the southwestern USA, and observed that summer–autumn rates in the eastern Colorado Plateau were twice as large as rates in the Mojave Desert. Higher summer dust fluxes were attributed to gustier winds and runoff during monsoonal storms, and grazing and drought together were thought to increase dust flux at the Colorado Plateau sites (see also Munson et al., 2011).
Other researchers have focused on the possible effects of fire occurrence on dust emission. For example, Ravi et al. (2012), in their study of wind erosion from Cimarron National Grassland, Kansas, USA, examined the impacts of vegetation disturbance on dust source characteristics. Specifically, these workers explored the impacts of post-fire disturbance in semi-arid grasslands on aeolian transport and dust emission. They instrumented numerous fire sites with wind towers, Sensit probes and BSNE samplers (e.g. Zobeck et al., 2003). They found that the burned shrub sites consistently had greater sand flux compared to the grass sites, and that observed post-disturbance period of aeolian activity was shorter in the case of grass sites than in the case of shrub-encroached grassland. Stout (2012) also explored wind erosion following fire occurring on grass fields on the Llano Estacado, Texas, USA. In exploring the post-fire recovery process, he found that threshold wind speeds increased from less than 10 m s−1 immediately following fire to above 19 m s−1 in a three-month period as vegetation naturally recovered. Using a network of BSNE samplers and automatic weather stations, Miller et al. (2012) also monitored post-fire aeolian sediment fluxes to evaluate effectiveness of land treatments designed to mitigate wind erosion after the 2007 Milford Flat Fire, Utah, USA. They observed significant sediment fluxes (up to 44,010.7 g m−2 d−1 in one burned plot), but also extreme spatial variability, and were able to conclude that post-fire fluxes were contingent upon upwind landscape properties (i.e. aspects of connectivity and length of surface disturbance upwind of the BSNE samplers) and, interestingly, that post-fire treatments (e.g. aerial and mechanical seeding to replace perennial vegetation) actually promoted wind erosion in some instances when compared to natural recolonization of sites by exotic annual plants. These studies (see also Sankey et al., 2009a, 2009b, 2010) have collectively highlighted the sensitivity of aeolian thresholds in sites with semiarid woodland, shrubland and grassland vegetation to both fire and post-fire managed intervention.
A number of studies highlighting dust emissions and fluxes in the transport pathway downwind of source regions are apparent from the wider Asian region. In exploring causal mechanisms of dust emissions from vegetated surfaces of the Mongolian steppe, Shinoda et al. (2010) investigated the broader impacts of drought on vegetation phenology, species and biomass, particularly in the spring months where dust emissions are more likely. These issues, alongside other factors, such as the prevalence or otherwise of dead or senescent grasses from preceding seasons (e.g. Kurosaki et al., 2011a), were also directly implicated by Kurosaki et al. (2011b) in their assessment of increases in dust emissions from East Asia. Shinoda et al. (2011) reviewed the role of temperate grasslands as potential sources of dust, and have highlighted their sensitivity to climate change. They have also detailed some of the wider challenges associated with understanding aerodynamic and physical controls exerted by grassland vegetation on wind erosion and dust emission processes. Working at a similar scale, Wang and Jia (2011) used a network of 154 passive sand traps located in the Taklimakan Desert in the period March 2009 to May 2010 to observe regional aeolian processes. They used these data, allied with measurements of available PM10 fraction from soil samples, to extrapolate sand transport and dust emission potential for a number of important surface types (including sand dunes, degraded land, dry lake beds and dry river beds). Of these surfaces, they found that the dry Taitema Lake bed, on the eastern margin, had the highest windblown sand and dust activity (with mean values of between 193.01 and 1302.26 kg m−2 day−1) but also noted that their traps were always filled, suggesting no shortage of sand supply. To the north of this region, using a similar network of passive dry-deposition samplers, Liu et al. (2011) derived a one-year record of dust deposition downwind of another (alkaline) playa, Ebinur Lake, within the southwest of China’s Junnger Basin. They found that mass accumulation rates of dust, including a significant component of water-soluble solutes and potentially toxic level of trace elements, ranged from 79 to 381 g m−2 year−1. They suggest that interannual variability in dust accumulation rates and chemical composition are controlled by the combined effects of: (1) the amount and seasonal distribution of precipitation and industrial emissions; (2) vegetation growth or die-off; and (3) changes in the physical and chemical states of surface sediments.
Working on a dust source in Australia, Ishizuka et al. (2008) used high-frequency dust and particle counters to examine relationships between saltation and dust emissions on a fallow field previously cultivated with wheat in the Murray–Darling River Basin, a regional dust hot spot (McTainsh et al., 1990). They found that dust concentrations observed in 2006 were proportional to the wind friction velocity (u*), but that the proportionality was dependent on ground surface conditions (i.e. such as the particle size distribution of parent soil, the presence or absence of crust, and aspects of the wetting and drying ‘history’ of the surface). Working in zones of dust transport in Australia, Mitchell et al. (2010) discuss collocated sun photometer and nephelometer measurements at Tinga Tingana, an AERONET site, between 1997 and 2007, and highlight a significant increase in aerosol loading following the onset of severe drought conditions in 2002, often confined to the September to March season of dust activity. Strong et al. (2011) further highlight some of the climate controls on dust-transporting winds which affected the Lake Eyre Basin source for the 2005 and 2006 dust seasons, and were able to link dust events with regional weather systems. Using a Micro Orifice Uniform Deposition Impactor (MOUDI; Marple et al., 1991), Radhi et al. (2010) explored the chemical composition of Lake Eyre dust for the 2007 dust season. They analysed events and trajectories of dust storms, and found an equal split between fine and coarse modes during background conditions, with a predominant coarse mode under dust storm conditions. The iron content was found to be close to double the values from the Northern Hemisphere (which has implications for absorption by dust aerosol in blue wavelengths), and halite (NaCl), mainly from dry salt lakes, was found to comprise up to 0.5% by mass.
A number of large dust storms occurred in Australia in 2009, and Leys et al. (2011) have provided a detailed regional summary of monitoring efforts associated with a single large dust storm in eastern Australia which occurred on 23 September of that year. They calculated the total suspended particulate sediment lost off the Australian coast as 2.54 Mt (based on a plume height of 2500 m), and suggest that this is the first and largest off-continent loss of soil ever reported using measured, as opposed to modelled, dust concentrations for Australia. However, McGowan and Soderholm (2012) have also presented the first surface-based laser ceilometer measurements of components of the same dust plume in eastern Australia, and their results indicate that previous estimates of dust plume loads may have been overestimated by up to 120%. Both sets of observations suggest that further research is required both to quantify and to standardize measurement of dust plume loads. Nevertheless, it is also clear that new tools are becoming available to monitor dust loadings. Notable important co-incident studies of dust characteristics for the 23 September event include the work of Jayaratne et al. (2011), who used a range of opportunistic monitoring approaches and equipment to measure significant peak PM10 (814 µg m−3) and PM2.5 (6460 µg m−3; where PM2.5 is particulate matter with an aerodynamic diameter of up to 2.5 µm) loadings at different locations, alongside details of associated changes in particle distributions over time. Earlier in 2009, Lim et al. (2011), through collection of dust and rain samples at four sites in eastern Australia, were also able to characterize the microbial content of samples, and found a diverse culturable flora; with several dust samples containing Bacillus spp., and dust-associated rain samples containing multiple species of Pseudomonas, which are known to be involved in ice nucleation and rain formation.
Bhattachan et al. (2012) highlight the importance of the Southern Kalahari as a potential new dust source in the Southern Hemisphere, and Bryant et al. (2007) emphasize possible climate controls on existing dust emissions from sources in this region. Wiggs and Holmes (2011) provide a useful case study from southern Africa, and quantify dust emissions from agricultural land in west-central Free State. Overall, they find a close agreement between dust flux measurements and both seasonal and diurnal trends in wind speed, with apparently little observed impact of seasonal changes in surface soil moisture. Specifically, they infer close links between emission and variability of surface aerodynamic roughness (Z0), critical velocity for entrainment, percentage of time the wind was above this critical velocity, and the weighted erosive power of the wind defined in terms of vector units.
There are very few examples of field data collection and observations of dust emission or deposition emanating from high latitudes (e.g. Bateman, 2013; Lawrence and Neff, 2009; Nickling, 1978). Bullard (2013) provides a thorough summary of glacigenic inputs into the dust cycle, and it is worth highlighting here a number of recent published studies observing detailed aeolian entrainment schemes. Hugenholtz and Wolfe (2010), through their work on the glacier-fed Athabasca River in the Canadian Rocky Mountains, were able to record dust noticeable deposition rates during low and high flow periods, but observed peaks (e.g. 27,632 kg ha−1 month−1) during low-flow conditions when wind speeds were highest. Working in Iceland, Arnalds (2010), Arnalds et al. (2012) and Thorarinsdottir and Arnalds (2012) highlight significant dust sources. Through use of daily dust records from the southern tip of Iceland, Prospero et al. (2012) provide a detailed record of dust emissions from high latitudes. Their work evaluated a unique six-year record (1997–2002) of dust measurements, and highlighted frequent dust events with concentrations exceeding 20 μg m−3. They found that dust plumes were predominantly transported southward and material was most likely deposited in the North Atlantic. Their data have allowed an evaluation of seasonal variability in dust fluxes, with local peaks in emission observed in spring. Most dust plumes were linked spatially and temporally to processes occurring in active glacial outwash/flood plains; large dust events appeared to be associated with specific glacial outburst floods. Through the work of Bullard and Austin (2011) in Greenland, the variability in surface characteristics and aeolian entrainment and transport across a proglacial floodplain has also been studied. They conducted a number of experiments which highlighted links between deposition of fine, silt-sized sediments on the proglacial floodplain in the summer melt season and subsequent deflation and transport of these sediments by down-valley winds in the winter months. However, they highlight that the system can be significantly supply-limited.
Overall, we can see that recent research highlights a range of approaches and equipment that have been used to constrain observations of dust fluxes both on and downwind of dust sources using a range of spatial and temporal contexts. In addition, we can see the development of research aimed at uncovering dust chemistry, particle morphological characteristics (i.e. particle size distribution characteristics, but not necessarily particle shape) and microbial content. At the same time, efforts have been made to better understand anthropic and natural controls on dust emission frequency from source areas. Nevertheless, as these studies are often undertaken some distance from the point of dust emission, it can be hard to determine which surfaces contribute to observed dust fluxes, and thereby derive from these data specific information relating to overriding controls on the dust emission process itself.
IV Characterization of the emissive nature of surfaces within source regions
In order to represent dust emission processes effectively within models, a detailed understanding of factors that can influence or control surface erodibility and the dust emission process is essential (e.g. Shao et al., 2011a; Webb and Strong, 2011, and references therein). The experimental use of field and laboratory wind tunnels has been, and continues to be, fundamental to our understanding of dust emission processes (e.g. Roney and White, 2010). Another recently adopted approach includes experimentation based upon mechanical laboratory generation of dust using soils from candidate source regions (e.g. Domingo et al., 2010; Gill et al., 2006; Madden et al., 2010). This approach has the advantage of using controlled experimental conditions for the determination of dust emission strengths of different geological materials (Domingo et al., 2010). However, due to the nature of the dust generation approach used, some care is required when comparing measures of dustiness generated with different equipment (e.g. Gill et al., 2006), and when direct comparisons are made to field and remote sensing observations (e.g. Bhattachan et al., 2012). A number of recent studies have, however, sought to sample dust emissions in a range of environmental contexts in situ through innovative application of both field equipment and field sampling strategies (see Figure 1C for locations).
The use of portable (open-floored) wind tunnels can have considerable advantages in observing the dust emission process from different surfaces within dust source regions (e.g. Houser and Nickling 2001a, 2001b; Macpherson et al., 2008; Nickling and Gillies, 1989). Building upon this body of work, a number of recent studies have designed (e.g. Van Pelt et al., 2010) and utilized (e.g. Baddock et al., 2011b) a portable wind tunnel. The wind tunnel design proposed by Van Pelt et al. (2010) offers a number of advantages over previous designs in that it is self-contained and relatively field-portable. Baddock et al. (2011b) undertook a study of the impact of cattle disturbance on emissions from dry, crusted playa surfaces using this equipment. They identified important thresholds of disturbance on dust emissions from supply-limited playas. Maurer et al. (2010) have undertaken an assessment of the wind erosion characteristics of Sahelian surface types (e.g. sand, rough stone and flat crusted surfaces) using a portable wind tunnel, and their data are broadly supported by observations made by Crouvi et al. (2012) and at a larger scale by Bullard et al. (2011). They found that sand surfaces had the highest mass fluxes and also fairly high PM10 fluxes due to the lack of stable crusts or aggregates. Rough stone surfaces were generally weak emitters, but were average PM10 emitters due to their relatively large store of potential dust particles. Flat crusted surfaces displayed heterogeneous mass fluxes, but they observed that PM10 concentrations were also relatively high. Maurer et al. (2010) also noted the importance of surface disturbance on dust emissions from these surfaces. Although not directly involved with field evaluation of soil erodibility, it is interesting to note that Gardner et al. (2011) were able to use a portable field wind tunnel to evaluate the microbial characteristics and bacterial diversity of two types of wind-eroded sediments collected from three different organic-rich soils in Michigan.
Another approach to uncovering information relating to the erodibility of surfaces in controlled conditions has been through collection of data using a miniaturized, calibrated wind shear system – the Portable In Situ Wind Erosion Laboratory (PI-SWERL; Etyemezian et al., 2007; Sweeney et al., 2008). PI-SWERL is an instrument that creates a shear stress on the ground surface within a cylindrical enclosure using a rotating annular blade within close proximity of the surface. It measures the PM10 concentration at an outlet with a DustTrak (see Figures 3A and 4) that records at 1 Hz, while a blower vents filtered air through the PI-SWERL at a constant rate. Sweeney et al. (2011) have provided an extremely comprehensive summary of dust emissions from a range of desert landforms in the eastern Mojave Desert, USA, using the PI-SWERL. They have collated details from more than 500 individual dust emission measurements from eight common desert landforms in southern California (including desert pavement, playas with a silty crust, playa margins, distal alluvial fans, dry washes, sand dunes and beaches). Overall, this work does much to highlight the importance of observing heterogeneity of emission within dust source regions. They concluded that in the eastern Mojave alluvial sources such as dry washes and distal alluvial fans were much larger contributors to regional dust loading when compared to other landforms. These findings broadly concur with other studies of contributors to regional dust loadings in SW North America (e.g. Floyd and Gill, 2011; Reheis and Kihl, 1995). Sweeney et al. (2011) further emphasize that playas, in particular, exhibit extremely heterogeneous dust emission characteristics, with large disparities between salt playa, silt playa and playa margin surfaces. Thus, this research highlights that, despite the presence of abundant fine sediment, some playas are unlikely be emissive as they are either too wet (e.g. extensive groundwater discharge) not salty enough (e.g. salts have been removed from the surface by groundwater recharge) or there is not a sufficient supply of sand (coarse particles) on or at the upwind edge of the playa surface to cause dust emission. They conclude that the emission potential of other playa surfaces will vary based on hydrological gradient or ephemeral inflows and may change over time in response to human or climate forcing mechanisms (see also Ono et al., 2011). For lake beds and lake shoreline surfaces, it is clear from these data that spatial and temporal variability in groundwater and surface geochemistry can significantly influence sediment availability (e.g. Reheis and Kihl, 1995; Reynolds et al., 2007).

A field-portable version of the Portable In Situ Wind Erosion Lab (PI-SWERL) in action on Franklin Playa, California, USA (photograph taken by the author in 2007). See Etyemezian et al. (2007) for details.
Although focused on the technical measurement of total suspended particulate matter (TSP) emissions using PI-SWERL, Bacon et al. (2011), working in the Negev Desert, Israel, also sampled a range of alluvial surfaces (e.g. desert pavement, alluvial fan). Sankey et al. (2012) also used PI-SWERL to examine how dust supply varied with sagebrush microsites and time since burning in experimental erosion events in the Snake River Plain, Idaho. Using this approach, they were able to quantify emissions as being three orders of magnitude greater on burned compared to unburned surfaces, and identified key aspects controlling sediment supply, including grazing effects and possible system response to management practices that might affect pre-fire vegetation.
In recent field studies in the Salton Sea, USA, Buck et al. (2011) provide an excellent insight into processes that control surface characteristics in salt-dominated (e.g. wet playa) systems (e.g. Reynolds et al., 2009). They found that surfaces with the highest emissions: (1) were composed of minerals with acicular or prismatic crystal habits, which promote non-interlocking, loosely cemented crusts; (2) contain hydrous/anhydrous salt minerals; and (3) have a high water table or a high seasonally retarded or perched water table. King et al. (2011) provide further detailed field evidence of dust emission potential and rates for a range of surfaces at the Salton Sea over a three-year period from 2005 to 2007. Importantly, this study includes an element of seasonal and climatic control on emission in the sampling approach. Using the PI-SWERL, they were able to determine significant surface producers of dust: (1) soft (playa-like) crusts during winter and early spring; (2) dry wash areas containing loose particles on the surface year-round. They highlighted that the removal of ‘fluffed’ salts by wind erosion facilitates continued salt formation by bare soil, and that erodible surface fabrics generated through repeated evaporite phase changes similar to those evident on Owens Lake (e.g. Levy et al., 1999) appeared to be operating along exposed shores of the Salton Sea.
Overall, although portable wind tunnels offer better simulation of boundary layer conditions and are better able to observe saltation processes than PI-SWERL, this latter instrument has the ability to provide a reasonable, relative measure of the potential for dust emission over a range of soil types encompassing a range of textures, surface roughness, and degree of surface crust formation (Sweeney et al., 2008). We can see clearly from recent research that one of the key advantages of the PI-SWERL is that its small size and portability allow for numerous sample replications to be made in a short period of time in places that large field wind tunnels often cannot access (e.g. crusted surfaces), which is perhaps a fundamental consideration when attempting to sample some of the spatial and temporal heterogeneity in the emissive nature of surfaces within dust source regions.
V Summary and implications for further research
It is clear that recent field measurements of dust emission and flux are being generated from a wide range of geomorphologic and climatological contexts within dust source regions (see also Figure 1). Recent developments include widespread adoption of tried and tested approaches and equipment for monitoring dust emission and deposition alongside the adoption of new technologies for understanding the emission potential of surfaces within source regions. In experimenting on trapping and analysing samples with increasing sophistication, workers are also further exploring fundamental aspects of the biological, mineralogical and textural components of dust. Together, these data are quantifying important aspects of the dust cycle, including particular anthropic interventions, and system dynamics such as the interplay between glacial processes and dust emission, and the impacts of dust (e.g. on ocean productivity) once it becomes deposited. They also provide new insights via data sets which begin to quantify factors which may control the nature and magnitude of dust emissions, and via the development of gross relationships between surface roughness and emission thresholds, an estimation of spatial and temporal limits on sediment supply. This allows us to begin to understand and quantify the complex spatial and temporal relationships that can exist between sediment supply and the transport capacity of the wind for specific sources of dust.
Nevertheless, some of these field measurements (e.g. dust observation in the downwind transport corridor) often preclude direct observation of the emission process, and specific identification of the geomorphic and climatological context of emissions. It is apparent, therefore, that dust flux measurements made by a new generation of field-portable wind tunnels and PI-SWERL systems can provide information related to the range and magnitude of dust produced from desert landforms, and highlight inherent spatial and temporal heterogeneity and variability in dust emission from some source types and regions. As such, these data, allied with existing field data collected either at or downwind from the source, can provide a potentially useful basis for the validation of a range of model components within the dust cycle (see Figure 5A). Thus, although their impact on our understanding of the emissive nature of surfaces is significant, at present these data exist only for a very limited range of source locations, and over relatively restricted timescales. A key research priority must therefore include an expansion of these sampling approaches to other dust hot spots and source regions (as also noted by Bullard, 2010; Bullard et al., 2011) such as those in Africa, Asia and the Middle East. However, since many of these sites are currently inaccessible, or practically so, it is clear that limited existing quantitative data from known accessible sites should where possible be used in careful combination with remote sensing data and land-use/landform mapping to provide an initial basis for dust source characterization that can be expanded upon as and when field access becomes possible.

(A) A comparative quantification of dust emissions from desert landforms, eastern Mojave Desert, USA, derived using PI-SWERL (redrawn from Sweeney et al., 2011). They found that washes were the highest dust emitters, statistically similar to dunes and playa margins. Desert pavements were the lowest emitters but were statistically similar to salt-crusted playa. Silt–clay playas were similar to beaches. Data here show a comparative box plot of the log-transform of dust emissions (at u*=0.56 m s−1). Bottom and top dots represent the 5th and 95th percentiles, respectively, of the measured values. The line in the boxes represents the median. (B) Observed (percentage) frequency of dust emissions derived from remote sensing data (MODIS Terra/Aqua) from comparable surface geomorphologies for the Chihuahuan Desert (CHI – time period 2001–2009), the Lake Eyre Basin (LEB – time period 2003–2006) and the western Sahara (SAH – time period April–July 2003) (redrawn from Bullard et al., 2011). The emission source categories used are defined as follows. (1) Lakes include ephemeral and perennial systems. (2) HR Alluvial and (3) LR Alluvial refer to high-relief (e.g. slopes > 3°) and low-relief (slopes < 3°) alluvial surfaces. (4) Stony surfaces refer to desert pavement. (5) Aeolian surfaces include sand deposits and loess. (6) Low emission surfaces are defined as surfaces where sediment supply and/or sediment availability are typically low to zero and thus emissions are low (e.g. bedrock, duricrusts). These data suggest that areas of common superficial geomorphology do not necessarily behave in the same way in different source areas. However, these data are potentially influenced by variability in both spatial and temporal patterns of emission from these surface geomorphologies that may not be fully characterized solely through use of relatively short time series of remote sensing data.
Although it is fair to acknowledge that there are some limits to the availability and quality of remote sensing data sets in some regions (see Baddock et al., 2009), field-based measurements are significantly scarcer (see Figure 1, B and C). At coarser scales, therefore, the generation of dust storm inventories through use of remote sensing data is extremely important in providing a spatial and temporal context for observations of field-scale dust emission potential from source regions. A detailed understanding of the geomorphology and sediment-based surface characteristics of dust-emitting surfaces is also essential in order to be better incorporated as a driver in large-scale dust source models (see Bullard et al., 2011; Figure 5B). In addition, given recent findings of emission potential from surfaces within source regions generated at the field scale, it is becoming clear that, in order to directly link source activity data to concepts of surface geomorphological classification, there is a need to account for both natural and anthropic-induced spatial and temporal emission dynamics. Thus, where possible, remote sensing time series also need to be collected with careful attention to seasonal and long-term (i.e. interannual) cycles in the emission process that are not always well represented in global models (e.g. Bryant et al., 2007; Waggoner and Sokolik, 2010).
Overall, the work of Bullard et al. (2011), Lee et al. (2012) and others represents an important step forward in addressing some of the scaling issues associated with modelling dust emission from source regions. However, their work also emphasizes some additional research challenges, for example: (1) the need to generate dust storm origin data from a wider range of sources, using remote sensing data with a sample time series which can overcome sample bias and account for interannual variability in emissions; and (2) the derivation of a geomorphological classification of surface types that can also accommodate dynamic interactions and possible associations that may exist between geomorphological units, in particular at the margins of playas and alluvial/fluvial process domains (as discussed by Okin et al., 2011b). However, in highlighting a number of important and relevant caveats (including possible human interventions), Bullard et al. (2011) and Lee et al. (2012) were fully aware of these issues, and their work serves both to highlight and to provide focus to a range of additional research challenges that face those seeking to implement a sub-basin scale dust source scheme within a regional or global modelling context.
Footnotes
Acknowledgements
The author has had the pleasure of discussing aspects of the dust cycle with a large number of co-researchers and students over many years, either in the field or over a few beers back in the UK. Although the views (and any possible errors) expressed in this progress report are my own, I would like to acknowledge both their input to this review and general enthusiasm for all aspects of the dust cycle. Much of the manuscript was written at the time of arrival of our son Louis. As such, I would like to thank my wife Judith for considerable patience, and all of the staff at the Jessops Hospital, Sheffield, for all of their help and assistance. The three anonymous reviewers are also thanked for both dealing with and significantly improving a manuscript that had been written by someone in a seriously sleep-deprived state. Final thanks go to Tim Warner for considerable help and patience throughout the process of generating this review.
Funding
This work was supported by the Natural Environmental Research Council (grant number: NE/H023410/1).