



Abstract
Products of CORINE Land Cover (CLC), the National Land Cover Dataset (NLCD), the FAO/UNEP Land Cover Classification System (LCCS), etc. currently provide an important source of information used for the assessment of issues such as landscape change, landscape fragmentation and the planning of urbanization. Assuming that the data from these various databases are often used in searching for solutions to environmental problems, it is necessary to know which classes of different databases exist and to what extent they are similar, i.e. their possible compatibility and interchangeability. An expert assessment of the similarity between the CLC and NLCD 1992 nomenclatures is presented. Such a similarity assessment in comparison with the ‘geometric model’, the ‘feature model’ and the ‘network model’ is not frequently used. The results obtained show the similarity of assessments completed by four experts who marked the degree of similarity between the compared land cover classes by 1 (almost similar classes), 0.5 (partially similar classes) and 0 (not similar classes). Four experts agreed on assigning 1 in only three cases; 0.5 was given 33 times. A single expert assigned 0.5 a total of 17 times. Results confirmed that the CLC and NLCD nomenclatures are not very similar.
Keywords
I Introduction
Land cover (LC) data (Comber et al., 2005a; Di Gregorio and Jansen, 2000; Feranec et al., 2007) are important spatial data for the assessment of changes in the landscape (Kuemmerle et al., 2006; Nitsch et al., 2012; Rogan and Cheng, 2004; Treitz and Rogan, 2004), fragmentation and its impact on landscape (Riitters et al., 2002; Vogt et al., 2007), construction planning and the measurement of a variety of elements related to the morphology of cities (Mesev et al., 1995), the assessment of ecosystem services (Kroll et al., 2012), estimation of flood risk (Meyer et al., 2009; Solín et al., 2011) and hydrological modelling of runoff processes (Hunducha and Bardossy, 2004; Sullivan et al., 2004) on global, national or local levels. Such applications and similar ones connected with the availability of up-to-date LC data have led to the development of multiple approaches to LC identification that differ in the structure and nature of entry data, geometrical accuracy, detailedness (granularity) and semantic specificity in addition to the scope of generated data in the context of applied nomenclatures. As a consequence of such different approaches to LC data collection, the same landscape objects are often classified into different LC classes.
Several authors have dealt with the question of the semantic similarity of LC classes. For instance, Rodríguez et al. (1999) did so when assessing the cores of cities of similar sizes; Comber et al. (2005c) compared the compatibility of LC maps from two time horizons; Feng and Flewelling (2004) assessed the semantic similarity between the cottonwood used in an elk study and vegetation categories in the Modified Anderson Classification System and the United States National Vegetation Classification standard; Jansen (2006) and Jansen et al. (2008) questioned similarity while harmonizing land-use and land-use-change class sets when comparing a number of data sets from the Nordic countries.
Hence, correct awareness of the similarity between classes from different nomenclatures is the prerequisite for their semantic interoperability. Comparison of different LC classes from either one or several nomenclatures has become a topical problem. Different approaches to the assessment of semantic similarity between LC nomenclatures exist. For example, assessment of the semantic similarity of defined LC classes uses mathematical and statistical approaches, or a feature-based approach, assuming availability of hierarchic database objects together with the set of their attributes and functions.
The aim of this study is to evaluate the semantic similarity of LC classes of two nomenclatures by an expert assessment approach. The first one is the CORINE Land Cover (CLC) nomenclature and the second is the National Land Cover Dataset (NLCD). CLC data were obtained by computer-aided visual interpretation of Landsat, SPOT and IRS images, and NLCD 1992 data (http://landcover.usgs.gov/classes.php) were obtained by unsupervised classification of Landsat images. The reason why these two nomenclatures have been chosen is that information about the frequency and areas of LC classes in two extensive territories of the Earth’s surface, Europe and the USA, in three time horizons (c. 1990, 2000 and 2006), was derived precisely via these two nomenclatures. Generation of data will most probably continue (for instance, layer CLC 2012 is currently being processed). This means that information about some classes of both nomenclatures may be helpful in searching for solutions to global environmental projects, harmonizing LC databases in cases where their complementary application is considered, and so on.
II Background and related work
Many research works are focused on the integration of ontology and semantics and solutions to semantic conflicts. These works cover many spheres of human activities such as biology (Köhler et al., 2003), medicine (Schober et al., 2010; Schriml et al., 2011) and geology (Lin and Ludäscher, 2003). Other examples of semantic integration by ontology are published in Noy et al. (2005). The geographical sciences also use ontological systems as an integration mechanism to interconnect originally heterogeneous data and information (Cerba, 2011; Kavouras and Kokla, 2008; Malik et al., 2010). They mainly emphasize the hybrid ontology approach (Wache et al., 2001), which consists of using the shared vocabulary with common or interlinked terms (classes). The vocabulary is used by partially independent local ontologies (a similar approach was applied in the transformation of LC and LU nomenclatures in Cerba, 2011). The semantic similarity can be investigated by direct mapping and equivalent classes (details in Martínez Ramos et al., 2013), the Contextual Semantic Integration (CSI) approach (details in Tiernay and Jackson, 2005) or heuristics (Noy, 2004).
In line with the scope of this paper, a short review of current methodological aspects of the semantic similarity assessment of LC classes within a single LC nomenclature or between different nomenclatures is presented.
Aside from Feng and Flewelling (2004), earlier research on the issue of similarity focuses on measuring the semantic similarity of categories in taxonomy. This research takes advantage of the hierarchical structure of taxonomy and suggests that semantic similarity measures can be obtained by calculating the conceptual distance between two categories, which measures the semantic similarity of two categories by counting the number of links that connect two categories within the hierarchical structure. The lower the number of links between two categories, the more similar they are.
Recent studies apply the feature-based approach (e.g. Cerba, 2011; Kavouras and Kokla, 2008; Rodríguez et al., 1999) to the assessment of semantic similarity proposed by Tversky (1977). This approach relies on two operations from the set theory – intersection (∩) and set difference (/) – and weighting of the differences between features or entities. For instance, Rodríguez et al. (1999) assert that the weight can be determined as a function of the distance (number of links) between the entity classes and the immediate super class that subsumes both classes. Feng and Flewelling (2004) established the weight by pursuing the level of vegetation categories in the hierarchical system; the categories are weighted by criteria, which define vegetation categories on individual hierarchic levels. These authors assert that the criteria used at higher levels in the hierarchy possibly play a more important role than those at lower levels, because the assignment of an LC category to a land parcel has to satisfy those criteria specified at the higher levels first, before criteria at the lower levels are met. Consequently, a higher value should be assigned to criteria used to differentiate categories at higher levels in the hierarchy than to those applied at lower levels. Another option is the use of identical weights that would concentrate on the semantics without taking into account the hierarchy of the original nomenclatures.
The feature-based approach assumes availability of hierarchic database objects (rather than the knowledge database, where ontology represents the ideal way of storing such data) along with the set of their attributes and functions. In the meantime, objects are organized based on an ‘is–a’ relation (subordinate relation) or a ‘part–whole’ relation (Ahlqvist, 2005). In cases where LCs are characterized by a short text, it is necessary to organize the features of each category into a form that can be used in a feature-based approach (Feng and Flewelling, 2004).
Comber et al. (2005a) present a statistical approach to assessment of the semantic similarity of LC classes of the Land Cover Map of Great Britain (LCMGB) in raster format and the Land Cover Map (LCM2000) in polygon format by discriminate analysis as complemented by expert assessment. The data sets were intersected so that each LCM2000 parcel had attributes recording the number and type of LCMGB pixels contained within the parcel area. This generated a database containing a record for each of the LCM2000 parcels. Discriminant analysis builds a predictive model of group membership based on the characteristics of each record (i.e. each LCM2000 parcel). An expert assessment is primarily delivered by well-informed individuals who are knowledgeable about LC as a concept, about LC mapping from remotely sensed data, and about the uses to which that information is put (Comber et al., 2005c). The distribution of LCMGB classes is interpreted via the description given by an expert of how the classes of LCMGB relate to each LCM2000 broad habitat. According to the expert descriptions, each type of LCMGB pixel will be ‘unexpected’, ‘expected’ or ‘uncertain’ (U, E, Q) relative to the broad habitat class of the LCM2000 parcel.
Kavouras et al. (2003) present an assessment of semantic similarity based on computer lexical analysis of definitions of LC classes that are parts of the ontologies CLC, MEGRIN (Multipurpose European Ground Information Network) and WordNet (a lexical database for the English language) in terms of the content of certain syntactic and lexical patterns. After Kavouras et al. (2003), definitions are texts with special structures and contents. They are rich sources of knowledge and they reflect the scientific knowledge of a domain. Research on definitions seeks ways to exploit the wealth of information latent in these special texts.
Schwering (2008) presented a certain systemization of approaches to the semantic similarity of LC nomenclatures assessment. According to Schwering (2008: 6), two major notions of similarity are found in existing semantic similarity measures: commonalities and differences, or semantic distance. Commonalities and differences between two representations of concepts are taken as one indicator of similarity: the more commonalities and the fewer differences there are, the higher is the similarity. Two constituents were distinguished in the context of conceptualization: concepts and objects (geospatial concept is an idea that characterizes a set or category of geospatial objects; a geospatial object refers to the single geographic feature). Schwering (2008) classified approaches to the assessment of semantic similarity between LC nomenclatures into five models:
The geometric model represents an exact approach to the measurement of semantic similarity as a function of spatial distance, applying the Minkowski distance measures. Concepts are modelled within a multi-dimensional space and their spatial distance indicates the semantic similarity. Schwering asserts that geometric models are suited only for the comparison of concepts with an identical number of dimensions.
The feature model is based on a set-theoretic knowledge representation: concepts are represented via an unstructured set of features that hold for the specific concept. Features can represent nominal, ordinal, interval and ratio-scaled variables. This model is applied mostly to the assessment of the semantic similarity of objects that are, for instance, parts of LC classes.
Network models are graph-based and use semantic networks for knowledge representation. These models, like geometric models, measure similarity based on the notion of distance. The advantage of this approach is that it also takes into account relationships between concepts (LC classes). Like the feature model, the alignment model uses commonalities and differences as indicators of similarity, but it also includes the relational structure in which properties or relations are found. Expert assessment may also greatly contribute to comprehension of the considered structure of relationships.
Transformational models, in comparison with the previous models, evaluate the semantic similarity assessment in another way: they define the transformations required to distort one concept into another and define similarity in terms of the number of transformations needed to make them transformationally equal.
However, definitions of compared LC classes normally and prevalently contain only conceptual and parametric characteristics: for instance, ‘low intensity residential’, ‘discontinuous urban fabric’, ‘constructed materials account for 30–80% of the cover’, and so on. This is the reason why the expert judgement of someone who knows the contents – the semantics of LC class concepts – may be required. Comber et al. (2005b: 54) report that an expert offers a more holistic view of the landscape than the one given by the measures of statistical similarity. An expert can place and see things in a context. Mathematical approaches cannot do that. Our approach to expert assessment emphasizes experts’ capabilities to comprehend and take into account contextual relationships between pattern objects of LC classes (for instance, an expert identifies that the pattern of CLC class 335, ‘Glaciers and perpetual snow’, contains the following objects: ice, snow, and sometimes small islands of rocks; the majority of experts should decide that such patterns cannot be similar to NLCD class 31, ‘Bare rock/sand/clay’, although the two patterns may contain the object ‘Bare rock’, because class 31 does not contain ice and snow); an expert can rapidly assess patterns of concerned classes as wholes.
III Methodology of comparison of CLC and NLCD by expert assessment
1 Data
This study compares and assesses LC classes of two nomenclatures: CLC and NLCD 1992. The choice of these two nomenclatures was inspired by the fact that they were used for the derivation of LC data for almost the whole of Europe and the USA for three time horizons (c. 1990, 2000 and 2006). It seems that the process of their generation will continue (currently the CLC 2012 layer is being processed). Hence, they represent established and relatively stable nomenclatures offering information about the landscape and its changes in Europe and the USA. It also means that information about some classes of the two nomenclatures may be useful in the context of global environmental projects.
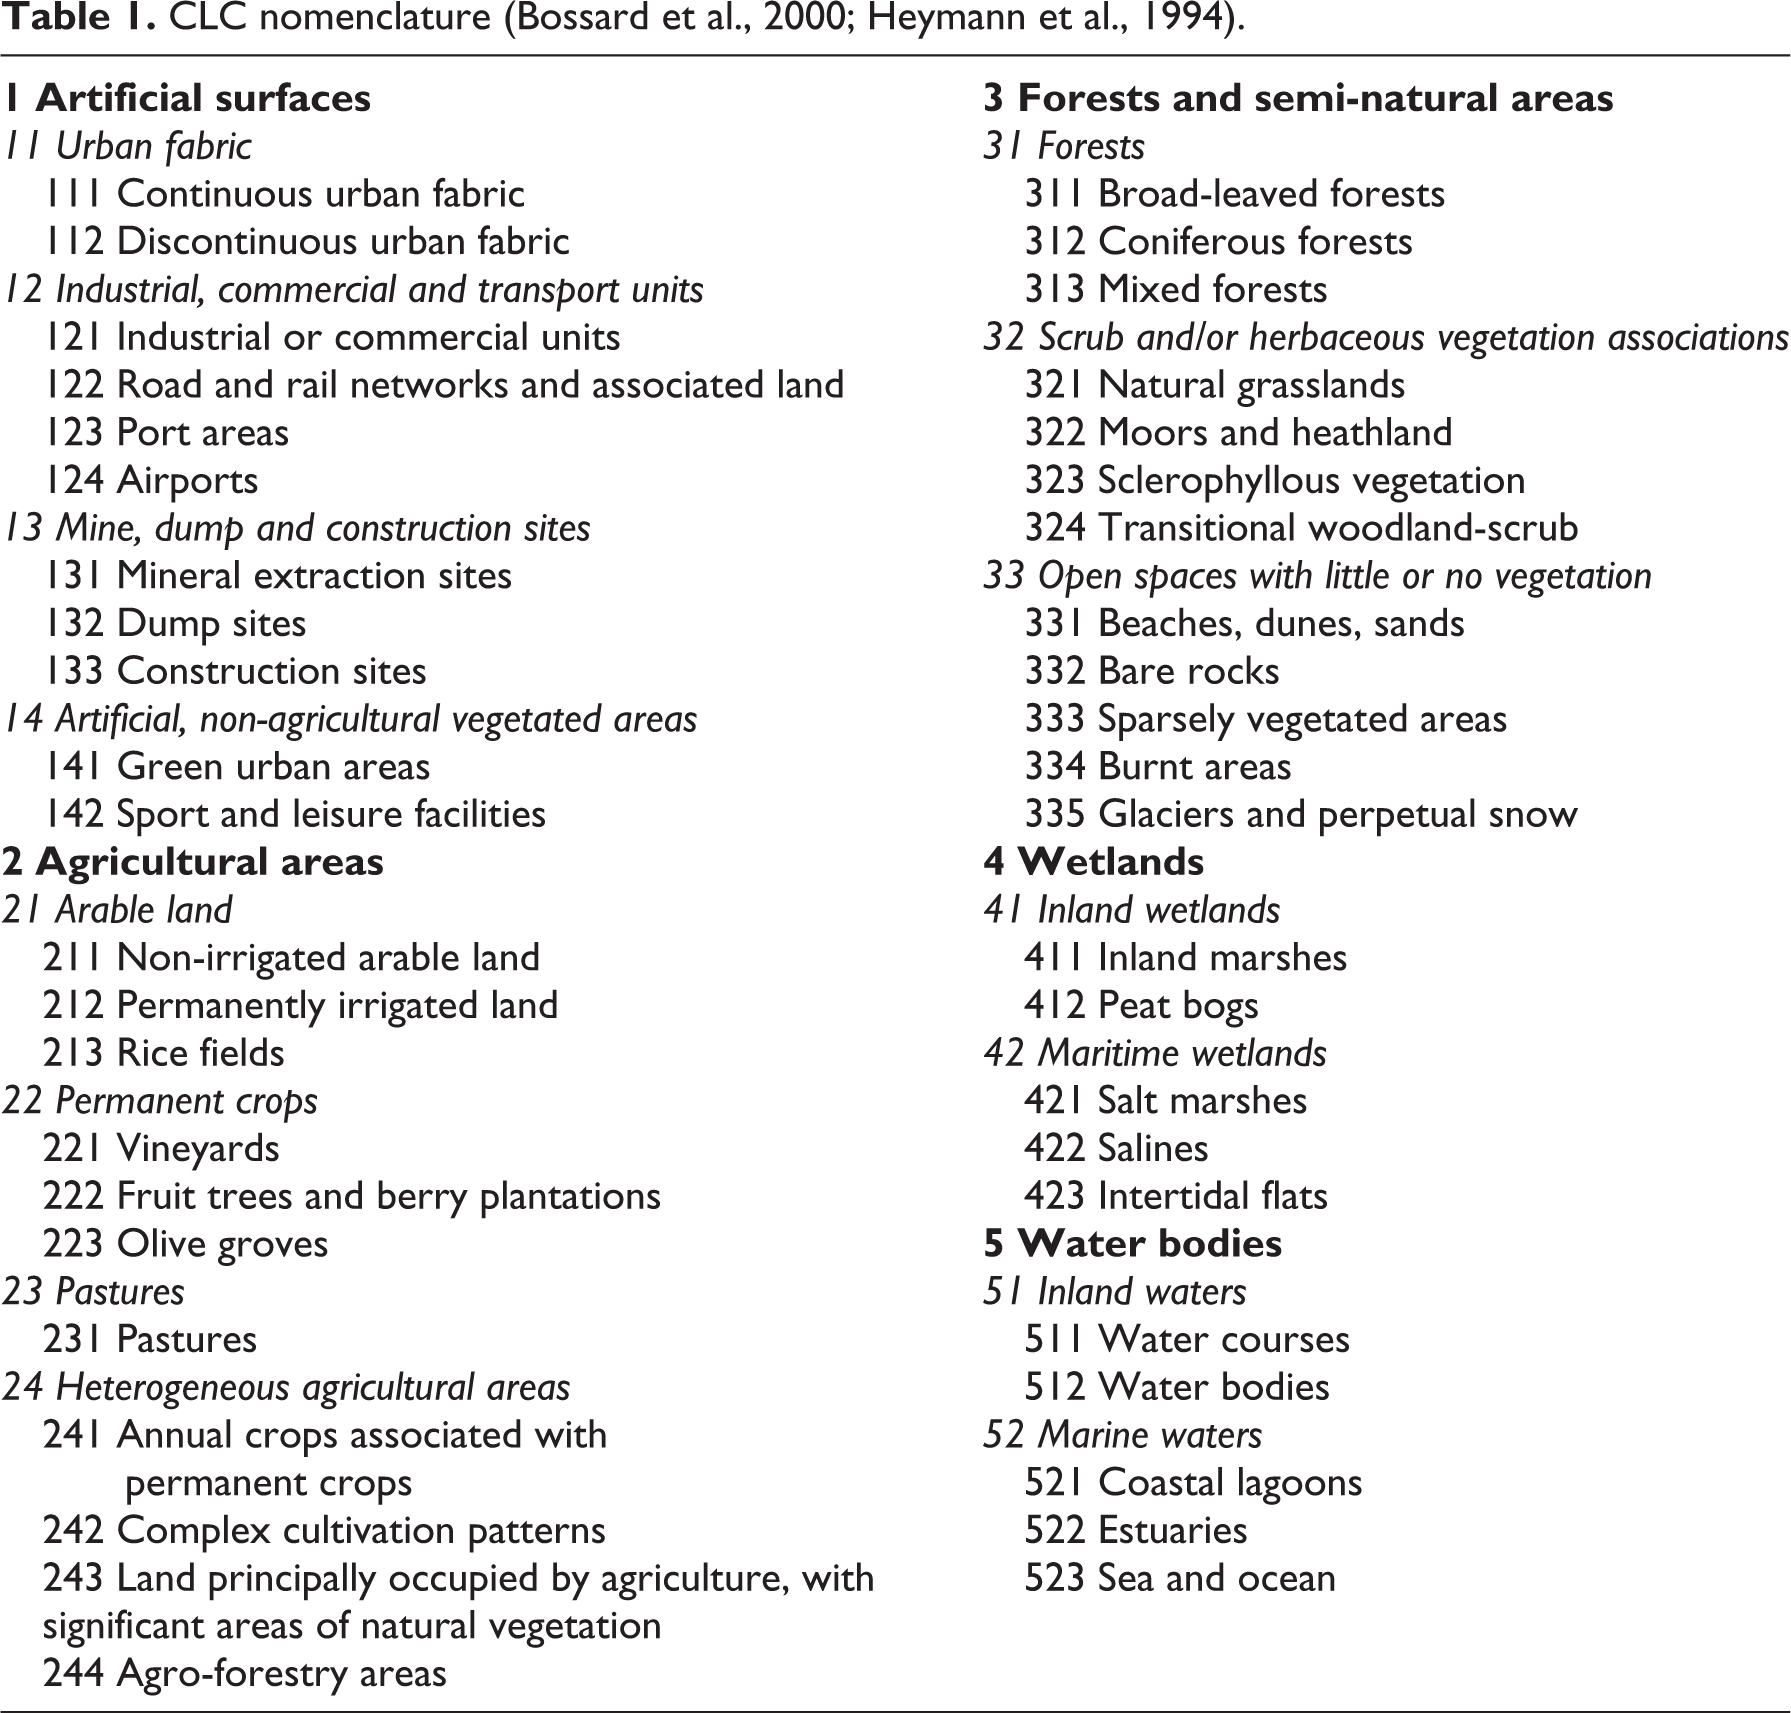
The CLC nomenclature (Bossard et al., 2000; Heymann et al., 1994) has been used since 1985. It consists of three standardized hierarchic levels; the first, second and third levels contain five, 15 and 44 classes, respectively (see Table 1). Delimitation criteria used are first of all physiognomic features (which are identified on satellite remote sensing images by distinguishing the shape, colour, texture and pattern) of landscape objects (natural, modified and man-made ones) and their spatial relationships. LC classes are identified through computer-aided visual interpretation of satellite images (the size of the smallest identified area is 25 ha and its minimum width is 100 m).
CLC nomenclature (Bossard et al., 2000; Heymann et al., 1994).
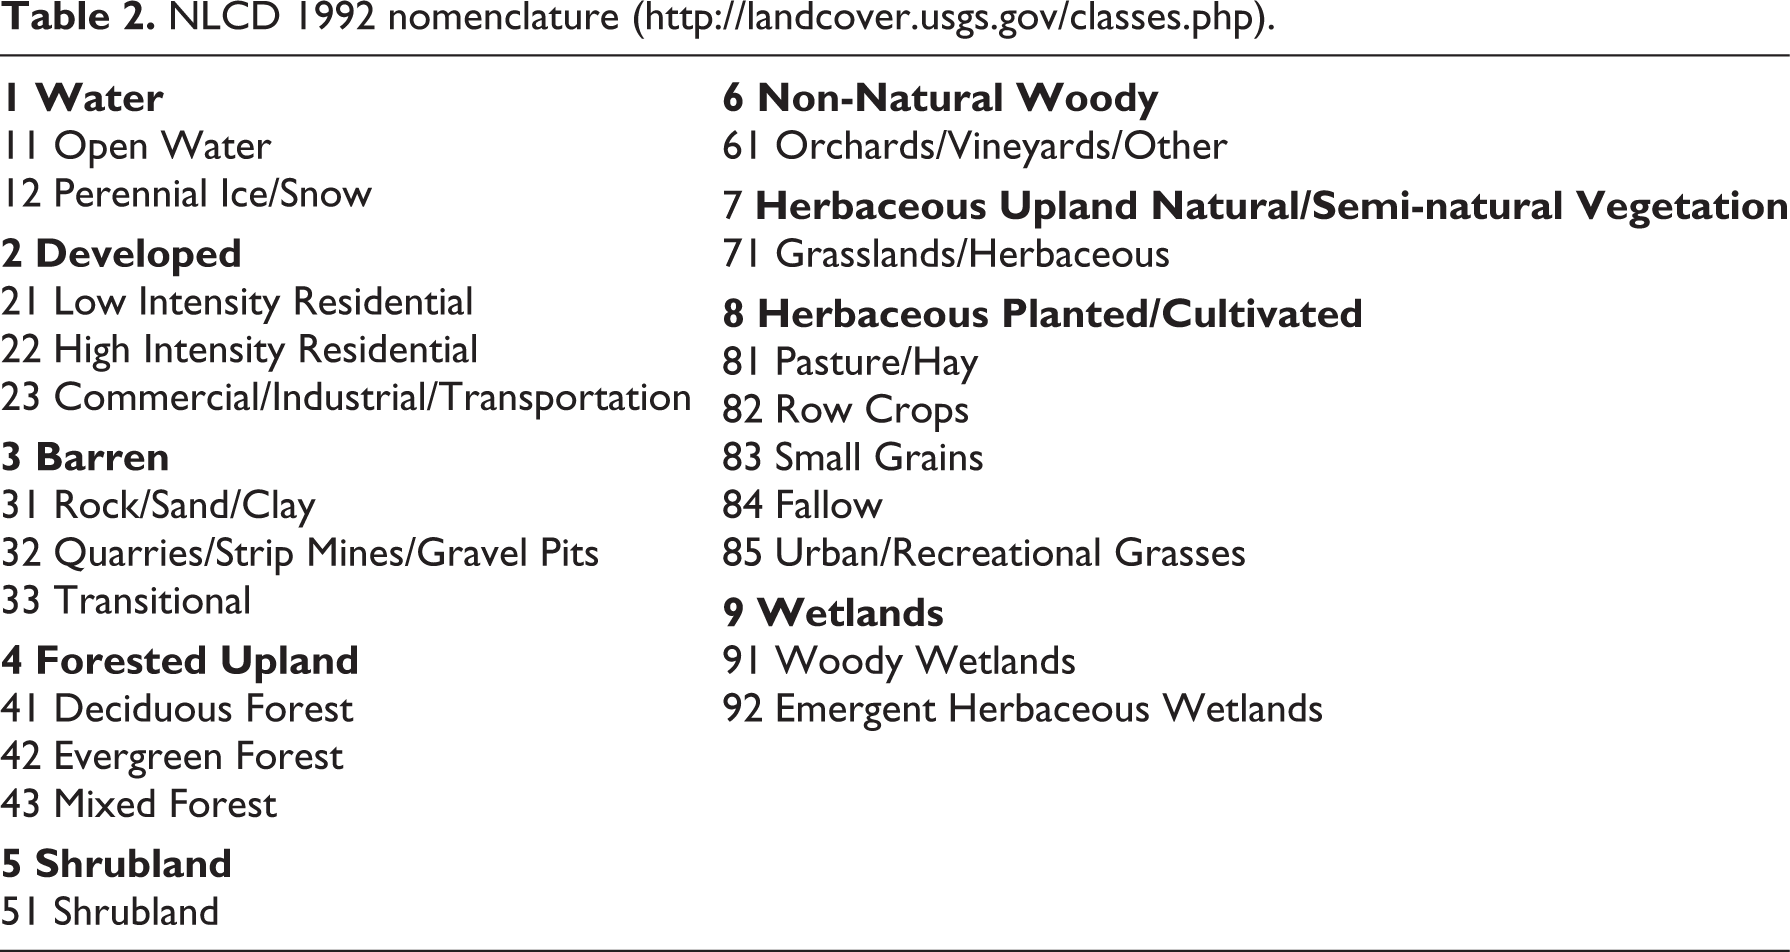
In 1992 a consortium of US federal agencies called the Multi-Resolution Land Characteristics Consortium (MRLC) pooled their resources to purchase Landsat-5 satellite data to create NLCD over the conterminous USA. It is based primarily on unsupervised classification of Landsat TM (Thematic Mapper) 1992 images. The NLCD 1992 classes are provided as raster data with a spatial resolution of 30 m. The NLCD 1992 nomenclature has two hierarchical levels. The landscape physiognomy is a delimitation criterion on the first hierarchical level that contains nine classes. Various delimitation criteria (urban type and density, vegetation or forest type, etc.) have been used to define 21 classes on the second hierarchical level (see Table 2).
NLCD 1992 nomenclature (http://landcover.usgs.gov/classes.php).
2 Approach of semantic similarity assessment by experts
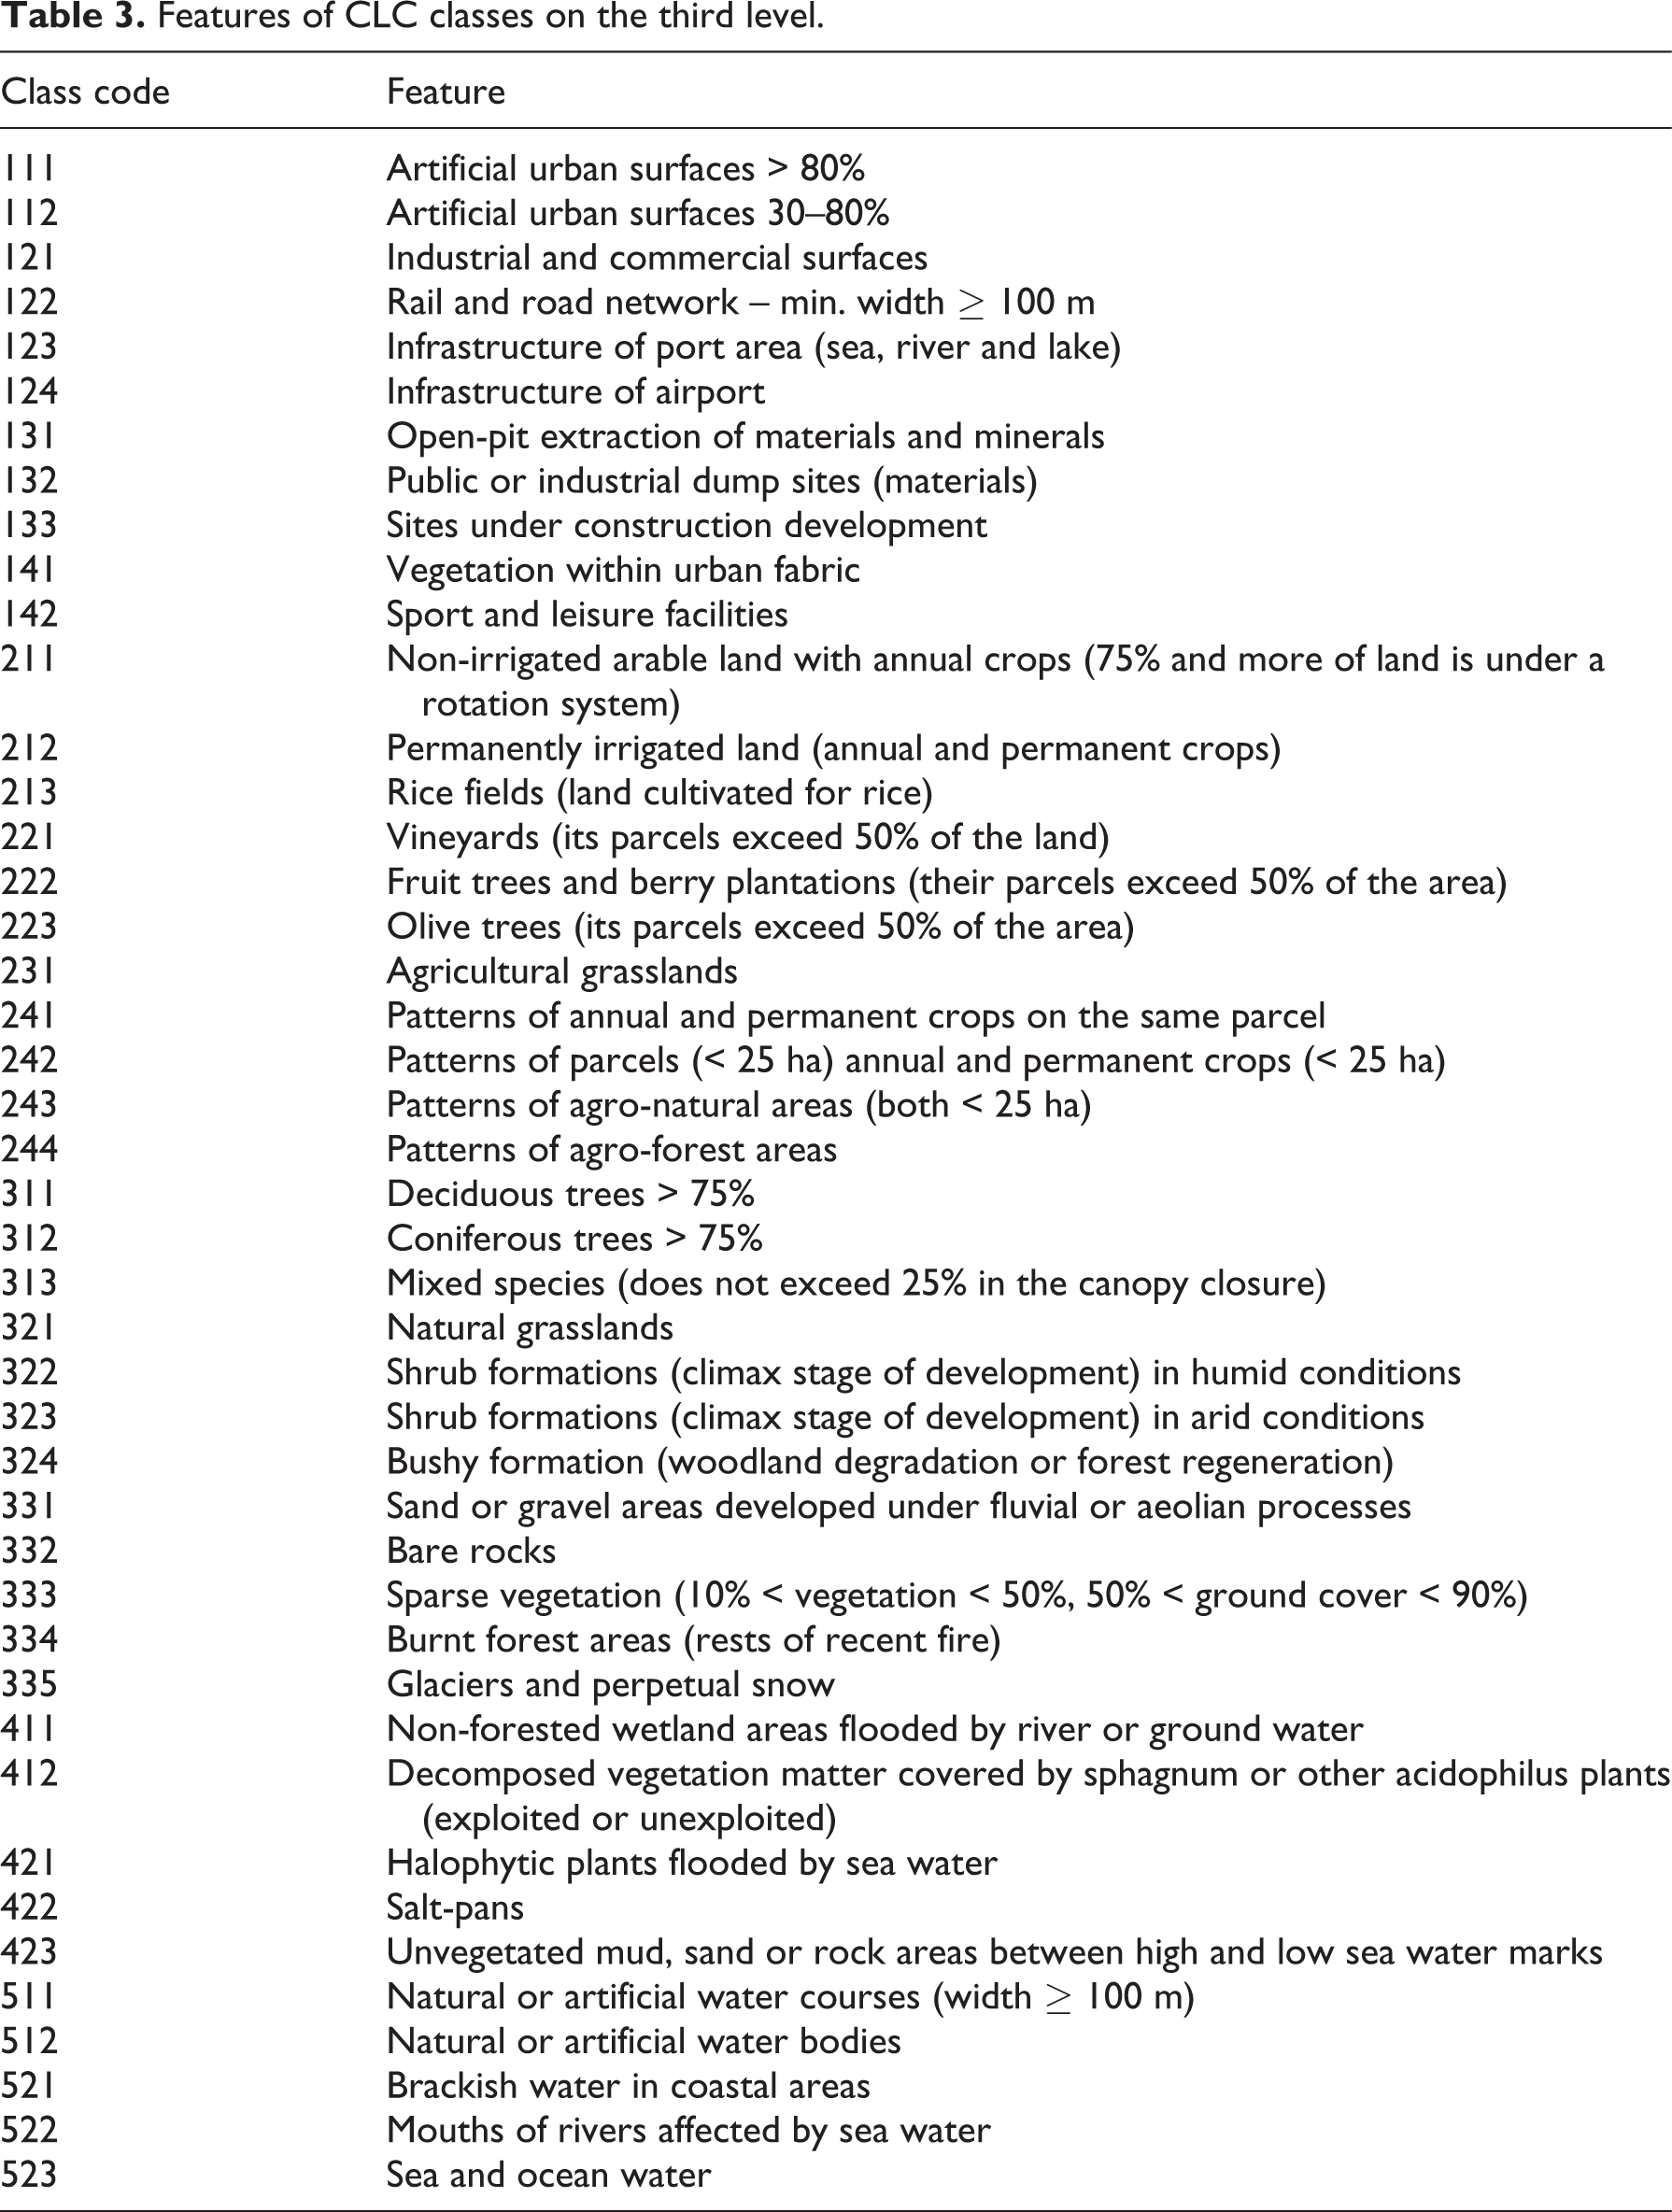
As the third CLC hierarchical level and the second NLCD 1992 hierarchical level are the most detailed ones, they are comparable. It is precisely in the frame of these levels of the mentioned nomenclature, which contain characteristics of LC classes for the territories they cover. Semantic similarity of nomenclatures was assessed by four experts possessing knowledge of these contents, who compared their definitions and features as presented in Table 3 for CLC and in Table 4 for NLCD.
Features of CLC classes on the third level.
Features of NLCD 1992 classes on the second level.

Experts have been selected based on what is referred to as expert judgement. Selection of experts was meant to be representative regarding their expertise and number. Experts represented the national level and the following criteria were applied to the selection: acknowledged expertise on land cover over relatively large areas and a certain level of knowledge about CLC and NLCD classes. Selected experts were scientists, geographers and environmentalists with experience in use of LC databases in search of solutions to environmental problems such as identification and analysis of LC changes and landscape fragmentation. No additional duties were expected from them and they were not remunerated for the assessment. Additional attributes of an ideal expert are quoted in the Discussion section. Presumably, with the increasing number of experts, variability of their assessments will increase as well before they settle down. This issue has not yet been thoroughly studied by us. For a description of different approaches to expert assessment see Cooke (1991).
Degree of similarity (correspondence) is expressed by three values:
As the content of classes pertaining to the two nomenclatures is prevailingly verbally characterized, such a simple three-stage scale is adequate for the establishment of the similarity level. If the LC classes were characterized by more detailed quantitative parameters it would be possible to use a finer scale.
Each expert compared the CLC and NLCD classes – their definitions and features (see Tables 3 and 4) – independently following the characteristics of the similarity scale (almost similar, partially similar and not similar) and filled in values 1, 0.5 and 0 in the combination table. The time allotted for filling the table was not limited, but experts did not need more than a week for the job.
Analysis of expert assessments concerning similarity between CLC and NLCD nomenclatures was carried out by means of similarity index P, which expresses the ratio of the sum of values corresponding to individual similarities of classes and the overall number of classes:
where yij is the similarity value between i CLC class (i = 1,2,3,., p) and j NLCD class (j = 1, 2, 3,., r); np is the overall number of classes of the CLC nomenclature. The higher the index P value, the higher the similarity given by the expert to CLC and NLCD nomenclatures. The index makes it possible to capture differences in similarity assessment by experts.
In terms of the methodology, a question emerges as to whether any difference arises from the order in which the nomenclatures are compared, that is, CLC versus NLCD or NLCD versus CLC, and whether there are any matter of fact differences in statements, such as ‘five CLC classes show partial similarity with the NLCD11 class’ or ‘the NLCD11 class shows partial similarity with five CLC classes’. In the case of LC nomenclatures with the same number of classes, the value of the P index is the same regardless of the order of nomenclatures. However, the number of classes in the compared LC nomenclatures is not the same. CLC has 44 classes and NLCD discerns 21 classes. In such cases, the value of the numerator of the P index will be the same but the value of the denominator will be different (44 or 21). This is why the value of the P index of the compared nomenclatures will be smaller for CLC versus NLCD than for NLCD versus CLC; however, the fundamental issue for the analysis of expert assessment of nomenclatures with an unequal number of classes is that the continuous proportion would last. The approach to the comparison of CLC and NLCD classes was applied on this premise.
However, it must be stressed that semantic aspects of the classes can only be comprehended by means of contextual relationships, which exist between objects in the patterns of a particular LC class. Good examples of different contextual relationships within the CLC nomenclature are classes 231 (Agriculturally exploited grasslands) and 124 (Airport). Grasslands represent an important component of both classes. Grassland in 231 is used for farming (mowing and pasturing) as part of the agricultural landscape, while the grass-covered areas in 124 normally represent a buffer zone (part of an airport), which is mostly an urbanized landscape. Based on correctly interpreted contextual relationships between grass-covered areas in CLC classes 231 and 124 these should not be assessed as similar. This example of the analysis of contextual relationships between classes of one classification can also be successfully applied to the assessment of classes of different nomenclatures. For instance, with regard to classes NLCD 71 (Natural grasslands prevailingly not agriculturally exploited) and CLC 243 (Areas prevailingly agriculturally exploited – arable land alternating with natural vegetation), if a part of CLC 243 is a small grass-covered area, it is agriculturally exploited. If an expert correctly comprehends the significance of the components and relationships in the context of classes 243 and 71, they should not be considered similar.
The most important contribution of experts to the assessment process of semantic similarity between classes of different LC nomenclatures is precisely their capacity to take into consideration the intra-class contextual relationships. An expert can estimate the level of similarity between LC classes not only from the object configuration but also from their mutual functional relationships.
IV Results
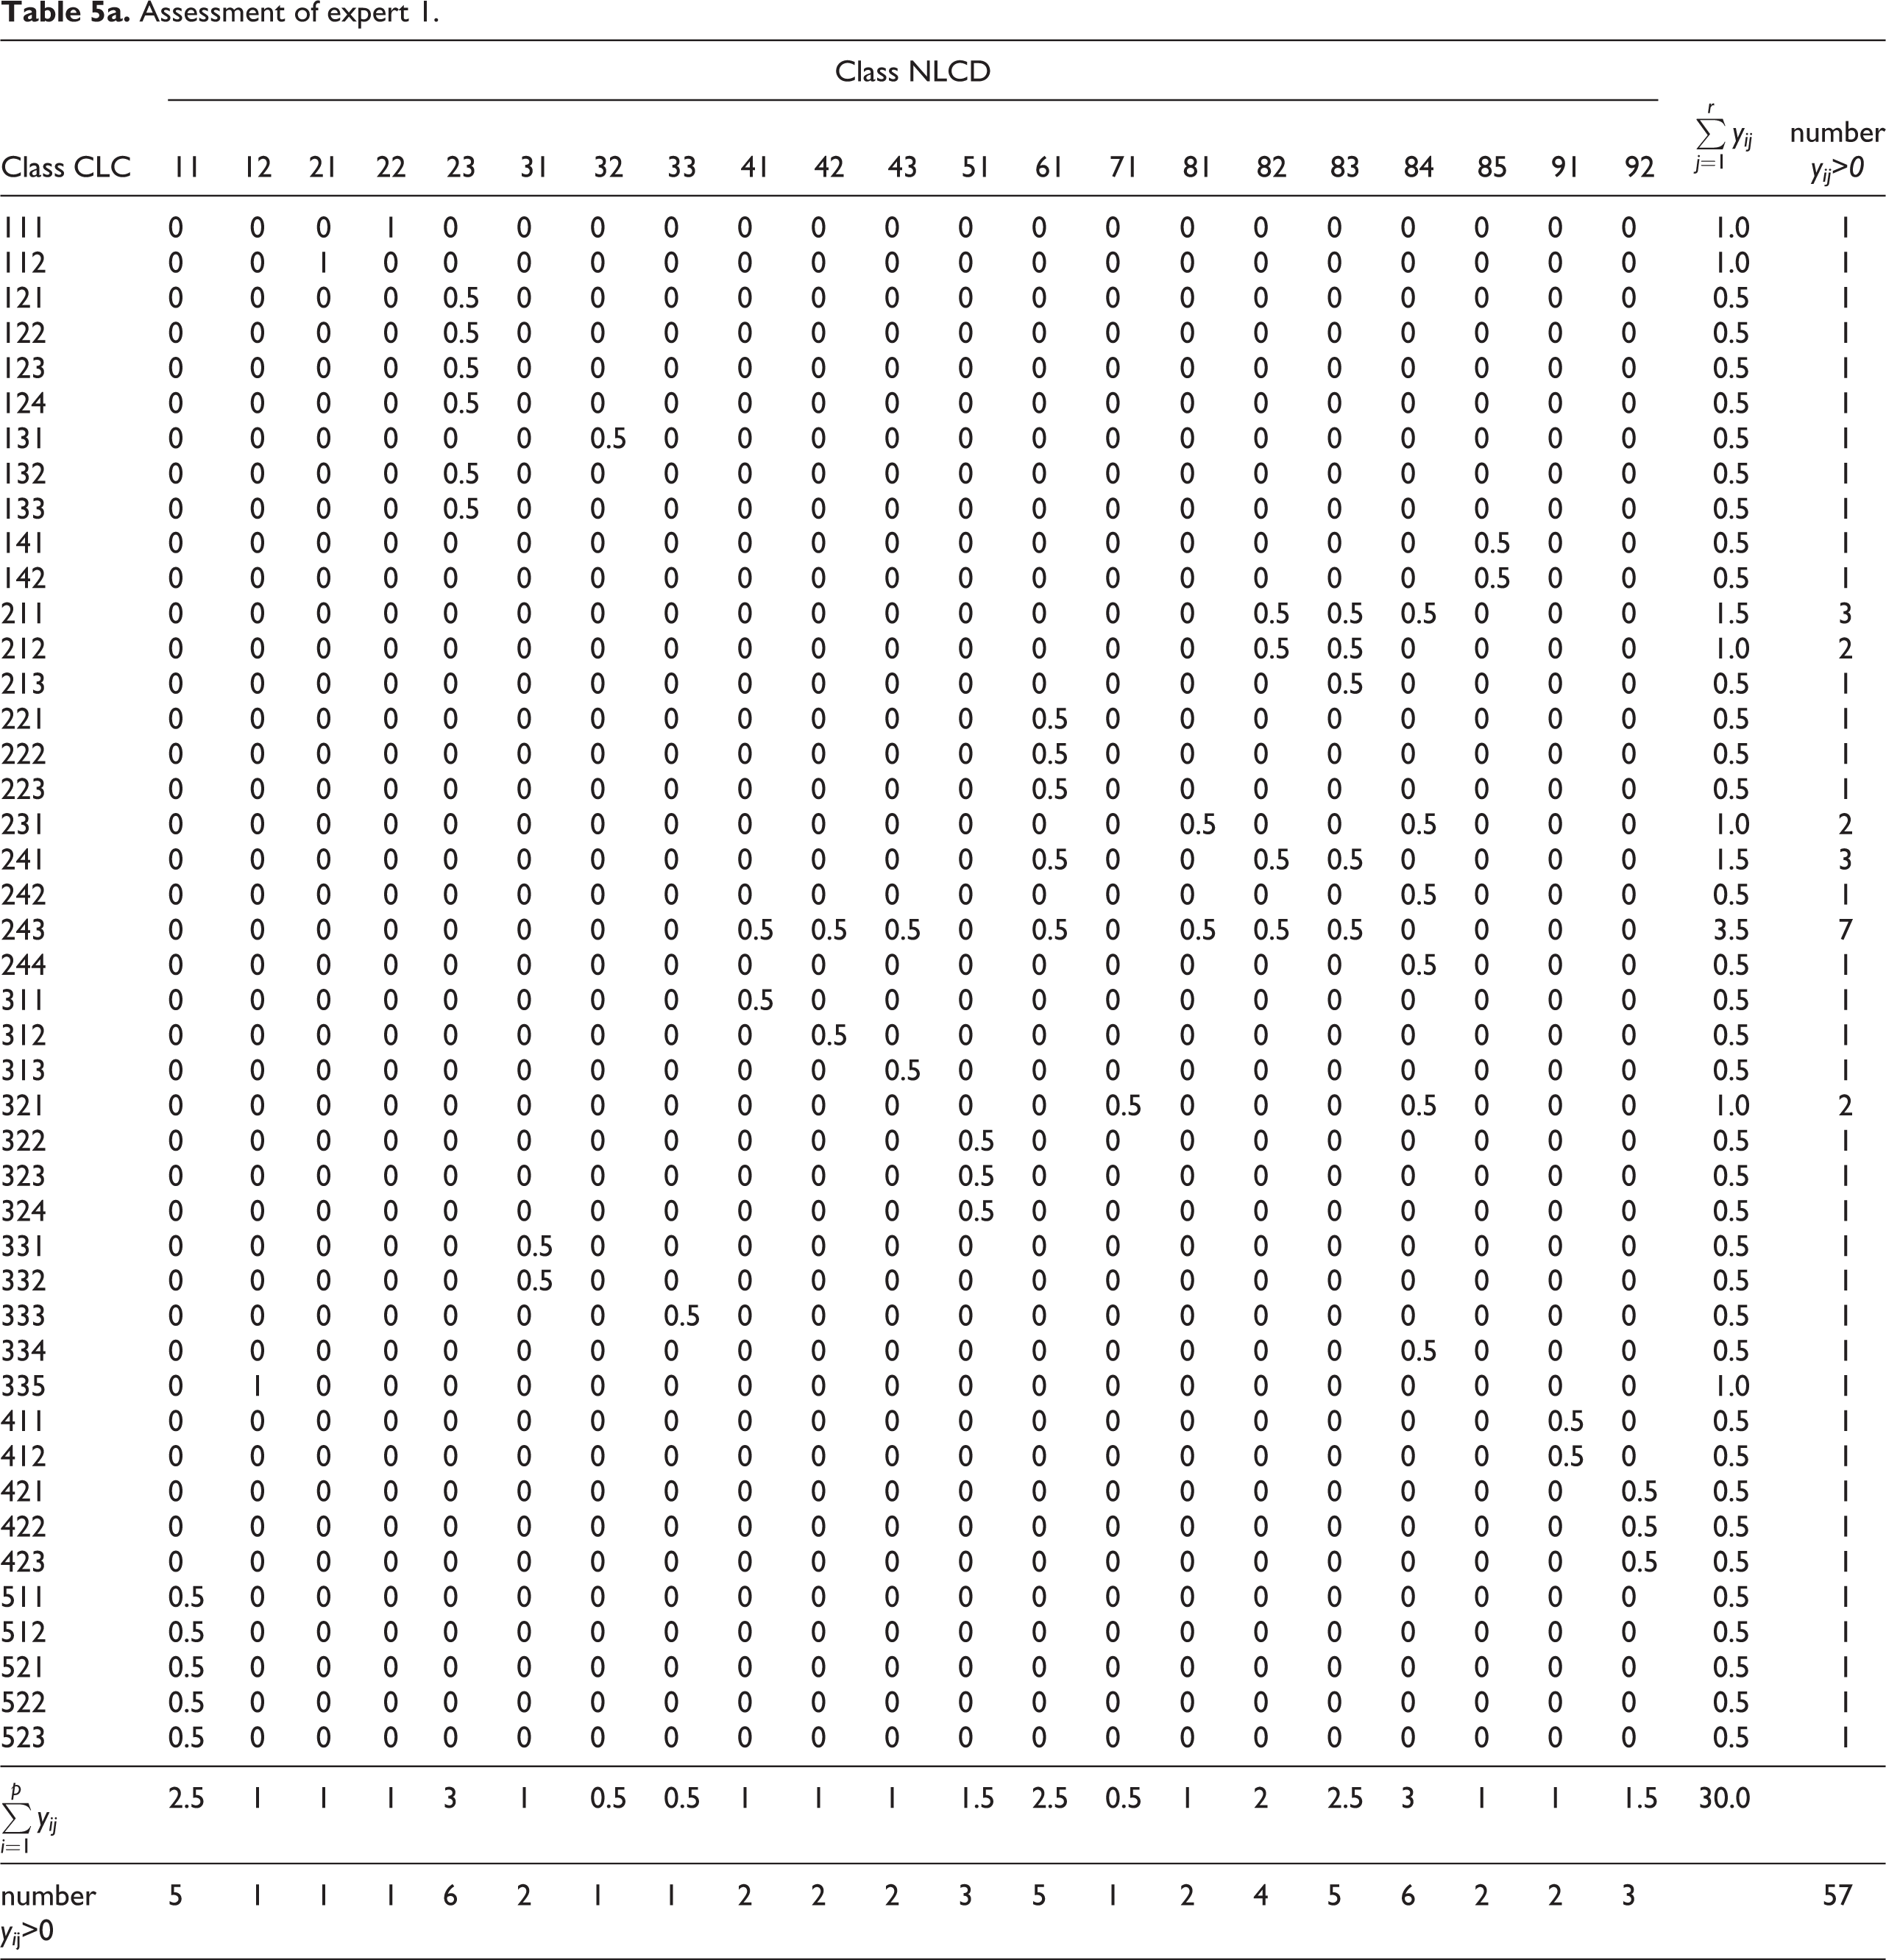
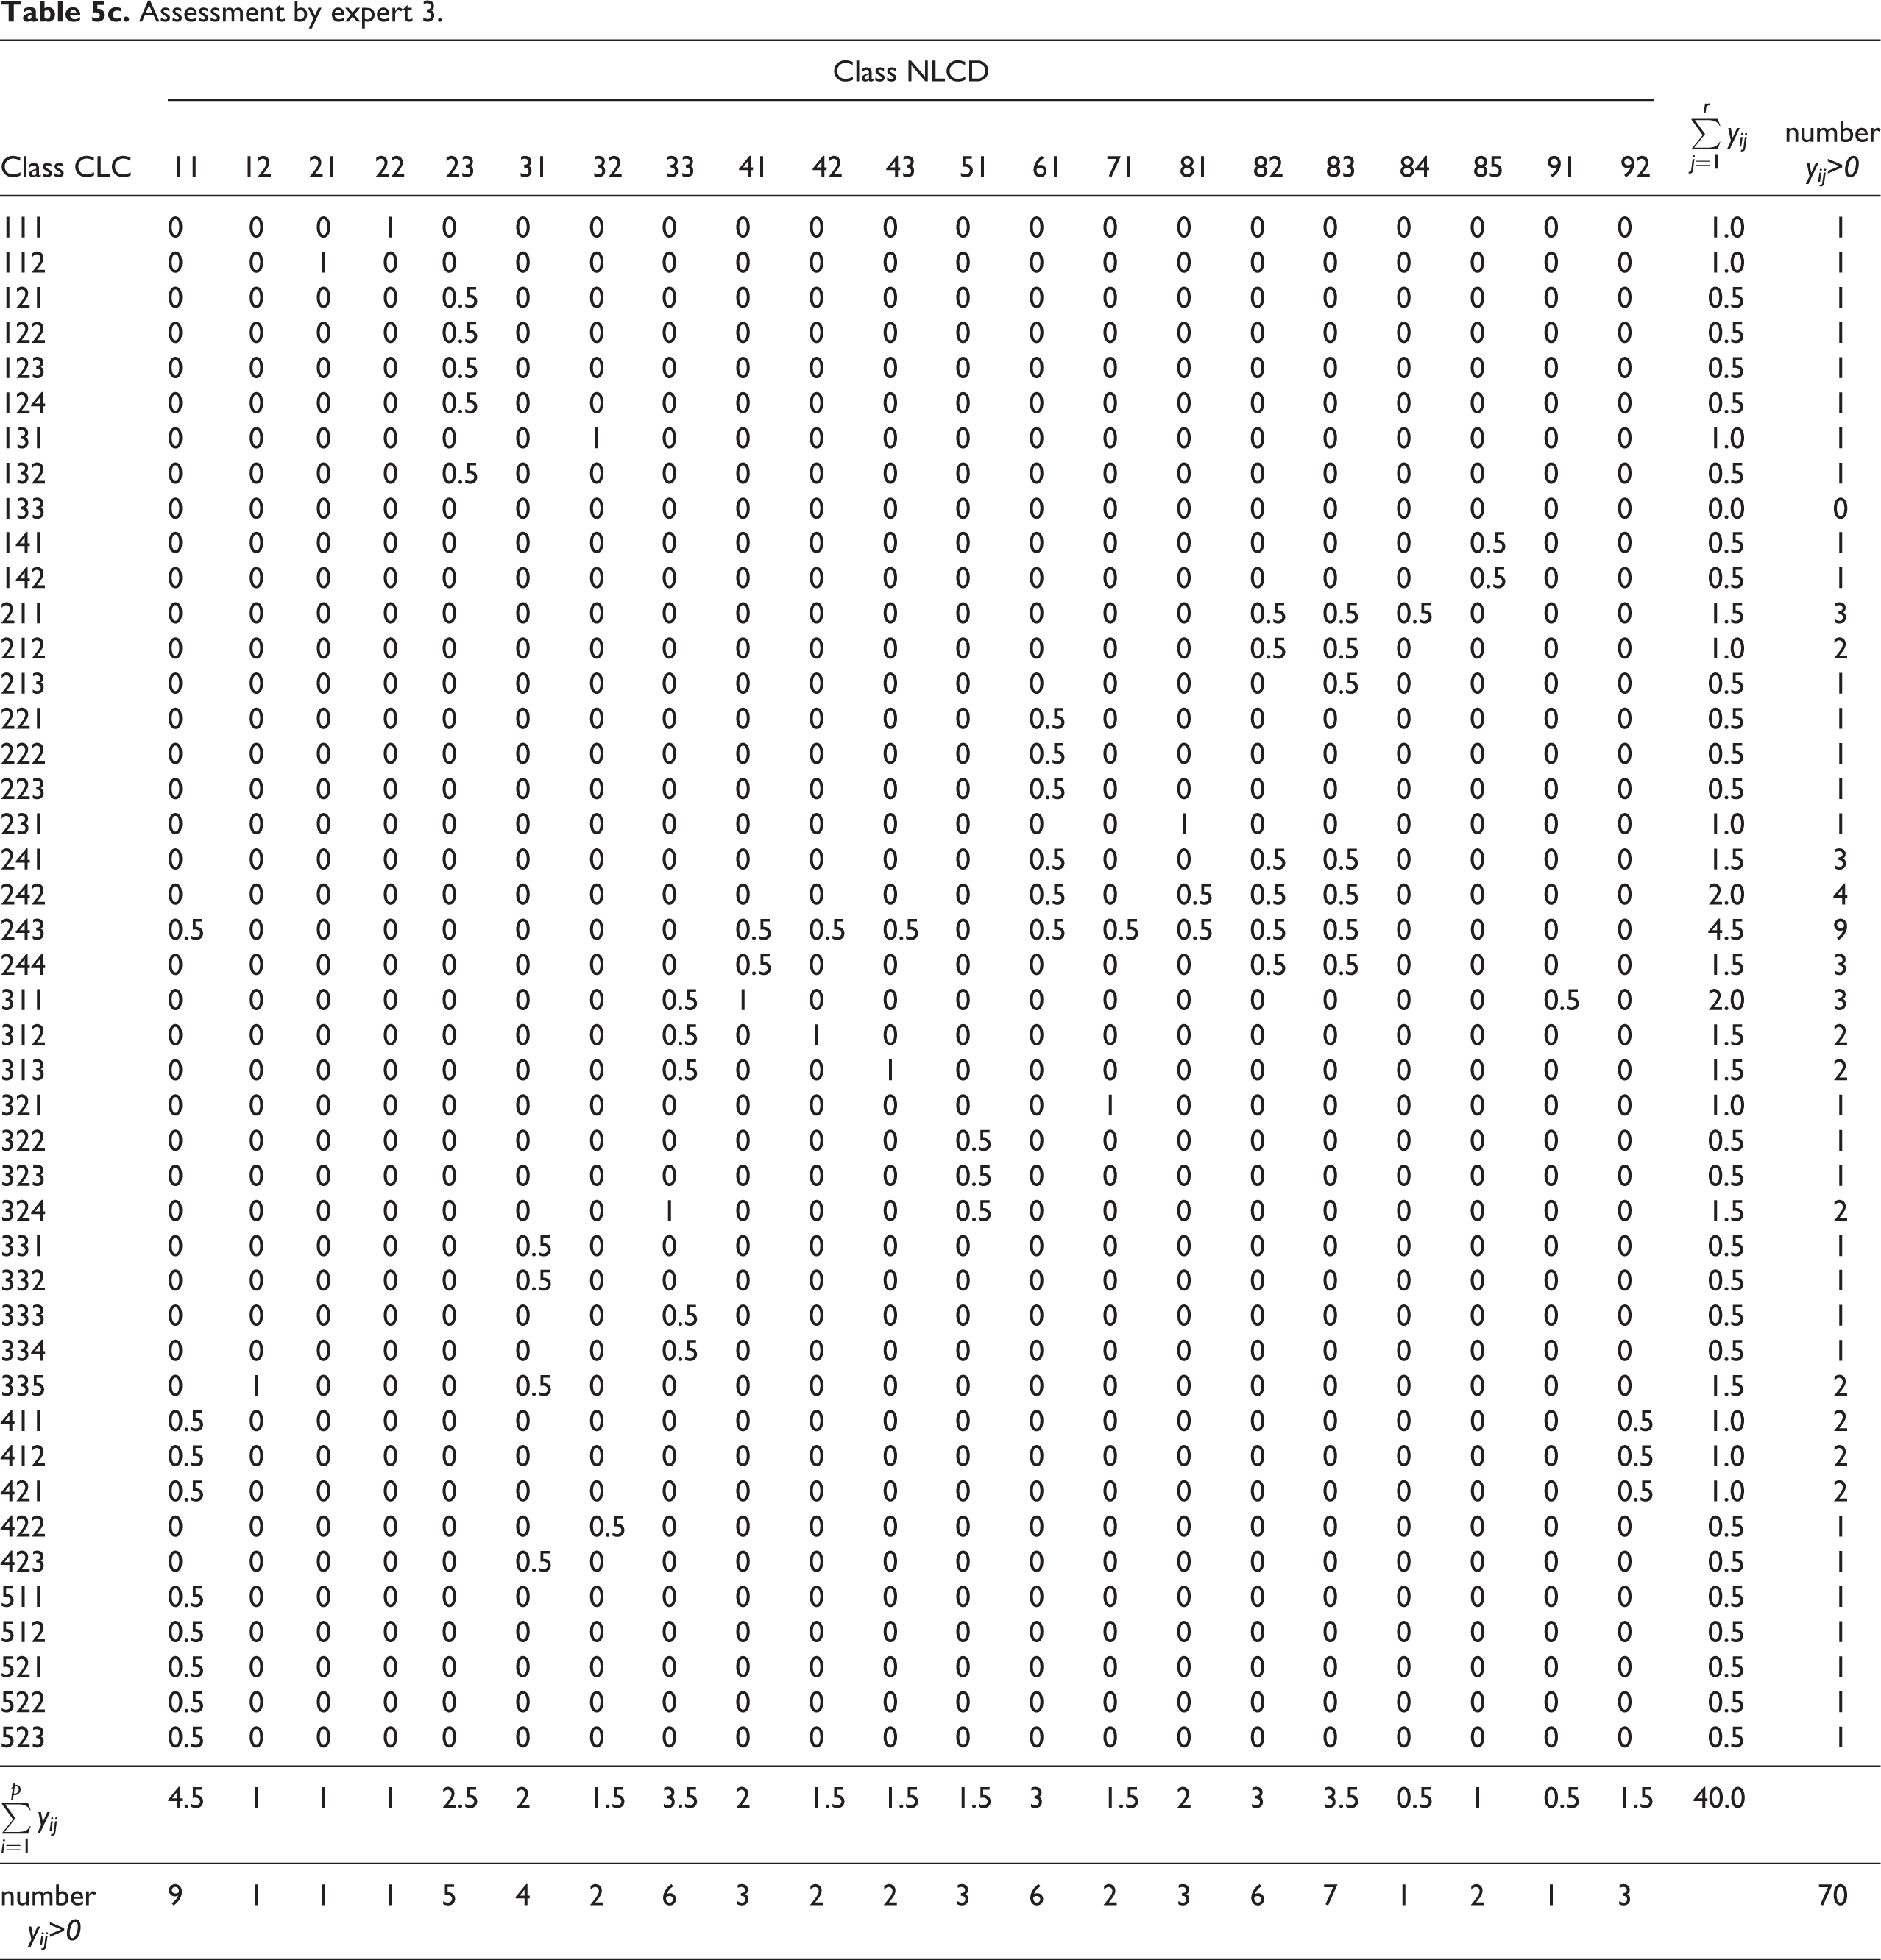
Results of the similarity assessment for CLC and NLCD nomenclatures produced by four experts via three values (1, 0.5 and 0) are presented in Tables 5a–5d. Summarized results are presented in Tables 6 and 7. Three basic features of the results are obvious from the analysis of the tables: the low number of similarities with value 1; the comparatively high frequency of similarity of one CLC class with several NLCD classes; the comparatively high frequency of cases when only one expert assigned value 0.5.
Assessment of expert 1.
Assessment of expert 2.

Assessment by expert 3.
Assessment by expert 4.
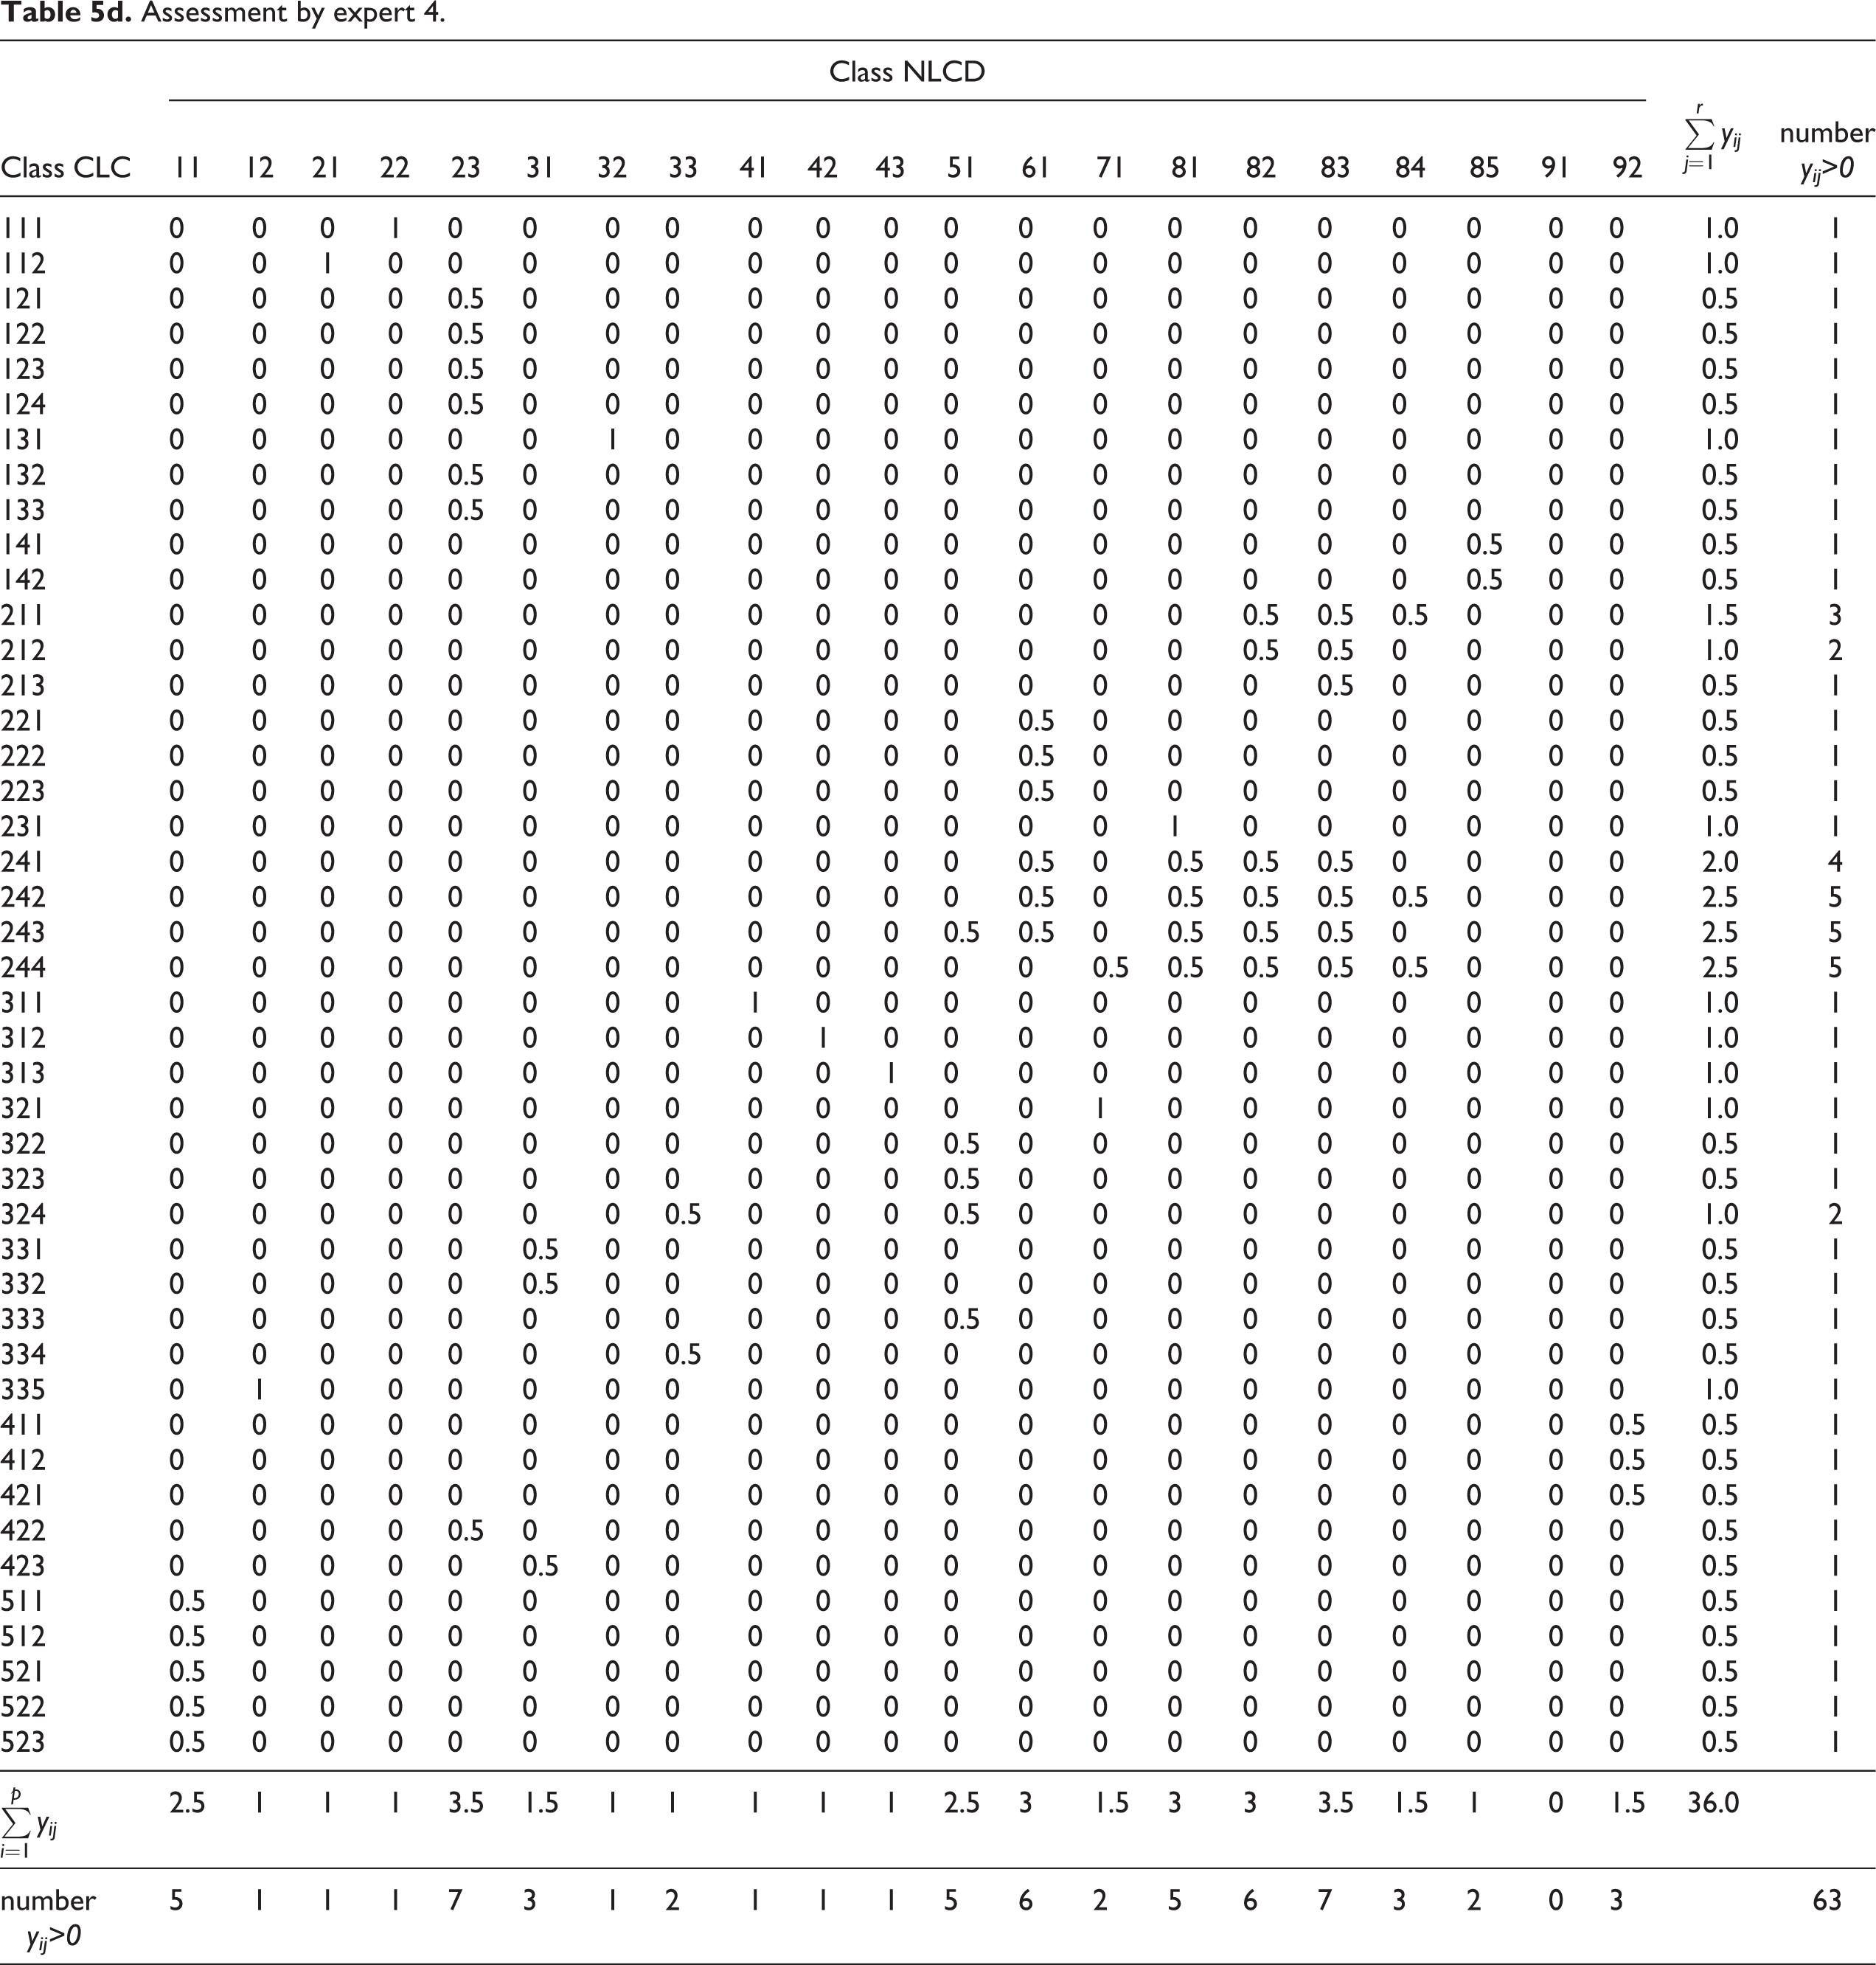
All the experts definitely agreed on assigning value 1 to only three similarities of LC pairs of classes: CLC111–NLCD22, CLC112–NLCD21 and CLC335–NLCD12. Three experts also agreed on assigning value 1 to the similarity of the following pairs of classes: CLC131–NLCD32, CLC311–NLCD41, CLC312–NLCD42 and CLC313–NLCD43. Concerning the above-quoted pairs of LC classes, their definitions represent the top degree of similarity in terms of the contents of the covered objects and their semantics, as well as the contextual relationships, and the delimited areas of both nomenclatures represent almost identical (equivalent) LC characteristics.
Partial similarity of one CLC class with several NLCD classes was found in 17 cases (i.e. values other than zero were assigned in several columns in one line). According to one expert assessment, CLC classes 241, 242, 243 and 244 show partial similarity with as many as four to nine NLCD classes. This means that CLC classes are heterogeneous in terms of contents (they contain elements of forest and land used for agriculture in various combinations).
A single expert assigned the value 0.5 17 times. This may indicate misinterpretation of the definitions of LC classes, especially their content, by means of the generalized ‘features’ quoted in Tables 3 and 4 (e.g. CLC243, heterogeneous agricultural areas, although it may ‘contain a small area of surface water’, should not be assessed as similar to NLCD class 11, open water; CLC335, glaciers and perpetual snow, is not similar to NLCD31, bare rock/sand/clay, as the pattern of class 335 ‘may also contain small rock forms’ interrupting the continuous glacier or snow cover and only bare rocks can be included into class 31). This result was affected by the fact that the contextual relationships in the framework of LC classes compared by two experts were not taken into account.
The summarized results (Table 6) show that when assigning value 1 the four experts agreed three times (AAAA situation), three experts agreed four times (AAA in combination with B), and two experts agreed three times (AA in combination with BB or B). There was no assignment of value 1 by only one expert in the assessments of the two nomenclatures (no situation A). Four experts assigned value 0.5 (BBBB) to as many as 33 pairs of LC classes, indicating their marked partial similarity. Its antipode is in the assigning of value 0.5 by a single expert (B) as many as 17 times.
Intersection of four expert assessments of CLC and NLCD classes.

AAAA – 4 experts assigned value 1
AAA – 3 experts assigned value 1
AA – 2 experts assigned value 1
BBBB – 4 experts assigned value 0.5
BBB – 3 experts value assigned 0.5
BB – 2 experts value assigned 0.5
B – 1 expert assigned value 0.5
Pairs of LC classes where the similarity was marked AAAA are equivalent and hence interchangeable in terms of application. LC classes marked AAA are almost equivalent, and interchangeability is subject to certain limitations; classes marked AA are only partially equivalent, and therefore interchangeability is considerably limited.
Pairs of LC classes marked BBBB are partially similar; their use is not liable to any limitations if those characteristics of LC objects that are evidently similar are to be respected. LC classes marked BBB are partially similar; smaller limitations must be considered in mutual comparison, as identification of partial similarity is considerably ambiguous. Classes marked BB are partially similar; their use is substantially limited, and identification of partial similarity is markedly ambiguous. Finally, pairs of LC classes marked B are partially similar and considerable limitations must be taken into account for their use, as identification of partial similarity is problematic.
Table 7 presents the values of the similarity index P which facilitates the comparison of the expert assessments. The values suggest that experts 2 and 4 assessed the similarity of CLC and NLCD nomenclatures (P = 0.80 or 0.82) almost identically. The rates of similarity of assessments by experts 1 and 3 are lower (P = 0.68) and higher (P = 0.91), respectively.
Expert assessment by means of index P.

The results of experts 1 and 3, compared to those of experts 2 and 4, contain more differences. For example, expert 3 preferred partial similarity between classes for the pairs CLC243–NLCD11 (an area containing open water should not be similar to heterogeneous agricultural areas, which nevertheless may also contain water bodies smaller than 25 ha), CLC311–NLCD33, CLC312–NLCD33 and CLC313–NLCD33 (areas of forest are considered similar to transitional shrub forms), CLC335–NLCD31 (it is problematic to consider this pair similar, as CLC335 represents glaciers and perpetual snow while NLCD31 covers bare rock/sand/clay and other accumulations of earthen material) and CLC422–NLCD32 (assignment of partial similarity to salinas and quarries/strip mines/gravel pits is also questionable). As far as the number of assigned values other than zero is concerned, the results of experts 2 and 4 are almost identical (they only differ in one value 1 and several values 0.5; see Tables 5b and 5d).
Value 0.5, expressing partial similarity, was assigned by expert 2 (missing in assessment of expert 4) to the pairs CLC411–NLCD11 and CLC421–NLCD11 (due to different interpretations of the notion open water and the potential combination of open water with vegetation in a context of wetlands), CLC243–NLCD41, CLC243–NLCD43 and CLC244–NLCD41 (these pairs of classes should be assigned a value of partial similarity 0.5, as definitions of classes CLC243 and CLC244 explicitly state that they also include small fragments of forest smaller than 25 ha), CLC231–NLCD84 (due to different interpretations of the concept of fallow land) and CLC311–NLCD91 (probably due to distinct interpretations of the definition of woody wetlands, whose physiognomy may be close to that of broad-leaved forests). On the other hand, there is an assignment of partial similarity value 0.5 by expert 4 that is missing in the assessment by expert 2 of CLC244–NLCD71 and CLC244–NLCD81 (the similarity identified between these pairs is problematic, as CLC244 only occurs in southern Europe) as well as CLC242–NLCD84 and CLC244–NLCD84 (the assigned similarity value of 0.5 is also problematic, as NLCD84 represents fallow land and part of class CLC242, while CLC244 is agriculturally worked land except for small fragments of forest, which are parts of the CLC244 pattern).
V Discussion
The benefits of the applied expert assessment are the options to assess semantic and conceptual aspects of LC nomenclatures. Such assessment is not quite possible using only a mathematical and statistical approach. It must be admitted though that the expert assessment is to a certain extent subjective, even despite the generalized verbal definitions, that is, LC class characteristics and their arrangement in Tables 3 and 4 ‘Features of LC classes’, which do provide for objective assessment. Subjectivism in the assessment process is responsible for certain differences. For instance, only two experts assigned similarity value 1 to the pair CLC324–NLCD33 as well as to CLC231–NLCD81 and CLC321–NLCD71. Experts interpreted the similarity between CLC324 and NLCD33 in different ways. A thorough analysis of the definitions of the above classes shows that LC content represented by transitional stages of forest, and so on, is almost identical. Different interpretations of similarity by experts also manifested in the assessment of CLC231–NLCD81 classes and CLC321–NLCD71 because according to definitions they are only partially similar (class 81 also contains grown legumes and class 71 is often exploited for grazing, which is rather contradictory to the natural character of genuine grasslands).
The assignment of different similarity values to LC classes is probably due to the deficient interpretation of the definitions of these classes by the individual experts. The theoretical background and general knowledge of LC classes of the four experts is approximately the same. They possess more experience and detailed knowledge of the CLC nomenclature (experts apply CLC data to various environmental projects or participated directly in their derivation) compared to the NLCD 1992 nomenclature. All knowledge the experts had about the NLCD classes was obtained from literature, but they did not possess any practical experience in their application.
The theoretical and practical knowledge of experts in LC data application, together with experience of their derivation, is the guarantee that they also have mastery of LC class definitions and the contextual relationships between objects of the classes.
An additional open problem of the approach applied is represented by the assignment of the discrete values of ‘1’, ‘0.5’ and ‘0’ to verbal descriptions of the quality but also, above all, of the quantity of different characteristics of LC classes (sporadic representation, dominant representation, etc.). Similarity cannot be exactly measured based on definitions of LC classes of the compared nomenclatures. The degree of similarity (correspondence) can only be marked by three values: 1 (almost similar), 0.5 (partially similar) and 0 (not similar).
As far as the analysis of difference in the uncertainty of CLC and NLCD nomenclatures is concerned (which was not the aim of the study), estimation of uncertainty of the two nomenclatures is similar (in a sense of lacking accuracy during the classification process). Generation of nomenclature classes is based on computer-aided visual interpretation (CLC) and unsupervised classification (NLCD) of satellite images. Both systems provide textual description of each class (there is no system of parameters and their values enabling automated decision based on logical rules). Reduction of uncertainty is also supported by an in-depth description of each class, which specifies features that can be incorporated into a class. The CLC has more detail description than NLCD, while CLC combines the aspects of LC and LU to a larger extent than NLCD.
The weak point of expert assessment of semantic similarity is human subjectivity, which may cause errors of omission and errors of commission (Haimes, 2012). It seems that experience acquired in identification of LC classes via data collected in the field and remote sensing data as well as perfect familiarity with the content of verbal definitions characterizing LC classes of different nomenclatures and comprehension of contextual relationships between objects of LC class patterns as well as participation in various pertinent training courses (dealing with the use of compared nomenclatures and harmonization of LC data) are the attributes considered relevant and necessary to decrease subjectivity and differences between individual expert assessments.
The existence and future generation of different bases of spatial data at national or supranational levels made it necessary to harmonize them for the sake of efficient progress in this area. The launching of the INSPIRE (INfrastructure for SPatial Information in Europe) and SDI (Spatial Data Infrastructure) activities is the proof. Via the INSPIRE initiative, for example, a legal framework necessary for building of the European infrastructure of spatial data and their standardization and accessibility is being prepared. Expert assessment may contribute to the selection and grouping of LC classes of different nomenclatures, which boast some degree of similarity. This is how they are ‘pre-prepared’ for further more detailed analysis of similarity level, which may eventually accelerate their applicability.
Awareness of semantic similarity of LC classes pertaining to different nomenclatures is important for the similarity assessment useful for the analysis and evaluation – for instance, forest fragmentation due to human activities, changes in urbanization rate or abandonment of farmland under effects of socio-economic conditions. In this way, experts should be comparatively rapidly able to choose LC classes of different nomenclatures that are similar and consequently suitable for the quoted assessments.
VI Conclusion
An awareness of the semantic similarities between LC classes of different nomenclatures may be important first of all for their potential use when solving those environmental tasks in the global context which require a combination of different LC data or where their harmonization is required. While assessing the LC nomenclatures, their specificities (number of classes, contents heterogeneity, methods used for generation of classes, etc.) must be borne in mind. The applied similarity assessment of LC nomenclatures depends on the capacity of an expert to reveal and comprehend the semantic particularities of individual LC classes and their contextual relationships.
Values of P (see Table 7) demonstrate the similarity of the assessed CLC and NLCD nomenclatures as a whole by individual experts. The similarity indexes of experts 2 and 4 are very close (P = 0.80 or 0.82), as the assigned similarity (Tables 5b and 5d) proves. The similarity indexes of experts 1 (0.68) and 3 (0.91) differ markedly (see Tables 5a, 5c and 6), possibly due to partially different interpretations of the definitions corresponding to the compared LC classes.
The results of the similarity assessment for CLC and NLCD nomenclatures (see Table 6) show a low frequency of similarity value 1, which expresses the equivalence of compared classes, and a high frequency of partial similarity value 0.5 as well as a comparatively high frequency of cases where value 0.5 was assigned by only one expert, suggesting that the CLC and NLCD nomenclatures cannot be considered very similar. Marked differences in the number of classes (CLC 44 and NLCD 21) and the identification methods applied may be the principal reason. CLC classes were identified by computer-aided visual interpretation of Landsat, SPOT and IRS data (the content of classes in this nomenclature is more detailed and hence more homogeneous). NLCD classes were identified by unsupervised classification of Landsat TM data (the classes are defined in less detail so the content is more heterogeneous).
As far as the compatibility of CLC and NLCD data (see Table 6) and the potential common application to different environmental projects are concerned, only 10 pairs of classes are partially or fully equivalent and hence partially or fully interchangeable, while 58 pairs of classes are partially similar and their application is subject to certain limitations. Finally, the use of 17 pairs of classes denoted by only one expert as partially similar must be considered problematic.
Based on these results, an expert similarity assessment of LC classes should be preceded by a more exact approach as the particular pairs of classes have already been assigned a certain degree of similarity and may be further analysed by more sophisticated methods.
Footnotes
Acknowledgements
The authors are grateful to anonymous reviewers and the editor Karen Anderson for helpful comments. They thank Louisa J.M. Jansen for many helpful comments and suggestions on the manuscript. Finally, they thank Hana Contrerasová for translation of this paper into English.
Funding
This paper is one of the outputs resulting from the framework of projects 2/0006/13 ‘Changes of cultural landscape: analysis of extension of urban fabric and farmland abandonment processes applying land cover databases’ and 2/0091/12 ‘Flood risk for communes of Slovakia’ pursued at the Institute of Geography of the Slovak Academy of Sciences with financial support from the VEGA grant agency.