
Abstract
This study develops a mixed, systematic, low-cost methodology to define and map native vegetation and the spread of the most aggressive invasive species in islands biomes, focusing on the Galápagos National Park (GNP). Based on preliminary legends defined by experts, Landsat 8/OLI fusion imagery was used for object-oriented classification to obtain the vegetation map of this archipelago. This technique was later verified and validated using high-resolution images from unmanned aerial vehicles (UAVs, i.e., drones) and dedicated satellites, ground truthing, and visual confirmation around GNP coasts. This mixed methodology allowed mapping of nine native ecosystems, six invasive-dominated vegetation units, and two types of lavas. Around 53.63% of GNP is covered by native ecosystems and ∼2.2% is “canopy” dominated by invasive species to date. Native-dominated deciduous forest types cover ∼40.8% of the GNP and only ∼12.8% of the protected area is nowadays covered by humid and transitional type native ecosystems. Among humid native ecosystems, those distributed in the highlands only cover 4.8% and are highly threatened by invasive species, which are mostly distributed in these summit areas. Of the five islands (out of 18) recording invasive-dominated units, Isabela and Santa Cruz were the most infested. Cedrela odorata, Pennisetum purpureum, and Psidium guajava were the main invasive plants dominating the GNP canopy. Highly noxious Rubus niveus was the only invasive species dominating areas among the five infested islands. Methodology detailed here proved useful to provide accurate spatially-explicit islands vegetation data, potential for replication in time, and is expected to aid suitable management of highly endangered and unique biotas in this and other tropical island biomes.
I Introduction
Due to unique environmental conditions and high species endemism, tropical islands are considered conservation priorities among biodiversity hotspots (Gillespie et al., 2014; Myers et al., 2000). Tropical islands experience relatively large developmental pressures and impacts that risk their biological uniqueness, such as rapid habitat transformation and invasive species (Spatz et al., 2017).
Despite increasing efforts by national authorities and related organizations to acquire information that contributes to the protection of tropical island biomes, some areas are still lacking basic maps that at proper scales define distributional ranges of native-dominated vegetation and the main invasive species (non-native organisms introduced by humans that outcompete native species) that often colonize these ecological units (Asner et al., 2008; Helmer et al., 2002). Potential explanations for this knowledge gap vary from difficulty in obtaining affordable, temporally-different, cloud-free satellite images, the high cost of flying aircrafts (and producing high resolution images of the many and scattered islands), the hazardous climate which makes landing aircrafts challenging, or the rugged, difficult to transverse terrain (Auken et al., 2009; Devoto et al., 2012). These and many other logistical and financial problems are common when gathering island spatial information, and thus highlight the need for methodologies that can create accurate vegetation maps of tropical island biomes.
There are significant advantages to having comprehensive and replicable vegetation maps (in space and time) of tropical island ecosystems. Baseline maps, in the short term, provide spatial knowledge of the units’ distribution, and the habitat characteristics explaining particular arrangements. In the long term, through replication using similar methodologies, they allow for comparison of surface area coverage and the conditions (i.e., other species, climate change, or human related threats) that cause them to contract or expand through the years (Xie et al., 2008). Further, the capacity to map invasive-dominated units on island systems is of utmost importance to deliver accurate information on the zones these species occupy (in the present and future) and, which native vegetation units are being impacted by invasive colonizers (Asner et al., 2008). Invasive species are considered one of the most prominent threats to local biota on islands (Kueffer et al., 2010). Thus, it is essential to provide decision-makers with accurate and comprehensible spatial information that will assist in pest control efforts in islands around the world.
From a methodological perspective, satellite-based remote sensing has facilitated advances in modeling, mapping, and understanding of terrestrial ecosystem distribution (Lefsky et al., 2002), and has also been used for basic ecological research (Kerr and Ostrovsky, 2003). Among available satellite remote sensing programs, the Landsat series of satellites are particularly useful tools for monitoring and mapping land cover biophysical properties (Roy et al., 2014). These sensors provide a continuous record of 44 years of space-based surface observations currently available for free download (www.nasa.gov/mission_pages/landsat/main).
The new Landsat mission, Landsat 8, provides near-global coverage and presents new opportunities for vegetation classification (Chaofan et al., 2016; Roy et al., 2014), mainly because its 15 m panchromatic band improves the spatial resolution of maps through image fusion processes. Additionally, the use of free images like Landsat in mapping campaigns may ensure repeatability in time (and space by allowing the comparison of vegetation maps within and among islands), which can help efficient biodiversity monitoring in remote and developing countries recording tropical island systems. One of the most common vegetation indicators that can be obtained from multispectral imagery such as Landsat, and a tool that could be used to fill the gaps in vegetation classification on island systems are vegetation indexes. These indicators, including the widely known normalized difference vegetation indexes (NDVI), can help in differentiating vegetation types among ecological and abiotic gradients (such as the ones that are characteristic of islands). This makes them promising for initial coarse-scale differentiation between invasive and native-dominated flora (or differentiation within each of these categories, i.e., at the species level) that occur in isolated land masses (Martinuzzi et al., 2008).
Recently and in a parallel fashion to the development of vegetation indexes, many researchers have engaged in the innovate concept of object-oriented analysis to classify moderate resolution images, like those from Landsat 8, to improve the classification accuracy as compared to the traditional, pixel-based approach (Al Fugara et al., 2009; Chaofan et al., 2016; Shimabukuro et al., 2015; Weih and Riggan, 2010; Yoon et al., 2003; Zhai et al., 2016). The use of object-oriented approaches for mapping ecological units has increased because they facilitate classification of real world objects (i.e. vegetation) that can be characterized by contextual and spectral information, an outcome that is not easily achieved through traditional methods (Baatz and Schäpe, 1999).
In addition to improvements in satellite imagery, the recent and rapid development of hi-tech tools that collect hi-resolution images, such as unnamed aerial vehicles (UAVs) or “drones,” is expected to significantly improve biodiversity mapping (Geller et al., 2017; Getzin et al., 2014; Ivošević et al., 2015; Koh and Wich, 2012; Marvin et al., 2016). The accessible, low-cost, and high-resolution images produced by these vehicles can help in particular to fill gaps from Landsat or other satellite sensors that cannot capture close-up images due to the presence of clouds. In addition, these high-resolution images can be used to verify preliminary maps generated by satellite images and related indicators through ground truthing. As such, combining the use of drones with other remote sensing techniques like those previously described can produce affordable maps, which in turn may contribute to the formulation of environmental policies and strategies that strengthen local administrative and conservation-related processes (Andrew et al., 2014; Cohen and Goward, 2004; IDEAM et al., 2007).
Using Galápagos, one of the most iconic islands systems globally as an example, this paper seeks to fill knowledge gaps in the spatial distribution of native and invasive-dominated vegetation units on tropical islands by: (a) detailing a methodology that identifies and details the particular characteristics of different vegetation types in island ecosystems and; (b) generating an updated vegetation map for the Galápagos National Park (GNP or “protected zone”) that is expected to be used as a baseline for future mapping exercises and conservation planning. These maps not only provide the most accurate spatial representation of Galápagos vegetation units and related statistics to date, but also include important biotic information that defines these mapped elements and will facilitate the continued gathering of information for improving and maintaining proper vegetation classification. Above all, the mixed methodology presented here (i.e. expert participation, object oriented classification, and validation using high resolution images), is expected to aid related investigations in island sites that have similar logistical constraints to geographic data gathering to those in the Galápagos, and lack basic but important information on vegetation distribution.
II Materials and methods
1 Study area
Galápagos is under the political jurisdiction of Ecuador and is located approximately 1000 km to the west of the country’s Pacific coast. The archipelago, which comprises a total land surface of about 798,500 ha, is formed by 13 major islands, five minor islands, and 216 islets and minor rocks (DPNG, 2014). Of these rocky outcrops, four, namely Isabela (south), Santa Cruz, San Cristóbal, and Floreana, are presently inhabited by human settlers (Figure 1). This study focuses on mapping native and invasive-dominated vegetation units in the land protected area of Galápagos, the GNP, which in total includes 96.77% of the insular land surface and excludes area defined as agricultural/development lands.
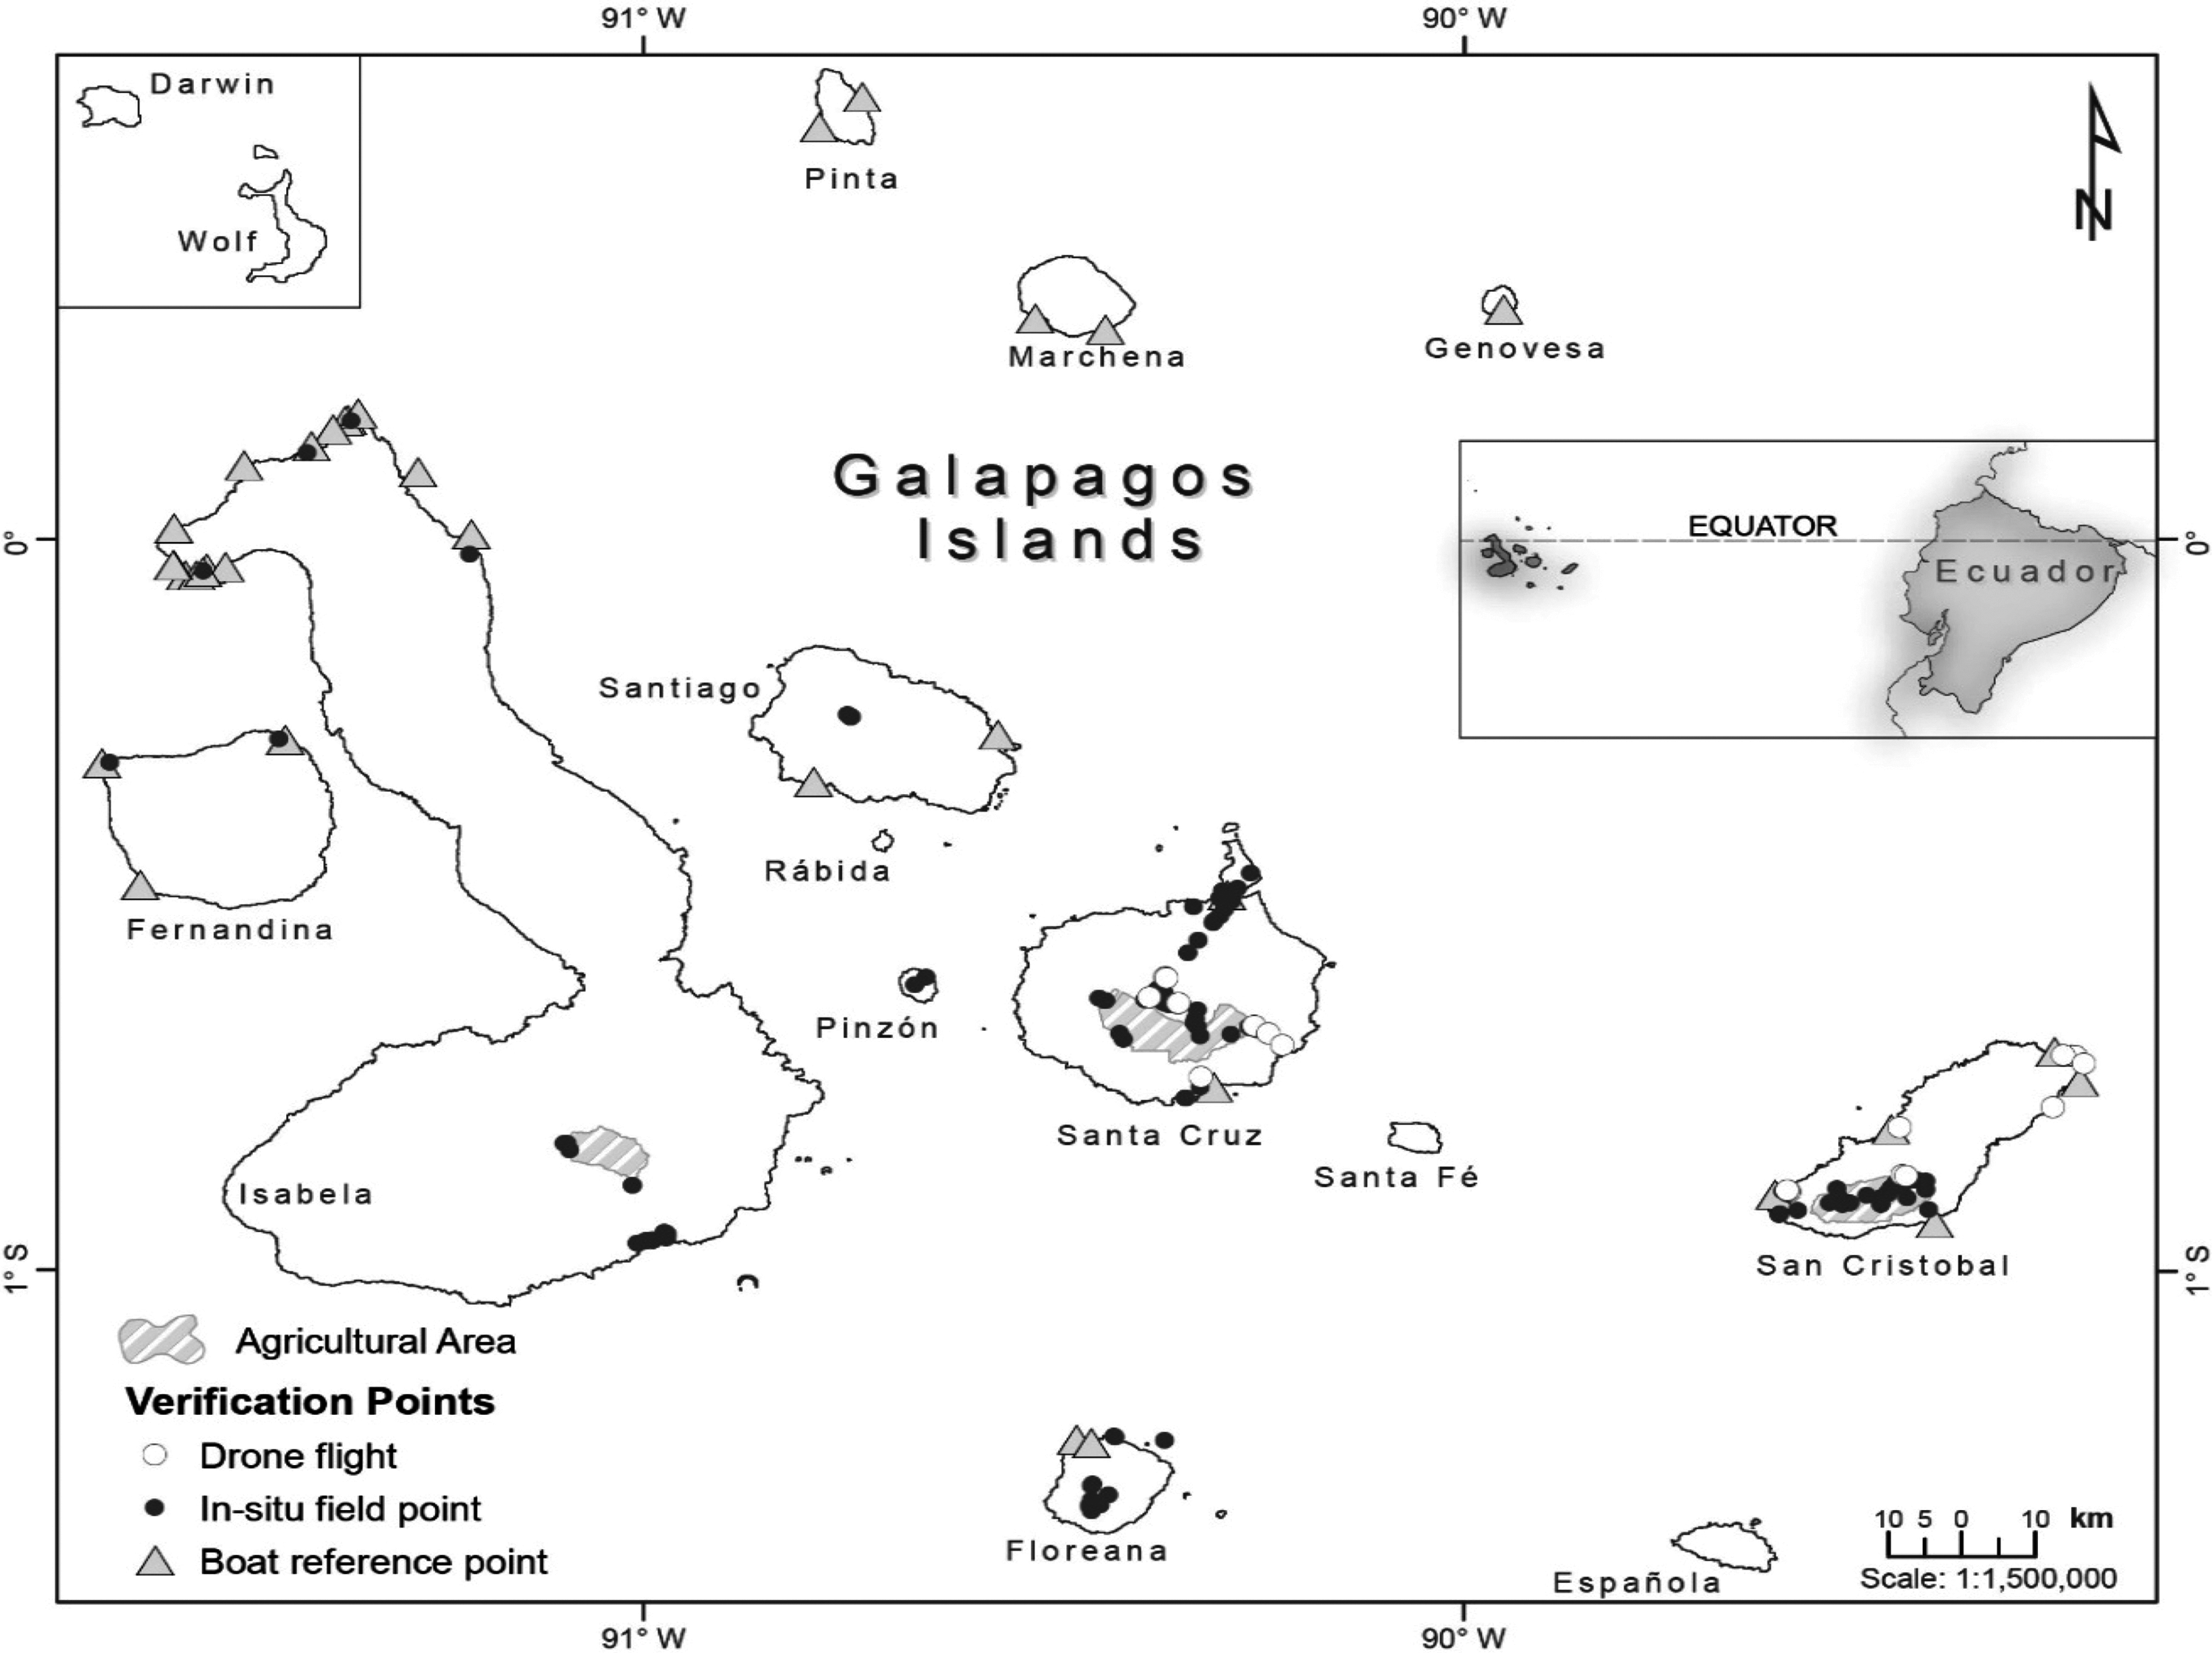
Geographical location of Galápagos in relation to mainland Ecuador. Agricultural lands or not protected areas are highlighted for the four islands presenting human settlements: Santa Cruz, San Cristóbal, Isabela, and Floreana (from higher to lower number of inhabitants). Darwin and Wolf in the northwestern limit of the archipelago are located closer in this map for illustration purposes.
Currently, more than 40% of the vascular native plant species found in Galápagos are estimated to be endemic (Bungartz et al., 2009), and around 31% of these are considered rare, while only 38% have stable populations (Adsersen, 1989). As in other parts of the world, the set of unique species that define the Galápagos are under constant threat mainly due to non-native invasive plants (Guézou et al., 2010; Trueman et al., 2014). Over time, non-native species have transformed into plagues difficult to control (i.e., invasive species), colonizing vast areas and displacing the native and endemic biota (Rentería and Buddenhagen, 2006). The Galápagos have more than 870 non-native plants of which approximately 10% might be categorized as invasive or as highly threatening because of their high dispersal rates and colonization capacity (Guézou et al., 2010; Williamson and Fitter, 1996).
Ecuador, on the other hand, has been recognized as one of the most biodiverse countries in the world (Balslev et al., 1998; Myers, 1990; Orme et al., 2005). The astonishingly high species diversity is also seen on larger ecological scales. The most recent initiative that mapped vegetation and ecosystems in continental Ecuador using a regional methodology (MAE, 2013a) recorded a stunning 91 continental vegetation units in only 248,360 km2. This number is even more striking when contrasted with comparable mapping initiatives in other countries (e.g., California in the USA has about 424,000 km2 and 111 vegetation units; Comer et al., 2003). In spite of such a remarkable number, larger ecological scale diversity in Ecuador is underestimated, mainly because Galápagos (a province of Ecuador) does not have a systematic representation of its main vegetation units.
2 Definition of vegetation units and preliminary legends
In order to outline the vegetation units in the Galápagos and that were identified, classified and cartographically represented in the resulting maps here, we followed two steps: first, definition of preliminary legends using bibliographic sources and previous attempts to map vegetation in the archipelago; and second, verification and ground truthing to validate the preliminary legends. For both steps, experts’ opinions were formally gathered in workshops to define preliminary legends and to validate the final legends. Here we define a vegetation unit according to the Classification System of the Vegetation Map for Continental Ecuador (SCMVEC in Spanish, MAE 2013a) that follows national and regional criteria to classify vegetation. According to the SCMVEC, a vegetation unit must be defined using “an array of methodologies that allow to group and limit biotic communities and their interactions with the elements in the environment, in a logical and ordered manner, to obtain different categories in an inclusive and hierarchical fashion. Because vegetation constitutes the most visible element of an ecosystem (considered here as a synonym to ‘vegetation unit’) this feature is used to spatially differentiate and geographically classify such units.”
2.1 Preliminary legends definition
Preliminary legends are defined as the initial descriptions of each vegetation unit that were later assigned a proper name (i.e., final legends) and used to geographically classify the observed units from satellite images (see Object-oriented classification section). Preliminary legends consisted of a name and a short description of the abiotic and biotic environmental variables characterizing the vegetation units. Preliminary legends were assigned following the SCMVEC (MAE 2013a) in order to maintain a classification that makes the outcome presented here consistent with those used at national and regional levels (Comer et al., 2003; MAE, 2013a). This is why the nomenclature for the native-dominated vegetation units defined here include the phenological characteristics of each unit (i.e., evergreen vs deciduous), habits of main dominating species and physiognomy (forest vs shrubland/tallgrass), and in some cases, location above sea level (i.e., highland or lowlands). It is important to highlight that the mentioned classification system (MAE, 2013a) was only used as a nomenclatural tool and did not affect the definitions of the vegetation units; because of the historical conditions of isolation, these units are recognized here as unique to these islands and not similar to other units existing in continental Ecuador.
To define each preliminary legend for native-dominated units, published bibliographic descriptions of vegetation changes for the Galápagos were used to systematically classify different vegetation units depicting floral and environmental changes within the archipelago (Itow, 1992, 2003; Jackson, 1994; Trueman et al., 2013). Public and private institutions working in the Galápagos, such as the GNP, the World Wide Fund for Nature (WWF), Charles Darwin Foundation (CDF), and Universidad San Francisco de Quito (USFQ), were also asked to provide relevant unpublished information, such as shape files and data bases, which were used as a complement to define the preliminary legends classification. From these sources, and using SCMVEC as a nomenclatural and methodological tool, six preliminary legends for native-dominated units were first defined: Mangrove forests, Coastal humid forest and shrubland (both previously known as marine or coastal zone-previous names according to above mentioned authors), Deciduous forest (p.k.a. dry or arid zone), Evergreen seasonal forest and shrubland (p.k.a. transition zone or mixed forest), Evergreen forest and shrubland (p.k.a. Scalesia, brown, and Miconia zones), and Highland humid tallgrass (p.k.a. pampa zone).
The SCMVEC does not include guidelines to name and classify invasive-dominated vegetation. Therefore, in order to maintain classification consistency, preliminary legends for these units also followed this methodology, but with one variation: the Latin name for genus was combined with common names of the main invasive plant dominating the vegetation unit and used as nomenclatural descriptors. These changes were adopted after concluding, alongside GNP staff, that these names will help mangers and decision makers recognize exotic-dominated vegetation units. The preliminary definition of invasive-dominated vegetation units was created using previous attempts to map this kind of exotic vegetation (i.e., TNC-CLIRSEN, 2006; and unpublished data gathered from Galápagos-related institutions). Though these sources are unpublished, they have been recognized by GNP staff as an internal informal resource. From this exercise, a further six invasive dominated preliminary legends were defined: Cedrela cedar, mixed (when more than one invasive species dominate the unit), Rubus blackberry, Pennisetum grass, Cinchona quinine, and Psidium guava (see Results section for details about final invasive-dominated units).
2.2 Preliminary legends and ground truthing validation
The 12 native and invasive-dominated preliminary legends were later discussed with 14 experts currently working in the Galápagos from the Ministry of Environment, Galápagos Government Council, WWF, CDF, GNP, and academia. The experts were presented with the 12 preliminary legends and the methodology used to obtain them (SCMVEC, MAE, 2013a, 2013b). In a half-day workshop (1 of 2 for this stage), the three criteria for vegetation classification, physiognomic, environmental, and floristic classifiers, were discussed in relation to the Galapagos vegetation units (MAE, 2013a, 2013b). All expert comments and responses were systematized into a final document which outlined two main observations on the 12 preliminary legends: while all the defined invasive-dominated units were recognized to occur in the Galápagos, two changes were said to be necessary for the native-dominated legends: first, a vegetation unit corresponding to dry conditions and existing only in the Isabela mountaintops (here defined as Highland deciduous tallgrass) must be defined and mapped; and second, the deciduous forest defined at this stage might be differentiated in later geographic representations in order to map potential physiognomic differences (i.e., dry lands that apart from tress are dominated by shrubs or herbs).
Using this expert input, 15 preliminary legends (six invasive-dominated and nine native-dominated including the Highland deciduous tallgrass and three different deciduous lowland vegetation types) were used to perform ground truthing exercises over six islands (Baltra, Floreana, Isabela, San Cristóbal, Santa Cruz, and Pinzón). Ground truthing was later followed by a second validation workshop with GNP staff and more experienced park rangers, to verify the distribution in the ground of the proposed units, including different vegetation occurrence in remote areas. More details for this stage are in given in the Appendix.
After definition and validation of the preliminary legends were complete, these 15 preliminary vegetation units were used to outline the hypothetical vegetation distribution of Galápagos. The next step was to test this hypothesis, using the cartographic methodology described below (Figure 2), and to assemble a vegetation map for the islands.
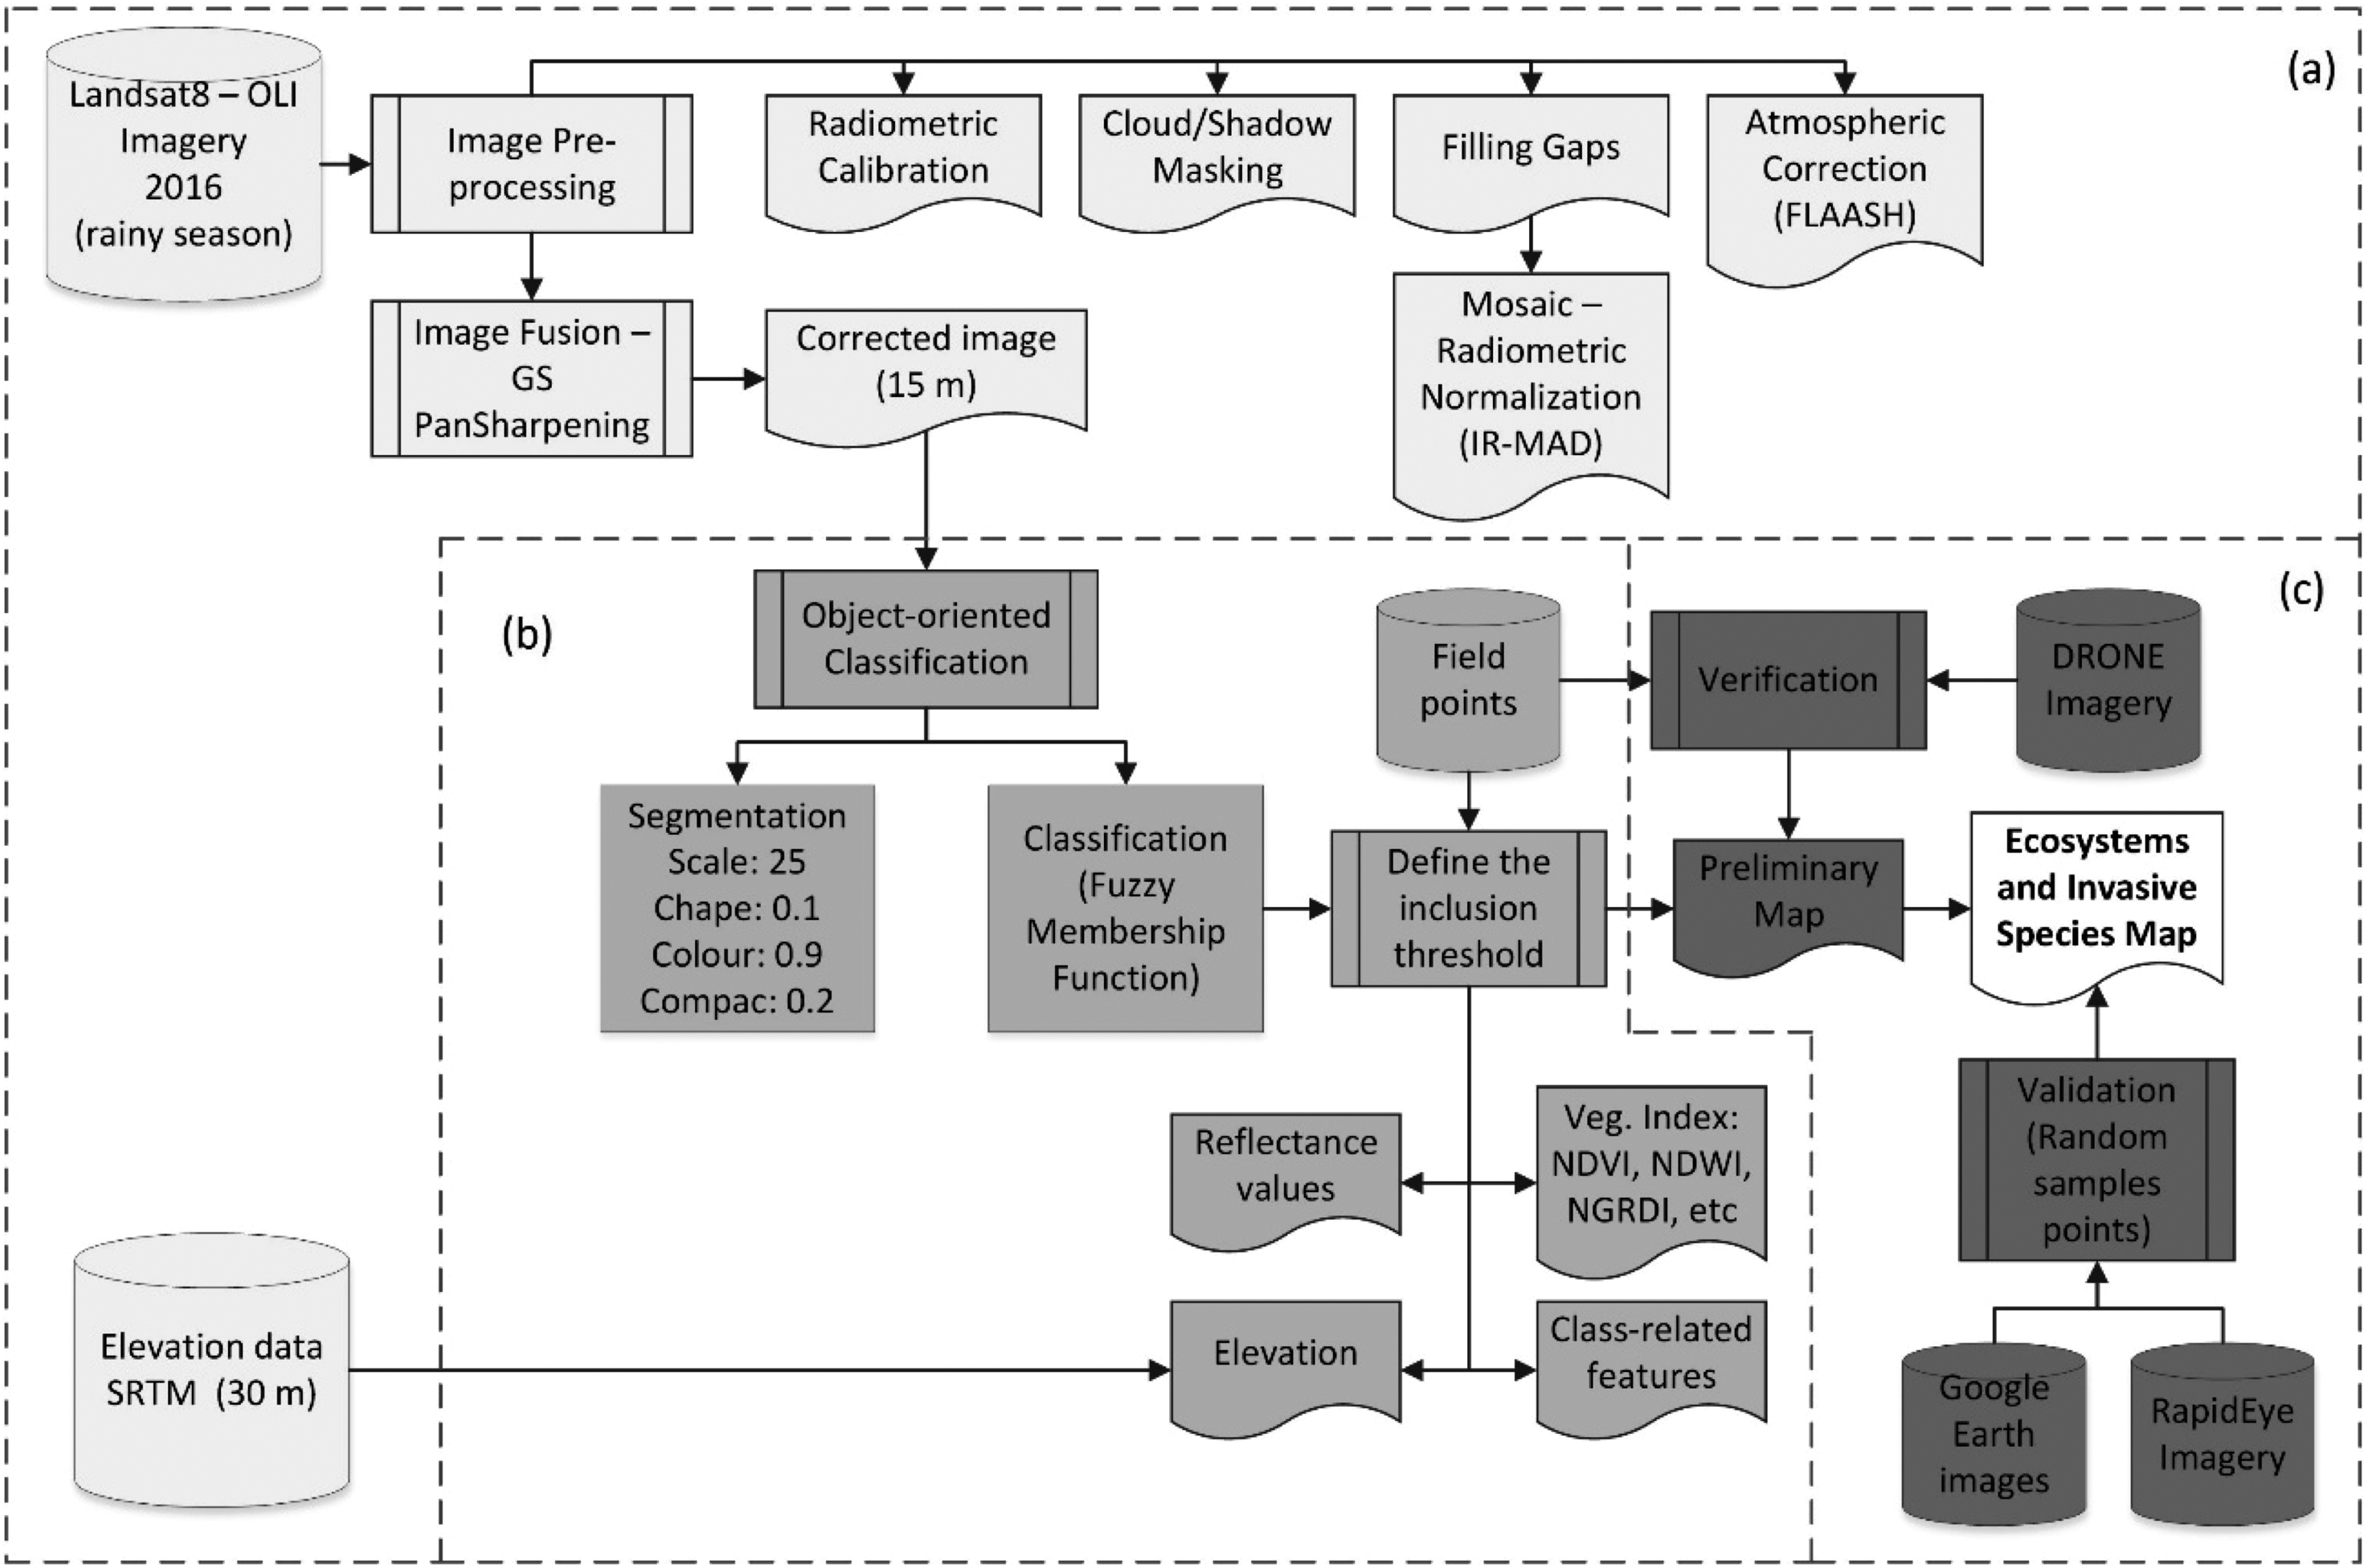
The cartographic methodology workflow of the present project: (a) image preprocessing; (b) object oriented classification; and (c) verification and validation of ground data.
3 Remote sensing and object oriented classification
3.1 Data acquisition
Two types of sensors were used to obtain satellite images to define the preliminary legends and to observe vegetation units in the Galápagos: the Operational Land Imagery (OLI) sensor from satellite Landsat 8, and the radar system from Shuttle Radar Topographic Mission (SRTM). The OLI sensor generates multispectral images with a 30 m moderate spatial resolution. Landsat 8, in contrast to its predecessors, is more capable of detecting land surface change and can more accurately display the spectral properties of vegetation (Ke et al., 2015). The SRTM uses a single-pass radar interferometry to generate the most complete near-global, high-resolution digital elevation models (DEMs) of the Earth’s land surface above sea level with a spatial resolution of 1 arc/s equivalent to 30 m resolution.
Satellite images from the warm-wet season of the archipelago, typically running from December to June (Collins and Bush, 2011), were selected for this study as during this time of the year vegetation unit “boundaries” are easier to define, particularly between dry and transitional areas of the region (i.e., lowland deciduous and seasonal forests). Additionally, by reviewing the Landsat archives since the 1980's, it can be observed that the lowest level of cloud cover over the GNP typically runs between February and March. Lastly, the El Niño event of 2015–2016 was among the strongest observed since 1950, which reduced rainfall during the wet season (and changed rainfall patterns around the world, L’Heureux et al., 2016; NASA Earth Observatory, 2016), making the images from that year mostly cloud-free and easier to interpret.
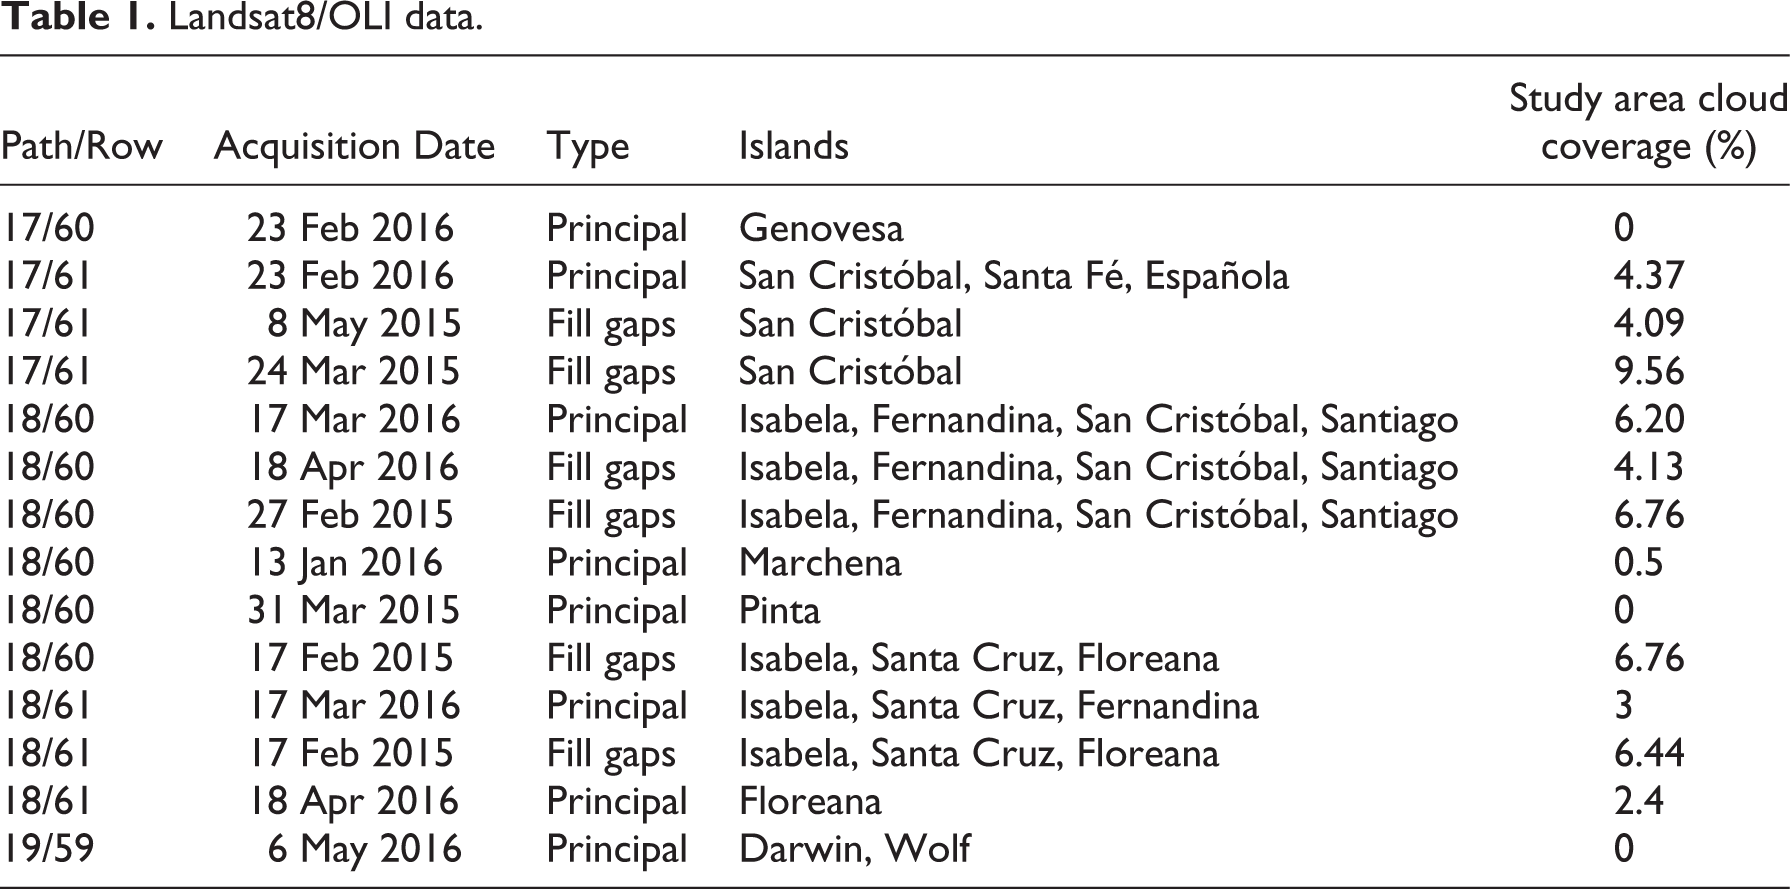
Five OLI sensor scenes (path/row 17/60, 17/61, 18/60, 18/61, and 19/59) were needed to cover the study area. The reference year for the distribution mapping of the vegetation units is 2016. However, some images from 2015 were used to fill fairly small gaps (by performing cloud and shadow masking = 16.5% of the whole archipelago) when clouds were present. Table 1 provides an overview of the Landsat 8/OLI imagery used in this study.
Landsat8/OLI data.
Because the present study focuses on the land protected area of the Galápagos archipelago, a thematic layer that precisely divides this area from the agricultural land was inserted in the maps (DPNG, 2014).
3.2 Image pre-processing
Radiometric calibration, clouds and shadow masking, atmospheric correction, and image fusion were used to transform raw sensor data (i.e., satellite generated images) into an appropriate format for posterior spectral analysis. For the radiometric calibration, digital number (DN) values of each image were converted to spectral radiance values. Subsequently, cloud masks were created through automated cloud detection using a principal component analysis (PCA) from blue, red, and SWIR2 bands (Ahmad and Quegan, 2012; Lavanant and Lee, 2005). The cloud threshold and cloud masking were then determined by analyzing PC1 histogram (PC1 brightness ≥ 8). Lastly for shadow masking, the cloud mask was projected on the ground surface, considering the effects of clouds elevation and sun illumination angle (Martinuzzi et al., 2007). More details on cloud masking are described in the Appendix.
3.3 Object-oriented classification
Object-oriented classification (OOC) is defined as an essential technique that can be used in remote sensing exercises that seek to analyze high spatial resolution images (Doxani et al., 2008; Jawak et al., 2015). It also has been used in the analysis of moderate spatial resolution images, providing significant results (Blaschke, 2010; Dorren et al., 2003; Shimabukuro et al., 2015; Yoon et al., 2003). OOC uses satellite generated images to perform spatial and spectral analyses that allow the integration of relevant properties such as shape, texture, and information from the spectrum with contextual information from analyzed entities from the earth’s surface (in this case vegetation units).
The OOC process is divided into two steps: segmentation and classification.
Segmentation algorithms group single-pixel objects with their neighbors to form a significant object that is defined by scale parameters and homogeneity criterion (spectral and shape criteria; Trimble, 2011). Here a multiresolution segmentation, which is an optimization procedure that minimizes the average heterogeneity and maximizes the respective homogeneity of the above-mentioned units, was used for this purpose (Trimble, 2011). Each mosaic image was segmented with a constant “composition of homogeneity criterion” and the scale parameter was set at two levels. For the first level, the scale parameter 200 (i.e., 200 pixels, one pixel corresponding to 225 m2) was selected to differentiate water from the land surface. The second segmentation level used a scale parameter of 25 and was only applied to the land surface, which allowed the differentiation of uniform vegetation units (see Appendix, Figure 6). The default settings for the “composition of homogeneity criterion” were: color factor of 0.9, shape factor of 0.1, compactness factor of 0.2, and smoothness factor of 0.8. These parameters were selected using a trial and error empirical analysis (Moeller and Stefanoy, 2004; Zoleikani et al., 2017), which choose the most suitable parameters to detect small remnants of vegetation units such as the mangroves (fine scale) and discriminate spread and irregular vegetation units with different seasonal characteristic (high color and smoothness factors).
The classification process includes: (a) the construction of a hierarchical scheme, which allows a semantic organization of classes and reduces complexity (Doxani et al., 2008); and (b) class descriptions that can be carried out either by the nearest neighbor classifier or by fuzzy functions (Al Fugara et al., 2009; Kressler et al., 2005; Yan, 2003). Figure 7 in the Appendix shows different levels within a hierarchical classification scheme used in this research, which was built on the basis of the preliminary legends described above. In this study, the fuzzy membership function classifier was used to allocate each segment to a vegetation unit class. Inputs by experts and ground truthing data collected to verify the proposed preliminary legends (60 points collected in the 15 preliminary vegetation units, see Appendix) were used to define the membership functions (features and threshold values) that describe each vegetation unit. For each segment the following features were calculated based on vegetation spectral behavior criteria: (a) object features: mean layer values (blue, green, red, NIR, SWIR1, SWIR 2, elevation) and ratio layer values (blue, green); (b) class-related features: relative border to neighbor objects and existence of sub-objects (super-objects); and, (c) vegetation indexes derived from satellite images. Table 7 in the Appendix shows the vegetation indices used in this process. A PCA was also performed to evaluate the relevance of each feature to describe each vegetation unit using the 60 ground truthing data (in situ field) points.
4 Verification and validation ground classification data
4.1 Verification
After the final maps for native and invasive-dominated units were assembled, this research used high resolution images obtained from drones, data gathered by ground control points from in situ plots located at each vegetation unit, and trips around the islands to perform a final verification of the recognized vegetation units on the Galápagos’ surface (including remote areas; Figure 1).
First for this final stage, 20 drone flights were carried out in difficult to access sites within the GNP. A DJI Phantom 3 Professional aircraft equipped with a 4 K Gimbal Camera (12MP; Da-Jiang Innovations, China) was used to obtain high resolution images of sites of interest. Between 150 and 200 images were obtained per flight (with a spatial resolution of 3.5–5.5 cm/pixel) covering on average 15 ha each (approximately 300 ha covered in total). An ortho-mosaic image was created for each flight (using Agisoft Photoscan software V 1.2.6) in order to identify invasive-dominated vegetation units occurring within a native-dominated matrix and that were difficult to define using only Landsat images (see Figure 8 in the Appendix). For each of the 20 mosaics created after drone flights, two verification points (one for native and one for invasive-dominated vegetation present in the image) were chosen within the images to visually verify that invasive and native-dominated coverage identified in the high-resolution mosaics corresponded to one of the final mapped vegetation units.
Second, 148 in situ 4 × 4 m2 plots were established and recorded in Fernandina, Genovesa, Isabela, Santa Cruz, San Cristóbal, and Santiago islands. These plots were established principally in sites covered by invasive plants, transition-type vegetation boundaries, and native dominated units comprising of small patches or forest remnants in good conservation state. In each of these plots, vegetation units and geographic location were assigned and recorded.
Third, 35 verification points recorded from boats surrounding the coast of nine islands were also used to confirm the preliminary vegetation units (Figure 1). Collection of these points consisted of recording the spatial location in the ground (projected from the boat) of the verified coastal site along with the description of a specialist (i.e., authors) that confirms the observed vegetation distribution.
In total, 217 verification points (40 for drone images, 148 from in situ plots, and 35 from boat reference points) were collected and used to improve the PCA used in the classification stage and to better define the preliminary classification of the vegetation units (this PCA is reported in the Results).
4.2 Validation
Validation of the final vegetation map was performed using 490 random sample points distributed throughout the study area that were systematically validated by visual interpretation of high resolution images. Images used in this process were obtained from Google Earth, specifically from the dates March 27 2014, February 14 2016, February 19 2016, March 15 2016, May 5 2016, October 8 2016, and October 26 2016, and between 2010 and 2013 from the RapidEye sensor. A stratified random sampling procedure was used to distribute the sample points in proportion to each land cover stratum. For accuracy, a confusion matrix was generated and related statistics were calculated to assess the overall accuracy and the kappa coefficient (ranging from 0 = no accuracy to 1 = total accuracy), which are common techniques for assessing the alignment between map classes against classes on the ground (Naesset, 1996; Ponce-Hernandez et al., 2004; Stehman, 1996).
Finally, a biotic approach was used to validate native vegetation units, which consisted of testing the similarity of units when presence and abundance of native and endemic plant species (grouped by genera) are compared to each other (using a multivariate clustering classical method—UPGMA algorithm—and a Jaccard similarity matrix, both calculated using PAST v 3.14, Hammer et al., 2001). Occurrence data per unit was obtained after crossing our native vegetation map with all the native species occurrence records obtained from the most updated plant lists available for this region (Jaramillo and Guézou, 2013). Only accurate records presenting correct geo references were used for these analyses. In total, 5829 native and endemic plant records belonging to 205 indigenous genera were used for this validation. Jaccard index values below 0.8 were considered not significant, meaning pairwise analyzed units recording index values above this number should be considered similar in their biotic characteristics.
III Results
1 Features selection and object oriented classification
The OOC methodology used here allowed a selection of the most appropriate features to classify each vegetation unit. As a result of this analysis (performed by a PCA using 217 collection points), the most significant features, used to characterize the fuzzy membership function for each vegetation unit, are for the first time being used and defined in the Galápagos and shown in detail in Table 2.
Selected features used to define each vegetation unit in the classification process and the percentage of the total variation these explained in each principal component (PC).
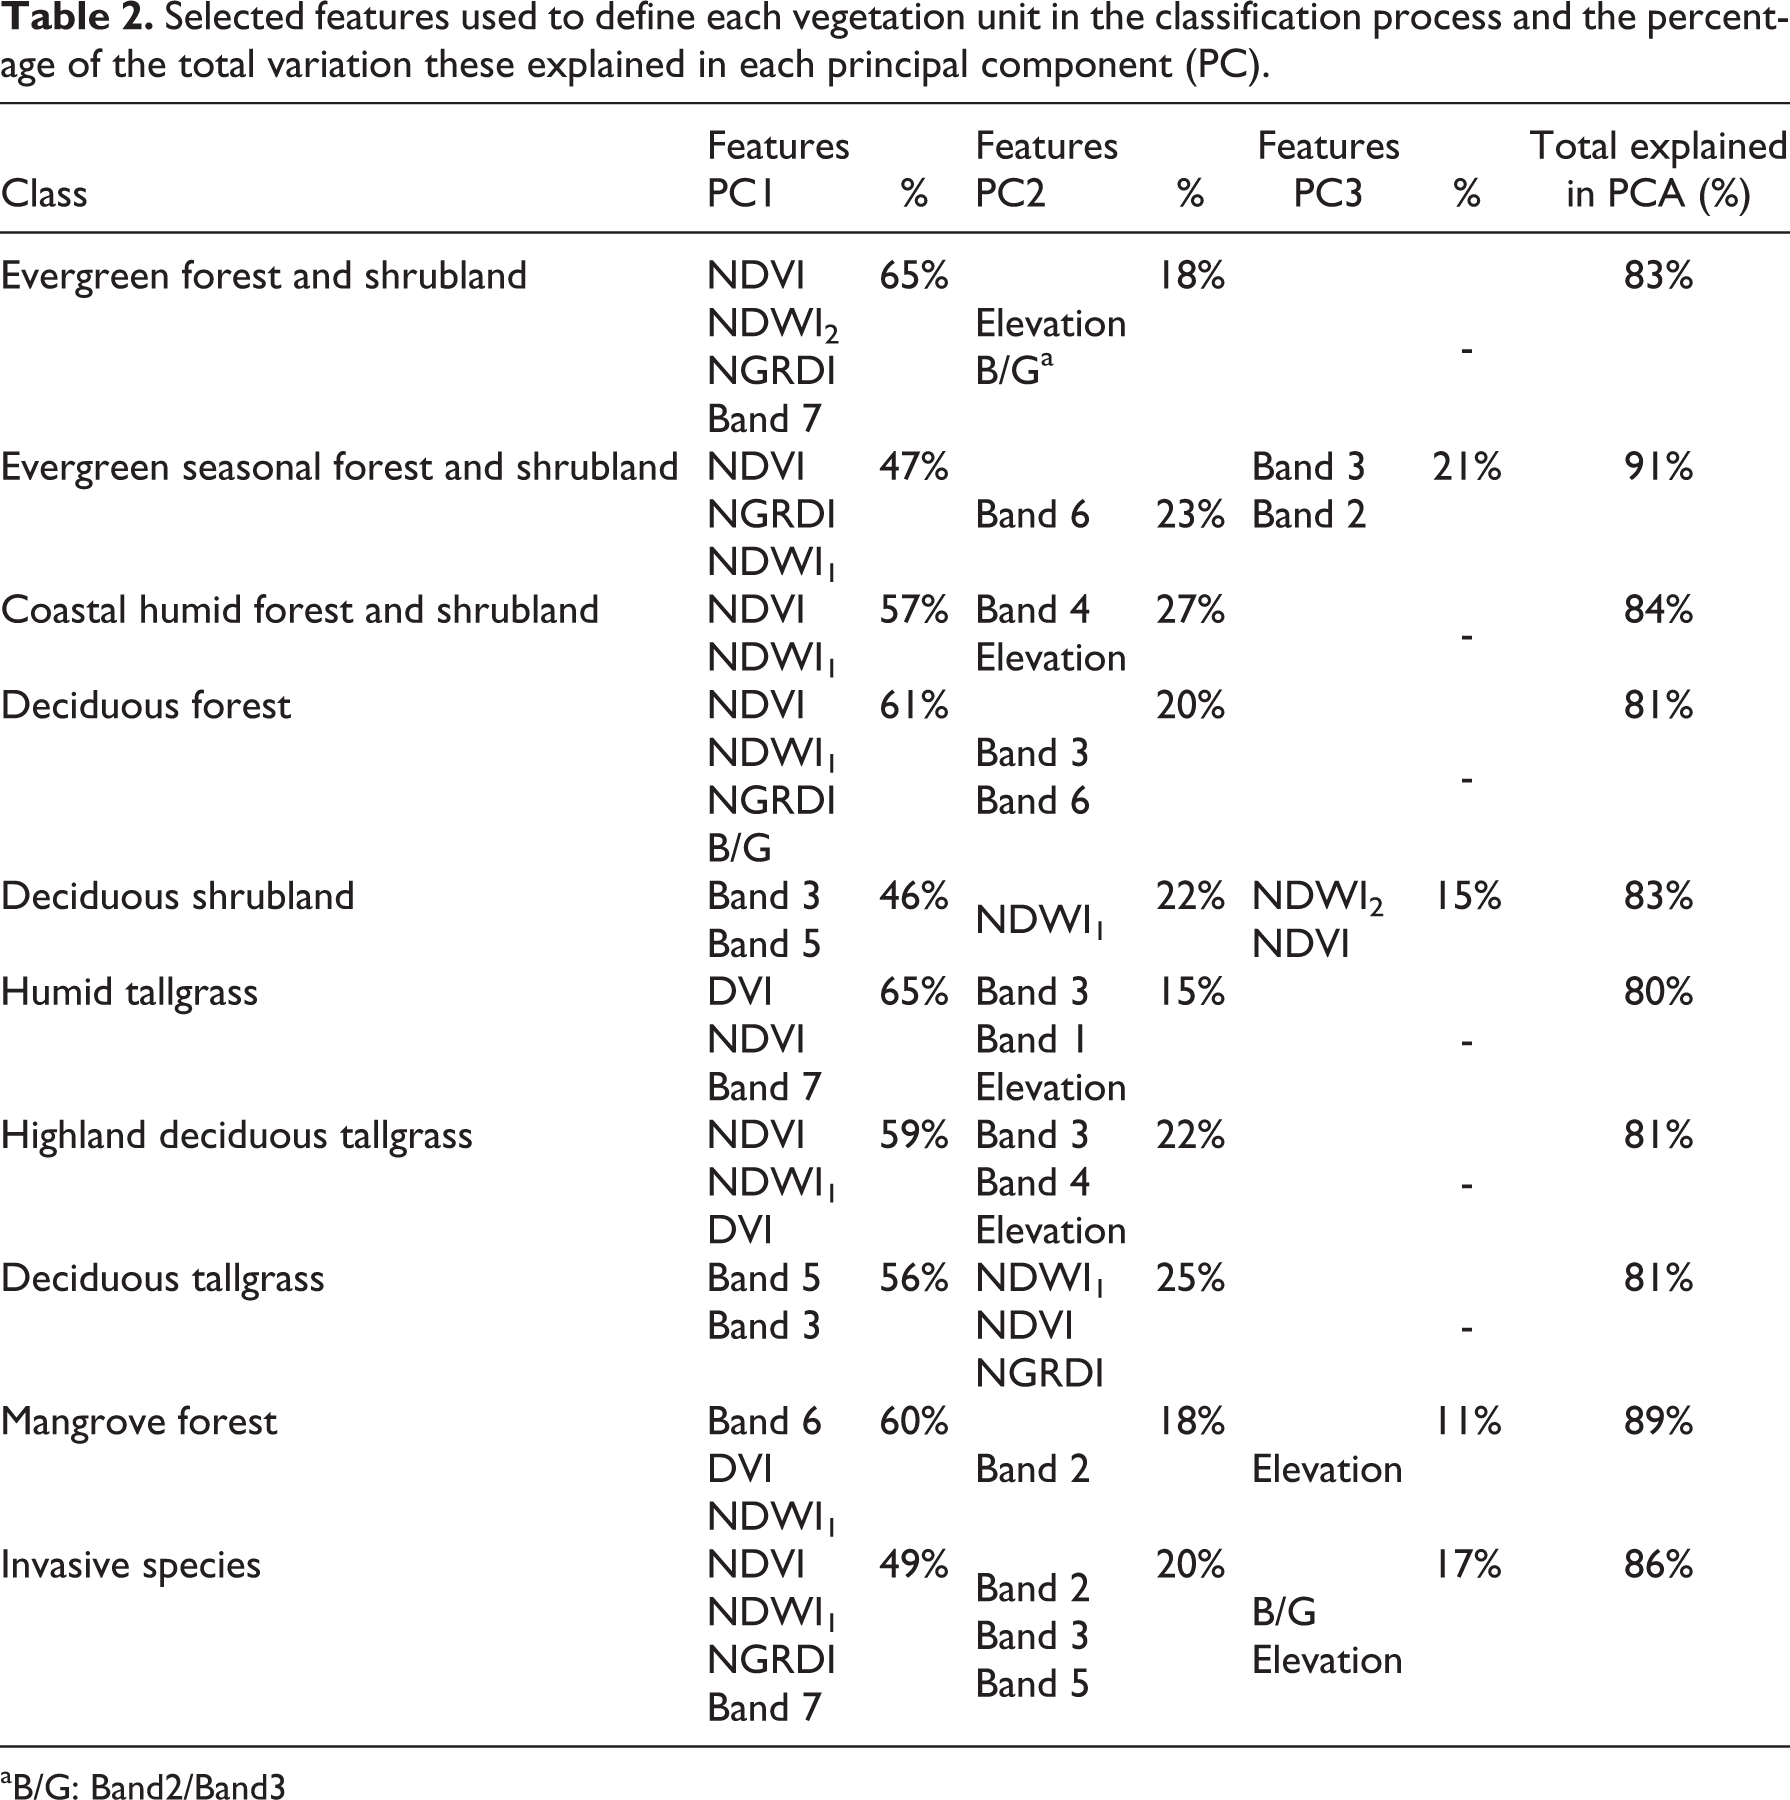
aB/G: Band2/Band3
Additionally, the OOC methodology defined the ranges of vegetation units recorded by NDVIs and similar indexes, and helped to discriminate and map these classes. These analyses showed that NDVI mean values of higher than 0.6 denote sites of dense vegetation cover, such as humid and evergreen native-dominated units. Meanwhile, NDVI mean values between 0.2 and ∼0.59 typify deciduous vegetation, and values from 0 to ∼0.2 are characteristic of rocky outcrops or areas where deciduous vegetation is very sparse.
Likewise, NDWI2 and NGRDI indexes, which have strong responses to water content and vegetation greenery, contributed significantly to the identification and discrimination of deciduous and transition type vegetation units (i.e., Evergreen seasonal forest and shrubland) (Table 2), as they had values consistently close to zero (both negative and positive) when defining deciduous cover types (Table 3).
Total area occupied by each of the categories and “child” classes defined in this study, and the correspondent vegetation indexes. Percentages are calculated in relation to the total GNP protected area = 771,600.8 ha – out of the 797,325.6 total ha – encompassing the Galápagos province.
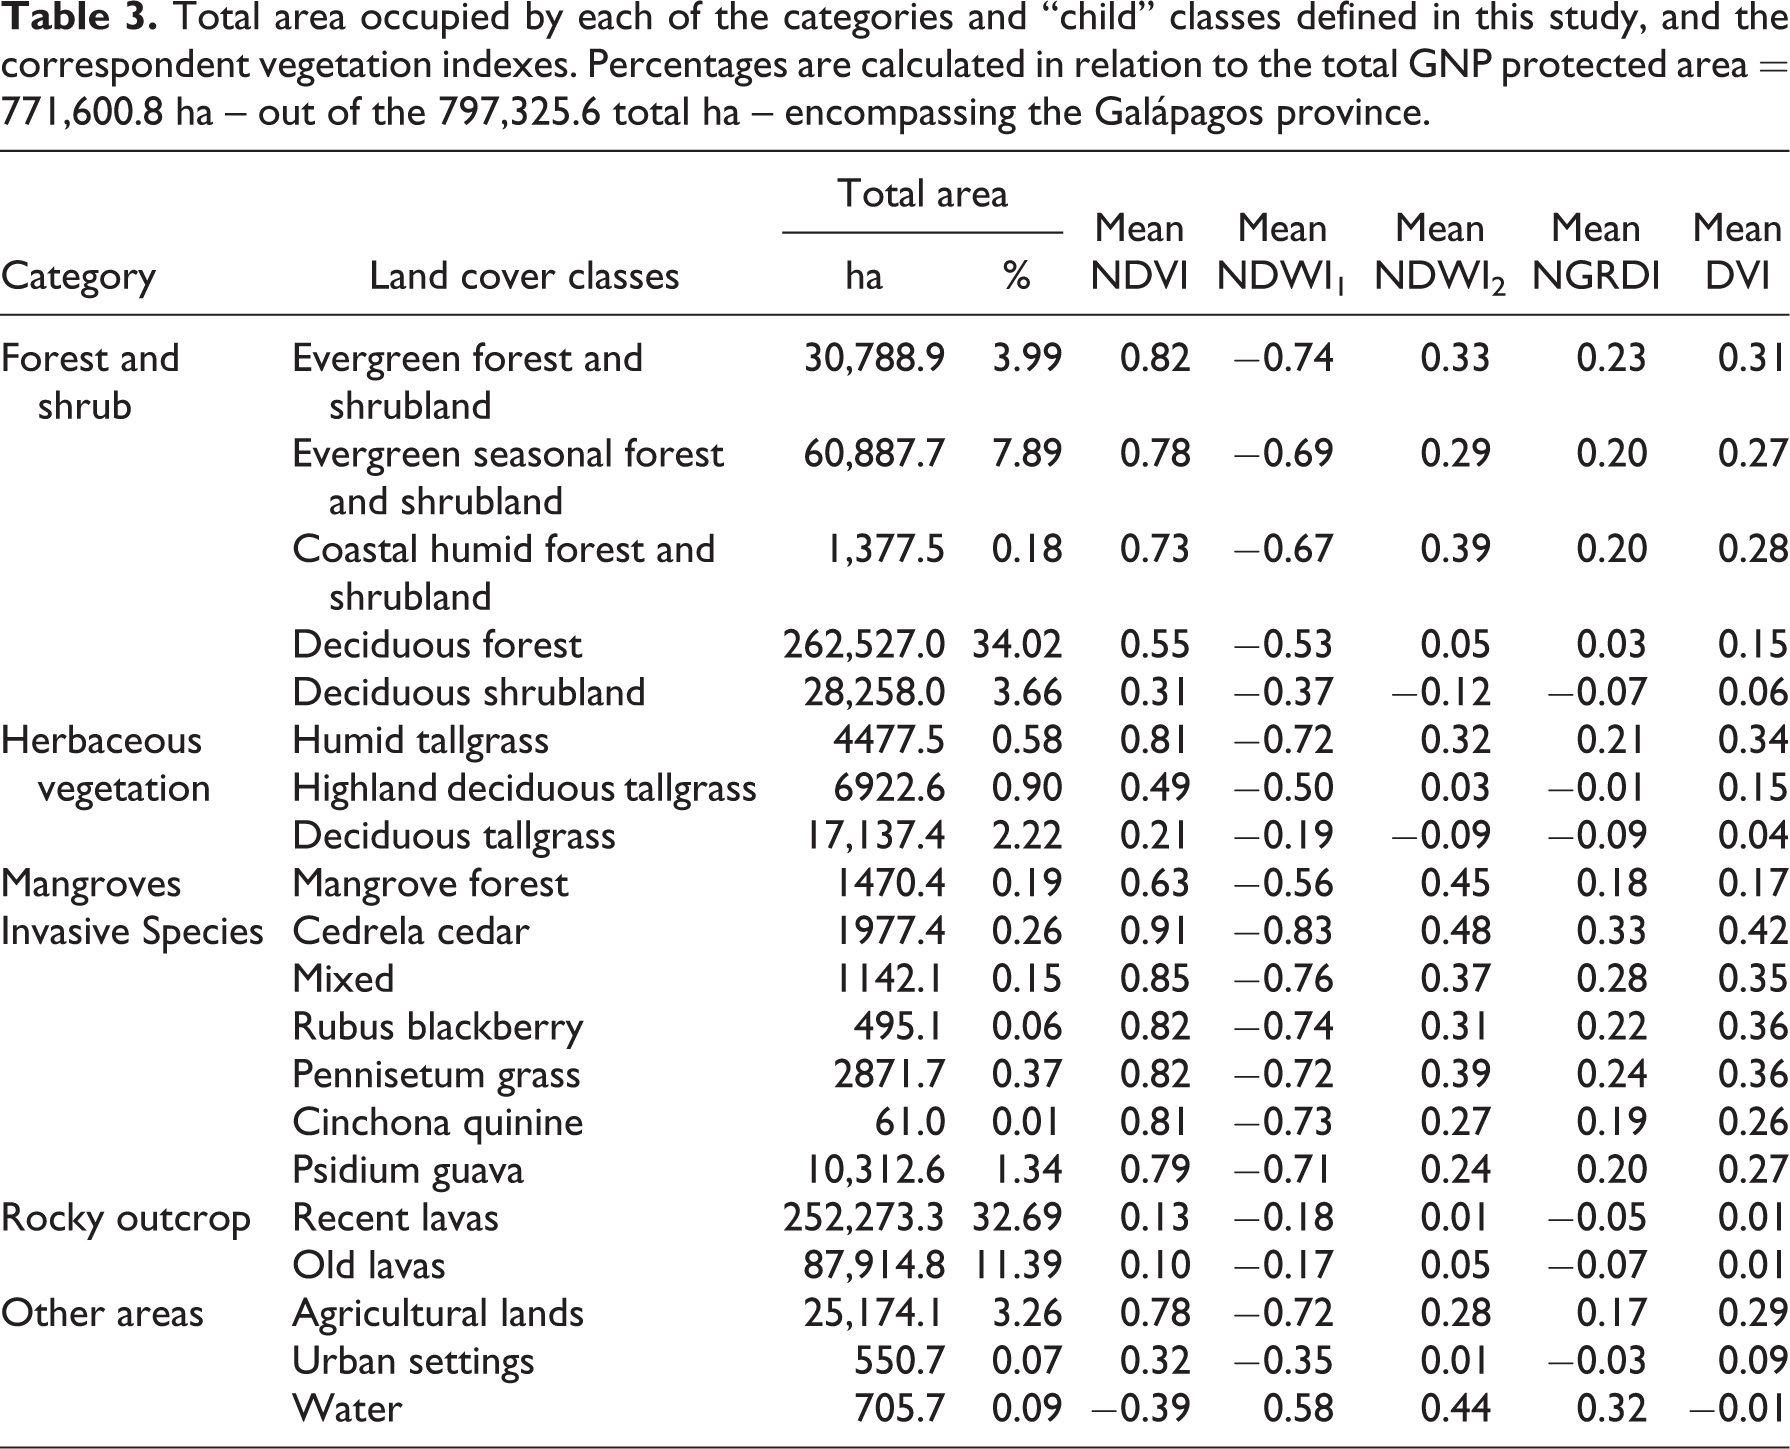
The use of these kind of features in classifying invasive-dominated units allowed for a ranking based on water content (from higher to lower as shown by NDWI2 index) in this order: Cedrela cedar, Pennisetum grass, mixed forest, Rubus blackberry, Chinchona quinine, and Psidium guava (Table 3).
2 Vegetation unit definition and distribution in the Galápagos
As a result of the mixed methodology presented here, twenty land cover types were identified and later mapped: nine native vegetation units dominated by native and endemic vegetation, six invasive species vegetation units dominated by different alien plants, and two types of lava dominated coverage (Figures 3 and 4). Three other classes, water, agricultural lands, and urban settings, are also presented in the results for comparative purposes.
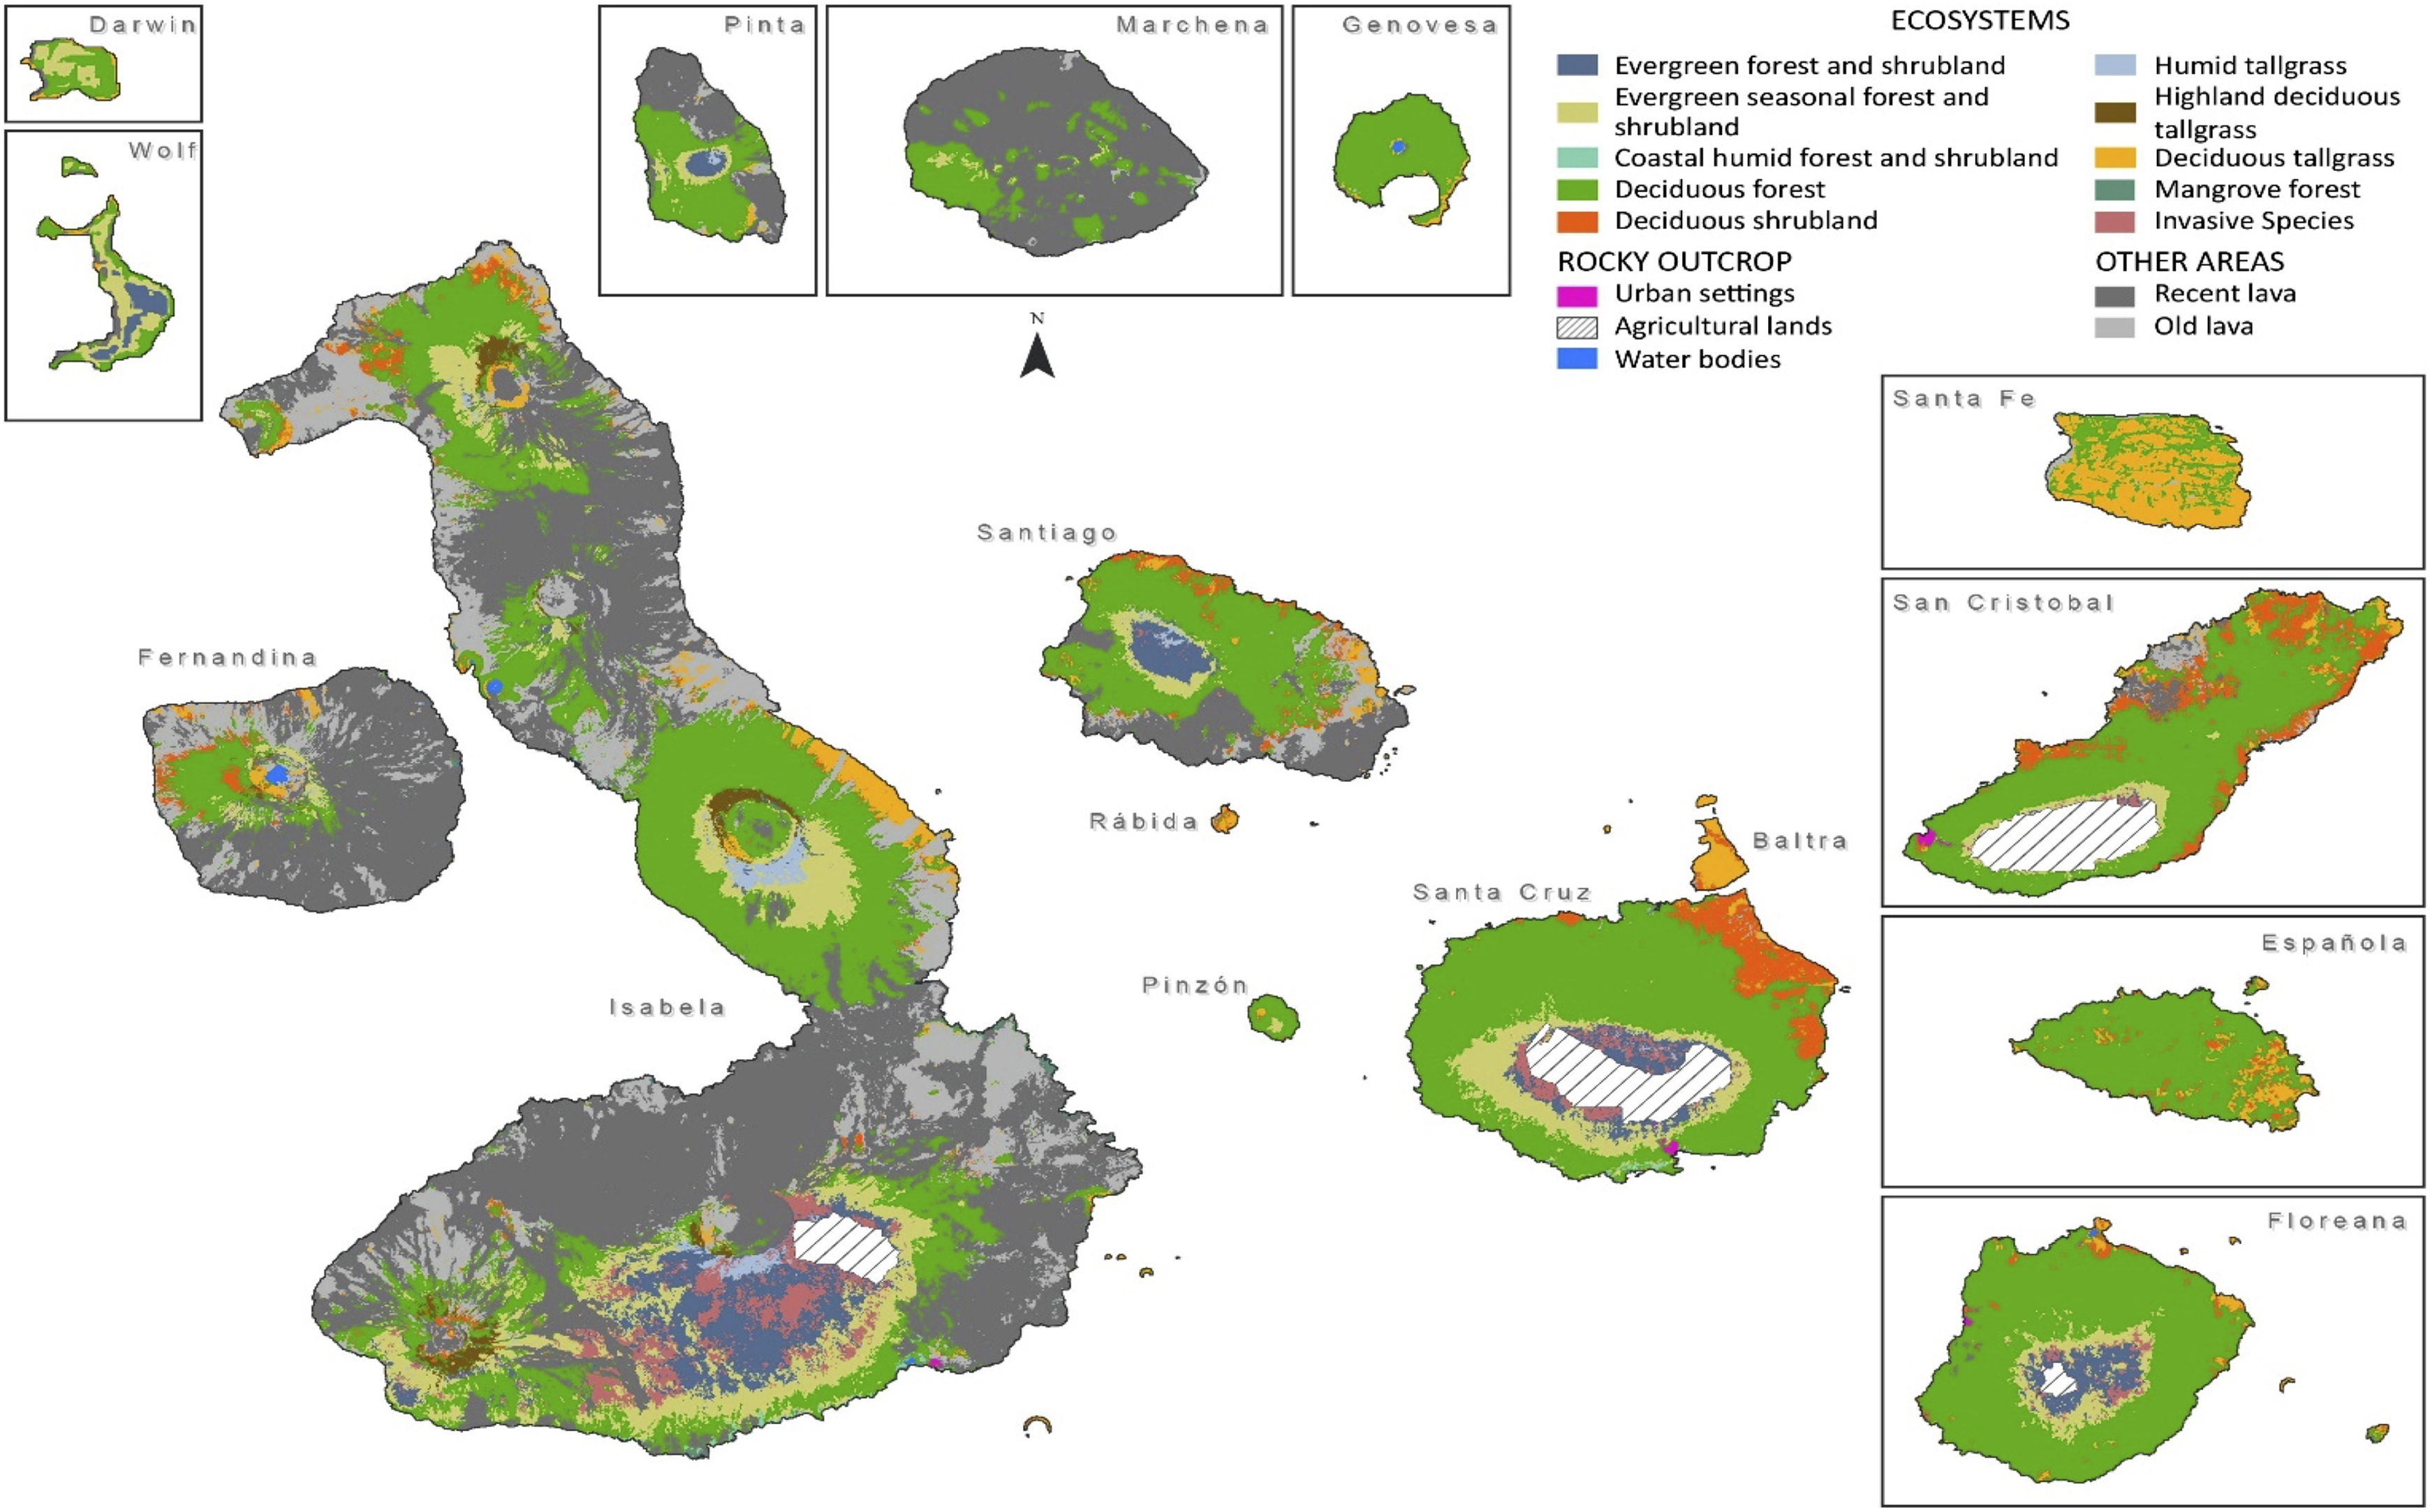
Resulting map presenting Galápagos native units distribution for all the islands of this archipelago. For the entire vegetation map of the Galápagos (including invasive-dominated units) and to display more details, please visit www.institutodegeografia.org/vega.
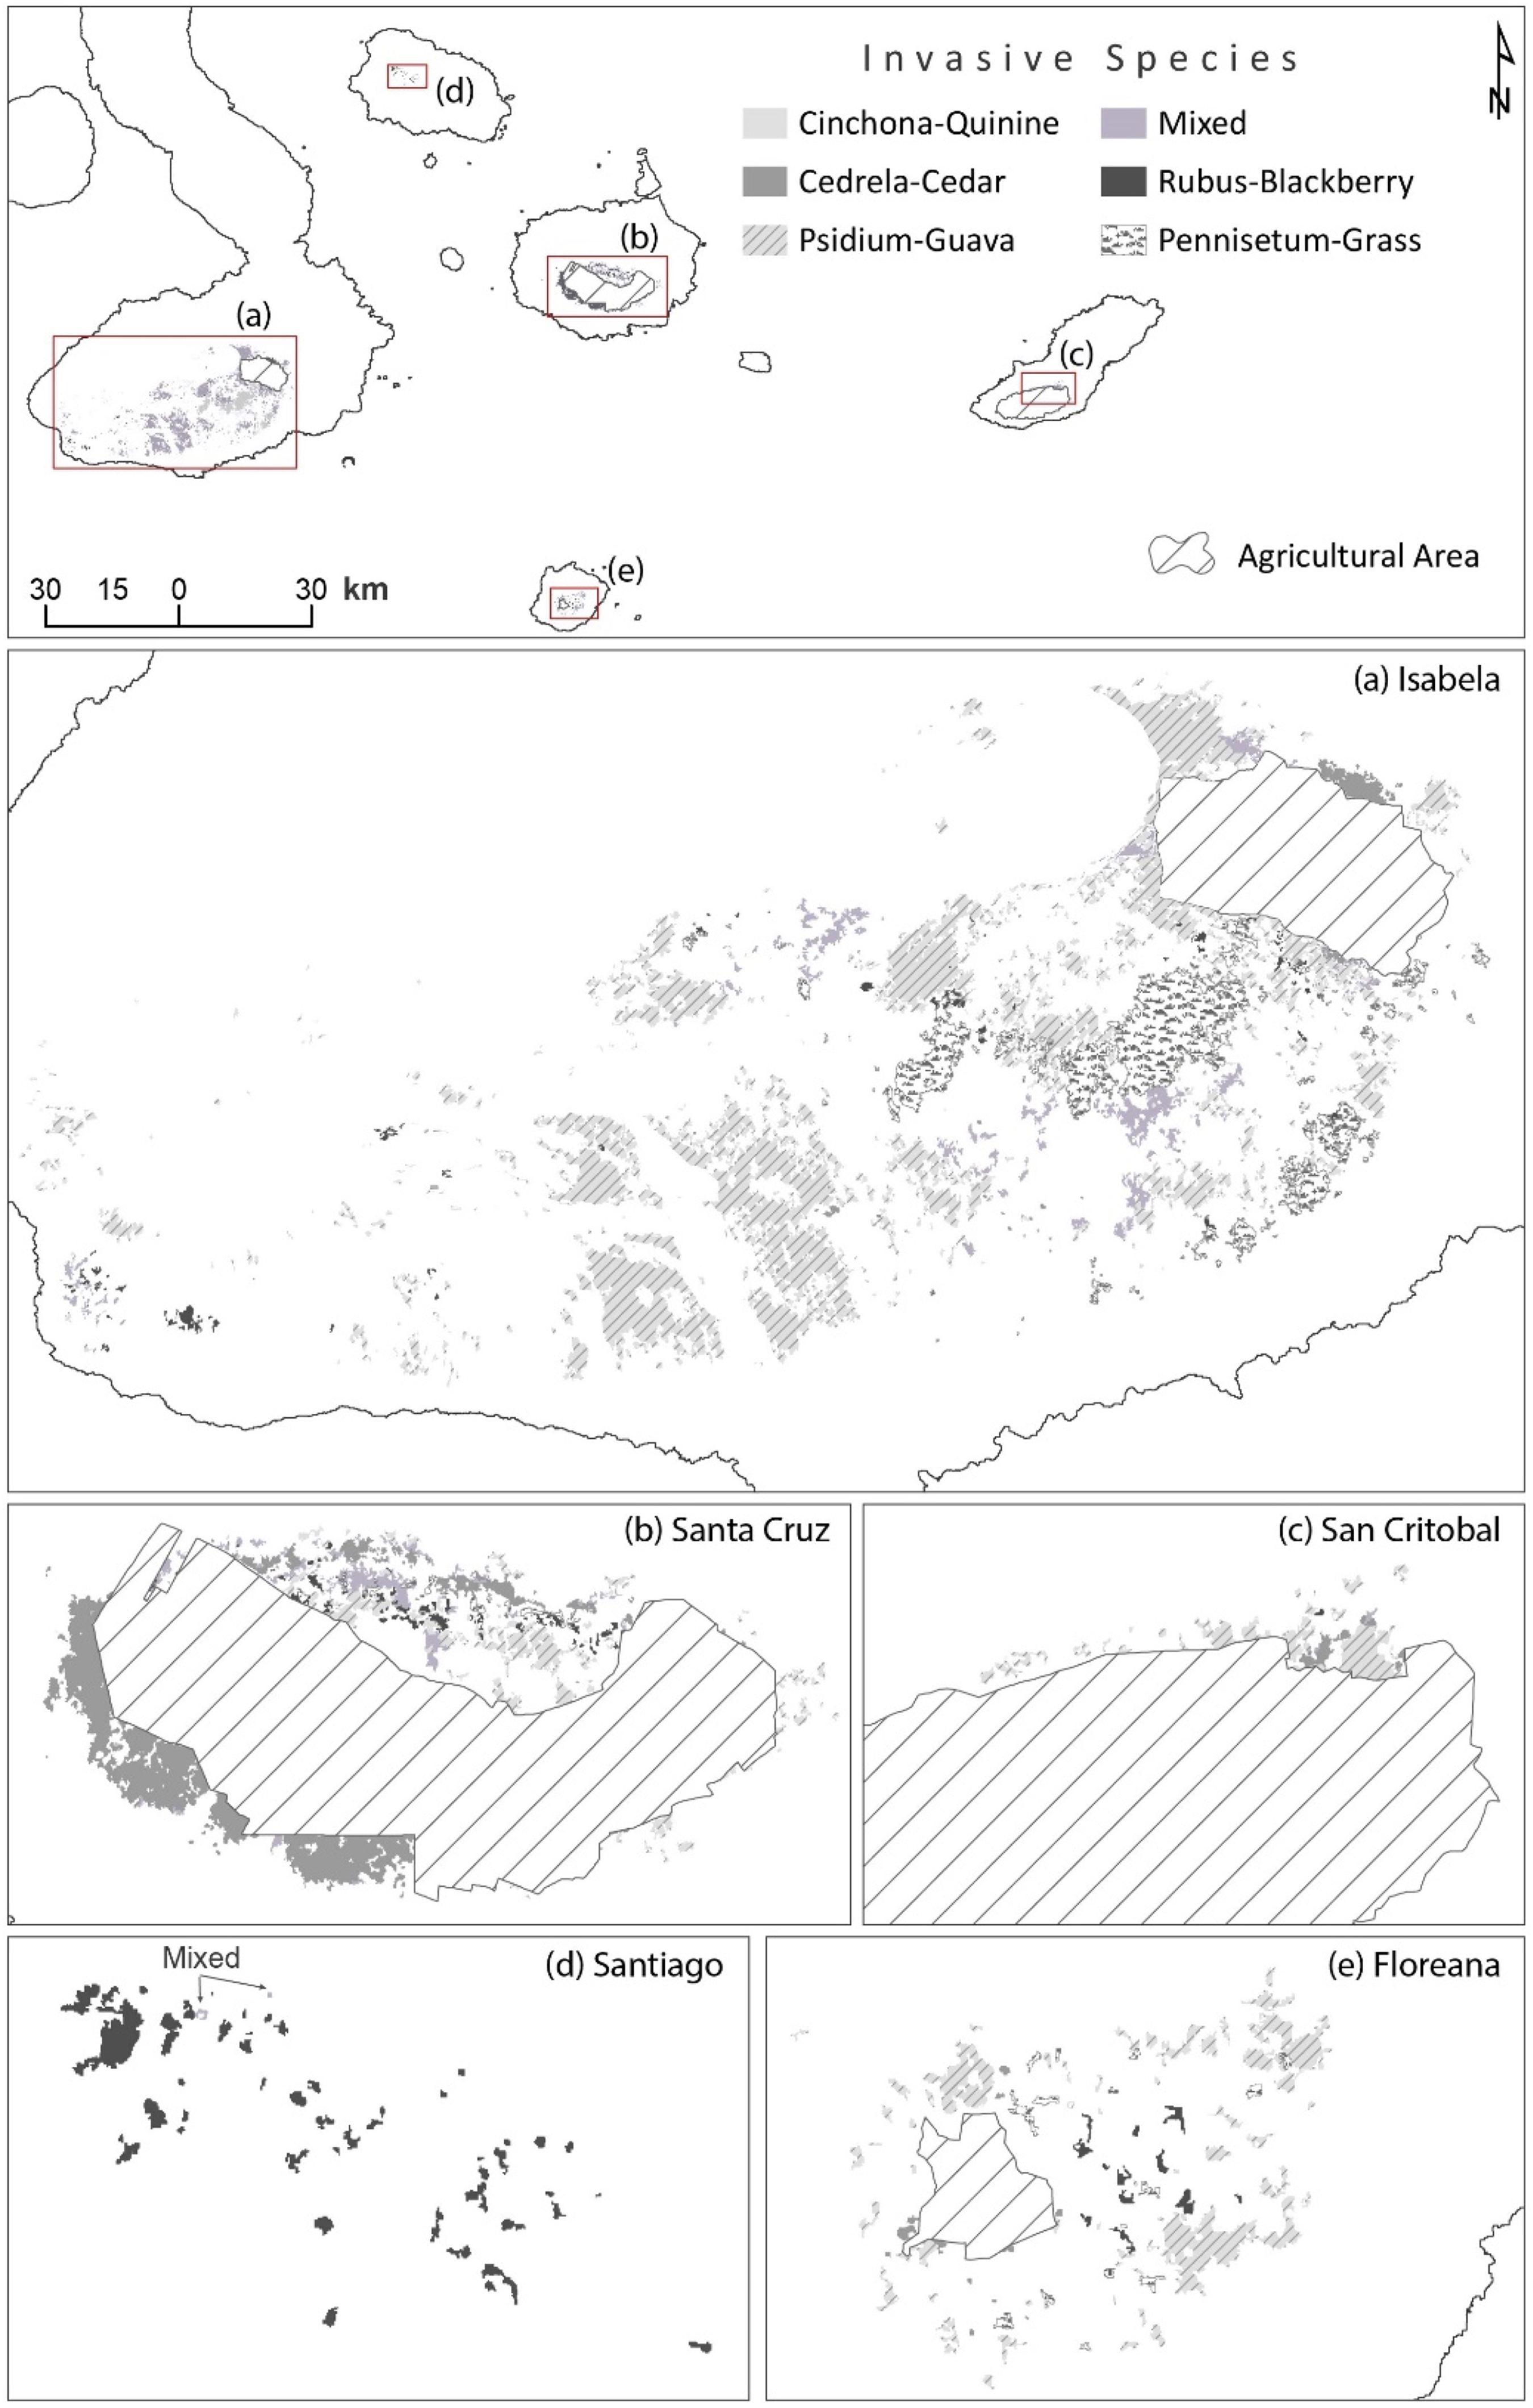
Map presenting the distribution of invasive-dominated vegetation units for the five islands that recorded this type of alien flora. Please note for (b) Santa Cruz, the complex matrix invasive plants’ distributions create in the surroundings (mainly northern part) of the agricultural land of this island. Zoom squares highlight the total area where invasive-dominated units are present in the space, and below are shown in detail the distributions of those units in the protected area of each island. For an online visual version of the maps presented here please visit www.institutodegeografia.org/vega.
The 15 resulting native and invasive-dominated vegetation units were the same as the preliminary legends defined and verified by experts in the two workshops designed for this purpose. The nine native-dominated vegetation units defined by our methodology, and verified and validated by the mixed-methods approach, if sorted by elevation from low- to highlands are: Mangrove forest, Coastal humid forest and shrubland, Deciduous tallgrass, Deciduous shrubland, Deciduous forest, Evergreen seasonal forest and shrubland, Evergreen forest and shrubland, Humid tallgrass, and Highland deciduous tallgrass.
The resulting vegetation units were grouped in six main supra (i.e., “parents”) categories defining land cover according to the class hierarchical analysis in this study (Table 3). Overall, the object-oriented method used in this investigation proved to be a highly accurate method to classify land cover (kappa = 0.86, OCA = 87.35; see Table 4). Additionally, when this type of vegetation was analyzed for similarities in abundance and presence of native and endemic species by genera, there were no significant similarities among them (i.e., Jaccard index values < 0.8; correlation = 0.95; see Figure 5), which supports the proposed classification for this group on biotic grounds.
Confusion matrix and the number of sampled points (sum columns) for each vegetation and mapped unit (full names below) resulting from object-oriented image classification.
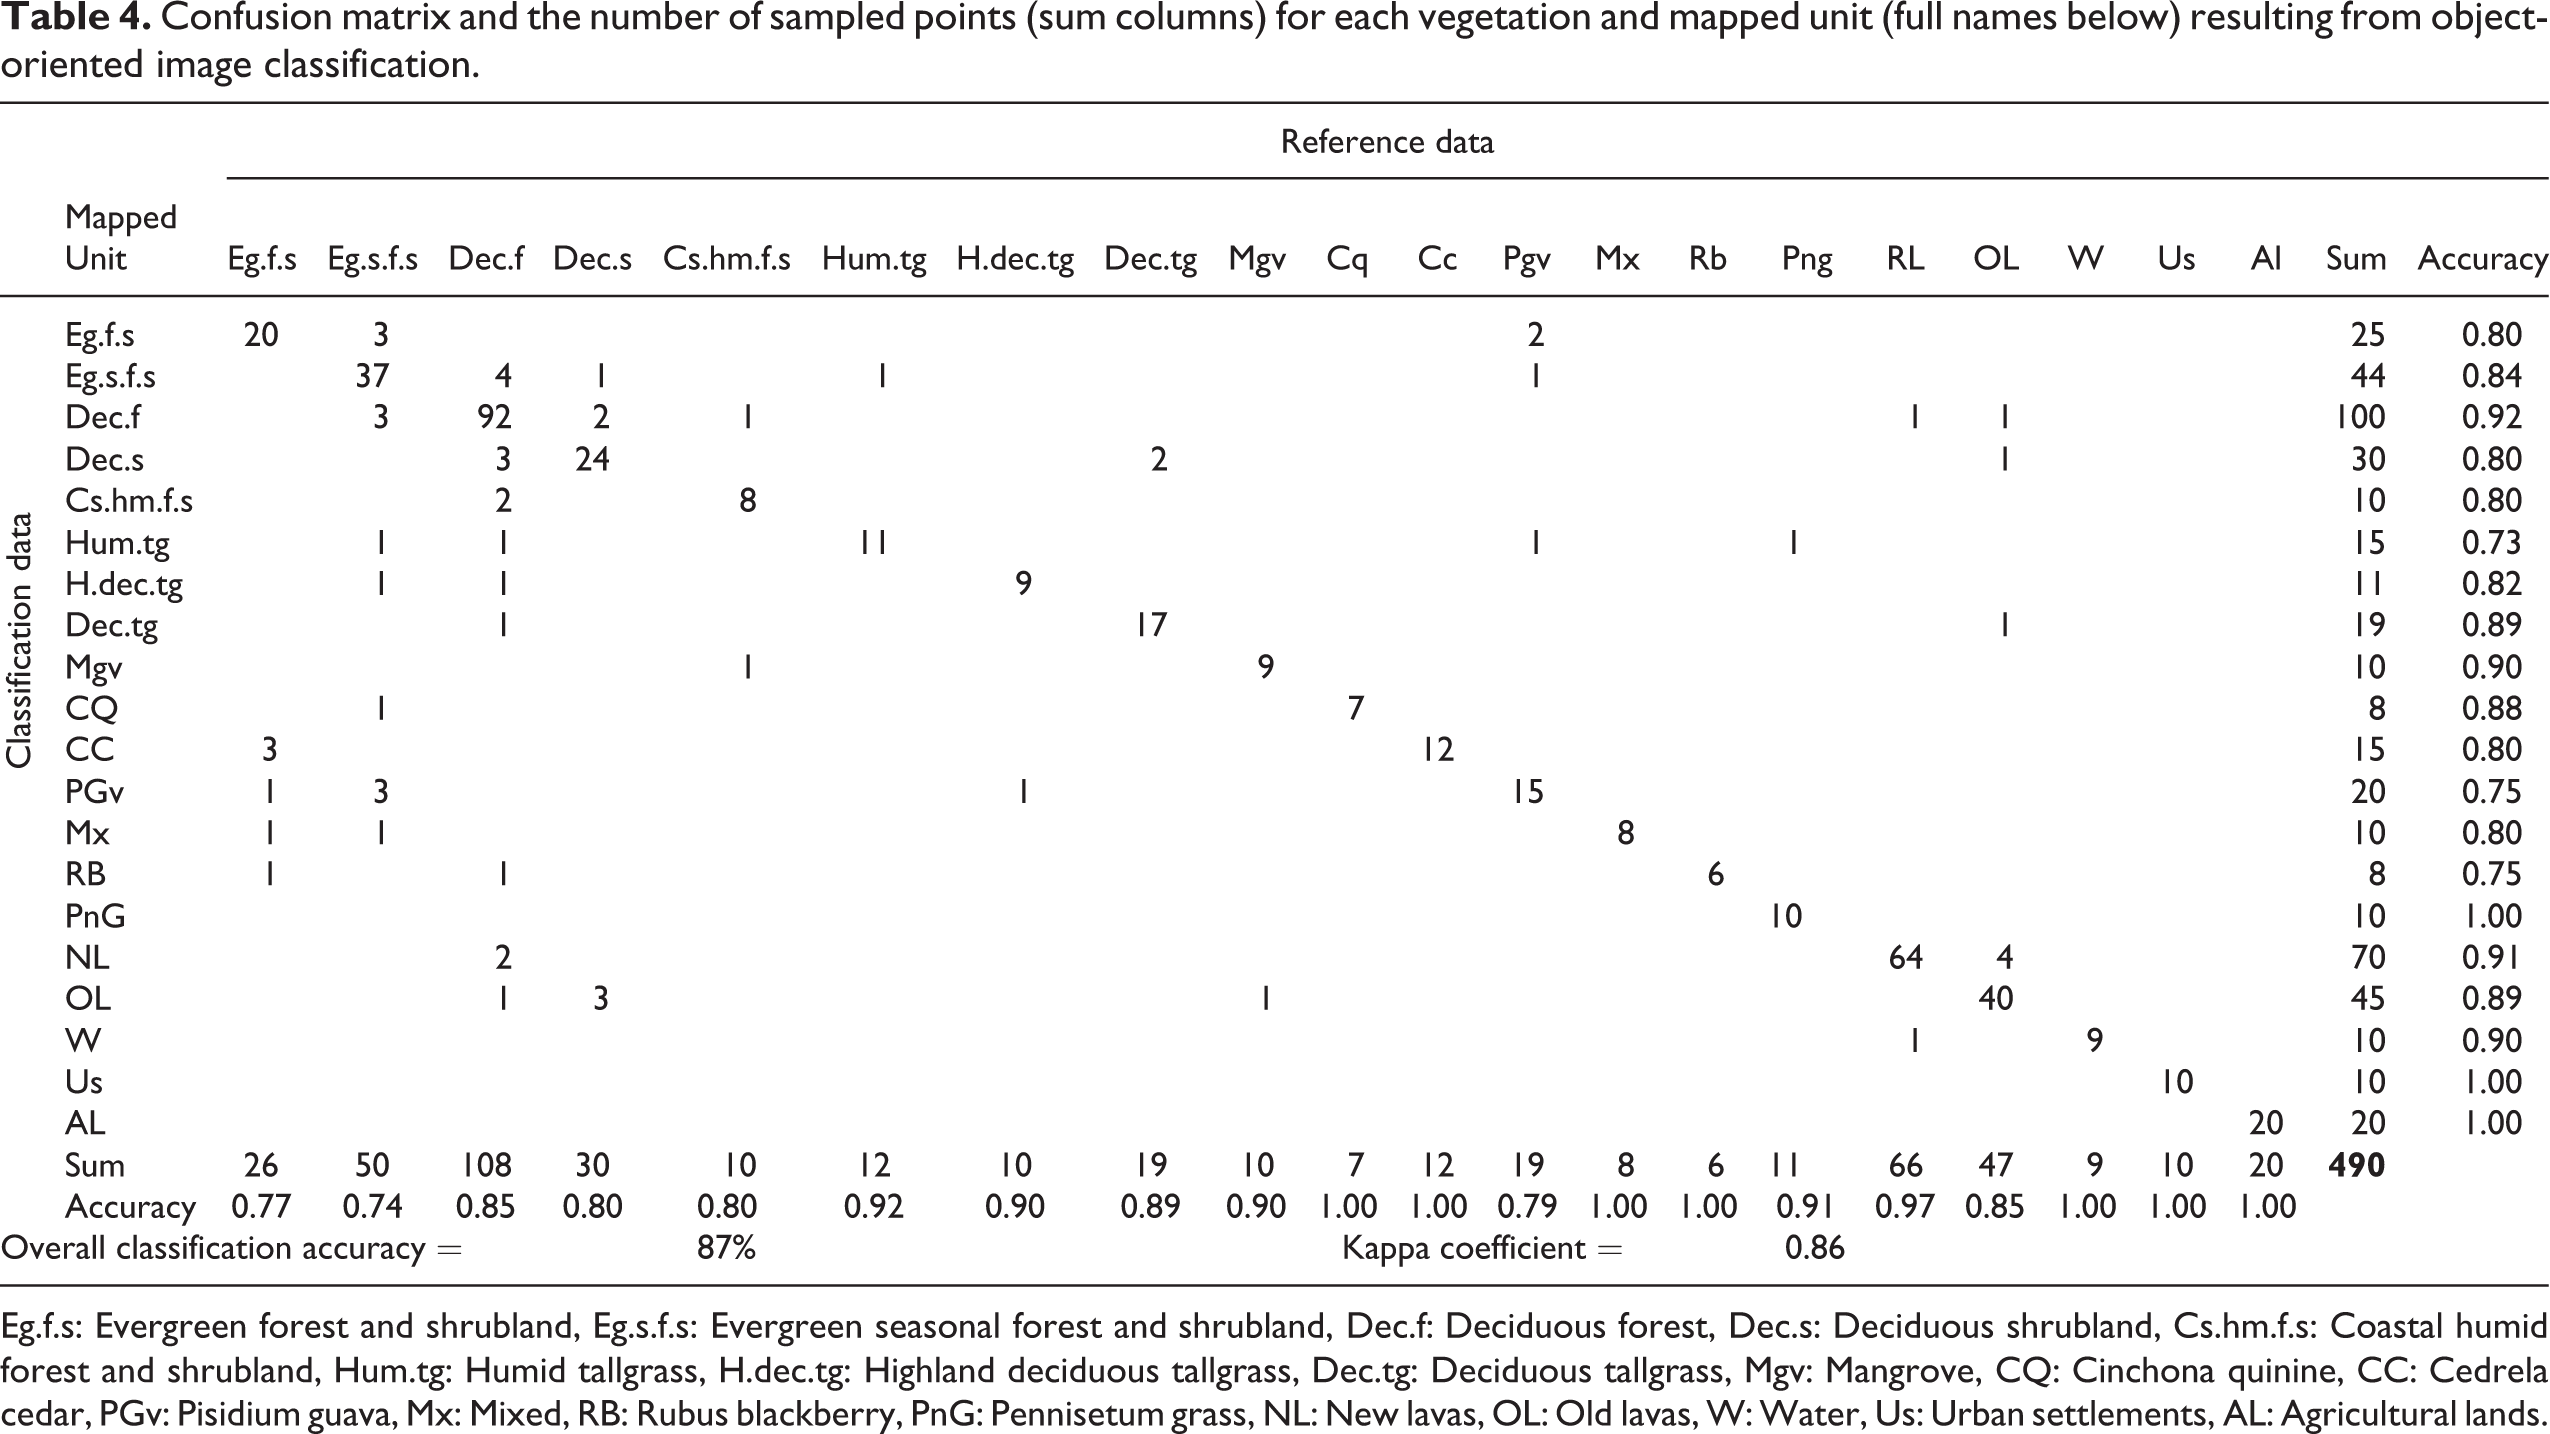
Eg.f.s: Evergreen forest and shrubland, Eg.s.f.s: Evergreen seasonal forest and shrubland, Dec.f: Deciduous forest, Dec.s: Deciduous shrubland, Cs.hm.f.s: Coastal humid forest and shrubland, Hum.tg: Humid tallgrass, H.dec.tg: Highland deciduous tallgrass, Dec.tg: Deciduous tallgrass, Mgv: Mangrove, CQ: Cinchona quinine, CC: Cedrela cedar, PGv: Pisidium guava, Mx: Mixed, RB: Rubus blackberry, PnG: Pennisetum grass, NL: New lavas, OL: Old lavas, W: Water, Us: Urban settlements, AL: Agricultural lands.
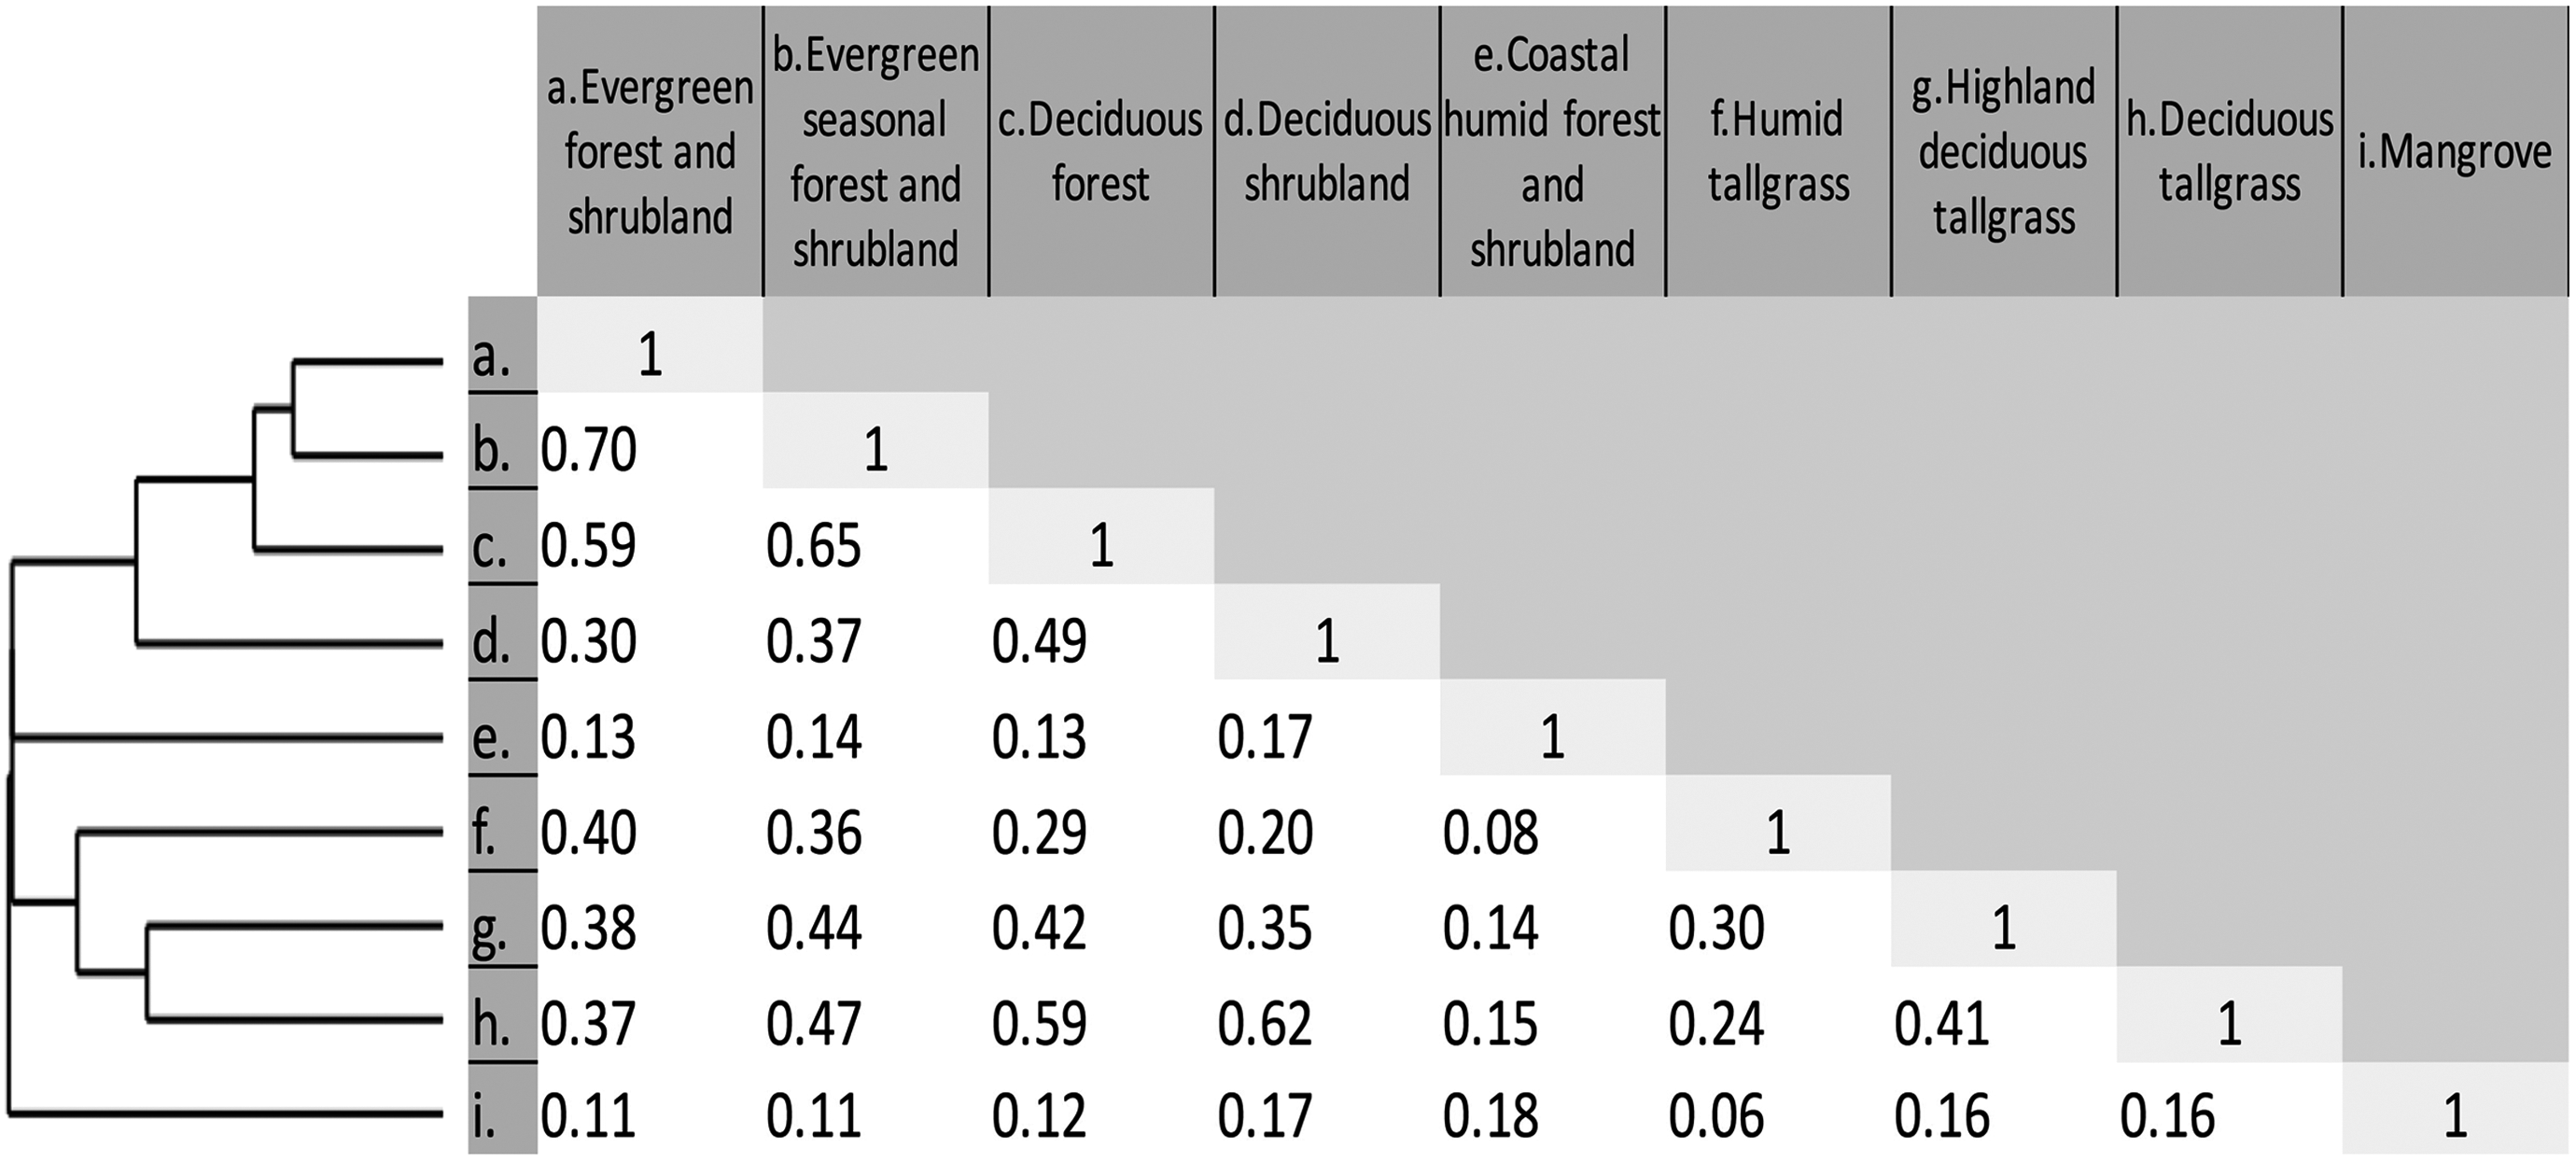
Combined multivariate clustering classical method (left) and Jaccard similarity matrix showing native ecosystems discrimination. Notice the lack of values ≥ 0.8, meaning pairwise analyzed units may be defined as significantly different in their biotic characteristics (number of species per genus).
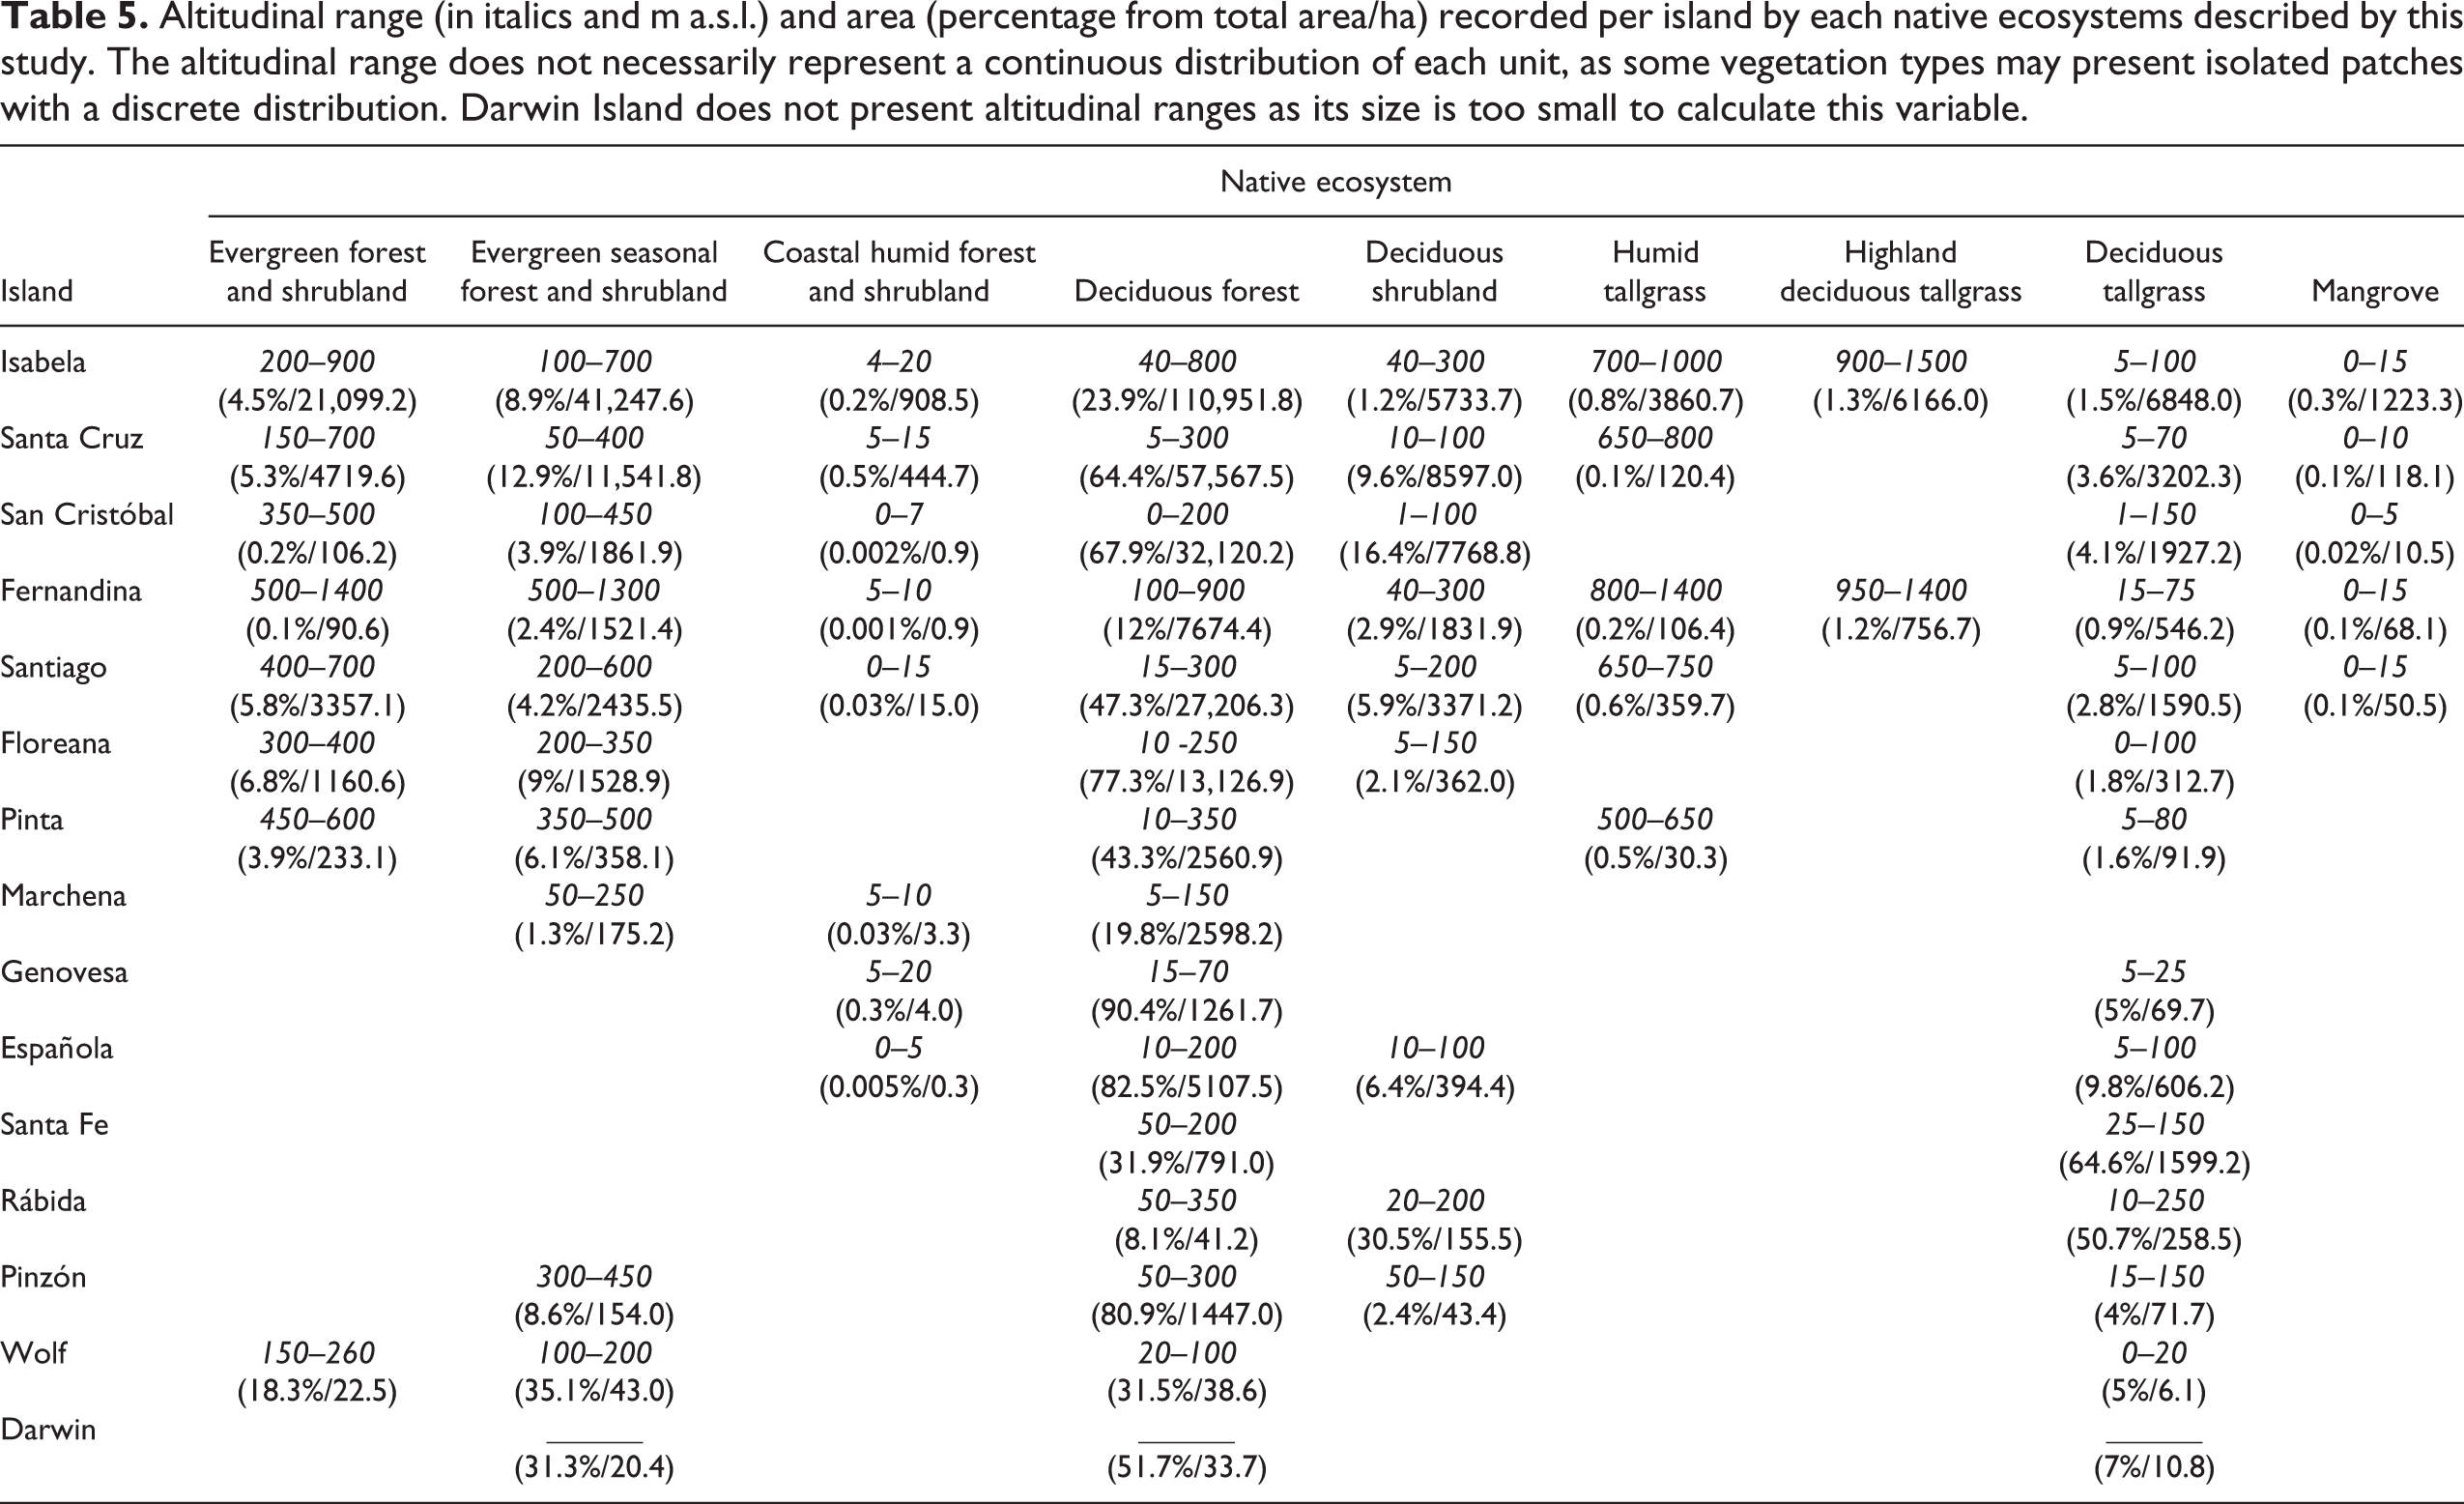
In terms of spatial coverage and distribution of native-dominated units for the archipelago, results indicate that of the 771,600.81 ha presently defined as protected land by the GNP, 34% of this (or 262,527 ha) is Deciduous forest. This is followed by Evergreen seasonal forest and shrubland (7.89%), Evergreen forest and shrubland (3.99%), and Deciduous shrubland (3.66%). Other native-dominated vegetation units are presented in Table 3. Presently, native-dominated dry forest vegetation types—including Deciduous forest, Deciduous shrubland, Deciduous tallgrass, and Highland deciduous tallgrass—dominate the archipelago, covering ∼40.8% of terrestrial protected area. This analysis also shows that only 12.8% of the National Park is now covered by humid and transitional type native vegetation. Thus, native-dominated vegetation units cover 53.6% of the GNP in total. The main islands with lower to higher coverage of transitional and humid native vegetation types in the Galápagos highlands (∼200 m a.s.l.) are: Fernandina with 2.7% (percentage combined from Evergreen seasonal forest and shrubland, the Evergreen forest and shrubland, and Humid tallgrass, Table 2), San Cristóbal with 4.2%, Pinzón with 8.6%, Santiago with 10.7%, Isabela with 14.2%, Floreana with 15.8%, and Santa Cruz with 18.3%. Lava accounted for 44.09% of total GNP land cover when grouped as the supra category rocky outcrops. Distribution, coverage, and altitudinal ranges per native-dominated unit and island are presented in Table 5.
Altitudinal range (in italics and m a.s.l.) and area (percentage from total area/ha) recorded per island by each native ecosystems described by this study. The altitudinal range does not necessarily represent a continuous distribution of each unit, as some vegetation types may present isolated patches with a discrete distribution. Darwin Island does not present altitudinal ranges as its size is too small to calculate this variable.
The six invasive-dominated vegetation units identified in this study were (listed from lower to higher coverage): Cinchona quinine (dominated by the tree Cinchona pubescens), covering 0.01% of all the protected area of Galápagos; Rubus blackberry (by the shrub Rubus niveus) covering 0.06%; “mixed” that represent a forest where the invasive species co-dominate with native species, covering 0.15%; Cedrela cedar (by the tree Cedrela odorata) covering 0.26%; Pennisetum grass (by the grass Pennisetum purpureum) covering 0.37%; and Psidium guava (by the tree Psidium guajava) covering 1.34% of all the GNP (Table 3).
The resulting map depicting invasive-dominated unit distribution shows that five islands have such vegetation units and only one of them, Santiago, is not inhabited by humans (Figure 4). Of these five islands, Isabela and Santa Cruz have the highest percentage of invasive-dominated vegetation units, 2.88% and 3.09% respectively, in relation to the protected area on each island (Table 6). Of the six invasive dominated units, only Rubus blackberry is present in all the five islands. When all islands with these units are grouped together, on average invasive-dominated vegetation is distributed around 440 m a.s.l. (max 750, min 130 m a.s.l.), or mostly in the highlands and humid regions of the archipelago. Denominated mixed forest, followed by Psidium guava and Cedrela cedar alien-dominated vegetation types had the widest altitudinal ranges among mapped invasive-dominated units (Table 6).
Area (ha) and altitudinal range (m a.s.l.) recorded per island by each invasive-dominate vegetation unit described by this study. The altitudinal range does not necessarily represent a continuous distribution of each unit, as some vegetation types may present isolated patches with a discrete distribution.

IV Discussion
Despite the urgent need to map biodiversity in unique protected sites, such as island biomes, there is a lack of systematic, replicable, and affordable methodologies to describe the distribution of native and invasive-dominated vegetation on isolated islands. Here, we present a mixed, affordable, and replicable methodology to provide information, at a proper scale, regarding vegetation distribution in the protected zone of the most iconic tropical archipelago on the globe. We expect that the map presented here, along with the resulting native vegetation distribution, invasive-dominated vegetation units, methodology, and secondary information such as vegetation features generated for each unit, might be of significant aid for scientists, managers, and the public locally and globally.
Overall, the methodology used here to understand an archipelago’s general vegetation distribution using a multi-scale object-based classification scheme showed relatively high accuracy when compared to specialized literature (∼87%; Foody, 2002). This allows us to suggest such mixed methodology can be implemented in other island biomes to map vegetation distribution with a significant degree of accuracy. However, it is important to note that the information generated in this study constitutes a reference framework to identify vegetation units at the “ecosystem scale” (with a nominal minimum mapping unit (MMU) of 1/4 ha, and a representation scale of 1:75.000) and not at the level of plant or vegetation associations (MAE, 2013a). Therefore, if the objective in future or similar mapping initiatives is to define finer scale vegetation aspects, like vegetation associations or particular species distributions for particular islands, other methodologies should be incorporated and explored. Additionally, and for a general comparison (more details can be found in the Appendix) we visually evaluated how the outcomes of the present study differ from previous similar attempts like the TNC-CLIRSEN 2006 map (at a representation scale of 1:50.000).
As a result of the OOC methodology used here, the primary features that can aid in proper classification of vegetation units usually occurring in islands such as the Galápagos (i.e., deciduous type forest, and humid highlands) were identified (Table 2). These features provided information about key vegetation properties such as plant vigor, productivity, and temporal patterns that, as noted by other investigations (e.g., Geller et al., 2017), help to define vegetation units in different mapping conditions.
Invasive-dominated units, particularly those dominated by Psidium guava, Rubus blackberry, and the mixed invasive forest, which mainly invade the natural humid highlands of the islands, were difficult to distinguish in the satellite imagery because they exhibit similar spectral response in the visible and NIR regions as the recipient native communities. The two bands of short-wave infrared (SWIR) used in this assessment played an important role in improving the identification and discrimination of invasive species (see Skowronek et al., 2017 for similar examples), because these bands are sensitive to vegetation cover and leaf moisture content. They also had a better ability to penetrate canopy in relation to visible bands, which in turn improved the discrimination of this kind of vegetation (Chen et al., 2005; Xiao et al., 2002). It is also important to highlight that some invasive species colonize the understory of native dominated dense canopies (like the case of R. niveus). Consequently, the number of real hectares covered by such plants is underestimated by methodologies like this one, as they mainly classify and interpret information about the uppermost vegetation layer. R. niveus is one of the most invasive plant species recorded in the Galápagos, and the capacity to colonize open and closed canopy areas might be one of the mechanisms allowing its widespread presence on the islands it invades (Tye et al., 2008). Despite these methodological limitations, the present mapping technique determined R. niveus (when dominating “the canopy” of our vegetation units) is the only invasive species occurring in all the invaded islands (Table 6), supporting the fact that it is widely distributed in areas infested by non-native plants.
Other investigations assessing the accuracy of methods to map biodiversity or produce environmental models highlight the importance of incorporating experts’ opinions to streamline outcomes such as vegetation maps (Krueger et al., 2012; Store and Kangas, 2001). The preliminary legends derived from experts, proved to be a good initial hypothesis to test plant distributions in the Galápagos. All of the nine native-dominated units outlined in workshops with experienced staff working in Galápagos were confirmed by this project’s methodology. Three of these nine units, specifically the Deciduous tallgrass, Deciduous shrubland, and the Highland deciduous tallgrass, can be considered new descriptions for the Galápagos vegetation classes. The Highland deciduous tallgrass has been mentioned in the few studies assessing vegetation zonation in Galápagos, but only to provide brief, general descriptions of this dry vegetation type. Thus, this unit, located mainly on the volcano tops in Isabela, has never been systematically mapped (Itow, 2003; Trueman and d’Ozouville, 2010). In addition to the accurate classification methodology that helped map native-dominated vegetation in the Galápagos, the ecological existence of each unit was also confirmed by analyses showing distinctive biotic characteristics associated with each class (i.e., pairwise differences in genus and species presence and abundances).
Also, it is widely recognized that attempts to map vegetation distribution using remote sensing techniques need appropriate verification and validation (Strahler et al., 2006). According to our experience after this mapping exercise, and despite the relatively long distances between islands forming the archipelago, methods such as point plots and direct observations were important tools to perform in situ verification and validation of the final maps and their vegetation units. For instance, boat trips around the coasts of virtually all the islands in the Galápagos, were in our opinion, very helpful to define and identify native vegetation distributions in the slopes of islands with some degree of elevational gradients. In general, the vegetation on islands with mountain chains (or volcanoes) exhibit a clear zonation pattern that change along the altitudinal gradient (Trueman and d’Ozouville, 2010) that can be visually identifiable from boats that are able to approach the coast. Additionally, as was the case for this investigation, recent studies recognize the fundamental role of drones in the verification steps of different mapping exercises because of their ability to survey relatively large areas with high definition cameras (500 m height, 20 cm/pixel definition) or other specialized sensors that can capture spectral signatures useful to distinguish different species or vegetation changes (Ivošević et al., 2015; Koh and Wich, 2012). Drones were also particularly important in this study to obtain high resolution images that helped to verify plant coverage in sites that were difficult to reach by foot or to interpret from the moderate resolution images.
The results from the present methodology showed that of the ∼771,600.81 ha comprising the GNP, around 54% is covered by native vegetation and around 2.2% is dominated by invasive species. The vegetation units recorded in the mountain tops, above 300 m a.s.l., on average, show more humid conditions throughout the year because they benefit from higher water availability resulting from air currents loaded with moisture arriving from the lowland’s coasts (Trueman and d’Ozouville, 2010). It is important to highlight that humid native vegetation in the highlands occupy only ∼4.57% (the sum of Evergreen forest and shrubland and Humid tallgrass) of the total protected land. The humid and more productive native ecosystems in the Galápagos have experienced extensive habitat conversion due to direct and indirect human activities, resulting in a significant reduction of area formerly occupied by these unique environments (Rentería and Buddenhagen, 2006). In addition to human related activities, climate change, and pressures like invasive species—which according to the present analysis are more prevalent in the highlands—represent a direct threat to these small patches of native vegetation in the mountain tops of the Galápagos. Tropical montane forests, in particular those located on isolated islands, are threatened by climate change as local assemblages are expected to be highly affected by even small abiotic-driven shifts (Loope and Giambelluca, 1998). This study strongly suggests to prioritize highland vegetation conservation in Galápagos, including permanent monitoring of invasive species expansion and native vegetation responses to changing climatic conditions, in order to facilitate the survival of endemic plant populations that exist only in these unique habitats. It is expected that replication of the present methodology in the next 2–5 years, together with an on-going project assessing historical distributions of the resulting vegetation units in these islands, will help to monitor colonization by most invasive species on this archipelago and thus, aid in important managerial and prioritization processes implemented by the GNP.
This study generated necessary knowledge on the vegetation distribution of an iconic island ecosystem that can inform managerial actions. Further, we expect the research, especially its methodology, to result in more replicable and low-cost information from other tropical islands that face threats to their unique biota.
Footnotes
Acknowledgements
Authors want to thank all the Galápagos National Park rangers and staff for their valuable contribution to this investigation and logistic support in main stages of this study. Special thanks to all the experts and colleagues who participated in the workshops implemented at the first stages of the present research, and all those who contributed with significant comments of the legends before and after their completion. This investigation was performed under GNP permit No. PC-35-16, and according to all regulations specified by the local authority. This project is a result of an official scientific and collaboration agreement between the GNP Directorate, and GSC, USFQ and the first author.
Declaration of Conflicting Interests
The authors declared no potential conflicts of interest with respect to the research, authorship, and/or publication of this article.
Funding
The authors disclosed receipt of the following financial support for the research, authorship, and/or publication of this article: Field work was possible due to the Ministry of Environment of Ecuador and a Galápagos Science Center-GSC scholarship granted to first author and the logistic and financial support of the Galápagos Research Cruise 2016 organized by the GSC, Universidad San Francisco de Quito, GNP and University of North Carolina at Chappell Hill.