
Abstract
The analysis of biogeographical structure and patterns of endemism are central topics of biogeography, but require exhaustive distribution data. A lack of accurate broad-scale information on the distribution of reptiles has so far limited the analyses of biogeographical structure. Here we analysed the distribution of reptiles within the broad-sense Western Palearctic to assess biogeographical regionalization using phylogenetic and non-phylogenetic approaches, identified areas of endemism and evaluated the environmental factors promoting community uniqueness and endemism. We gathered distributional records from the literature and from the field, mapping the distribution of all the Western Palearctic reptiles on a 1-degree resolution grid. βsim dissimilarity and hierarchical clustering was used to identify bioregions, analysing data both at the species and at the genus level, and considering phylogenetic dissimilarity. Consensus areas of endemism were identified on the basis of the optimality criterion. We then assessed whether biogeographical structure is related to present-day climate, insularity, orography and velocity of climate change during the Late Quaternary. The genus-level analysis identified five main biogeographical regions within the Western Palearctic, in partial agreement with previous proposals, while the species-level analysis identified more bioregions, largely by dividing the ones identified by genera. Phylogenetic bioregions were generally consistent with the non-phylogenetic ones. The strongest community uniqueness was observed in subtropical warm climates with seasonal precipitation and low productivity. We found nine consensus areas of endemism, mostly in regions with limited velocity of Quaternary climate change and warm subtropical climates. The biogeographical structure of Western Palearctic reptiles is comparable to what has been observed in other vertebrates, with a clear distinction between the Saharo-Arabian-Sindian and Euro-Mediterranean herpetofaunas. Unlike other vertebrates, in reptiles the highest uniqueness and endemism is observed in dry climates, but the velocity of climate change during the Quaternary remains a major driver of endemism across all the vertebrates.
Keywords
I Introduction
The analysis of biogeographical structure and patterns of endemism have been central topics of biogeography since its origins. For instance, the first maps of biogeographical regions by Wallace (1876) are generally considered as the foundation of modern biogeography, and remain a major conceptual basis in macroecological and macroevolutionary studies (Knapp, 2013), while endemism remains one of the major themes for biodiversity analyses and for the identification of conservation priorities (e.g. Collen et al., 2014; Margules and Pressey, 2000). Although the concepts of biogeographical regions and endemism areas are intuitive, their objective identification is not an easy task. Only during the last decades, have the development of quantitative analytical tools and the availability of broad-scale biodiversity data allowed objective analyses and attempts to identify the factors promoting biogeographical structure and endemism, and even to integrate phylogenetic information into analyses (Daru et al., 2017; Kreft and Jetz, 2010; Morrone, 1994; Szumik et al., 2002).
Biogeographical patterns are determined by the interplay between historical processes and present-day environmental conditions (Daru et al., 2017; Ficetola et al., 2017; Lomolino et al., 2010). For instance, endemism levels are probably determined by the joint effect of evolutionary processes (e.g. factors promoting speciation), climatic stability during the past, present-day climatic conditions and geographical constraints (e.g. isolation) (Jansson, 2003; Rosauer and Jetz, 2015; Sandel et al., 2011). Actually, climatic stability and the presence of refugia during Quaternary climatic oscillations have been identified as major determinants of present-day endemism at the global scale. However, the relationships between environmental features and biogeographical patterns are often complex, and patterns are not always consistent among taxa and geographic areas (Ficetola et al., 2017). For instance, a global analysis comparing different vertebrate clades suggested that the highest levels of bird endemism are associated with stable temperature through the year, while the relationship between temperature seasonality and endemism of mammals was weak (Sandel et al., 2011).
Broad-scale analyses of biogeographical patterns have largely benefited from the increasing availability of biodiversity data over broad scales, and from the eco-informatics tools required for their exploitation. Global distribution maps for three classes of terrestrial vertebrates (mammals, birds and amphibians) have allowed major analyses of biogeographical patterns at the global scale (Ficetola et al., 2017; Holt et al., 2013; Rueda et al., 2013; Sandel et al., 2011). Such maps are available thanks to the huge efforts for a global assessment of conservation status of these classes. Unfortunately, the global evaluation of reptiles is still incomplete, and distribution maps are only published for about 50% of described reptiles (IUCN, 2017, but see also Roll et al., 2017). This has prevented the inclusion of reptiles in many global biogeographical and conservation analyses (but see Collen et al., 2014; He et al., 2017; Jansson, 2003; Lamoreux et al., 2006; Proches and Ramdhani, 2012). In the absence of global data, more information is needed on the determinant of biogeographical structure of reptiles over broad spatial scales.
In this study, we took advantage of one of the largest available datasets on reptile distribution (Sindaco and Jeremčenko, 2008; Sindaco et al., 2013) to perform the first comprehensive evaluation of biogeographical structure and endemism of reptiles in the broad-sense Western Palearctic (Northern Africa, Europe and Western Asia; see section II.1 Study Area and Data for additional details).
First, we used a quantitative framework to identify the uniqueness of reptile communities and to delineate biogeographical subdivisions within the study area by performing analyses at the species level, at the genus level and considering phylogenetic turnover. Combining analyses at different levels improves our understanding of processes determining biogeographical patterns, since using higher taxonomic categories allows a better representation of long-term processes (Rueda et al., 2013). Furthermore, phylogenetic analyses integrate evolutionary processes determining present-day biodiversity (Daru et al., 2017). Early studies have proposed biogeographical subdivision of reptiles within this area, but analyses performed so far have shown some limitations. Most of them have focused on subsets of the Western Palearctic, and sometimes on very small regions (e.g. Arnold, 1987; Minton, 1966; Schleich et al., 1996; Sindaco et al., 2000). A broader area (former USSR) was analysed by Ščerbak (1982) who recognized four subregions within the Palearctic Region, further divided into Provinces. Sindaco and Jeremčenko (2008) proposed a zoogeographic subdivision for Western Palearctic reptiles mostly congruent with Ščerbak’s conclusions, but these analyses were mostly qualitative, i.e. they identified regions characterized by the co-occurrence of species with similar distribution. Approaches based on quantitative analyses that integrate phylogenetic and non-phylogenetic data are needed for an objective identification of biogeographical regions and boundaries (Daru et al., 2017; Holt et al., 2013; Kreft and Jetz, 2010) and to assess whether the biogeographical pattern of reptiles is congruent with the one of other vertebrates (Lewin et al., 2016).
Second, we identified the major areas of endemism on the basis of restricted-range species co-occurrence data.
Third, we analysed the relationships between biogeographical patterns and environmental features. This allowed testing of four hypotheses on the factors determining biogeographical patterns and endemism: Repeated climatic changes after glaciations have determined major range shifts. It has been proposed that biogeographical structure and endemism levels are particularly strong in areas that remained climatically stable after glaciations (Rosauer and Jetz, 2015;Sandel et al., 2011), but no tests of this hypothesis have been performed with reptiles. The richness and composition of reptile communities is strongly related to present-day climatic features (Ficetola et al., 2013; Powney et al., 2010; Rodriguez et al., 2005; Whittaker et al., 2007) and, at least in some geographic areas, speciation rate might be higher in specific climates (Hawkins et al., 2003; Powney et al., 2010; Rabosky et al., 2007). Therefore, we expected a major role of climate in determining biogeographical patterns. High ecosystem productivity increases the available resources, can promote diversification and can also facilitate populations living in small areas. Productivity might thus potentially increase biogeographical structure and the survival of endemic lineages (Evans et al., 2005; Rosauer and Jetz, 2015). Isolation has been proposed as a major determinant of the generation and persistence of unique faunas and of lineages with small geographical range (Rosauer and Jetz, 2015; Steinbauer et al., 2013). Geographical isolation can occur both in true islands and also in isolated high-altitude areas or other ecological islands.
II Methods
1 Study area and data
The study area approximately corresponds to the Western Palearctic region as proposed by Sindaco and Jeremčenko (2008), i.e. the western portion of Wallace’s (1876) Palearctic realm (which also approximately corresponds to the Western Palearctic plus the Saharo-Arabian regions of the Holt et al. (2013) classification). Overall, we considered Europe, the Arabian Peninsula, South-Western Asia (west of the Indus Valley), the former Soviet Republics of Central Asia and Russia (west of the Ural Mountains) and several countries of North Africa (including the Sahara Desert north of approx. 22° N) (Figure 1). Our data set included >174,000 distributional records obtained from the literature as well as from field and museum collections, showing the known distribution of all the 799 native species of terrestrial turtles, crocodiles, amphisbaenians, lizards and snakes occurring in the area (Roll et al., 2017; Sindaco and Jeremčenko, 2008; Sindaco et al., 2013); all data were mapped at a resolution of one degree. We used an updated version (about 58,000 additional records) of the datasets used by Sindaco and Jeremčenko (2008) and Sindaco et al. (2013) and the species checklist followed Roll et al. (2017).
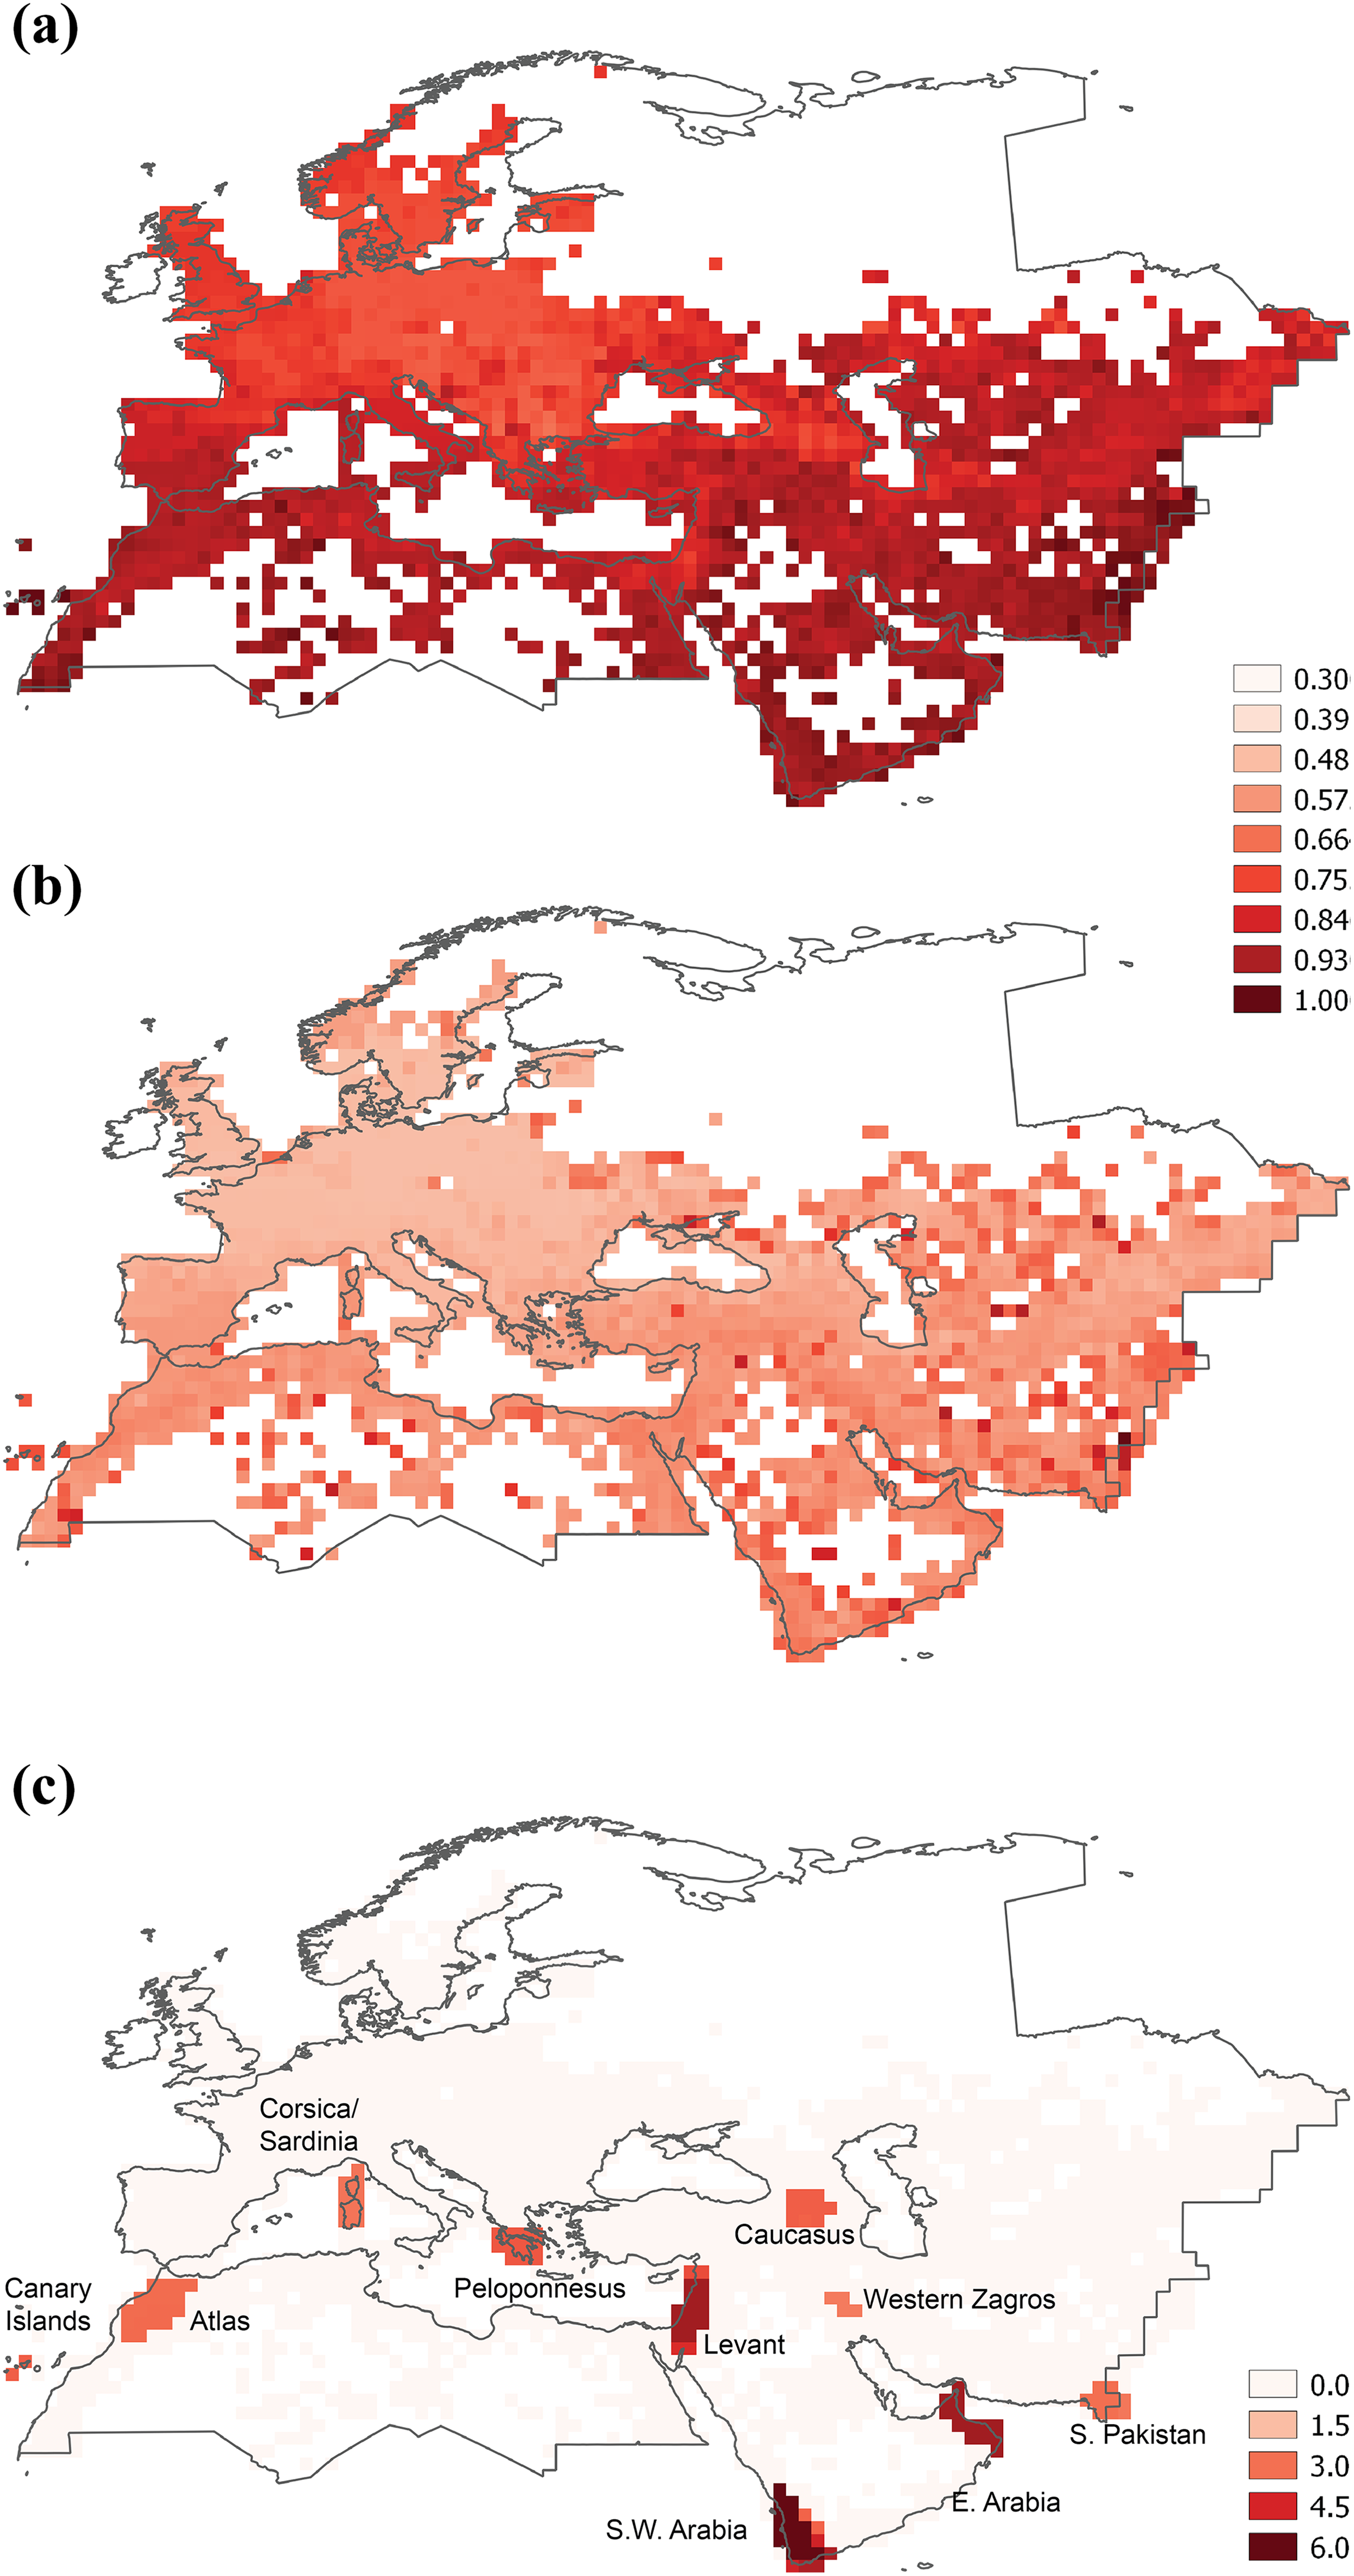
a) Study area (broad-sense Western Palearctic), and uniqueness of reptile communities, measured as the average βsim between each cell and all the remaining cells; b) Phylogenetic uniqueness; c) Consensus areas of endemism of reptiles. Darker colours represent higher uniqueness and endemism values.
2 Data analysis
2.1 Biogeographical structure
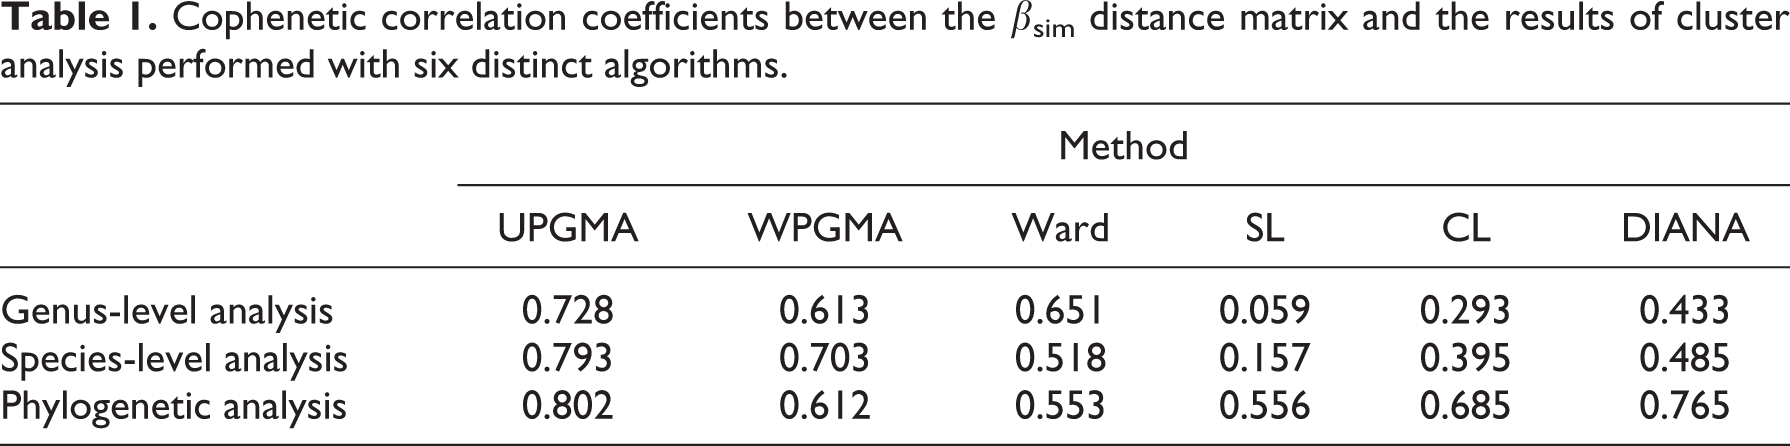
We used the framework developed by Kreft and Jetz (2010) for the objective delineation of biogeographical regions within the Western Palearctic. First, we used the βsim metric to calculate the similarity between cells (Kreft and Jetz, 2010). βsim was used for non-phylogenetic analyses, while its analogousness for phylogenetic data (pβsim) was used for phylogenetic analyses (Holt et al., 2013). pβsim was calculated on the basis of the phylogenetic supertree of squamate reptiles (Zheng and Wiens, 2016). Subsequently, in order to translate the βsim/pβsim metrics into geographical clusters, we tested the performance of six approaches to agglomerative and divisive hierarchical clustering: unweighted pair-group method with arithmetic averages (UPGMA), weighted pair-group method with arithmetic averages (WPGMA), Ward’s method, single linkage (SL), complete linkage (CL), and divisive hierarchical clustering (DIANAS) (Borcard et al., 2011; Kaufman and Rousseeuw, 1990; Kreft and Jetz, 2010). For each method, we calculated the cophenetic correlation coefficient between the dendrogram and the original distance matrix; the method with the highest cophenetic correlation coefficient was regarded as the one producing the best clustering model (Borcard et al., 2011).
Translating the results of cluster analyses into sets of biogeographic regions requires explicit rules because many different sets of regions could be delimited (Kreft and Jetz, 2010; Linder et al., 2012). We used four basic conditions defined by other studies for the identification of biogeographical regions: 1) regions must be geographically coherent; 2) the regions could not be nested within each other; 3) groups must be identified using a phenon line (i.e. a vertical line crossing the dendrogram); 4) a limited number of major regions (up to 10) must be defined (Linder et al., 2012). A few regions (3 in the species-level analysis, 10 in the genus-level analyses) were extremely small (<10 cells). If nested within the main regions, such very small regions were merged with the main region, following the recommendations on singletons and nested biogeographical regions (Holt et al., 2013; Legendre and Legendre, 2012; Linder et al., 2012).
Our analysis was repeated three times: at the species and at the genus level (without considering phylogenetic information; Kreft and Jetz, 2010; Rueda et al., 2013), and integrating phylogenetic information into analyses (following Daru et al., 2017; Holt et al., 2013).
The genus-level analysis allows for better representation of long-term biogeographical processes and to identify major subdivisions, while species-level analyses are related to more recent diversification and eco-geographical processes (Kreft and Jetz, 2010; Rueda et al., 2013) and produce more subdivisions. In preliminary analyses we also assessed the performance of a family-level analysis. However, we do not present the results of the family-level analysis because of its weak biogeographical signal within the study area and because results were consistent with the major subdivisions obtained by the genus-level analysis. A complete phylogenetic supertree of reptiles is not available for the study area (only 49% of species are included in the Zheng and Wiens (2016) supertree), thus hampering a phylogenetic analysis including all the species. However, for Squamata (i.e. lizards and snakes), phylogenetic information was available for 94% of genera (Zheng and Wiens, 2016), therefore the phylogenetic analysis was performed focusing on squamate reptiles. Non-monophyletic genera in the Zheng and Wiens (2016) phylogeny (Ablepharus, Algyroides, Bunopus, Cyrtopodion, Eumeces, Mediodactylus, Saurodactylus) were excluded from the phylogenetic analyses. Analyses were performed in R 3.4 (R Development Core Team, 2017) using the packages cluster, vegan, raster, ape and betapart.
2.2 Endemism
We used the optimality criterion implemented in the NDM/VNDM program (Goloboff, 2004) to identify the areas of endemism. Within NDM/VNDM, NDM is the basic search engine, while VNDM helps visualization and diagnosis. NDM/VNDM is a grid-based method, searching for sets of cells that are congruent for the distribution of a large number of species (Szumik and Goloboff, 2004; Szumik et al., 2002). NDM/VNDM assigns an endemicity score to each species and area. The score of species increases if more records exist inside a candidate endemism area and fewer exist outside. The total endemicity score of an area is the sum of the endemicity of all species that are present within that area (Szumik and Goloboff, 2004; Szumik et al., 2002). We considered all sets with a score ≥ 2.75 and three or more endemic species. We ran the search 100 times, selecting the species with a minimum endemicity score of 0.4. This parameter set allows the identification of a limited number of major areas of endemism within a broad study area (for additional details, see Aagesen et al., 2013; Szumik and Goloboff, 2004; Szumik et al., 2006). We then calculated the loose consensus at 5% of similarity of species with any area, as suggested to identify main areas of endemism in broad-scale studies (Aagesen et al., 2013).
2.3 Predictors of biogeographical structure and endemism
We analysed the relationships between biogeographical structure, endemism and several broad-scale environmental features. We considered parameters representing current average climatic conditions, current climate variability, energy availability, climatic stability during Late Quaternary, topographic heterogeneity and insularity (Rosauer and Jetz, 2015; Sandel et al., 2011). Specifically, we considered eight variables: mean annual temperature, annual precipitation, seasonality of temperature, seasonality of precipitation (measured as coefficient of variation) (obtained from Worldclim; Hijmans et al., 2005), normalized digitized vegetation index (NDVI), climate-change velocity during Late Quaternary (Sandel et al., 2011), altitudinal range within the cell (calculated from a 1-km resolution digital elevation model; www.worldclim.org), and contiguous land area. Contiguous land area is the average area of the continent or island(s) on which the grid cell occurs, is lower in cells within islands and has been proposed as a potential driver of endemism (Rosauer and Jetz, 2015). Potential evapotranspiration has been proposed as an important predictor of reptile richness (Rodriguez et al., 2005), but was not considered here because of its strong collinearity with temperature (r = 0.92). After the removal of potential evapotranspiration, pairwise correlation was limited (|r| <0.7) for nearly all the environmental variables. A stronger correlation (r = 0.8) existed between annual precipitation and NDVI. However, in all models the variance inflation factors were considerably less than 10 for all variables, indicating that collinearity does not pose major issues to the models (Dormann et al., 2013). Conclusions remain consistent if precipitation or NDVI are removed from models.
For each cell, we calculated community uniqueness as the average βsim between the cell and all the remaining cells, as this represents a measure of biogeographical structuration of communities (Holt et al., 2013). We used generalized least squares (GLS) to relate community uniqueness and endemism to the eight environmental parameters. GLS allows integrating spatial autocorrelation into the error term, and is one of the spatial regression methods showing the best performance as it allows an accurate estimation of coefficient parameters and has low type I and type II errors (Beale et al., 2010; Beguería and Pueyo, 2009). First, we built models relating the community uniqueness and endemism values of cells to all the eight predictors. Subsequently, we built models with all possible combinations of independent variables, and ranked them following the corrected Akaike’s Information Criterion (AICc). The model with lowest AICc was considered as the minimum adequate model. We also used Akaike’s weights (AICweight), which provide useful information on the relative importance of predictors (Giam and Olden, 2016). In GLS we used a Gaussian spatial error structure in order to take into account spatial autocorrelation, as this was the error structure allowing better control of spatial autocorrelation (lower average residual autocorrelation than models with exponential or spherical error) (Beguería and Pueyo, 2009).
III Results
1 Biogeographical structure
In all the analyses (species level, genus level and phylogenetic), the UPGMA showed the highest cophenetic correlation with the βsim / pβsim distance matrices (Table 1), therefore UPGMA was selected as clustering algorithm. The highest levels of average βsim and pβsim were observed in the south of the study area, with particularly high values in the Canary Islands and in the mountains of Central Asia (Figure 1(a) and (b)).
Cophenetic correlation coefficients between the βsim distance matrix and the results of cluster analysis performed with six distinct algorithms.
The analysis at the genus level identified seven clusters (Figure 2(a)): 1) Euro-Mediterranean (also including Canary Islands, north-west Africa, northern Anatolia, the Caucasus); 2) Eastern Mediterranean (Aegean area, Anatolia, the Levant, Zagros Mountains); 3) and 4) two small clusters representing the high mountains of Central Asia, corresponding to the western slopes of the Hindu Kush, Karakorum, Pamir, Alai and Tien-Shan ranges; 5) Iranian Plateau and South Turan; 6) North Turan; and 7) Saharo-Arabian-Sindian (including the Sahara, the Arabian Peninsula, Mesopotamia, south coastal Iran and lowlands of Pakistan).
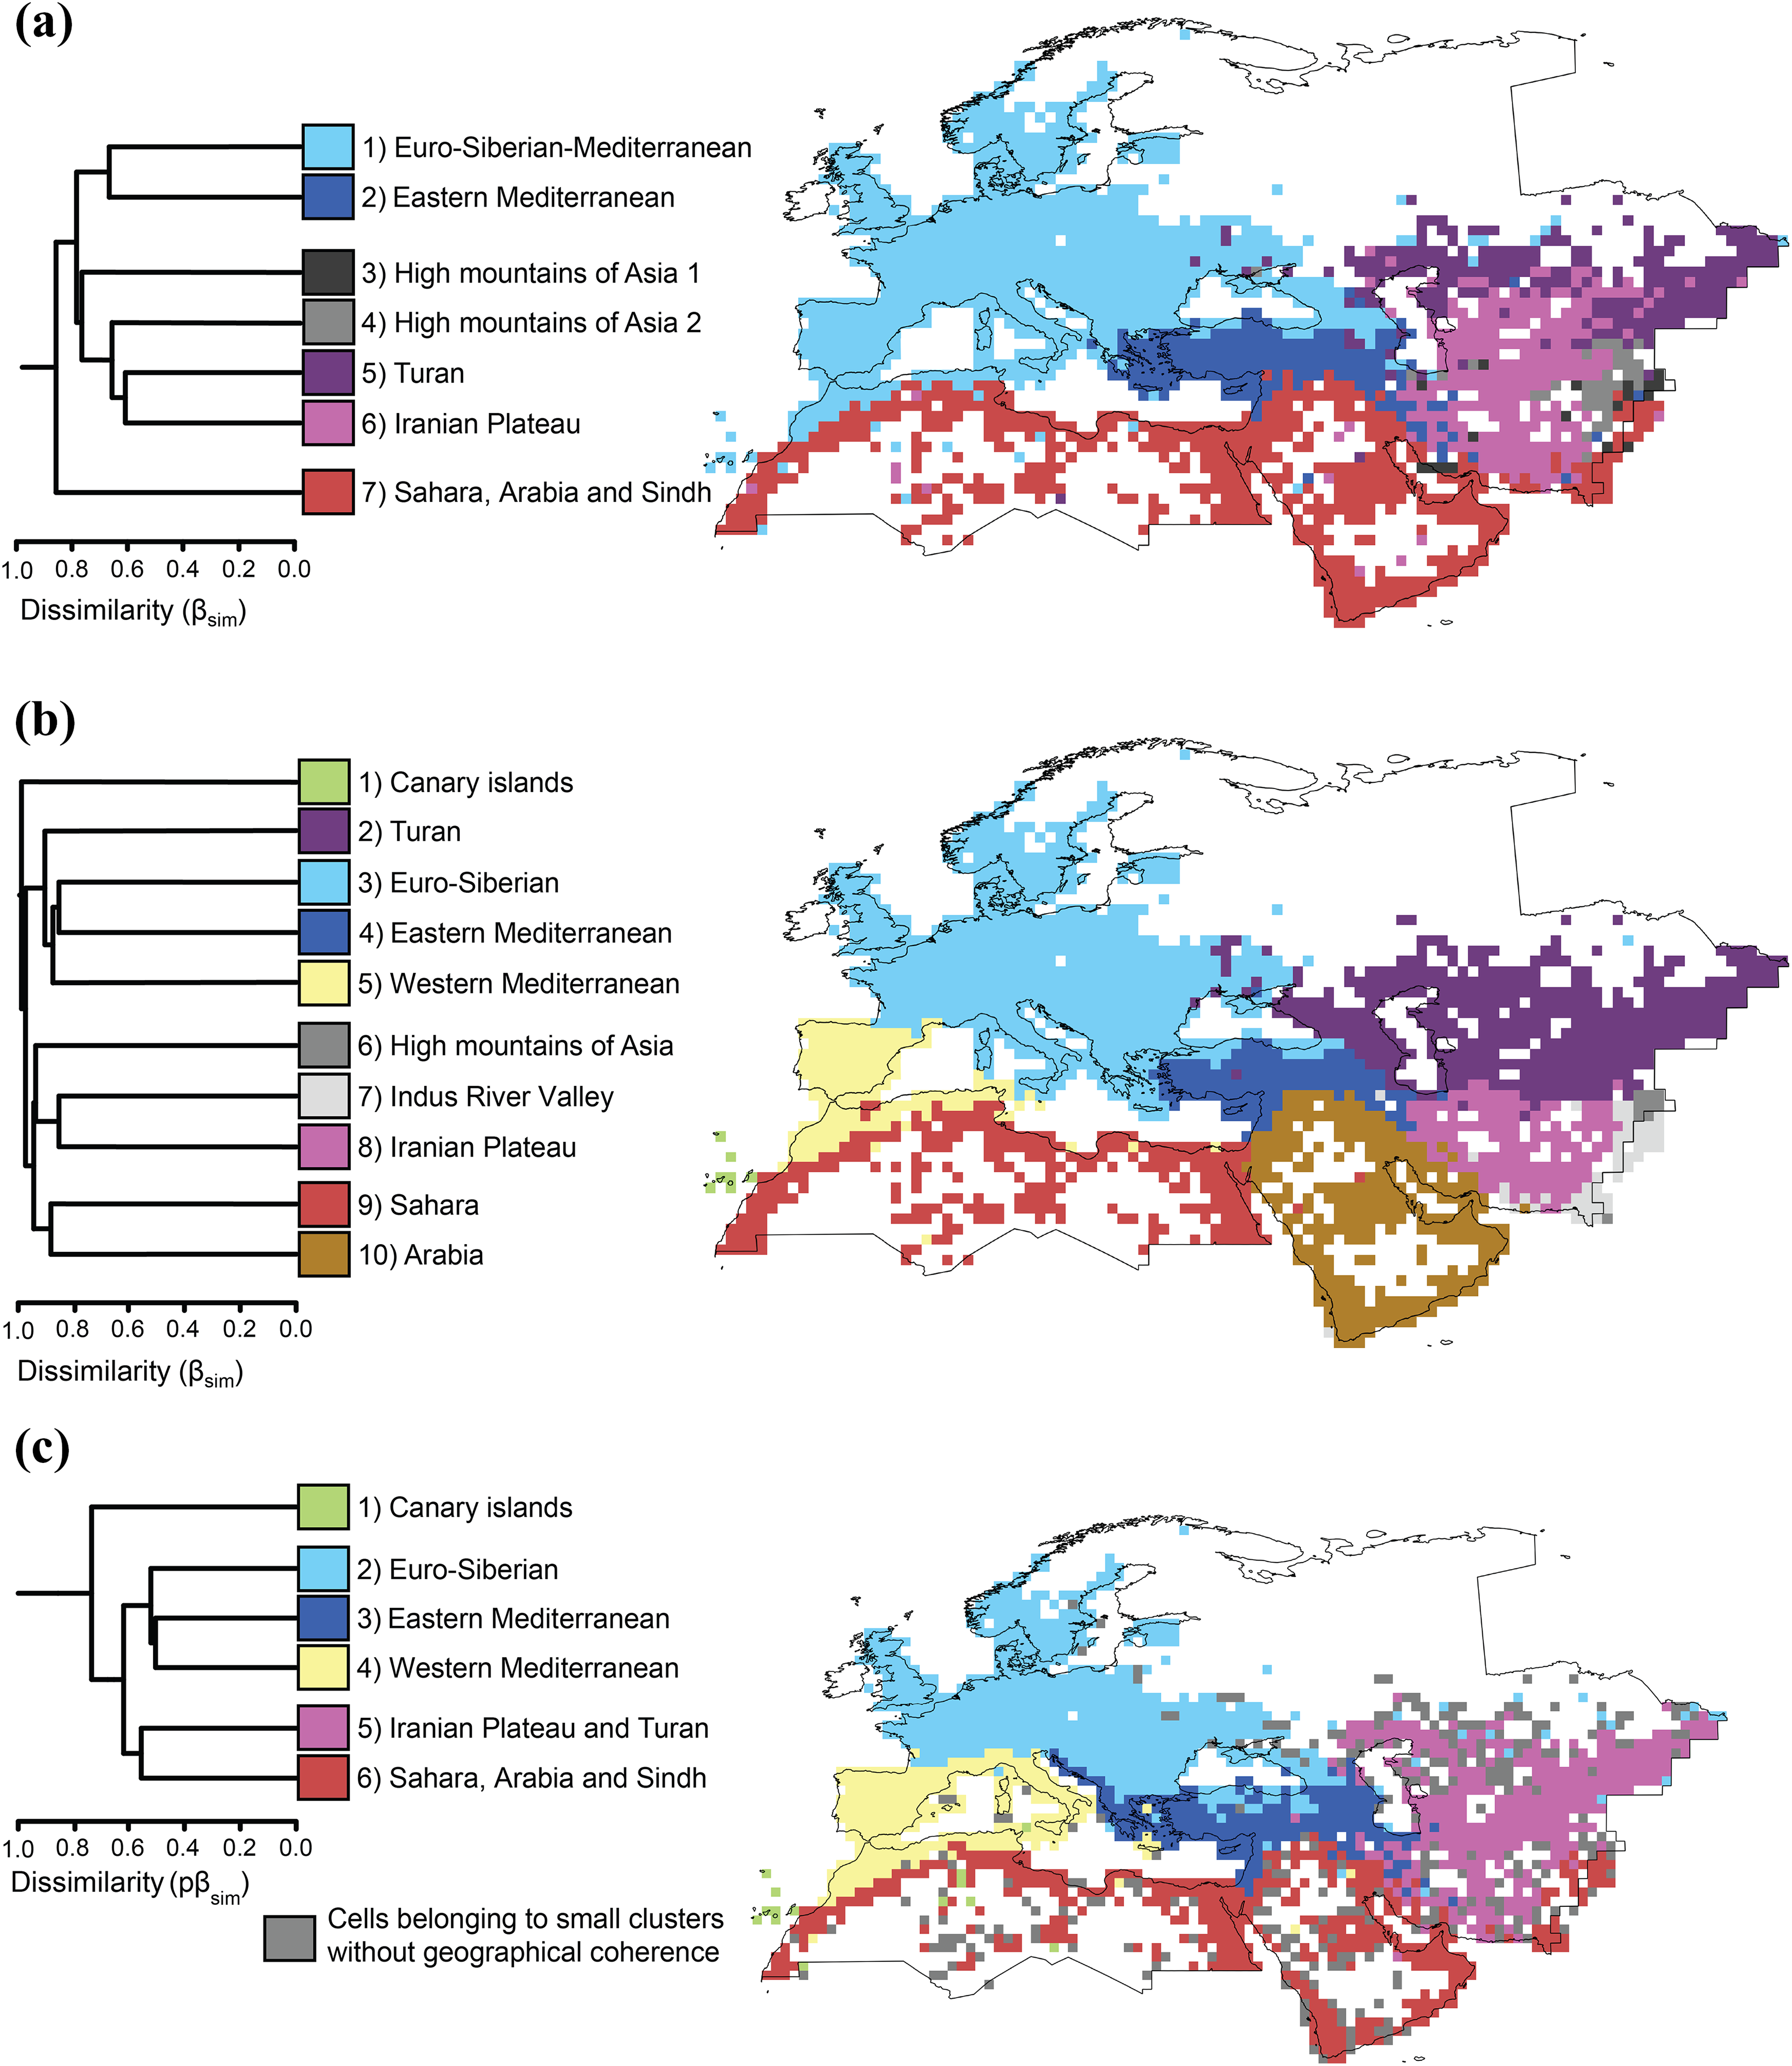
Dendrograms and maps resulting from hierarchical clustering of grid cells based on βsim dissimilarity of reptile communities, analysed at the level of a) genera; b) species and c) phylogeny. The same colours are used in maps and dendrograms.
The analysis at the species level identified 10 major clusters (Figure 2(b)): 1) Canary Islands; 2) Turan; 3) Euro-Siberian (most of Europe and northern Anatolia); 4) Eastern Mediterranean and Western Middle East (Anatolia, the Levant and mountains of north-western Iran); 5) Western Mediterranean (Maghreb and the Iberian Peninsula); 6) high mountains of Central Asia; 7) the Indus River Valley, representing a transition zone with the Oriental realm; 8) Iranian plateau; 9) Sahara; and 10) Arabia (including south-western Iran).
The phylogenetic analysis identified six major clusters: 1) Canary Islands; 2) Euro-Siberian; 3) Eastern Mediterranean and Western Middle East; 4) Western Mediterranean (including the Maghreb and the Iberian and Italian peninsulas); 5) Irano-Turanian; and 6) Saharo-Arabian-Sindian (Sahara, Arabia, southern Iran and lowlands of Pakistan). Furthermore, in the phylogenetic analysis several clusters without geographical coherence were present, spanning over the whole Western Palearctic (shown in grey in Figure 2(c)). The phylogenetic analyses were in general agreement with the species-level and genus-level analyses. The main differences were a clear identification of Eastern and Western Mediterranean, which was already proposed by previous studies (Vigna Taglianti et al., 1999), but here emerge more extensively, and the lack of boundary between the Turan lowlands and the Iranian plateau.
The integration of the three analyses supports some of the biogeographic subdivisions proposed by previous studies (Sindaco and Jeremčenko, 2008): 1) Canary Islands; 2) Sahara; 3) Arabian Peninsula; 4) Iranian Plateau; 5) Turan lowlands; and 6) a transition zone between the Palearctic and the Oriental fauna in the Indus Valley. Sindaco and Jeremčenko (2008) proposed a Euro-Siberian subregion, excluding the Mediterranean basin. The Euro-Siberian region is characterized by a very low number of species and without endemics, and is identified in the phylogenetic analysis only, where it includes northern Anatolia and north-western Caucasus. Furthermore, the Mediterranean region (Sindaco and Jeremčenko, 2008) is split in two: a Western Mediterranean region (supported by both the species-level and phylogenetic analyses) and an Eastern Mediterranean region (supported by all the analyses). The latter includes most of Anatolia, the Levant and the mountains of northern and western Iran, thus replacing the Western Asian Mountain transition zone proposed by Sindaco and Jeremčenko (2008), with substantially changed boundaries. Finally, the high mountains of Central Asia region proposed by Sindaco and Jeremčenko (2008) is not supported by the phylogenetic analysis, and is poorly resolved by other analyses, probably because of the complex orography of the area, where deep valleys mainly inhabited by Turanian fauna intergrade with high mountains hosting several Central Asian montane endemics.
2 Areas of endemism
The analysis of endemism identified 27 candidate areas. These candidate areas were grouped in nine consensus areas: the Canary Islands; Western Morocco (including the High and Middle Atlas); Corsica and Sardinia; the Peloponnesus; the Levant; the Caucasus; South-Western Arabia; the Hajar Mountains in eastern Arabia; a small area in the Western Zagros Mountains; and Southern Pakistan (Figure 1(c)). These areas agree rather well with the hotspots for the presence of steno-endemic reptiles identified by Sindaco and Jeremčenko (2008: figure 5.6). All native species of the Canary Islands are insular endemics belonging to three genera and families: Gallotia (endemic), Tarentola and Chalcides. Western Morocco is a major area of endemism, with endemics belonging to several genera and families such as Trogonophis, Blanus, Saurodactylus, Quedenfeldtia, Atlantolacerta, Scelarcis, Timon, Mesalina, Psammodromus, Chalcides and Vipera. Corsica and Sardinia share some endemics such as the monotypic genus Archaeolacerta, as well as Algyroides fitzingeri and Podarcis tiliguerta. Endemics of the Peloponnesus include Anguis cephallonicus, Algyroides moreoticus, Podarcis peloponnesiacus and the monotypic endemic genus Hellenolacerta.
The Levant (from Lebanon to Sinai) is the area with the highest reptile richness in the Western Palearctic (Ficetola et al., 2013; Roll et al., 2017; Sindaco and Jeremčenko, 2008; Sindaco et al., 2013) and is also the major area of endemism, with endemic species belonging to the genera Mediodactylus, Ptyodactylus, Ablepharus, Chalcides, Ophiomorus, Acanthodactylus, Phoenicolacerta, Parvilacerta for lizards, and to the snake genera Rhinotyphlops, Platyceps, Telescopus, Atractaspis, Micrelaps, Daboia and Montivipera. The Caucasus hosts endemic species mostly belonging to the radiations of two genera, Darevskia and Vipera (subgenus Pelias). The Arabian Peninsula shows two main centres of endemism in South-West Arabia and in the Hajar Mountains (eastern Arabia). The South-Western hot-spot is characterized by endemic species of the genera Pelomedusa, Agamodon, Hemidactylus, Pristurus, Stenodactylus, Acanthocercus, Chamaeleo, Scincus, Varanus, Acanthodactylus, Philochorthus, Myriopholis and Echis. The Hajar Mountains are characterized by the occurrence of many endemics belonging to the genera Asaccus, Hemidactylus, Pristurus, Ptyodactylus and Echis and the endemic lacertid genus Omanosaura. A small area of endemism in the mountains of Western Zagros hosts several endemic species belonging to the genera Rhynchocalamus, Asaccus and Pseudocerastes. The Zagros is an area where many endemic species are only known for one or a handful of localities (Meiri et al., 2018), and the limited extension of this hot-spot is probably related to the scarcity of data for this area. Finally, within the study area, several species are restricted to Southern Pakistan (Sindh). However, this is not a true area of endemism, since it is inhabited by many Oriental species that actually have a broader distribution in India.
3 Environmental features and biogeographical structure
The uniqueness of reptile communities was highest in cells showing stable climate during the Quaternary, high temperature, high seasonality for precipitation, and low primary productivity. The multivariate, spatially explicit models also suggested a positive role of temperature seasonality, and a negative role of altitudinal range, but these relationships were very weak using Pearson’s correlations (Table 2(a)). The environmental features related to phylogenetic uniqueness were similar to the ones related to community uniqueness, with higher phylogenetic uniqueness in cells showing stable climate during the Quaternary, high temperature, high seasonality for precipitation, and low primary productivity (Table 2(b)).
Relationships between eight environmental variables and community uniqueness and endemism of reptiles of the Western Palearctic. Four measures are used to describe the relationships among variables: Pearson correlation with the dependent variable (r); regression coefficients from a generalized least square model considering all the variables (GLS); regression coefficients from the best-AIC generalized least square model (GLSREDUCED); Akaike weights based on GLS models (AICweight). Temp = mean annual temperature; Prec = annual precipitation; TempS = temperature seasonality; PrecS = precipitation seasonality; NDVI = normalized digitized vegetation index; Velocity = Late Quaternary climate change; Cont = contiguous land area.
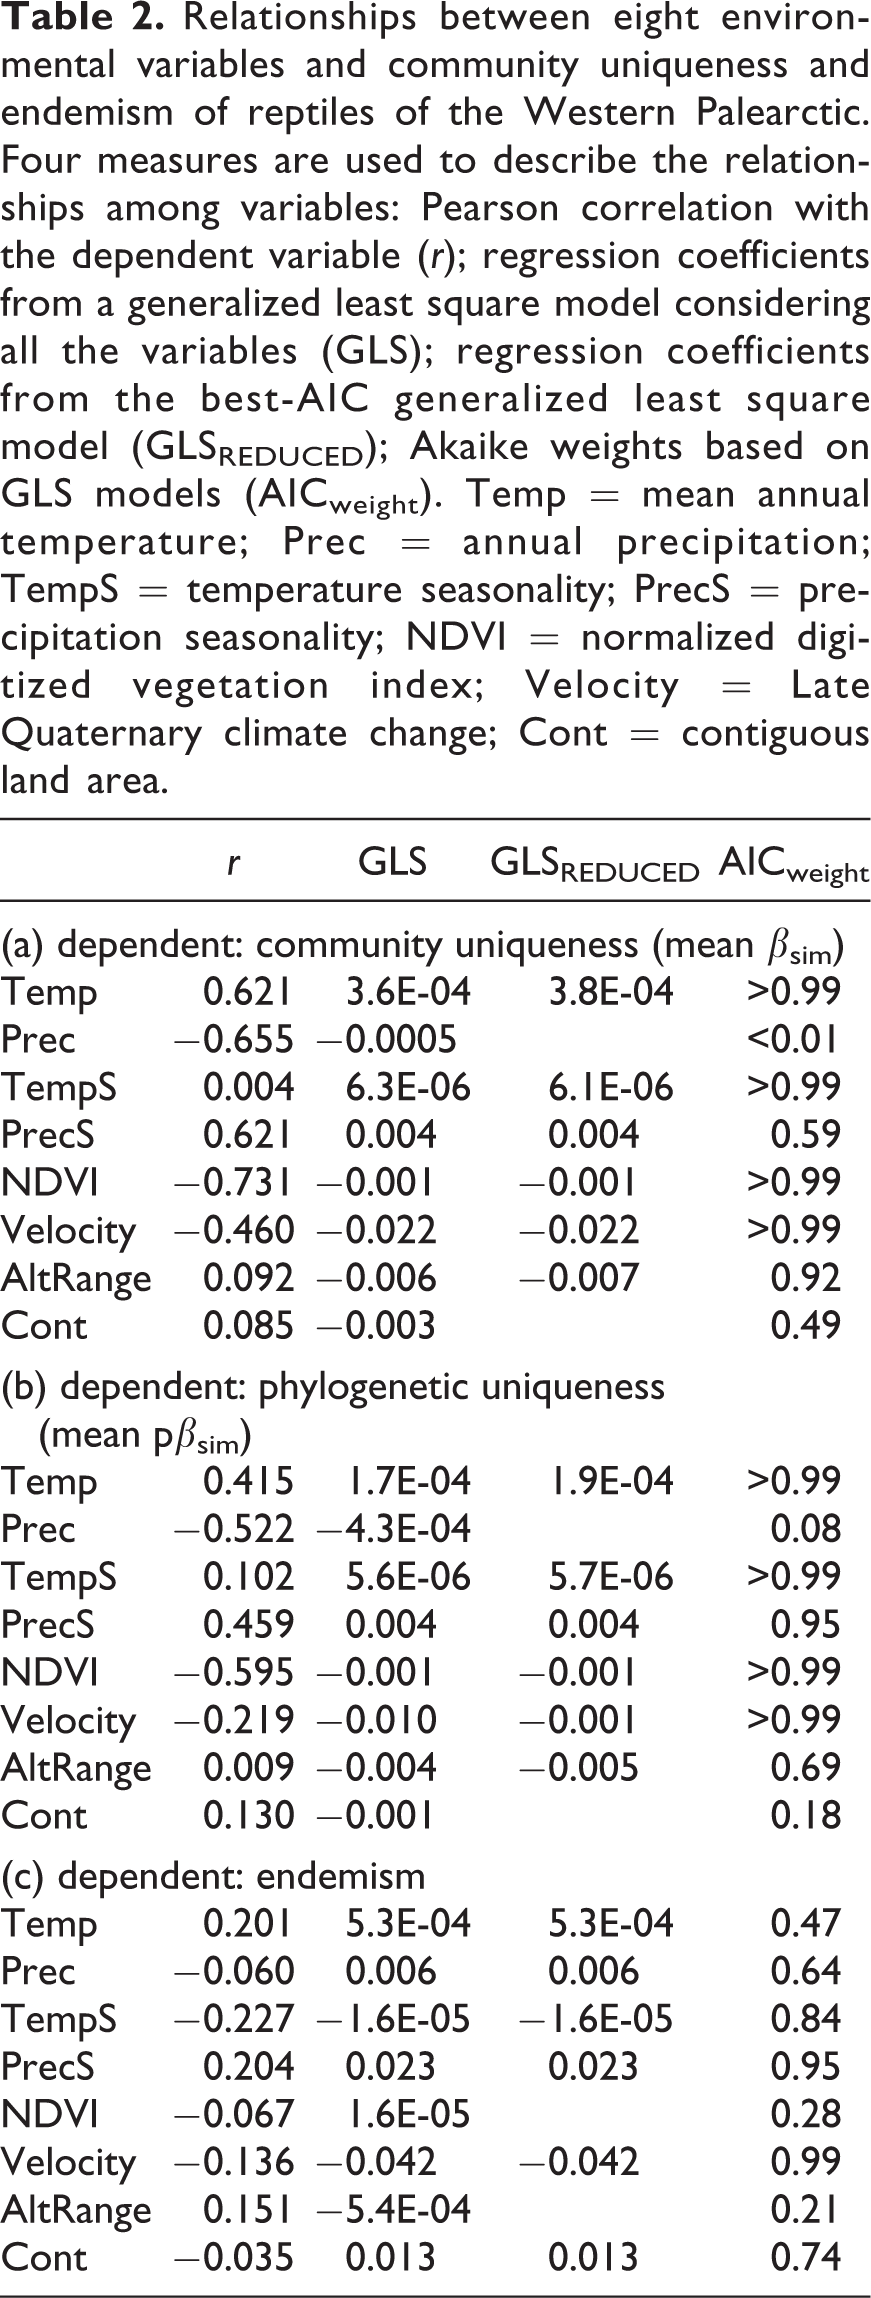
Reptile endemism was highest in areas showing the lowest temperature seasonality, high precipitation seasonality and stable climate during the Late Quaternary. When taking into account the other variables, endemism was positively related to annual temperature, precipitation and continentality. However, these relationships were not evident in univariate correlations, and only showed a limited support by model averaging (Table 2(c)).
IV Discussion
1 Biogeographical structure
Our quantitative analyses on reptiles identified a clear biogeographical structure within the broad-sense Western Palearctic, and provided insights on the role of present and past environmental features. Previous global analyses performed on mammals, birds and amphibians indicate that our study area is actually part of two biogeographical regions: the Saharo-Arabian in the south and the Eurasian in the north, which can be considered to belong to distinct realms (Holt et al., 2013; Kreft and Jetz, 2010; Rueda et al., 2013). Our analyses obtained similar results, as a strong separation occurred between a southern region comprising Sahara, Arabia, Mesopotamia, southern Iran and lowlands of Pakistan (which matches rather well the Saharo-Arabian realm of previous analyses), and a northern, Euro-Mediterranean region (i.e. Europe, the Mediterranean basin and Anatolia), which is the Eurasian portion of the Palearctic (Holt et al., 2013; Kreft and Jetz, 2010; Rueda et al., 2013). The pattern we obtained with reptiles was generated using data and approaches that are independent from previous analyses (Holt et al., 2013; Kreft and Jetz, 2010; Rueda et al., 2013), further stressing the clear separation between Eurasian and Saharo-Arabian faunas. The Iranian plateau and the Turanian lowlands, placed respectively in the Saharo-Arabian and in the Palearctic realms by Holt et al. (2013), host closely related reptile faunas. As a consequence, with reptiles the subdivision between these two regions is only evident in the species-level analyses, and becomes weaker when deep phylogenetic relationships are taken into account.
Within the northern region (Euro-Mediterranean), we identified a clear separation between Central Europe, the Western Mediterranean and the Eastern Mediterranean. The Eastern Mediterranean (southern Balkans, Anatolia, Cyprus, the Levant and north-western Iran), was not evident in biogeographical analyses on other taxa (Holt et al., 2013). This area hosts a very rich reptile fauna (Sindaco et al., 2000), with a large number of endemic species. The Canary Islands are a very distinct cluster in both the phylogenetic and species-level analyses (Figure 2), given the exceptional level of endemism of this archipelago (all the native species are endemic). Nevertheless, the Canary Islands are closely associated to the Euro-Mediterranean regions, because all present species have originated from radiation processes occurring during the last 10–20 million years (Carranza et al., 2002; Cox et al., 2010), thus this region reflects relatively recent biogeographical processes.
The southern region (Sahara, Arabia and Sindh) is closely related to Iran and Turan, and the affinity between these areas is particularly evident in the phylogenetic analyses (Figure 2(c)). Overall, several subregions are evident along a west–east transect (Figure 2(b)): a Saharo-Arabian, a Irano-Turanian region and the Indus River Valley, which constitutes the transition zone between the Palearctic and the Oriental realms. In analyses performed on other taxa, the separation between Sahara, Arabia and Iran was detected for mammals, while was not evident for birds and amphibians (Holt et al., 2013).
The relationships between the Saharo-Arabian bioregion and the other regions are highly controversial. Holt et al. (2013), analysing the distribution of amphibians, birds and mammals, identified this bioregion as an independent realm, closely related to the Afrotropical one. However, others suggested that the Saharo-Arabian can be better described as a transition zone between the Palearctic and the Afrotropical (Kreft and Jetz, 2013). Reptiles are particularly interesting when studying the biogeography of this region, as they are among the vertebrates with the strongest adaptations to arid environments. The complete data set of reptile distribution available in this study, combined with the data available for Africa (Chippaux, 2006; Largen and Spawls, 2010; Spawls et al., 2004; Trape and Y, 2006; Trape et al., 2006) allow us to confirm that the Saharo-Arabian bioregion has intermediate features between the Afrotropical and the rest of the Palearctic. Nevertheless, at least for reptiles, the Saharo-Arabian area is slightly closer to the other Palearctic regions than to the Afrotropical ones (see supplementary material, Appendix S1), agreeing with previous biogeographical proposals (Sindaco and Jeremčenko, 2008).
The species-level analysis was in general agreement with the genus-level analysis, but identified more clusters. Some authors suggested that species-level analyses of wide biogeographical regions are less appropriate than analyses at higher taxonomic levels (e.g. genus or family) (Proches and Ramdhani, 2012; Rueda et al., 2013). Areas with distinct faunas at the species level (i.e. Canary Islands) were clearly identified, and subregions emerged within the Saharo-Arabian and the Irano-Turanian clusters (Figure 2). This suggests that species-level analyses can identify biogeographical patterns determined by processes that occurred at finer spatial and/or temporal scales. Species have smaller ranges than genera, and this can determine the small clusters within the ones revealed by genera. Phylogenetic analyses provide additional information, given that they take into account both recent and deep evolutionary events, and can be particularly suitable to identify the similarity among regions. Overall, performing analyses at multiple levels can help to identify biogeographic processes occurring at multiple scales and to confirm the reliability of obtained results (Kreft and Jetz, 2010).
2 Methodological limitations
Biogeographical analyses can be performed using both cell-presence data (e.g. this study) and range polygons (e.g. Holt et al., 2013). Uncertainty exists in all species distribution data (Rocchini et al., 2011), thus both approaches have their own limitations. For instance, with range polygons the unoccupied areas within species ranges are sometimes recorded as presence areas (i.e. false presences exist), while range margins are often inaccurate and, particularly in some poorly surveyed areas, underestimate species distribution (Ficetola et al., 2014; Herkt et al., 2017; Rondinini et al., 2006). On the other hand, cell-presence data sometimes underestimate the true distribution of species, as taxa may remain unrecorded if sampling effort is not exhaustive. For instance, in the study area the known species richness is very low in the least accessible areas, suggesting that the distribution of species in the areas most difficult to sample is underestimated (Ficetola et al., 2013), and this can clearly influence the outcome of analyses. The limited knowledge of species distribution may explain the uncertainty of regionalization in parts of our study area. Phylogenetic analyses require even more data than the non-phylogenetic ones (both distribution and phylogenetic information), and can be particularly sensitive to uncertainties and gaps (Daru et al., 2017). The lack of information for some taxa might explain why, in phylogenetic analyses, it was impossible to assess biogeographical relationships in a number of cells (grey cells in Figure 2(c)).
Methodological differences may explain discrepancies with studies performed on subsets of the study region. For instance, Rueda et al. (2010) observed a strong regionalization of reptiles within Europe (8 clusters), while Europe was rather homogeneous in our analyses (Figure 2). However, our analysis covered a much broader extent and aimed to detect the major subdivisions, while analyses at finer geographical resolutions and over smaller regions can allow the recovery of finer biogeographical structures. Furthermore, the Rueda et al. (2010) study was based on range polygons instead of cell-based maps. Additional studies are required to test whether range polygons and cell-presence data, analysed over the same spatial extent, provide consistent results. Range polygon maps for all the reptile species will be available in the future (Roll et al., 2017) and will provide an excellent opportunity to assess how data features affect the outcome of biogeographical analyses.
Tools for quantitative biogeographical analyses have been developed to improve the objectivity of studies, still the selection of methodological parameters remain subjective, and may strongly influence outcomes. For instance, our endemism analysis did not detect the Iberian Peninsula, which hosts multiple endemic reptiles (Sindaco and Jeremčenko, 2008; Sillero et al., 2014). This is probably due to the fact that in the Iberian Peninsula many endemic reptiles are mountain species occurring parapatrically or allopatrically on different mountain ranges. In fact, the Iberian Peninsula would emerge if less stringent parameters were used for the identification of endemism centres (e.g. sets with endemicity scores ≥ 2; results not shown). In this study, stringent parameters were used because the aim was to detect the areas with the highest endemism levels over a broad region, but studies with different aims (e.g. identification of endemism areas within smaller regions) can obtain non-identical results, even when using the same analytical approaches.
3 Environmental features and biogeographical structure
Our analyses support the hypothesis that present-climate and climatic stability after glaciations together represent the major determinants of biogeographical structure. The uniqueness of reptile communities was highest in cells showing stable climate during the Quaternary, high temperature and seasonal precipitation. These features are characteristic of the semi-arid and Mediterranean climates of the south of the study area. Several analyses have shown that the availability of thermal energy is the major determinant of reptile species richness, and that reptiles can attain very high biodiversity values in arid environments (Ficetola et al., 2013; Powney et al., 2010; Rodriguez et al., 2005; Whittaker et al., 2007). Furthermore, after the ice ages reptiles have re-colonized Europe starting from refugia located in the Mediterranean, and this process has resulted in a species-poor fauna in the northern regions. Actually, the reptiles living in northern areas have larger ranges (Rapoport’s rule; Meliadou and Troumbis, 1997), and only a few widespread species (Zootoca vivipara, Lacerta agilis, the Anguis fragilis complex, Coronella austriaca, Natrix natrix and Vipera berus) are present across Northern Europe.
The relationships between endemism and environmental features were partially analogous, with higher endemism in arid climates characterized by seasonal precipitation and limited velocity of climatic change during the last 21,000 years. Several analyses have revealed how the stability of climate after the glaciation is a major determinant of endemism in vertebrates (Jansson, 2003; Rosauer and Jetz, 2015; Sandel et al., 2011), and our results on reptiles confirm these patterns. Islands are generally considered main centres of endemism (e.g. Jansson, 2003; Rosauer and Jetz, 2015), but our models found limited support for the role of insularity, as contiguous land area only showed a weak relationship with endemism (Table 2(c)). This does not mean that insularity is not important for reptile endemism. In fact, the Canary Islands and Corsica plus Sardinia are main areas of endemism (Figure 2(b)). On the other hand, some of the highest rates of endemism were found in continental areas such as the Levant, the Atlas, South-Western Arabia and Eastern Arabia. These have both subtropical climates and heterogeneous landscapes, which likely allowed the persistence of suitable conditions even during the Late Quaternary climatic oscillations. Furthermore, all these areas have a complex orography, which generally reduced the velocity of climate change during the Late Quaternary (Sandel et al., 2011), but also promotes the existence of multiple habitats and microclimates, thus allowing the coexistence of multiple species.
Our quantitative assessment of the biogeographical structure of reptiles within the Western Palearctic revealed several similarities with the patterns observed in other vertebrates, but also identified strong specificities. However, the analyses performed here are not global; therefore, comparisons with global-scale studies are complex. The recent completion of the Global Assessment of Reptile Distributions will soon provide global distribution maps of reptile (Roll et al., 2017), that will allow a more complete understanding of biogeographical patterns.
Supplemental material
Supplemental Material, Appendix_S1 - Biogeographical structure and endemism pattern in reptiles of the Western Palearctic
Supplemental Material, Appendix_S1 for Biogeographical structure and endemism pattern in reptiles of the Western Palearctic by Gentile Francesco Ficetola, Mattia Falaschi, Anna Bonardi, Emilio Padoa-Schioppa, Roberto Sindaco in Progress in Physical Geography: Earth and Environment
Footnotes
Acknowledgements
We thank A. Venchi (Australian Biological Resources Study) and Matt Talluto for linguistic corrections. Two reviewers and B. Yarnal provided insightful comments on previous drafts of the manuscript.
Declaration of Conflicting Interests
The author(s) declared no potential conflicts of interest with respect to the research, authorship, and/or publication of this article.
Funding
The author(s) disclosed receipt of the following financial support for the research, authorship, and/or publication of this article: G Ficetola was partially funded by a scholarship of the University of Milano-Bicocca, and belongs to the Laboratoire d’Écologie Alpine, which is part of Labex OSUG@2020 (ANR10 LABX56). The other authors received no financial support for the research, authorship, and/or publication of this article.
Supplemental material
Supplementary material for this article is available online.
References
Supplementary Material
Please find the following supplemental material available below.
For Open Access articles published under a Creative Commons License, all supplemental material carries the same license as the article it is associated with.
For non-Open Access articles published, all supplemental material carries a non-exclusive license, and permission requests for re-use of supplemental material or any part of supplemental material shall be sent directly to the copyright owner as specified in the copyright notice associated with the article.