
Abstract
This review and analysis illustrates that the spatial distribution and temporal clustering of tornadoes in the United States are changing. Tornado activity is increasing throughout the Southeast and in the southern portion of the Midwest and is decreasing throughout the southern and northwestern portions of the Great Plains and in the northern Midwest. This eastward shift is seen in tornado density maps, regional and gridded trends, and in an eastward shift of the mean center of tornadoes at the annual scale and in summer. The mean centers of tornado activity in other seasons are rather insensitive to these changes. Tornadoes are also clustering on fewer days in the year, and days with few tornadoes are becoming less common whereas days with many tornadoes are becoming more common. These concurrent and opposing trends are subsequently altering the frequency distribution of tornado days. The seasonality of these big tornado days also appears to be changing, as their increase in frequency is greatest in the fall and winter. Lastly, the increasing frequency of these big tornado days, which are most common in the Southeast and southern Midwest, contributes to the documented eastward shift in tornado activity.
Keywords
I Introduction
The tornado-hazard landscape in the United States (U.S.) is a function of the societal exposure to and the risk of tornadoes. Changes to exposure through economic growth and development (e.g., the expanding bull’s eye effect) and population dynamics have been, and will continue, changing the tornado-hazard landscape (Ashley and Strader, 2016; Ashley et al., 2014; Rosencrants and Ashley, 2015; Strader et al., 2017a, 2017b). Tornado risk (i.e., the frequency, intensity, and path characteristics of tornadoes) is another component of the potential for losses (Coleman and Dixon, 2014; Elsner et al., 2018; Fricker et al., 2017), and changes to tornado risk will likewise change the tornado-hazard landscape.
In this review and analysis, we focus on two possible changes to the climatology and risk of tornadoes in the U.S.—changes to their spatial distribution (e.g., Agee et al., 2016; Ashley and Strader, 2016; Farney and Dixon, 2014; Gensini and Brooks, 2018; Moore, 2017, 2018a) and temporal clustering (e.g., Brooks et al., 2014; Elsner et al., 2015; Moore, 2017; Tippett and Cohen, 2016; Tippett et al., 2016). Our objectives are to (1) synthesize these two bodies of literature, (2) present modified versions of analyses from the studies in these bodies, and (3) present new complementary analyses. In doing so, we show that there is spatial variability in the tornado record, but there is also evidence of a decrease in activity in portions of the Great Plains (GP) and Upper Midwest (UMW) and an increase in activity in portions of the Southeast (SE) and Lower Midwest (LMW). These changes are seen in tornado density estimates, regional and gridded tornado trends, and an eastward shift in the mean center of tornado activity at the annual scale and in summer. We also show that days with many tornadoes are becoming more common over time, which is evident in series of the annual count of days with different numbers of tornadoes. Lastly, we illustrate that these two changes are related. We do so by demonstrating that the tornadoes that occur on days with many tornadoes tend to concentrate in the SE and LMW, and that removal of these tornadoes also removes the increasing trend in these regions.
1 Spatial distribution of tornadoes in the United States
The documented spatial distribution of tornadoes in the U.S. has evolved over time. Early studies (e.g., Thom, 1963; Wolford, 1960) highlighted the traditionally depicted “Tornado Alley” in the GP, consisting of northern Texas, Oklahoma, and Kansas, as the most tornado prone area. Locations farther east were noted as areas of heightened tornado activity by subsequent studies in which more observations were analyzed. Kelly et al. (1978), for example, illustrated maxima of tornado activity between the 97° and 98° meridians, but also identified small pockets of increased activity along the Gulf Coast. As tornado observations continued to amass, studies continued to show heightened activity outside “Tornado Alley.” Schaefer et al. (1986) assessed annual tornado hazard zones and found a “V”-shaped pattern of heightened activity in the GP, SE, and Midwest (MW). Concannon et al. (2000) reported an “L”-shaped pattern extending from southern Mississippi, west through the GP then northeastward into Iowa. Brooks et al. (2003) proceeded to find a “C”-shaped distribution of maxima across the MW, GP, and SE regions. Dixon et al. (2011) also showed maxima in the MW, GP, and SE, but with denser activity throughout the SE that created a circular pattern around Missouri. In general, the most recent studies illustrate that the most tornado prone region lies between the Rocky Mountains and Appalachian Mountains, with smaller maxima within this region dependent on the period and metric of tornado activity being considered (Coleman and Dixon, 2014; Dixon et al., 2014; Smith et al., 2012).
The aforementioned change, whereby the spatial distribution of tornadoes dispersed over time between the Rocky Mountains and Appalachian Mountains, is partially driven by increased detection and recording of tornadoes over time. In addition to this dispersion, recent studies provide evidence of a possible eastward shift of tornado activity in the U.S. Two of these studies, Farney and Dixon (2014) and Agee et al. (2016), did so by showing changes between two periods in the gridded annual average number of tornado days and gridded tornado (and tornado day) counts, respectively. Farney and Dixon (2014) noted increased tornado activity in the period 1990–2011 across parts of the Eastern Seaboard, in the SE, and in the southern and western parts of the MW when compared to the period 1960–1989. Agee et al. (2016) similarly noted a decrease in the number of tornadoes and tornado days in portions of Texas and Oklahoma and a concurrent increase in portions of Alabama and Tennessee between the periods 1954–1983 and 1984–2013.
Other studies provide evidence of a possible eastward shift of tornado activity by documenting trends in regional and gridded tornado counts. Ashley and Strader (2016), for example, showed time series of the annual count of (E)F1+ tornadoes in the GP, MW, and SE. Their series show decreasing tendencies in the GP and an increasing tendency in the SE. In addition to showing regional trends in annual counts similar to Ashley and Strader (2016), Moore (2018a) reported that the increase seen in the SE is driven mostly by increases in spring and fall tornado activity, and the decrease in the southern GP is driven mostly by decreases in summer and fall tornado activity. Gensini and Brooks (2018) showed trends consistent with those reported by Ashley and Strader (2016) and Moore (2018a) at the annual scale, but were able to capture more spatial variability by reporting trends in gridded counts. They showed that the increasing trends are present across much of the SE and in the southern MW, namely in portions of Mississippi, Alabama, Arkansas, Tennessee, Kentucky, Missouri, and Illinois. They also showed that the decreasing trends are mostly evident in the southern GP (northern Texas and northeastern Colorado), northern GP (western Nebraska), and northern MW (near the Great Lakes).
Lastly, several studies have tracked changes over time in the mean center of tornado and severe thunderstorm activity. Early studies by Fujita et al. (1975) and Schaefer et al. (1986) identified the mean center of tornado activity and tracked the centroids over time. Fujita et al. (1975) noted variability in the mean longitude over time. A later study by Boruff et al. (2003) documented the mean center of annual tornado activity over a longer period (1950–1999). They noted slight southward and eastward shifts in the mean latitude and longitude over the record. Moore (2017) recently provided an updated look at changes in the mean centers of tornado activity by evaluating data between 1975 and 2014, but provided a coarse representation of changes because only decadal mean centers were provided. Gensini and Ashley (2011) developed a plot of the mean center of severe weather environments between 1980 and 2009 that highlights inter-annual variability but also shows a slight eastward migration.
2 Tornado days in the United States
Most days have no tornadoes, and the days with one or more tornadoes (i.e., a tornado day) tend to have only a few (Elsner et al., 2014; Verbout et al., 2006). Elsner et al. (2014), for example, reported that at least one (E)F1+ tornado occurred on only 29% of the days between 1994 and 2012. They also show that the frequency distribution of tornado-day size (i.e., the number of tornadoes per tornado day) is well described by a power law relationship, whereby the log10 of frequency decreases linearly as the log10 of tornado-day size increases. Several recent studies, however, provide evidence that this relationship might be changing. Brooks et al. (2014) showed that the number of days per year with at least one (E)F1+ tornado decreased between 1954 and 2013 whereas the number of days per year with more than 30 increased. Elsner et al. (2015) grouped tornado days into multiple overlapping groups and reported that the number of days per year with 4+ (E)F1+ tornadoes trended downward between 1954 and 2013 and the number of days per year with 8+, 16+, and 32+ (E)F1+ tornadoes trended upward. By looking at mutually exclusive groups, Moore (2017) illustrated that trends are present near the tails of the tornado-day size distribution, but not in the middle. The number of days per year with 1–9 (E)F1+ tornadoes decreased between 1979 and 2015 and the number of days per year with 30+ increased, but there were no notable changes in the number of days per year with 10–20 and 20–29 (E)F1+ tornadoes.
Other recent studies have reported trends consistent with those described above, but in the frequency, mean size, and variability of tornado outbreaks (six or more (E)F1+ tornadoes with no more than six hours between subsequent tornadoes) rather than the number of tornadoes per day. Fuhrmann et al. (2014), for example, reported that the number of (E)F1+ tornadoes occurring in outbreaks increased by approximately 15% between 1973 and 2010 whereas the number occurring in non-outbreaks decreased by approximately 20%. Tippett and Cohen (2016) showed that the percentage of tornadoes in a given year occurring in outbreaks and the mean and variance of the number of tornadoes occurring in outbreaks increased between 1954 and 2014. Tippett et al. (2016) reported that the frequency of outbreaks with many tornadoes increased at a rate faster than the frequency of outbreaks with fewer tornadoes over the period 1954–2015.
II Data and methods
1 Tornado data
The Storm Prediction Center (SPC) provides tornado data that currently span the period 1950–2017 in their Severe Weather Database Files (SPC, 2018). For most analyses, this database was subset to include tornadoes rated 1 or higher by the Fujita (F-scale; prior to January 2007) or Enhanced-Fujita (EF-scale; since January 2007) damage rating scales (hereafter referred to collectively as (E)F) that occurred in the contiguous U.S. over the period 1 December 1953–31 December 2017; December 1953 is included to derive the winter tornado count for 1954. The beginning of this period coincides with the first year of near-real-time tornado data collection (Kunkel et al., 2013) and eliminates the notable undercount of tornadoes in the early 1950s (Agee and Childs, 2014). We excluded (E)F0 tornadoes from most analyses because they introduce an increasing trend (Figure 1(a)) that mostly reflects increased detection and recording of the weakest (E)F0 tornadoes over time (Verbout et al., 2006). The (E)F1+ record does not include a long-term increasing trend (Figure 1(b)) and has been commonly used to evaluate spatial and temporal variability and trends (e.g., Agee et al., 2016; Brooks et al., 2014; Elsner et al., 2015; Guo et al., 2016; Moore, 2017, 2018a, 2018b; Tippett and Cohen, 2016; Tippett et al., 2016; Trapp and Hoogewind, 2018). We also use the (E)F0+ record to evaluate the influence of excluding (E)F0 tornadoes from some analyses.

Annual counts of (E)0+ (a) and (E)F1+ (b) tornadoes in the contiguous United States between 1954 and 2017. Black lines represent local polynomial regression curves.
2 Methods of documenting spatial shifts in tornado activity over time
Multiple methods have yielded evidence of a possible eastward shift of tornado activity in the U.S. These methods include changes in the density of tornadoes between different periods (Agee et al., 2016; Farney and Dixon, 2014), temporal trend analysis of regional and gridded tornado counts (Ashley and Strader, 2016; Gensini and Brooks, 2018; Moore, 2018a), and shifts in the centroids of tornado touchdowns (Moore, 2017). We use modified versions of these methods to illustrate and discuss possible changes to the spatial distribution of tornadoes in the U.S.
Tornado density
Gridded metrics (e.g., counts and means) and kernel density estimation have been used to document and analyze the spatial distribution of tornadoes (e.g., Agee et al., 2016; Brooks et al., 2003; Coleman and Dixon, 2014; Deng et al., 2016; Dixon et al., 2011, 2014; Farney and Dixon, 2014; Smith et al., 2012). When repeated over different periods, as done by Farney and Dixon (2014) and Agee et al. (2016), these density maps are able to highlight spatiotemporal variability in tornado activity. These previous studies captured changes in the spatial distribution of tornado activity between two periods. We aim to complement these analyses by showing changes between more periods. Specifically, we estimate the density of (E)F1+ tornado initiation points for each decade between 1958 and 2017 with the Kernel Density tool in the ESRI ArcMap software (ESRI, 2017). This tool employs the adjusted Epanechnikov quadratic probability density function as the distance decay function (Deng et al., 2016). Various output cell sizes and bandwidths (or search radii) have been used to document the spatial distribution of tornadoes (e.g., Brooks et al., 2003; Deng et al., 2016; Dixon et al., 2014). We chose an output cell size of 20 km2 and a bandwidth of 150 km, which has been recommended as an efficient bandwidth for tornadoes in most seasons (Dixon et al., 2014).
Regional trends
Ashley and Strader (2016) and Moore (2018a) provided evidence of a possible eastward shift in tornado activity by reporting differing temporal trends for multiple regions. Gensini and Brooks (2018) illustrated regional changes by considered trends in gridded tornado counts. Relatively broad, regional changes in tornado counts across the U.S. (particularly from the central to the eastern portion), rather than smaller-scale variability, are of interest in this study. We, therefore, take an approach similar to Ashley and Strader (2016) and Moore (2018a) by evaluating temporal trends in the GP, the UMW, and the SE & LMW (regions are shown in Figure 5(a)). The southern, northern, western, and eastern boundaries of the GP region are ≥30°N, <42°N, ≤107°W, and > 95°W. The boundaries of the UMW region are ≥42°N, ≤48°N, ≤97°W, and ≥81°W. Lastly, the boundaries of the SE & LMW region are ≥30°N, <42°N, ≤95°W, and ≥85°W. These regions are similar to those considered by Ashley and Strader (2016) and Moore (2018b), but they are refined based on the gridded analysis by Gensini and Brooks (2018). For example, the southern portion of the MW is combined with the SE to form the SE & LMW region because Gensini and Brooks (2018) provided evidence of an increasing trend in annual tornado counts that dominates most of this area. Similarly, the northern portion of the MW is isolated in the UMW region because Gensini and Brooks (2018) provided evidence of a decreasing trend that dominates most of this area.
We assigned tornadoes to the GP, UMW, and SE & LMW regions if their touchdown coordinates fell within the aforementioned boundaries, and then we computed annual and seasonal counts of (E)F1+ tornadoes within each region. We also considered (E)F0+ counts in each region to explore the effect of excluding (E)F0 tornadoes on the analysis. To evaluate trends in the annual and seasonal series, we used the non-parametric Mann–Kendall trend test (Kendall, 1970; Mann, 1945) and Theil–Sen slope estimator (Sen, 1968; Theil, 1950). These procedures are appropriate because they are insensitive to outliers, which are common in positively skewed distributions such as annual and seasonal tornado counts.
Center of tornado activity
The center of tornado activity in the U.S. can be represented by mean centers (mean latitude and longitude) of tornado touchdowns over a given period. A few studies have tracked changes in the annual mean center of severe weather environments and tornadoes (Boruff et al., 2003; Fujita et al., 1975; Gensini and Ashley, 2011; Moore, 2017; Schaefer et al., 1986). We complement these previous efforts by using the Mann–Kendall and Theil–Sen procedures to evaluate trends in the series of seasonal (in addition to annual) mean latitude and longitude of (E)F1+ tornadoes between 1954 and 2017. The median latitude and longitude could also be used to represent the center of tornado activity. Figure 2 shows that the mean and median latitude and longitude are strongly and significantly correlated. All probability values (p-values) are less than 0.0001 and the weakest correlation, in fall, has a moderate-to-strong Spearman’s rho correlation coefficient of 0.84. We, nonetheless, explored trends in the median centers also. The trend results for median latitude and longitude are the same as those for mean latitude and longitude, except that median longitude has increased (moved eastward) significantly over time in fall whereas the increase in mean longitude is not significant.
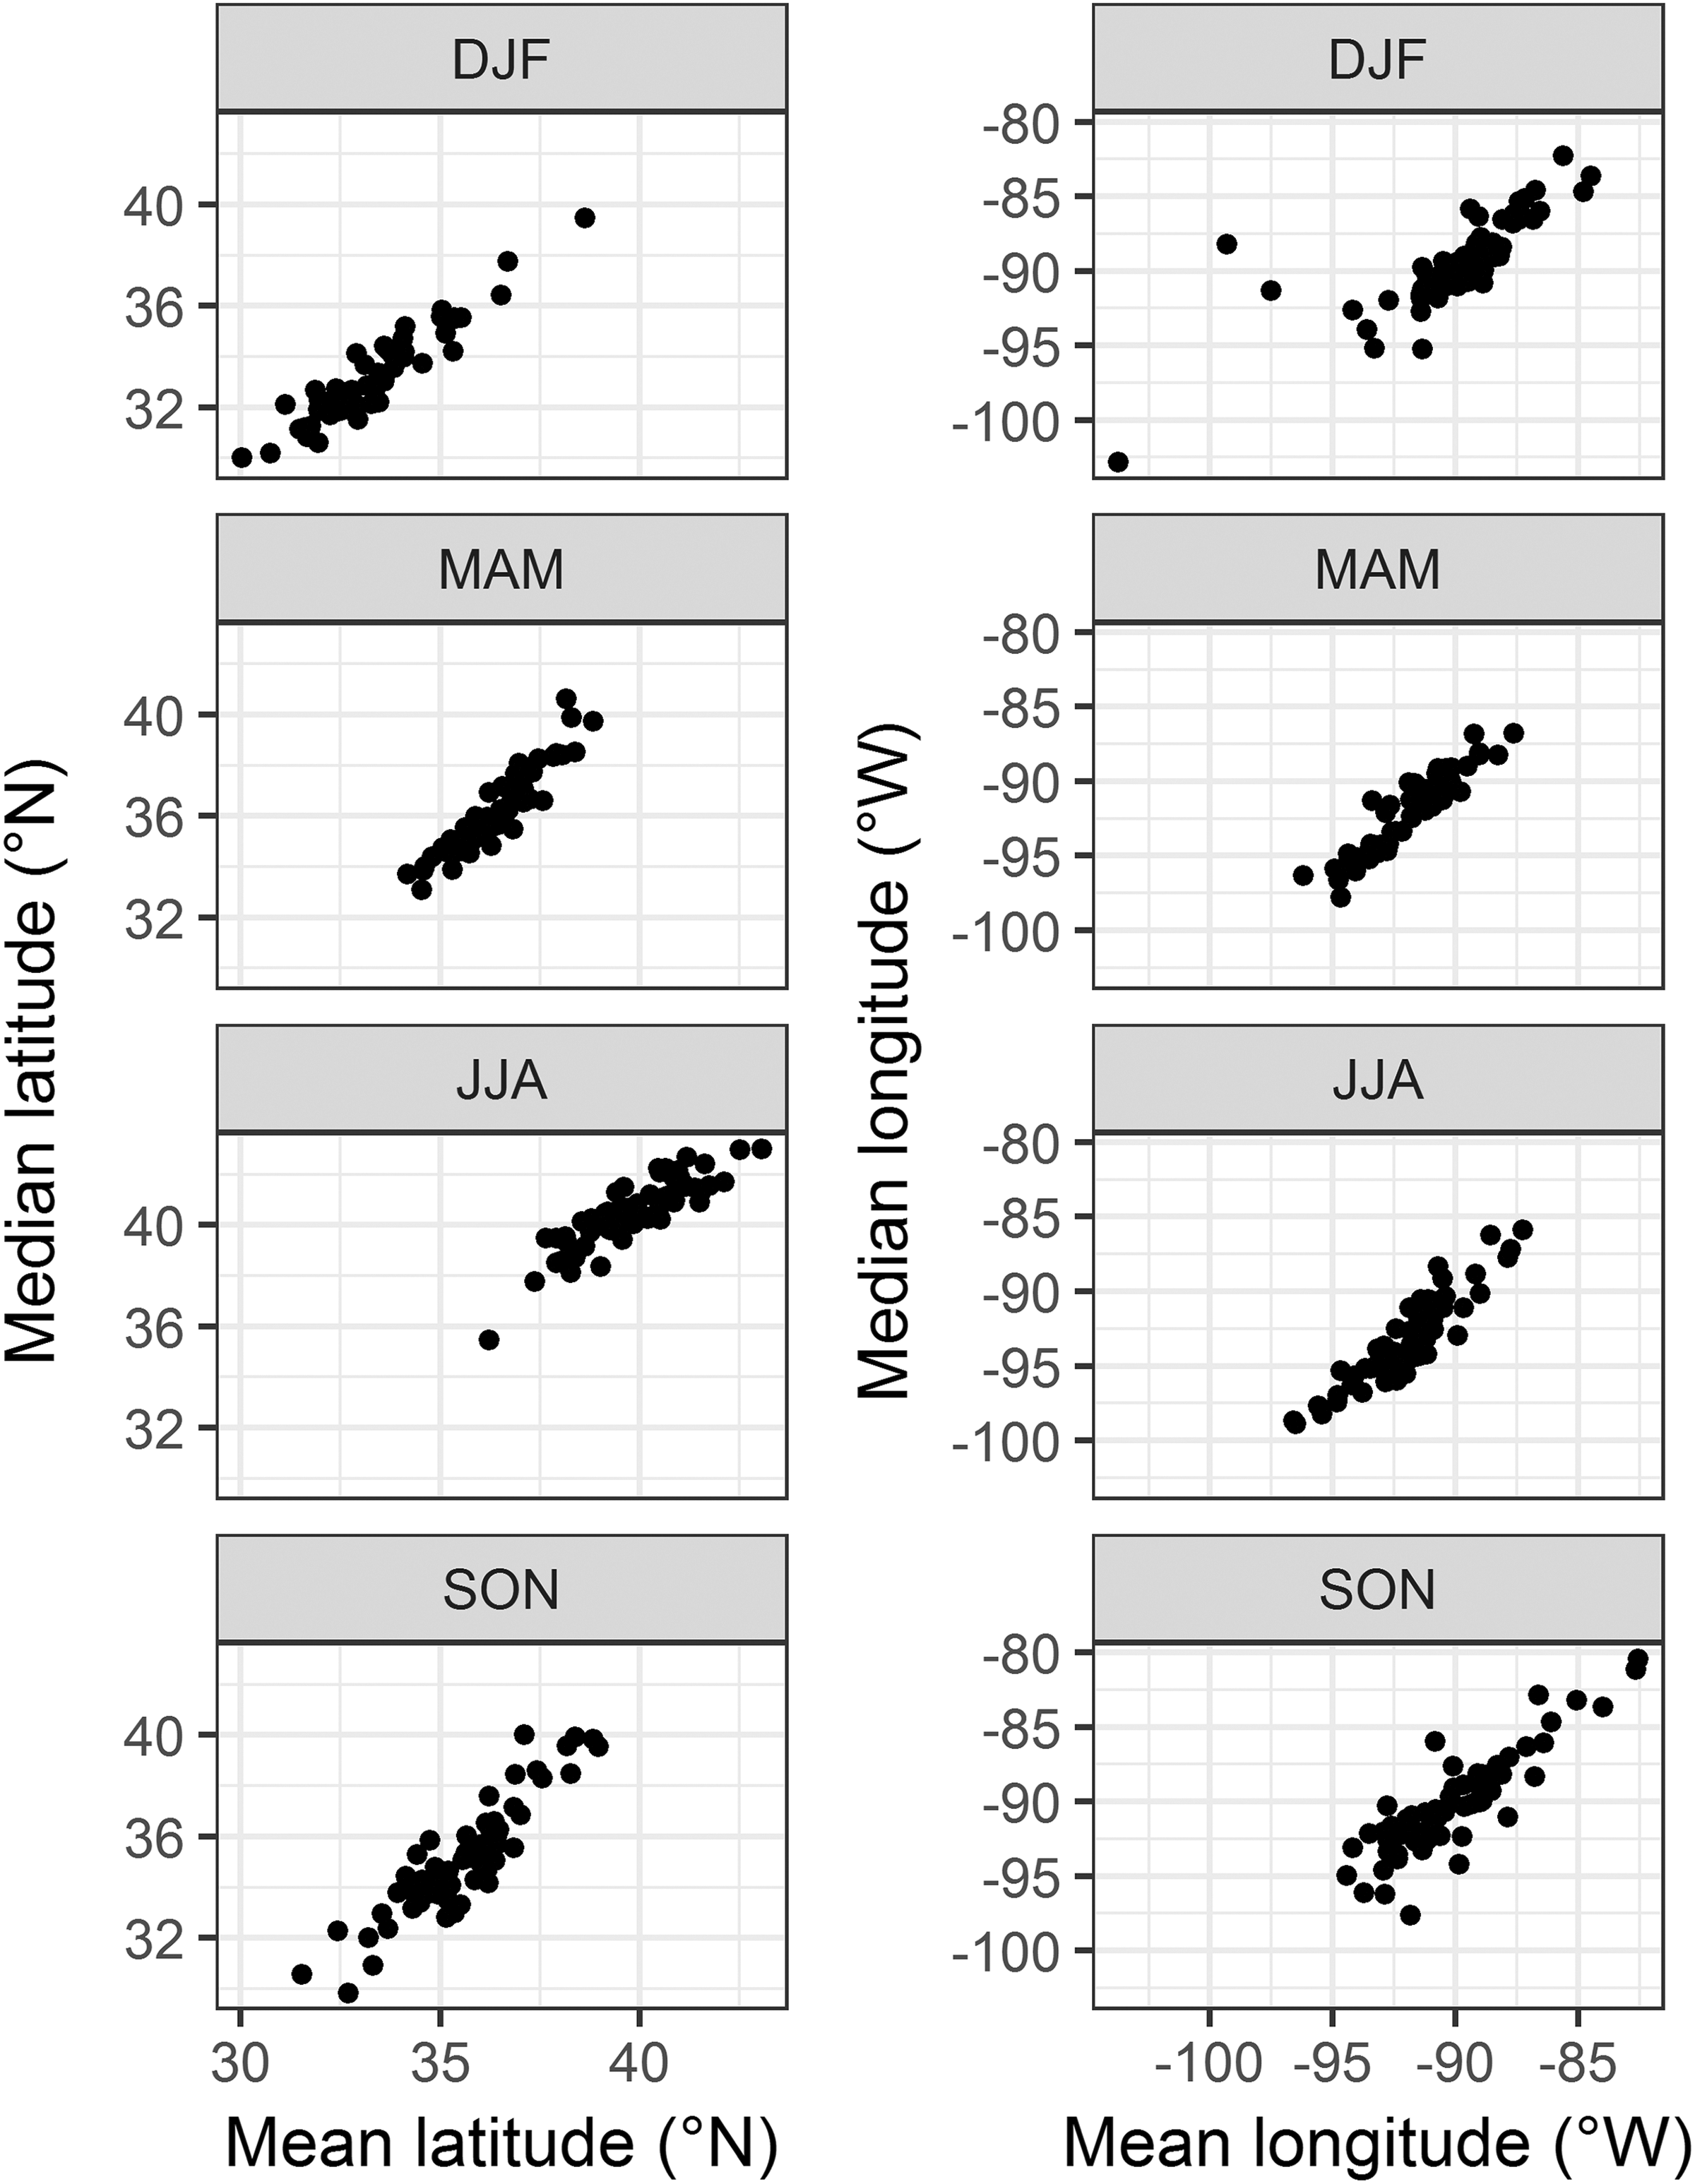
Seasonal mean and median latitude (left) and longitude (right) of (E)F1+ tornadoes in the contiguous United States between 1954 and 2017.
3 Methods of documenting changes in annual counts of tornado day
Tornado days have been grouped in different ways to illustrate that days with few tornadoes are becoming less common and days with many tornadoes are becoming more common. Moore (2017) illustrated that mutually exclusive groups are preferable because they capture the changes that are occurring in the tails of the frequency distribution. We, therefore, present trends in mutually exclusive groups of tornado days (0000–2359 UTC). In particular, we bin tornado days into groups of 1–9, 10–19, 20–29, and 30+ (E)F1+ tornadoes similar to Moore (2017), but extend the record to 1954. We use the Mann–Kendall trend test and Theil–Sen slope estimator to assess the trends in annual frequency of tornado days. In addition to verifying these trends over a longer record, we explore the effects of the differing trends on the power law relationship between frequency and tornado-day size. We also explore possible changes to the seasonality of days with many tornadoes.
4 Accounting for serial correlation and the multiple-testing problem
The Mann–Kendall trend test assumes that data are not serially correlated. Pre-whitening procedures are sometimes performed to remove serial correlation. These procedures are intended to reduce the likelihood of committing a Type I error (i.e., falsely rejecting the null hypothesis of no trend), but they can also lead to the acceptance of the null hypothesis when a trend exists. Furthermore, they are not necessary for relatively long series with relatively large slopes (e.g., ≥50 years with a slope ≥0.01) (Bayazit and Önöz, 2007). We checked for lag-1 correlation in all series with the Spearman’s rho test. Several series were serially correlated at the 0.05 level of significance (α), but they were sufficiently long with large slope coefficients, so the Mann–Kendall test and Theil–Sen slope estimator were applied to the original series rather than the pre-whitened ones.
We performed numerous trend tests. The p-value of each of these tests could be compared against a predetermined α, but this would increase the family-wise error rate of the sets of tests (i.e., the probability of committing at least one Type I error). In an attempt to control the family-wise error rate, we treated our tests as seven sets and used the Holm–Bonferroni (Holm, 1979) procedure to adjust the test-wise α of each test within the sets. Accordingly, the p-value of each test is compared against an adjusted α (αadj) that is determined with αfw/(n – r + 1), where αfw is the family-wise error rate for the set (0.05 for each set), n is the number of tests performed, and r is the rank of the test in its set when sorted ascendingly by p-value. The test sets are: (1) two tests on annual mean latitude and longitude of tornado touchdowns; (2) eight tests on seasonal mean latitude and longitude of tornado touchdowns; (3) three tests on regional annual tornado counts (between 1954 and 2017); (4) 12 tests on regional seasonal tornado counts; (5) three tests on annual tornado-day counts; (6) three tests on regional annual tornado counts with the tornadoes that occurred on days with many tornado removed; (7) five tests on regional annual tornado counts (between 1995 and 2017).
III Results
1 Shifts in the spatial distribution of tornado activity over time
Tornado density
The expected counts of tornadoes shown in Figure 3 capture the evolution of the spatial distribution of tornadoes in the U.S. In the earliest decade, 1958–1967, the greatest activity was concentrated in the GP (Figure 3(y)). Areas of higher activity spread eastward across the following decades (Figure 3(z)–(ad)). In the most recent two decades, 1998–2007 and 2008–2017, the most tornado active areas are generally spread between the Rocky and Appalachian Mountains (Figure 3(ac)–(ad)). Figure 4 highlights the areas of increase and decrease across the decades between 1958 and 2017. West-east variability is noticeable between some decades. For example, increased (decreased) activity was seen across portions of the SE (GP) region between the first two decades (Figure 4(u)) before declining (increasing) again between the second and third decade (Figure 4(v)). West-east variability is not as apparent across the remaining decades (Figure 4(w)–(y)). Rather, an increase in activity becomes more noticeable across portions of the SE & LMW, namely in Louisiana, Mississippi, Alabama, and northward towards Indiana. Areas of decreased activity are most noticeable in portions of the GP during the most recent decades (Figure 4(x), (y)).
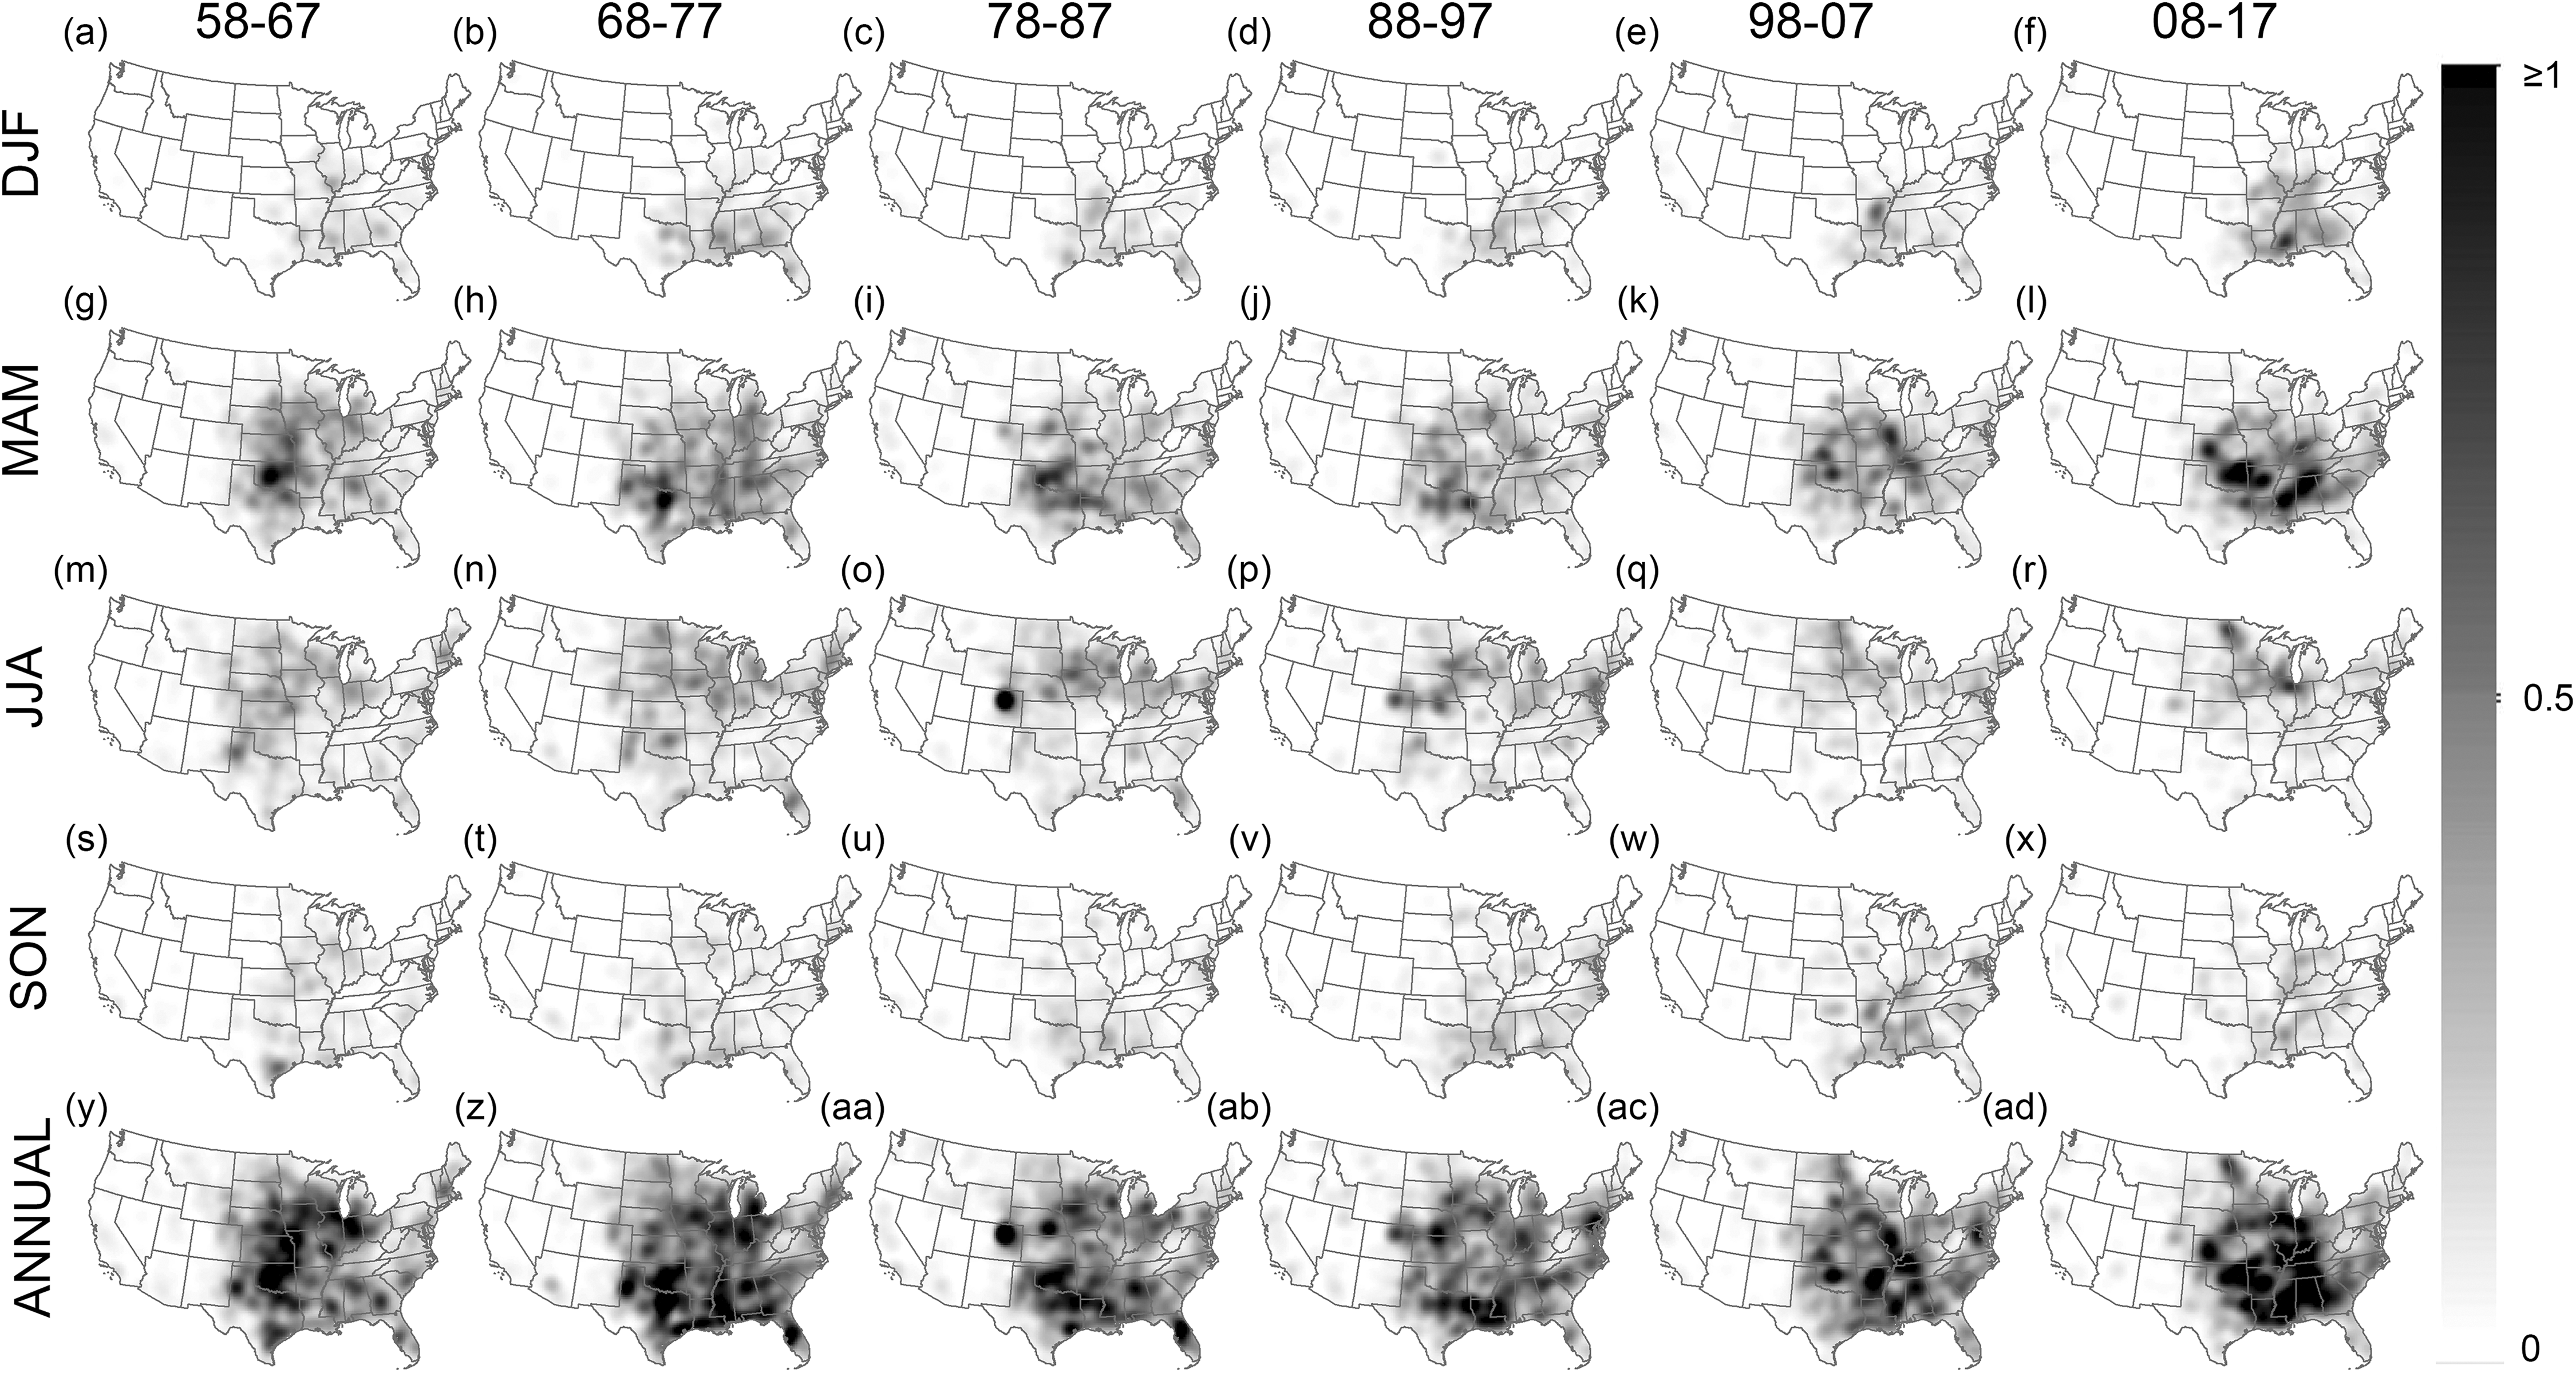
Kernel density (expected counts) of seasonal and annual tornado initiation points for decades between 1958 and 2017. Note: DJF = winter, MAM = spring, JJA = summer, and SON = fall.
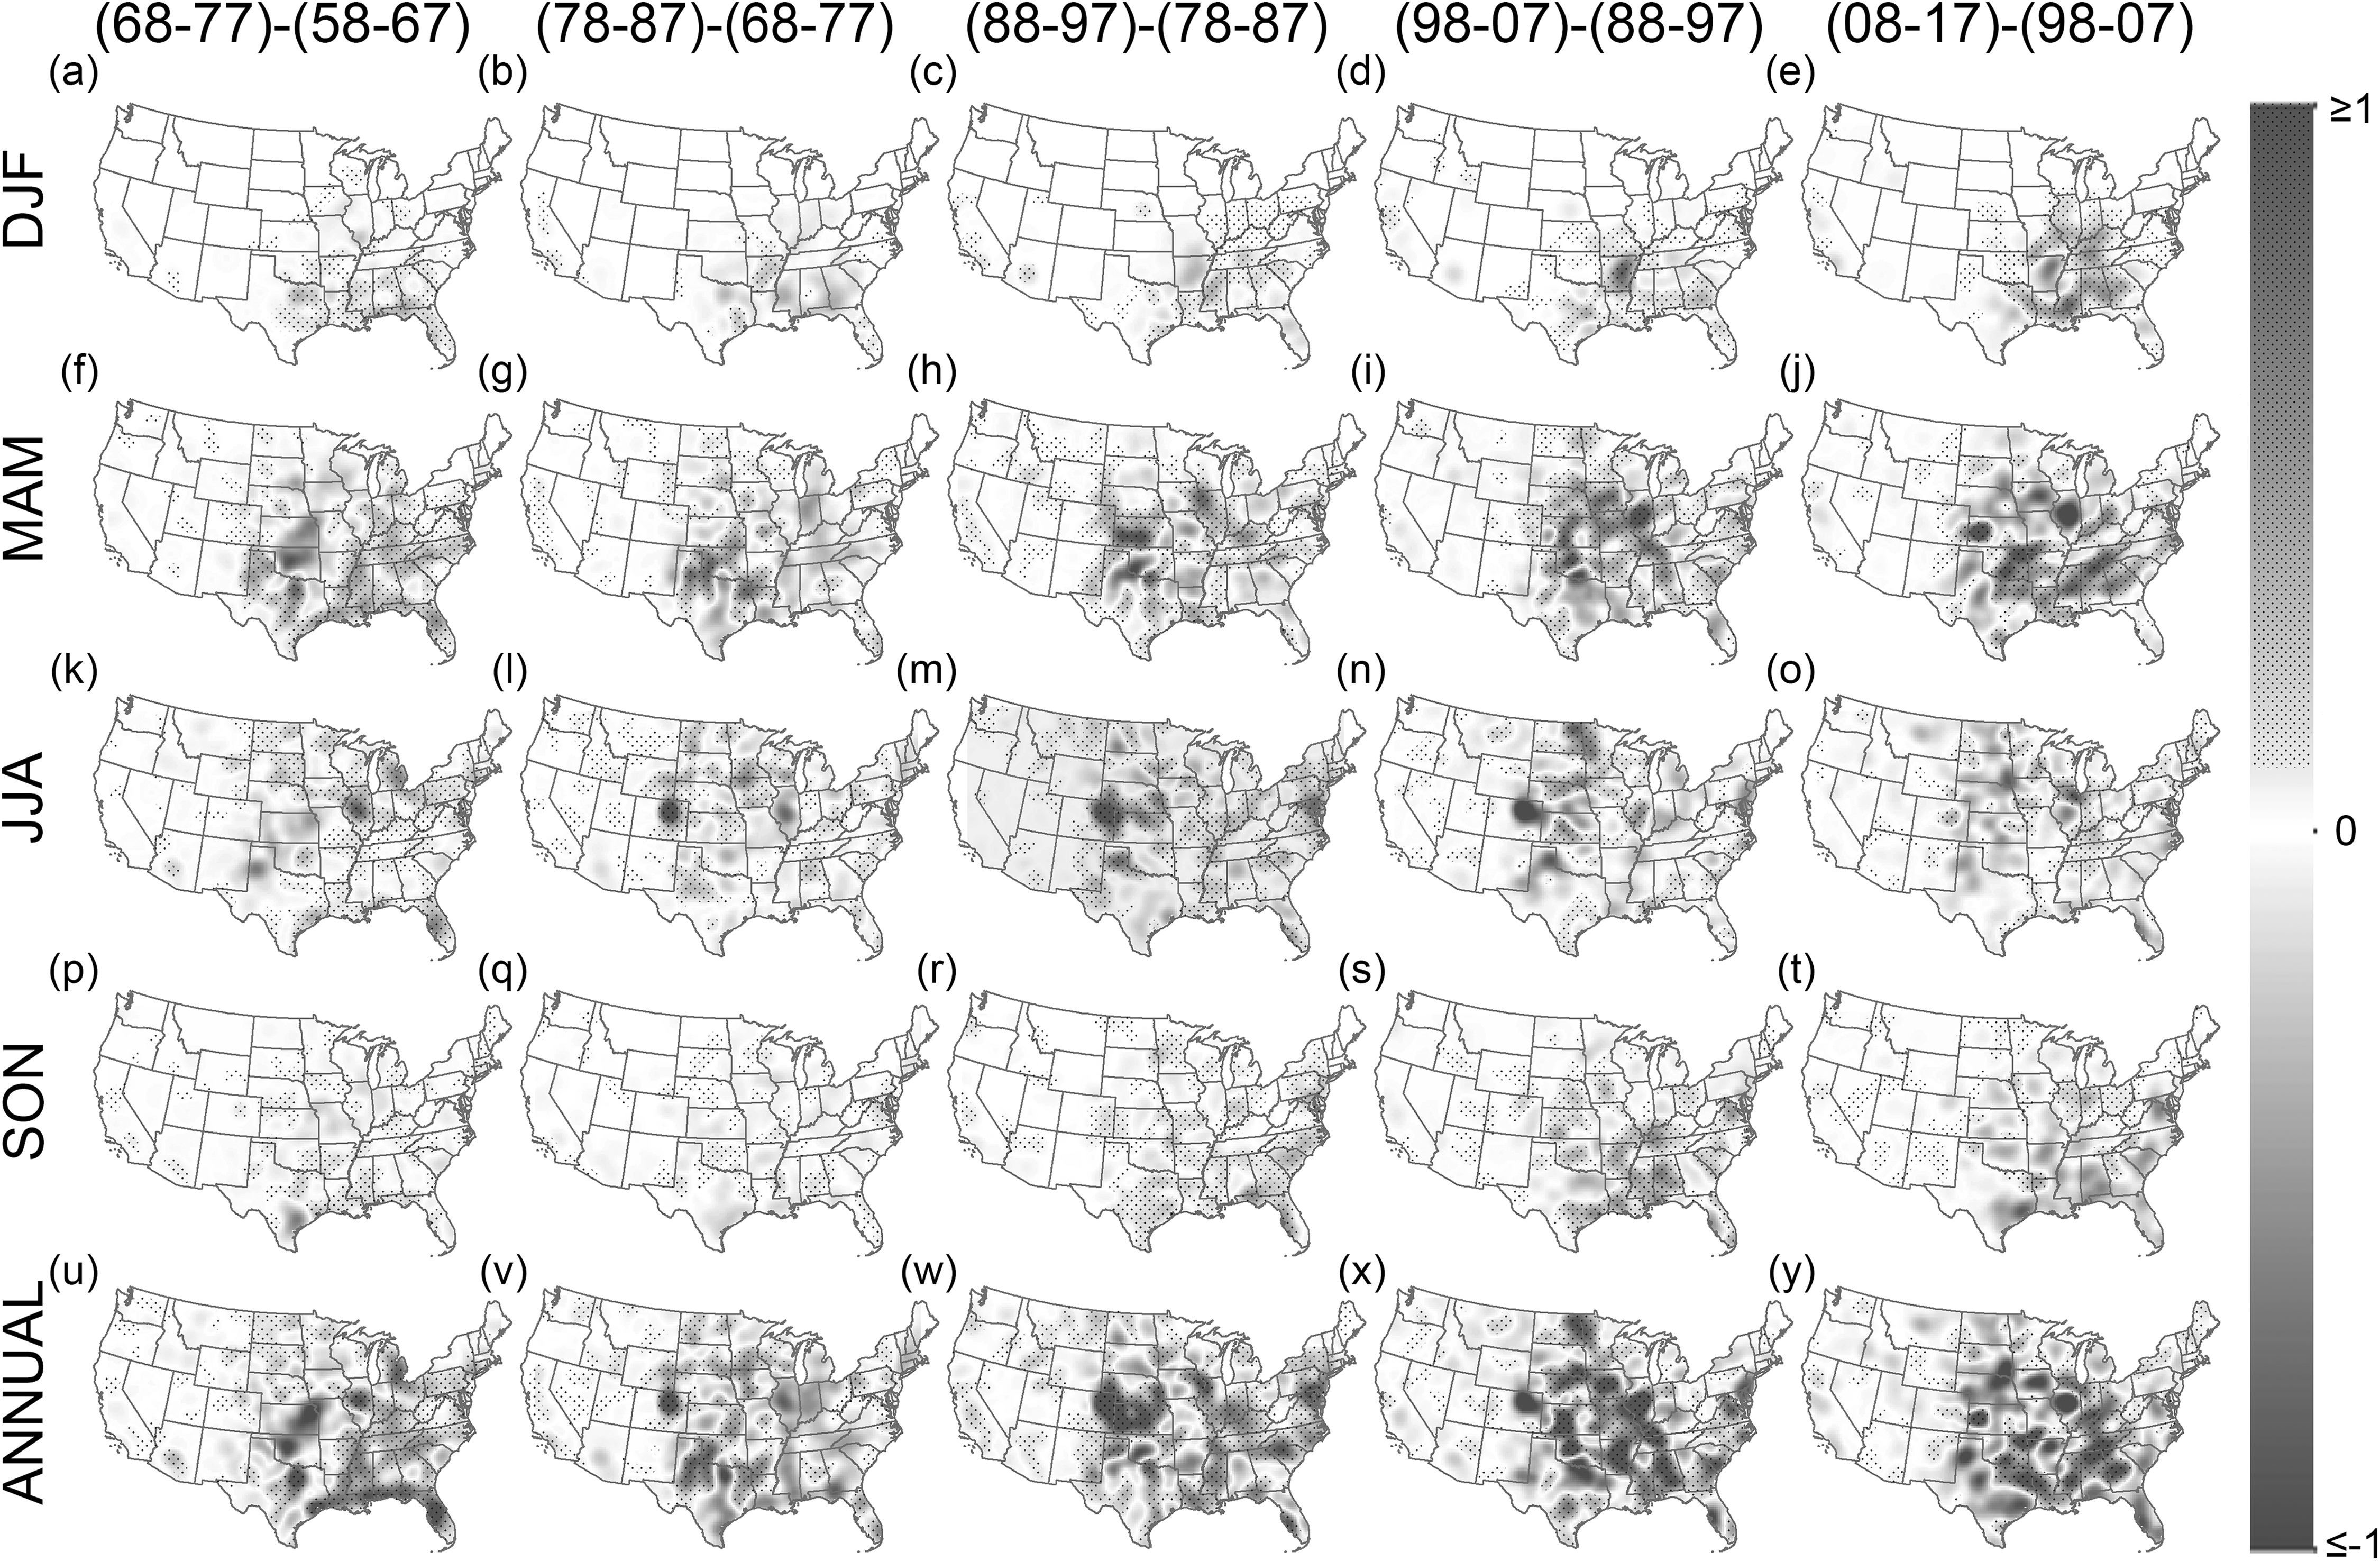
Changes in Kernel density (expected counts) of seasonal and annual decadal tornado activity (e.g., panel (a) represents the change between the decade 1968–1977 and the decade 1958–1967). Note: DJF = winter, MAM = spring, JJA = summer, and SON = fall.
Figure 3(a)–(x) highlights the seasons that contribute most to some of the changes seen at the annual scale. Increased tornado activity in spring (MAM) and summer (JJA) have contributed most to the increases seen in the GP and MW (Figure 3(g)–(r)). Tornado activity in MAM, winter (DJF) and fall (SON) has contributed to the increases seen in the SE, particularly in the two most recent decades (Figure 3(e)–(f), (k)–(l), (w)–(x)). These areas of increased tornado activity are highlighted in in Figure 4(a)–(t).
Regional trends
Boundaries of the UMW, GP, and SE & LMW regions are shown in Figure 5 along with series of the annual count of (E)F1+ tornadoes. There are differing long-term trends in the regions (Figure 5(b)) despite the lack of a long-term trend in the annual count of (E)F1+ tornadoes in the contiguous U.S. (Figure 1(b)). The number of tornadoes in the GP region decreased at a rate of 1.3 tornadoes per year between 1954 and 2017 whereas the number occurring in the SE & LMW region increased at a rate of 1.0 tornado per year (Table 1). Both of these trends are statistically significant. The number of tornadoes per year also decreased over the period of record in the UMW, although the trend is not significant. The decreasing trend in the UMW becomes significant, however, over the 1964–2017 period when the sharp increase seen in the early record (e.g., 1954–1963) is removed (see sub notes of Table 1).
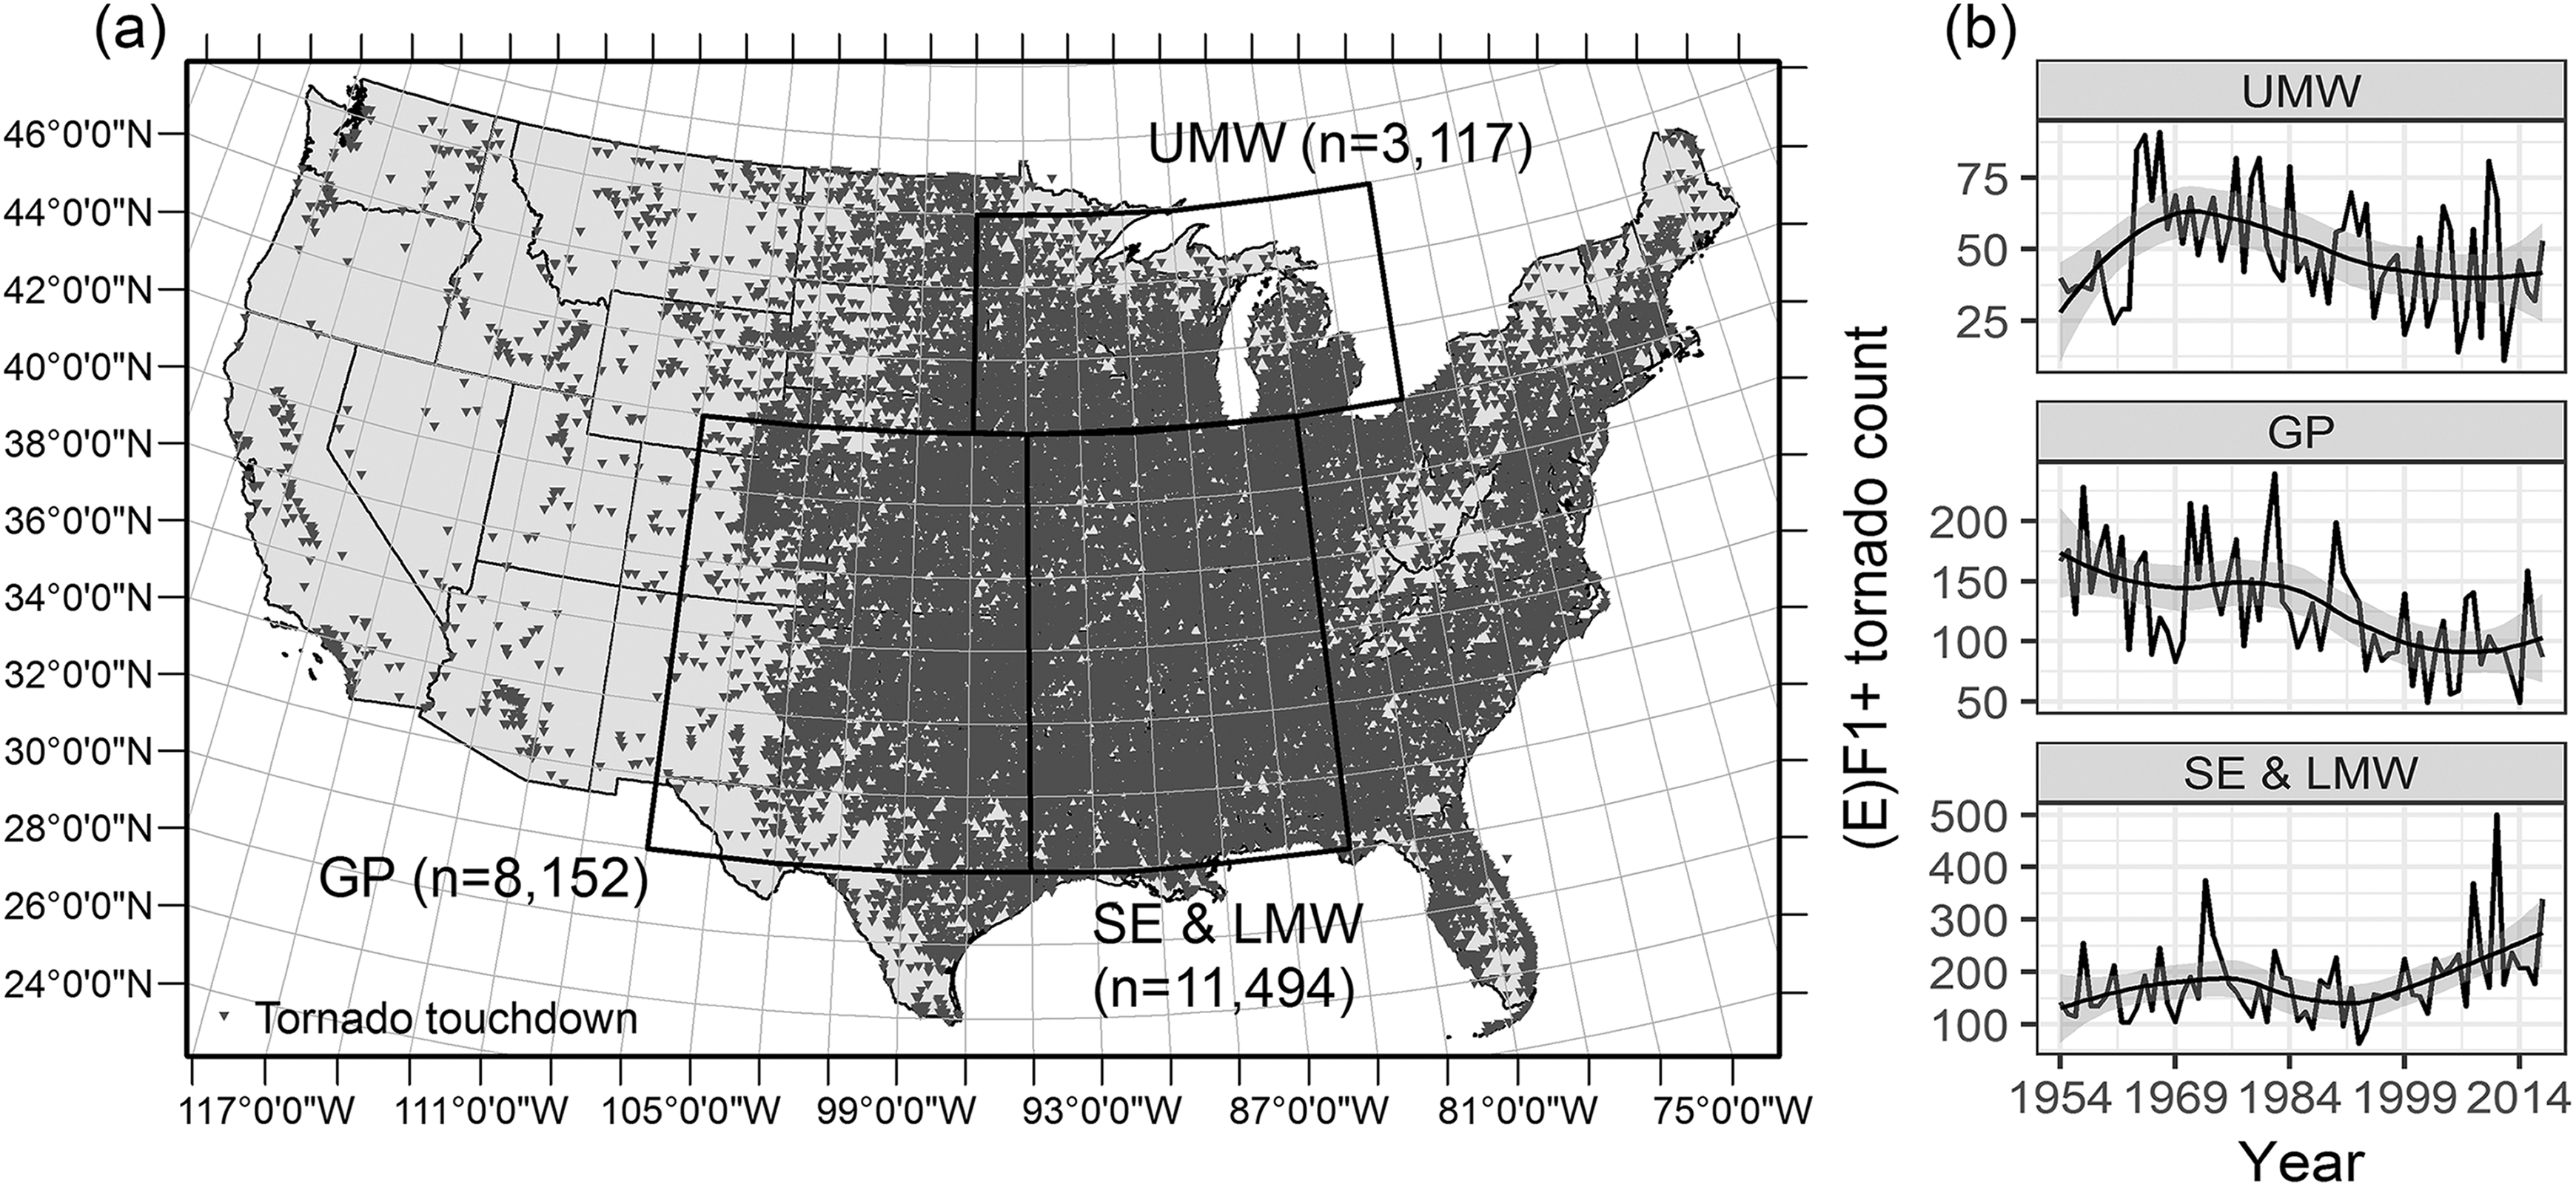
Borders of the Upper Midwest (UMW), Great Plains (GP), and Southeast and Lower Midwest (SE & LMW) regions (a) and annual counts of (E)F1+ tornadoes within each region between 1954 and 2017 (b). The black lines in (b) represent local polynomial regression curves.
Trends in annual and seasonal counts of (E)F1+ tornadoes over the period 1954–2017 in the Upper Midwest (UMW), Great Plains (GP), and Southeast and Lower Midwest (SE & LMW).

S = Mann–Kendall trend statistic; β = Theil–Sen slope estimator; p = p-value; αadj = critical alpha according to the Holm–Bonferroni correction.
*Statistically significant.
a1964–2017 trend: S = −531; β = −0.7; p = 7.60e-5.
The concurrent and opposite trends in the GP and SE & LMW have led to changes in the proportion of annual tornadoes occurring in each region (Figure 6). Approximately 20–40% of annual E(F)1+ tornadoes occurred in both regions early in the record. In the late 1980s–early 1990s, however, the series begin to diverge, with the proportion occurring in the SE & LMW increasing and the proportion occurring in the GP decreasing. The average proportion of annual E(F)1+ tornadoes occurring in the SE & LMW was 45% between 2000 and 2017 whereas an average of only 20% occurred in the GP. A similar change is seen with (E)F0+ tornadoes (not shown). The percentage of (E)F0+ tornadoes in the GP in the early and late parts of the record decreased from 33% to 27% whereas the percentage in the SE & LMW increased from 28% to 34%.

Proportion of annual (E)F1+ tornadoes between 1954 and 2017 occurring in the Upper Midwest (UMW), Great Plains (GP), and Southeast and Lower Midwest (SE & LMW).
Trends in seasonal tornado counts are mostly consistent with the trends in annual counts, for each region (Figure 7, Table 1). In the UMW, tornado counts have generally decreased in all seasons. The largest decreases occurred in MAM and SON, but only the trend in MAM is statistically significant. Tornado counts have also declined in all seasons in the GP, with the most notable trends in MAM, JJA, and SON. JJA tornado counts also declined in the SE & LMW, meaning that tornadoes in JJA have become less common over time in all regions. Tornado counts increased in all other seasons in the SE & LMW. The greatest increase has been in SON, when the mean (median) number of tornadoes per season increased from 24 (21) to 42 (30) between the first and last 20-year periods of the record.
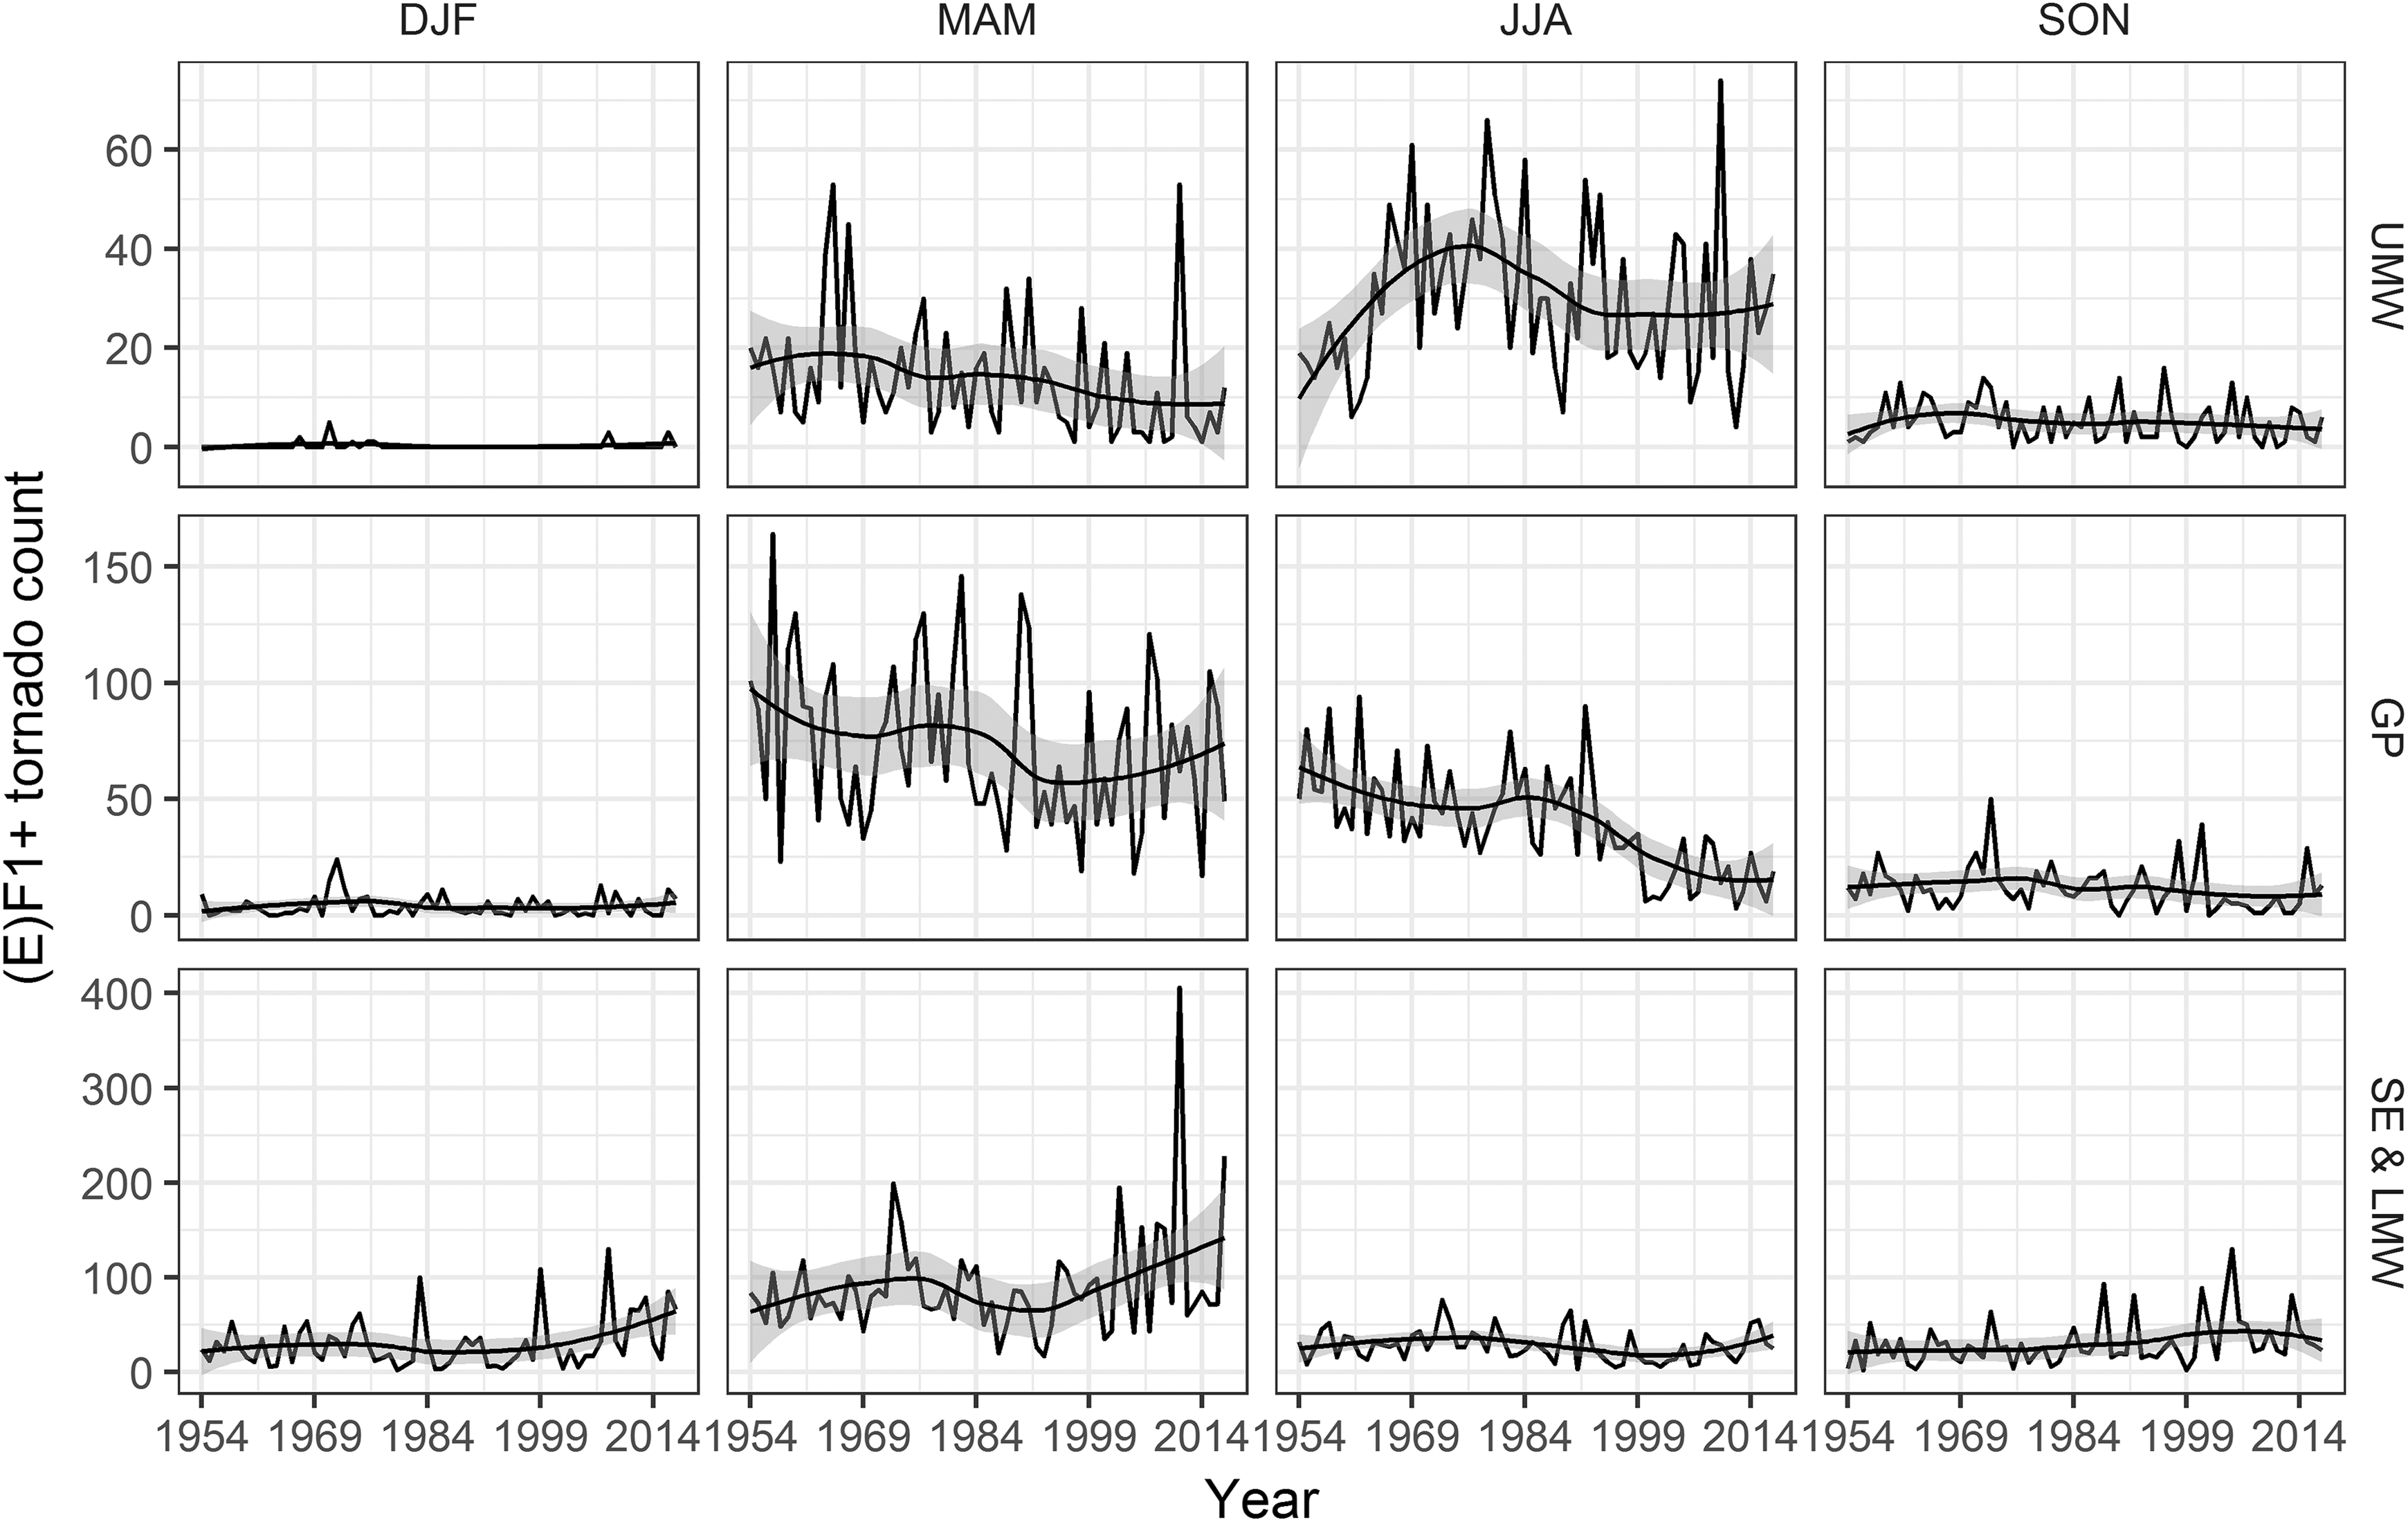
Count of (E)F1+ tornadoes between 1954 and 2017 in winter (DJF), spring (MAM), summer (JJA), and fall (SON) in the Upper Midwest (UMW), Great Plains (GP), and Southeast and Lower Midwest (SE & LMW). Black lines represent local polynomial regression curves. Note, y-axes are different for each region.
Center of tornado activity
Mean centers of annual and seasonal tornado activity are plotted in Figures 8(a) and 9(a). At the annual scale, the mean centers are concentrated around Missouri and Arkansas (Figure 8(a)). The mean centers, however, shift with the well-documented seasonal cycle (SPC, 2018), whereby they are located mostly in the SE in and around Mississippi and Alabama in DJF, shift northwestward toward Arkansas in MAM, then northeastward into Missouri, Iowa, and Illinois in JJA, and back toward the SE in SON (Figure 9(a)).
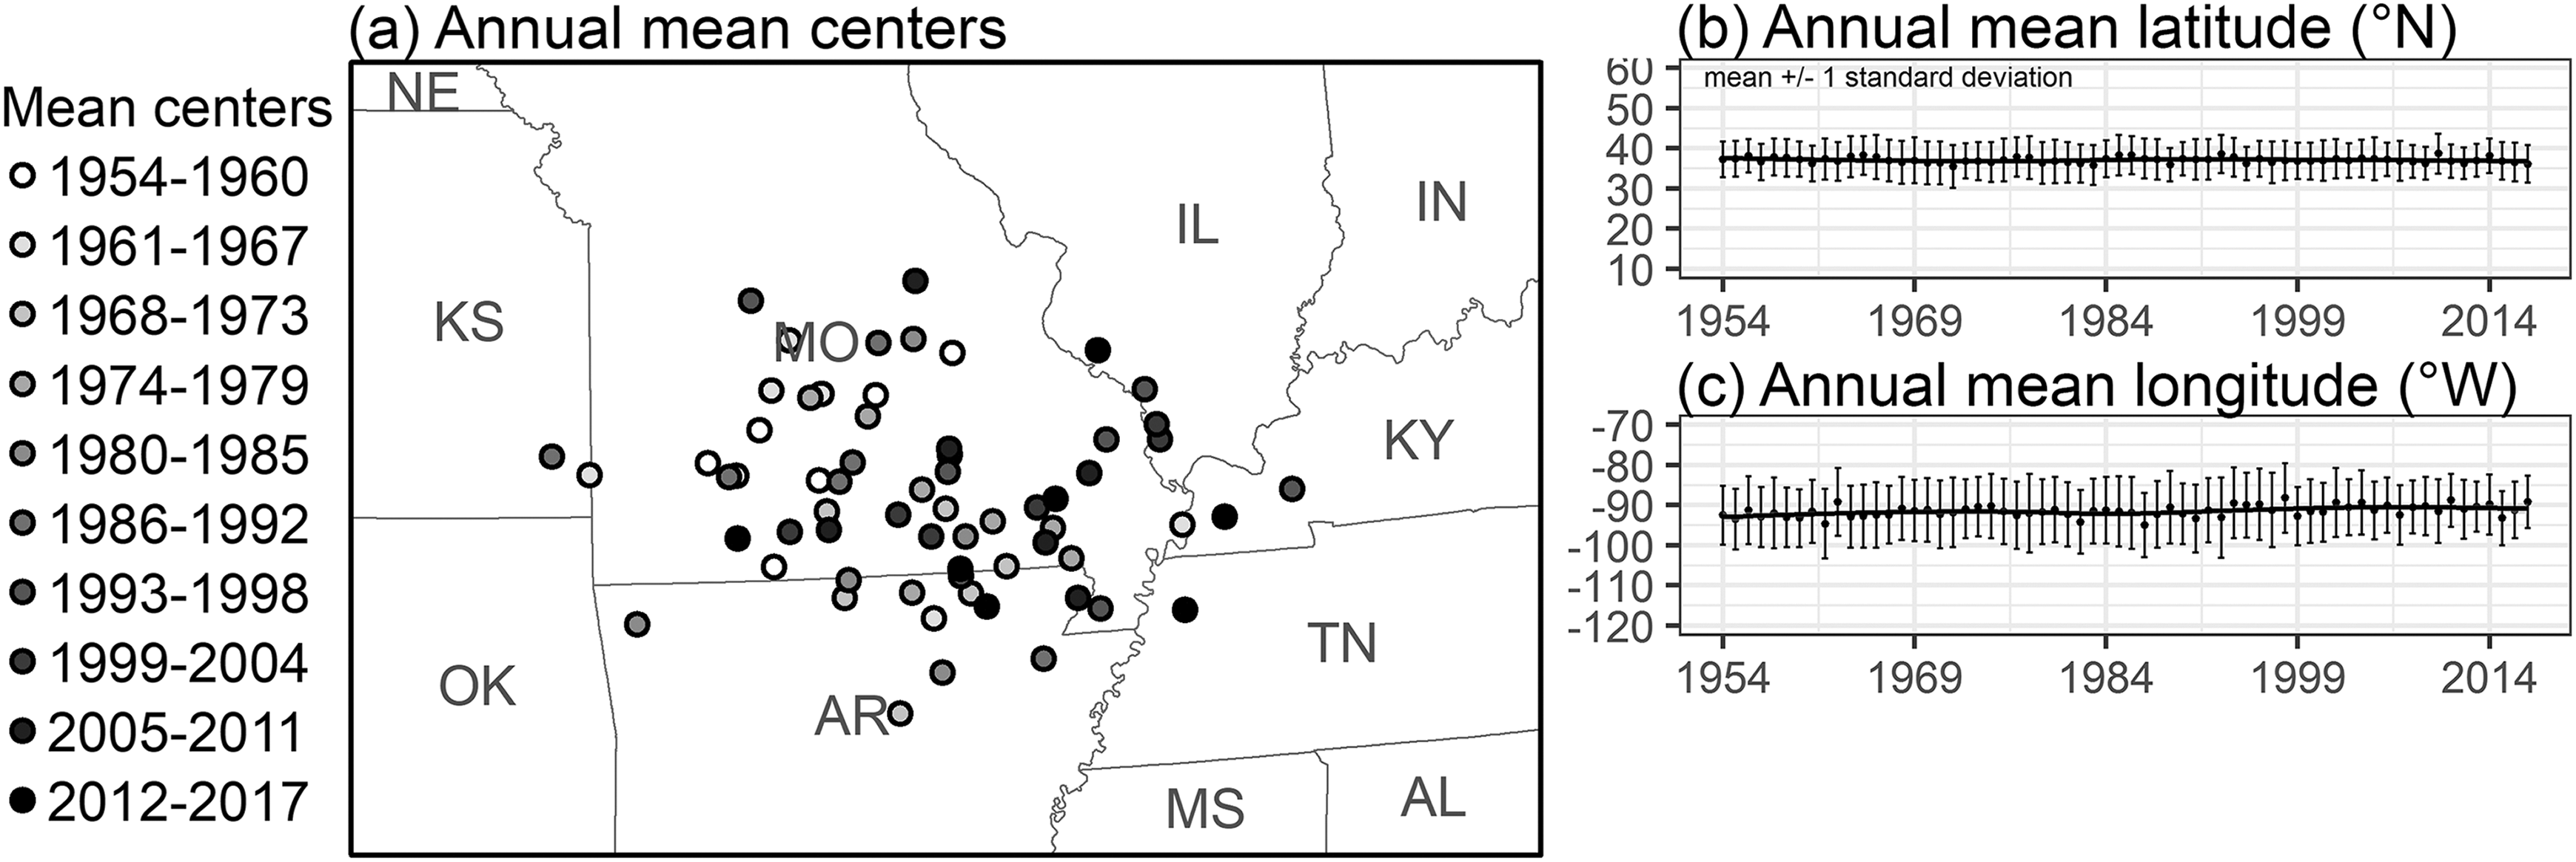
Plot of annual mean centers of (E)F1+ tornadoes in the contiguous United States (a) and time series of mean latitude and longitude between 1954 and 2017 (b). The black lines in the time series represent local polynomial regression curves.
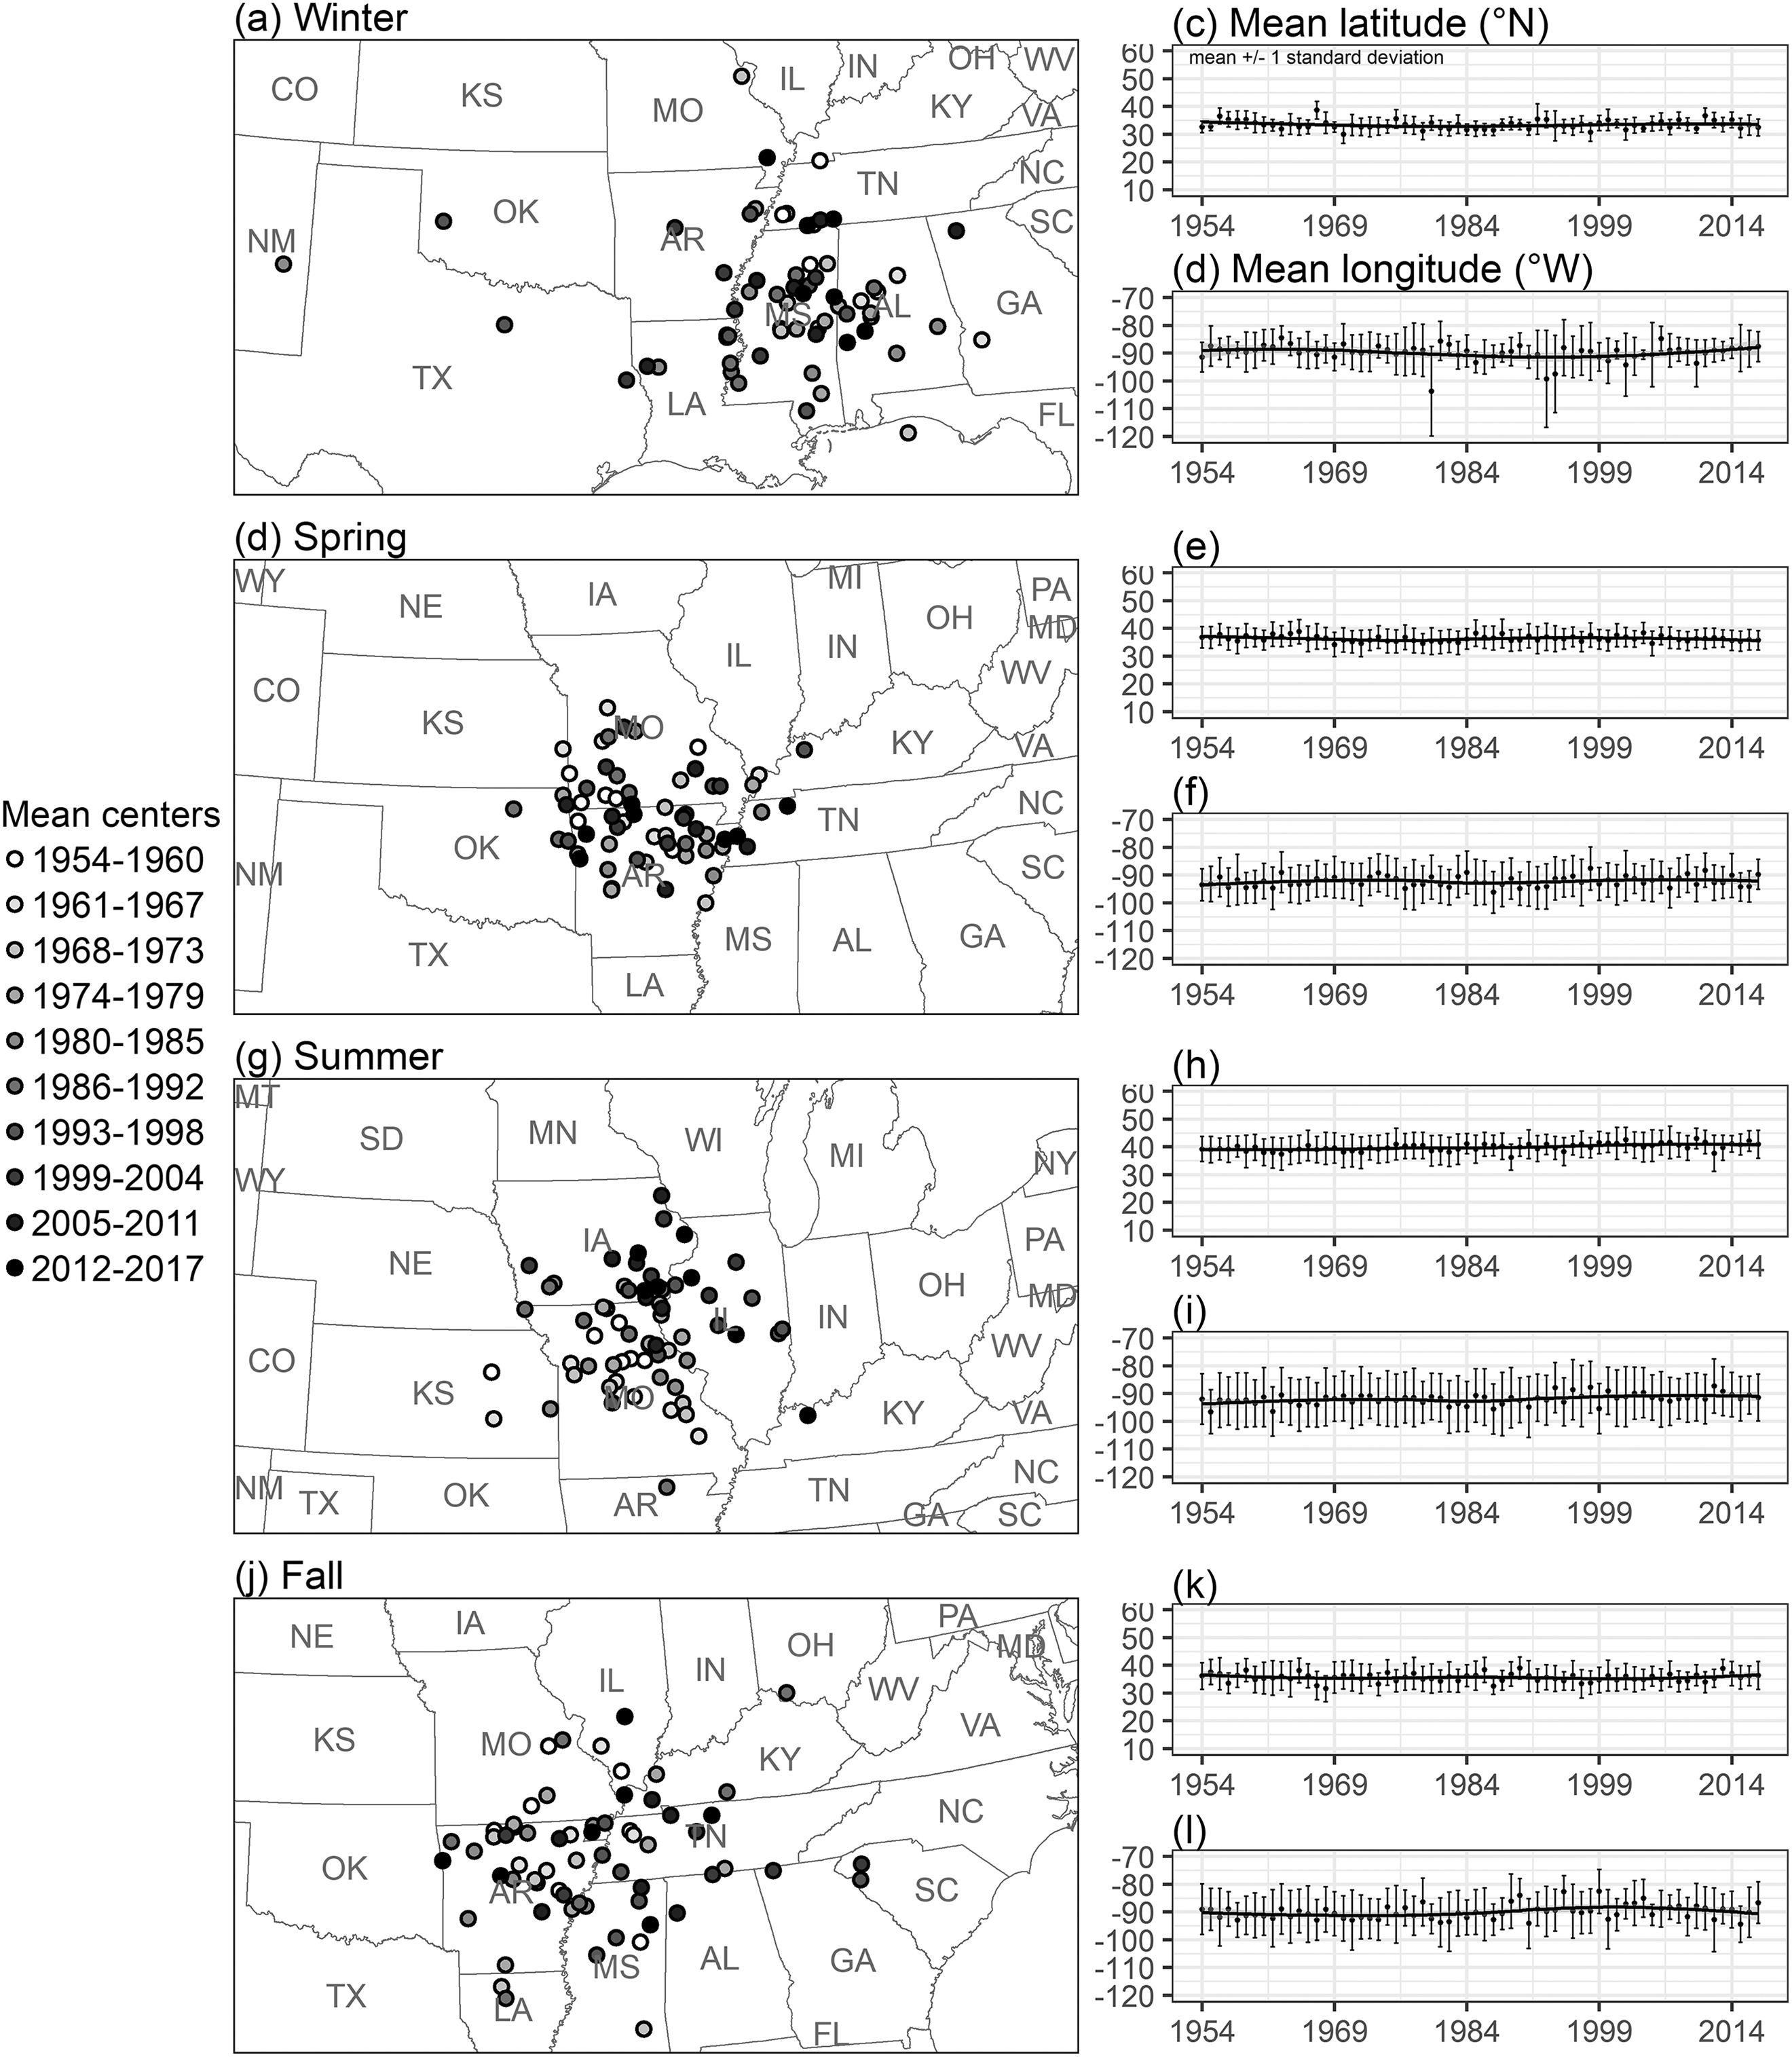
Plots of seasonal mean centers of (E)F1+ tornadoes in the contiguous United States ((a), (d), (g), (j)) and time series of mean latitude and longitude between 1954 and 2017 ((b), (c), (e), (f), (h), (i), (k), (l)). The black lines in the time series represent local polynomial regression curves.
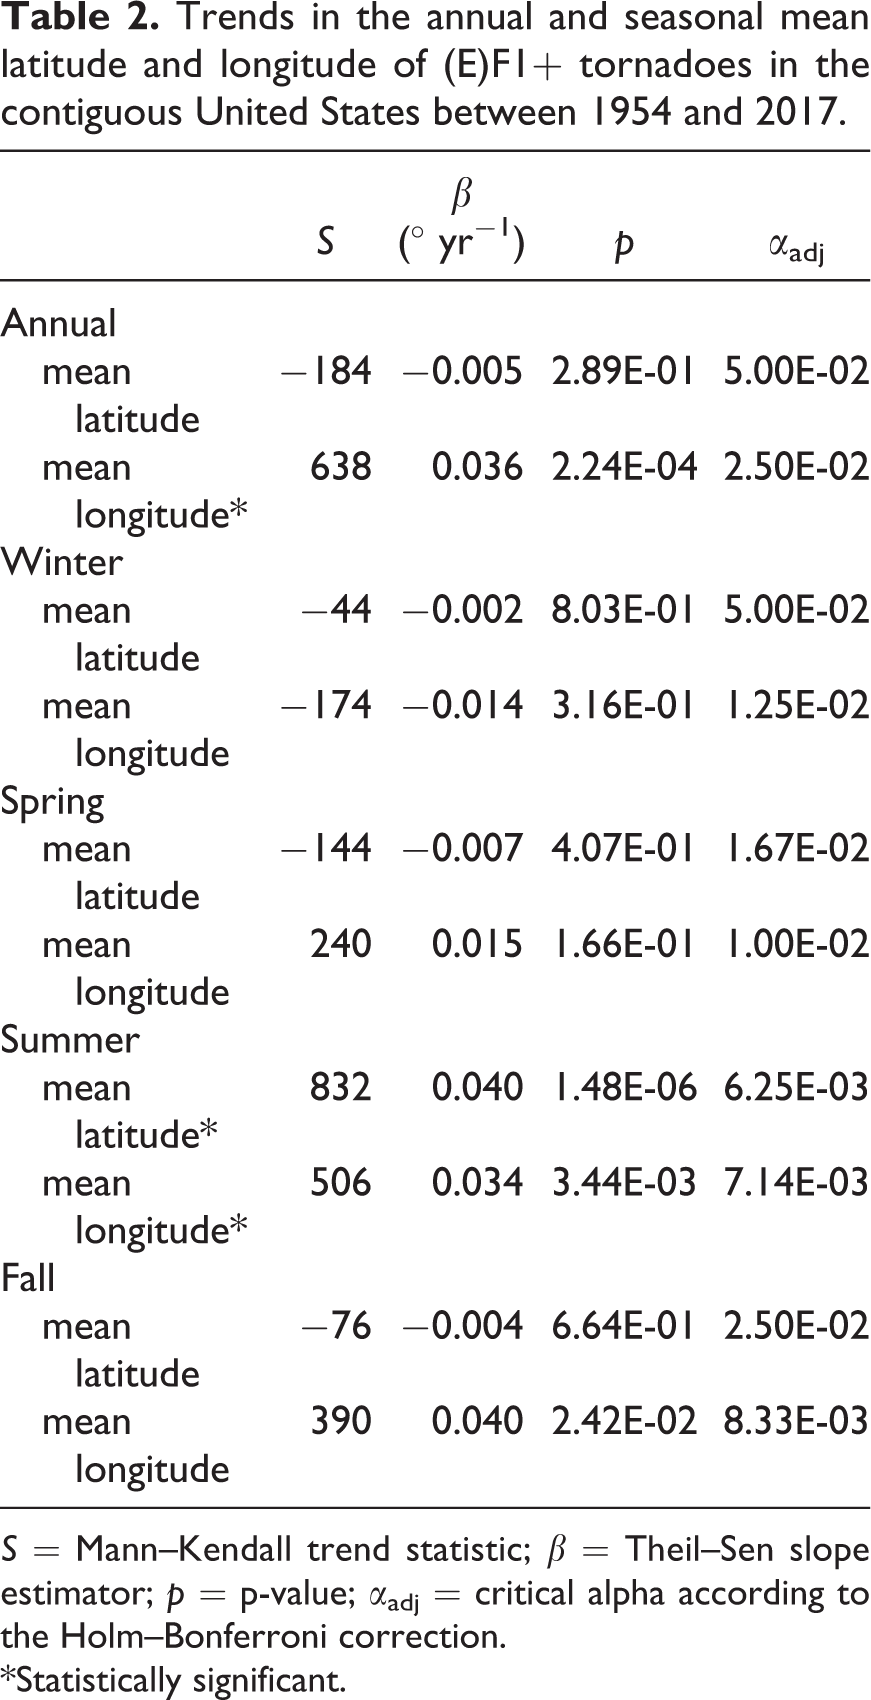
Time series of annual and seasonal mean latitude and longitude are shown in Figure 8(b) and (c) and Figure 9(b), (c), (e), (f), (h), (i), (k), and (l). Annual mean latitude has not trended over time, but annual mean longitude has trended significantly eastward (Figure 8(c); Table 2). The mean centers in DJF, MAM, and SON show no systematic change over time (Figure 9(b), (c), (e), (f), (k), and (l); Table 2). In JJA, however, the mean latitude and longitude have trended significantly northward and eastward, respectively (Figure 9(h) and (i); Table 2). Many of the JJA mean centers in the early record were located in Missouri, but were shifted northeastward into Iowa and Illinois in the latter part of the record (Figure 9 (g)). Some areas within the MW experienced increased tornado activity in JJA between some of the decades shown in Figure 4(k)–(o), but tornado counts in JJA have decreased over time across the GP, MW, and SE (Figure 7). Therefore, the mean center of JJA tornadoes is shifting northeastward not because of an overall increase in activity in the MW in JJA, but because the decrease seen there is less than the decrease in the GP and SE (Table 1).
Trends in the annual and seasonal mean latitude and longitude of (E)F1+ tornadoes in the contiguous United States between 1954 and 2017.
S = Mann–Kendall trend statistic; β = Theil–Sen slope estimator; p = p-value; αadj = critical alpha according to the Holm–Bonferroni correction.
*Statistically significant.
2 Changes in annual counts of tornado days
Trends in the number of days per year with 1–9, 10–19, 20–29, and 30+ (E)F1+ tornadoes are shown in Figure 10 and trend parameters are provided in Table 3. The number of days per year with 1–9 tornadoes significantly decreased between 1954 and 2017 at a rate of nearly -1 day per year. The number of days per year with 20–29 and 30+ (E)F1+ tornadoes increased slightly at rates of 0.02 and <0.01 day per year. No change is observed in the number of days with 10–19 tornadoes over the period of record. The median (and mean) number of tornadoes occurring on days with 20+ (E)F1+ tornadoes also increased (Figure 11). The median number of tornadoes on the 20+ days tended to be fewer than 25 for the 5-year periods before the mid-1980s whereas it was 25 or greater in the 5-year periods thereafter, with the exception of 1989–1993. The mean tended to be in the mid-20s in the periods before the mid-1980s and in the upper 20s and 30s in the periods thereafter.

Annual count of days with 1–9, 10–19, 20–29, and 30+ (E)F1+ tornadoes between 1954 and 2017. Black lines represent local polynomial regression curves.
Trends in the annual count of days with 1–9, 10–19, 20–29, and 30+ (E)F1+ tornadoes between 1954 and 2017.
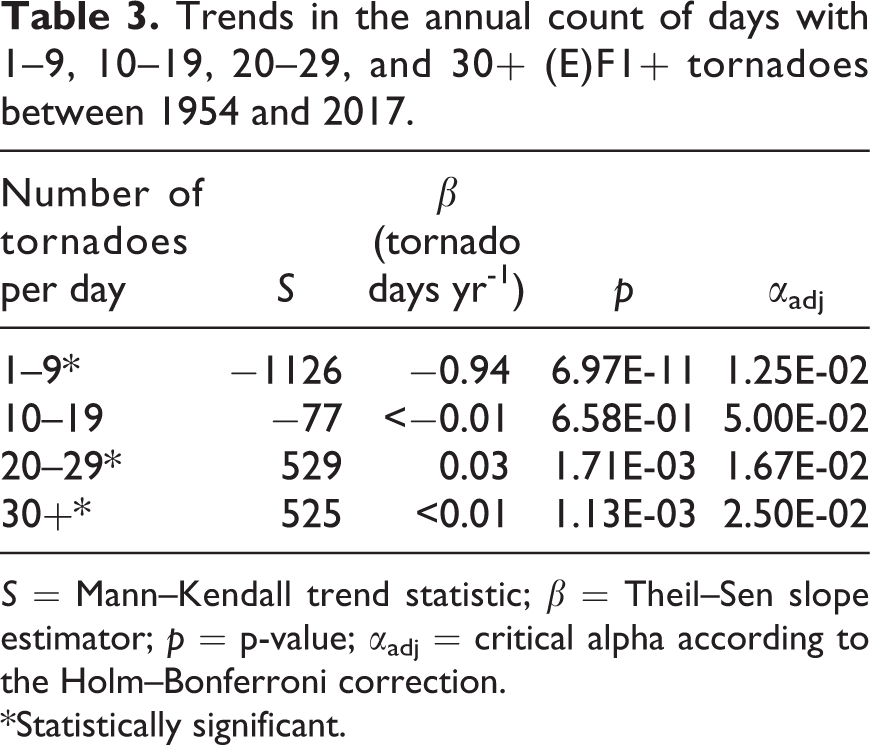
S = Mann–Kendall trend statistic; β = Theil–Sen slope estimator; p = p-value; αadj = critical alpha according to the Holm–Bonferroni correction.
*Statistically significant.

Mean ± standard deviation (SD) and median ± inter-quartile range (IQR) of the number of (E)F1+ tornadoes occurring on days with 20+ (E)F1+ tornadoes. Statistics represent 5-yr periods between 1954 and 2017 with the exception of the most recent period that represents only a 4-yr period. The number of days with 20+ (E)F1+ tornadoes (n) for each period is provided at the top of the graphic.
The frequency distribution of tornado-day size follows a power law relationship (Elsner et al., 2014). This relationship is illustrated in Figure 12. The decreasing number of days with few tornadoes (e.g., ≤9) and the concurrent increasing number of days with many tornadoes (e.g., ≥20) have slightly altered the frequency/tornado-day size relationship. The shift of the best fit line between the two halves of the period illustrates that the scaling exponent decreased over time. Using the slopes of the best fit lines to estimate the exponent provides a decrease from −2.3 to −1.9 between the two periods. Other methods of estimating the scaling exponent suggest that the relationship is less sensitive to these opposing trend (i.e., they show a decrease, but of a smaller amount). A maximum likelihood procedure, for example, provides a decrease from −1.8 to only −1.7.

Frequency (y-axis)/tornado-day size (x-axis) distribution of (E)F1+ tornadoes for the periods 1954–1985 and 1986–2017. Gray and black lines represent linear best fit lines for the two periods. Dashed vertical line is placed at 20 (E)F1+ tornadoes.
The seasonality of days with 20+ tornadoes is also changing (Figure 13). The majority occur in MAM (March n = 16, April = 48, and May = 53), but the percentage occurring in this season decreased between the first and last part of the record. During the first period (1954–1974), 80% occurred in MAM, whereas 82% and 66% occurred in MAM during the middle (1975–1995) and last (1996–2017) periods, respectively. Days with 20+ tornadoes were less common in SON and DJF (September n = 5, October = 5, November =15, December = 4, January = 10, and February = 5), but, unlike the occurrence of days in MAM, the percentage of 20+ days in SON and DJF increased over the study period, particularly in the last period. Only 20% and 14% occurred in SON and DJF in the first and middle parts of the record, respectively, but 32% occurred in these seasons in the last period between 1996 and 2017.

Monthly distribution of days with 20+ (E)F1+ tornadoes for each year over the period 1954–2017. The size of the points represent the number of tornadoes that occurred on that day.
3 Connection between the increased frequency of days with many tornadoes and the eastward shift in tornado activity
The increase in the annual number of days with many tornadoes has contributed to the eastward shift in tornado activity, namely the increasing trend seen in the SE & LMW. We use the number of days with 20+ (E)F1+ tornadoes (big tornado days) to illustrate this because the 20–29 and 30+ tornado-day groups increased in frequency significantly between 1954 and 2017. The tornadoes that occur on these days tend to concentrate in the SE & LMW (Figure 14). They are also becoming more common in SON and DJF (Figure 13) when the increasing trend in the SE & LMW is greatest (Figure 7; Table 1).

Kernel density (expected counts) of (E)F1+ tornadoes that occurred on days with 20+ (E)F1+ tornadoes between 1954 and 2017.
To explore further the contribution of the tornadoes that occurred on big tornado days to the observed trends, we removed them from the annual counts in the GP, UMW, and SE & LMW regions. The annual count of (E)F1+ tornadoes in the SE & LMW significantly increased when all (E)F1+ tornadoes are considered (Figure 5; Table 1). When those that occurred on the big days are removed, however, the increasing trend goes away; the trend actually becomes negative, although insignificant (Figure 15; Table 4). Removal of the tornadoes that occurred on these big days has a negligible effect on the trends in the UMW and GP.
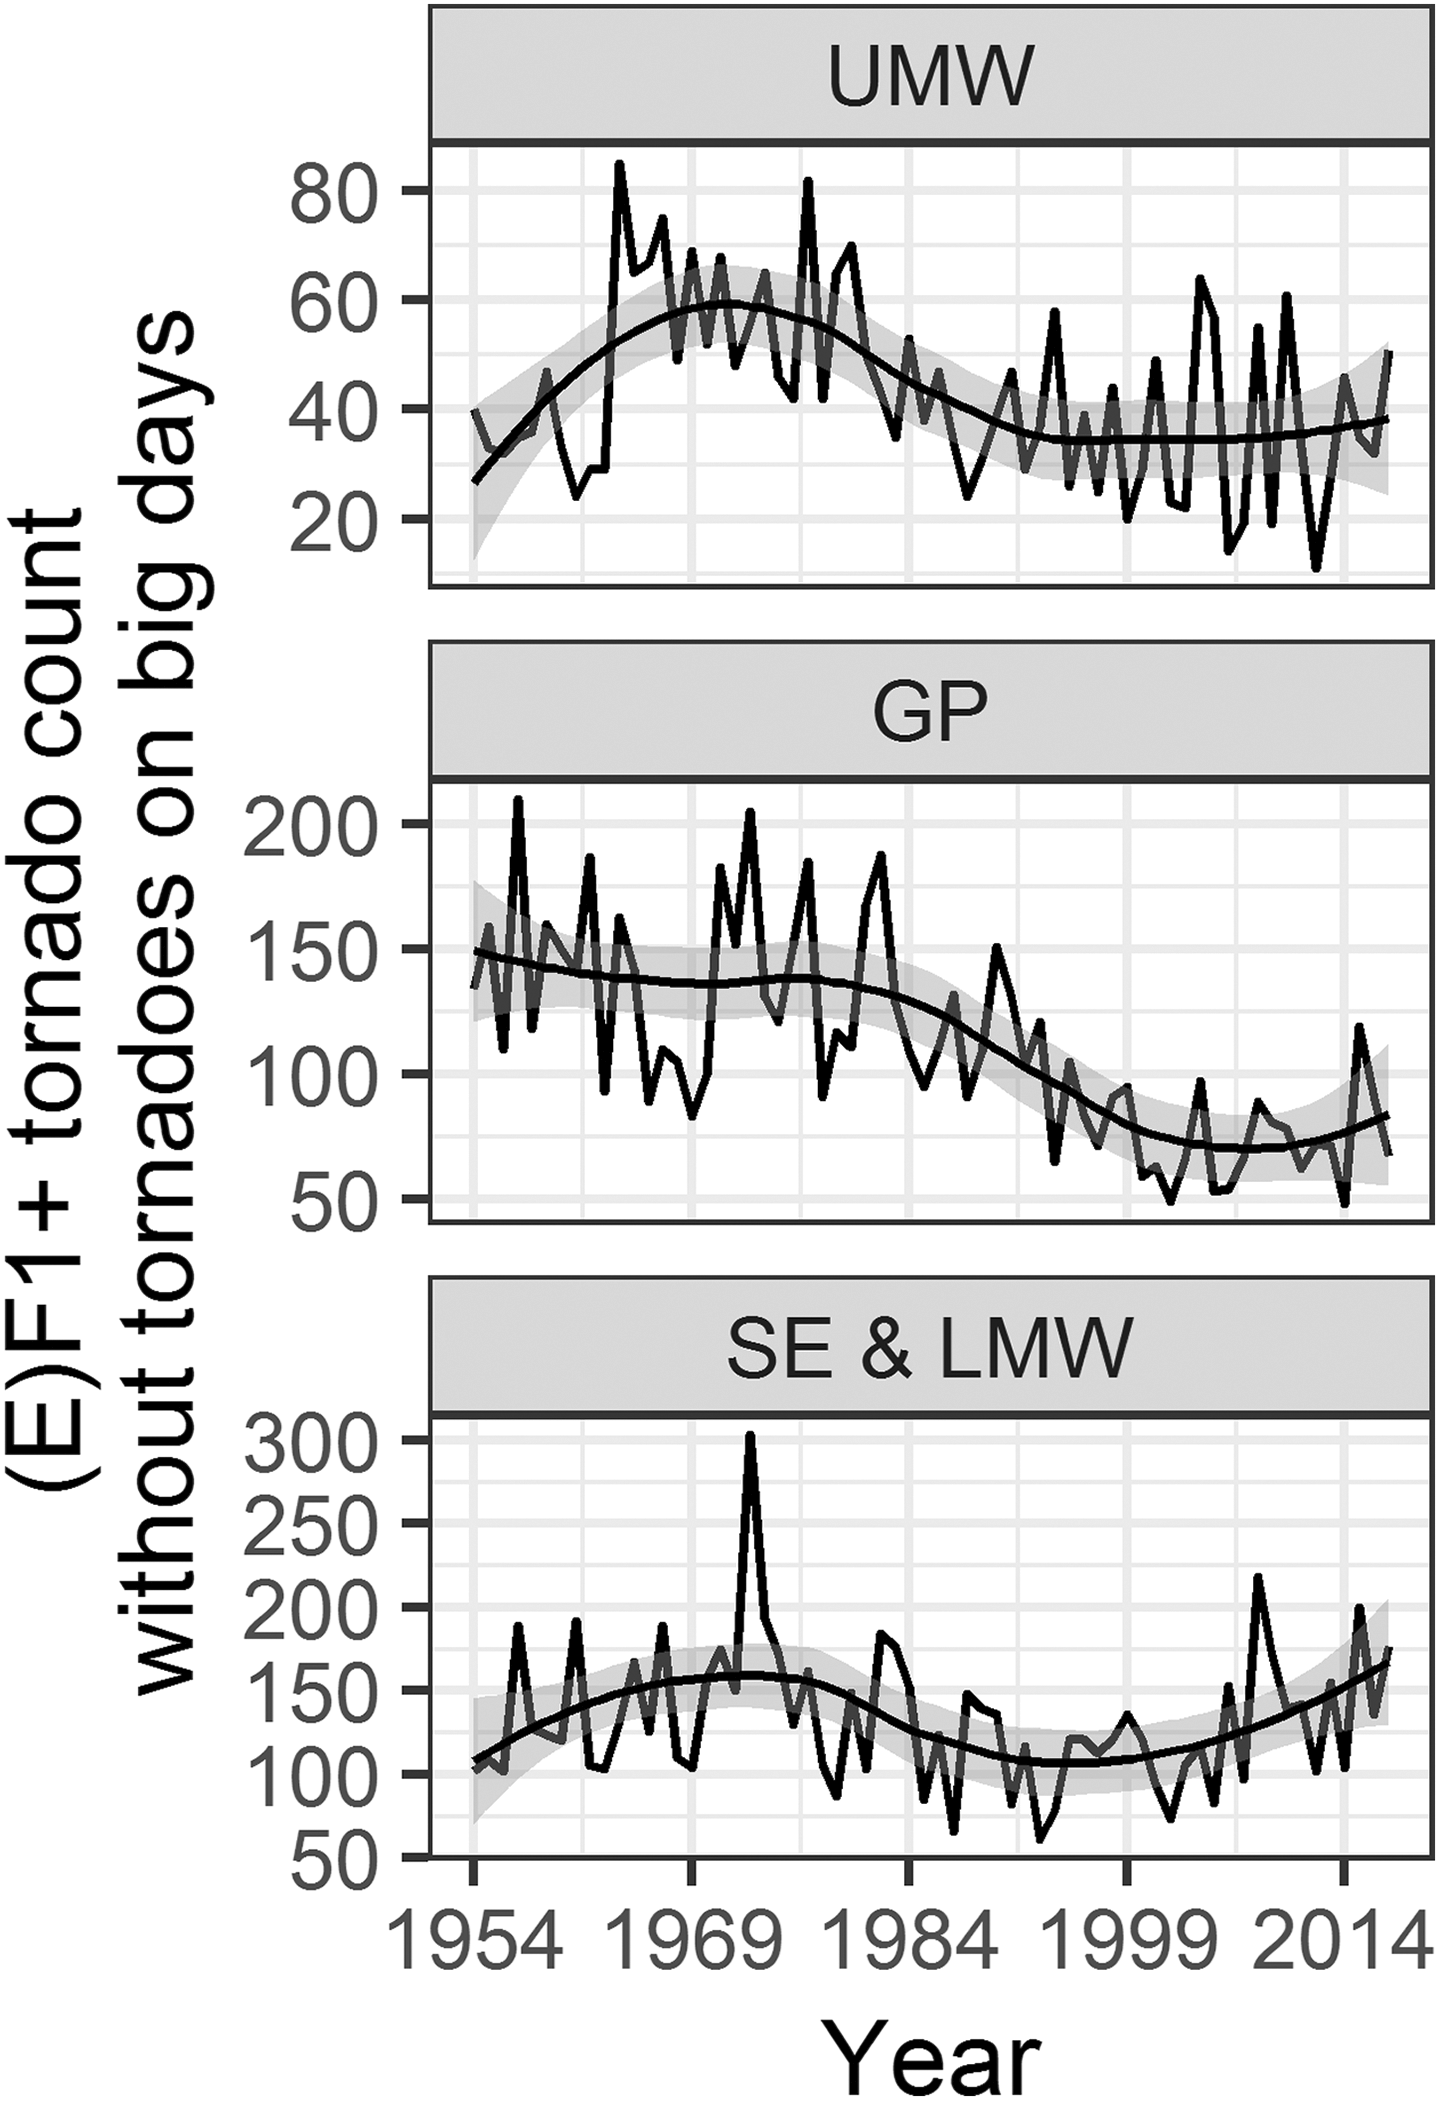
Annual counts of (E)F1+ tornadoes, minus those that occurred on days with 20+ (E)F1+ tornadoes, within the Upper Midwest (UMW), Great Plains (GP), and Southeast and Lower Midwest (SE & LMW) between 1954 and 2017.
Trends in annual counts of (E)F1+ tornadoes over the period 1954–2017 in the Upper Midwest (UMW), Great Plains (GP), and Southeast and Lower Midwest (SE & LMW) when the tornadoes that occurred on days with 20+ tornadoes.

S = Mann-Kendall trend statistic; β = Theil-Sen slope estimator; p = p-value; αadj = critical alpha according to the Holm-Bonferroni correction.
*Statistically significant.
IV Discussion
1 Increasing frequency of big tornado days
An initial consideration is that increases in observation and reporting, which are known to cause a notable increase in the number of (E)F0+ tornadoes over time (Doswell et al.,1999; Elsner et al., 2013; Verbout et al., 2006), have also led to an increase in the number of days with many tornadoes. But, as noted by Brooks et al. (2014), it is difficult to explain with changes in observation and reporting practices the opposing trends in the annual number of days with few and many tornadoes. Increased observation and reporting would most likely lead to an increase in all tornado days, regardless of the number of tornadoes. The number of days per year with one or more (E)F1+ tornadoes, however, has decreased over time whereas the number of days per year with many has increased. Increased observation and reporting would also increase the number of tornadoes in the record, but, as shown in Figure 1(b), there is no long-term trend in the (E)F1+ record.
A similar consideration is that better delineation of tornado paths over time has increased the number of reported tornadoes as those that once were reported as one long-track tornado are now reported as multiple tornadoes with shorter paths. This is especially relevant in the SE & LMW where tornado counts are on the rise (Figure 5(b)) and where path lengths tend to be longest (Coleman and Dixon, 2014; Fuhrmann et al., 2014). If this is the case in the SE & LMW, tornado path lengths should decrease over time. A decrease in median path length is observed between 1954 and the mid-1980s (Figure 16), so it is possible that this contributes to the increase in tornado count seen in the early portion of the record in the SE & LMW. Since the mid-1980s, however, median path length has stabilized and even trended slightly upward. Therefore, it is unlikely that better delineation of tornado paths is driving the increase in tornado counts in the latter part of the record in the SE & LMW.
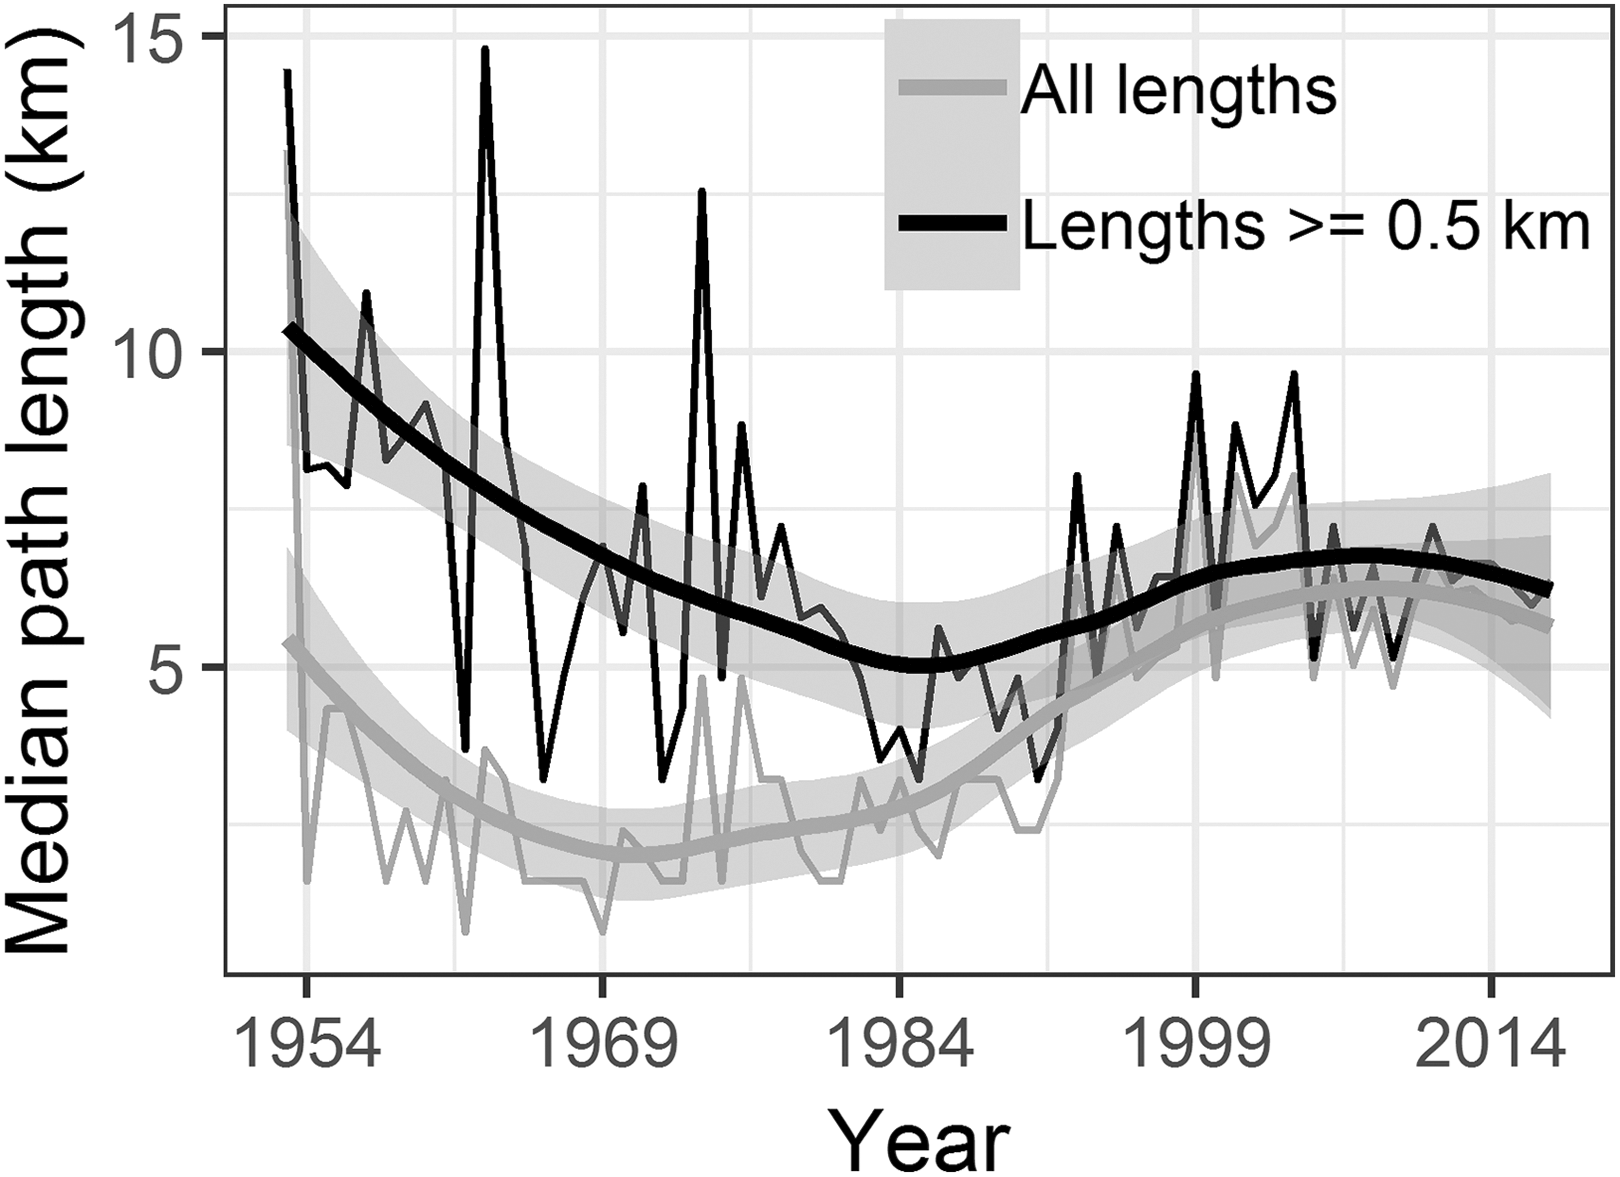
Annual mean path lengths for tornadoes in the SE & LMW. The series shown in black includes all tornadoes and the one shown in gray includes only those with a path length ≥0.5 km. Each series is fit with a local polynomial regression curve.
An alternative consideration is that the number of days with many tornadoes is increasing, and that the increase is occurring because the environments in which big tornado days occur are emerging more often. Tornado-favorable environments can come together at multiple spatial scales and with many storm modes (Edwards et al., 2012; Smith et al., 2012; Thompson et al., 2012). The days with the most tornadoes, however, tend to occur when particular synoptic scale patterns, such as an upper-level trough and a midlatitude surface cyclone, bring together the tornado-favorable ingredients of wind shear, lift, instability, and moisture over a relatively large region (Doswell et al., 1993, 2012; Mercer et al., 2012; Miller, 1972; Schultz et al., 2014). Elsner et al. (2015) explored the possibility that changes to larger, synoptic scale conditions explain the increasing frequency of days with many tornadoes by tracking changes in the number of clusters per tornado day, the area covered by the clusters, and the density of tornadoes within the clusters. They reported that the number of clusters increased, the area covered by the clusters decreased, and the density of tornadoes in the clusters increased. This led them to hypothesize that local-scale change to instability and convective inhibition might be leading to fewer tornado days associated with smaller and more active areas of severe convection. Tippett et al. (2016), however, directly tracked changes in instability and shear parameters over time, conditional on the occurrence of a tornado outbreak, and reported that shear (storm relative helicity) rather than instability (convective available potential energy) increased over time.
Although tenuous at this time, the increased frequency of big tornado days also elicits a possible connection with the amplified rate of warming in the Arctic (i.e., Arctic amplification). The decreased equator-to-pole temperature gradient resulting from Arctic amplification has been hypothesized to be connected to extreme weather in the midlatitudes through complex interactions that ultimately may force the northern hemisphere polar jet stream into wavier configurations (Cohen et al., 2014; Francis and Vavrus, 2015; Mann et al., 2017). This, in turn, may change the frequency at which tornado-favorable synoptic patterns emerge. It is important to note, however, that controversy still surrounds the connection between Arctic amplification and midlatitude synoptic patterns (Francis, 2017; Overland et al., 2015). Only Trapp and Hoogewind (2018) have explored a connection between changes in the Arctic and tornado activity in the U.S. They found evidence of a relationship between tornado activity, mainly in July, and extent of sea ice in the Arctic, whereby tornado counts were higher with anomalously large Arctic sea ice extent.
2 Eastward shift in tornado activity
We previously illustrated the contribution of the increased occurrence of days with 20+ (E)F1+ tornadoes to the eastward shift of tornado activity (namely the increase trend in the SE & LMW). Another possibility is that excluding (E)F0 tornadoes led to the differing trends. For example, the decrease observed in the (E)F1+ record of the GP could be caused by larger proportions of tornadoes being rated (E)F0 over time in that region. Gensini and Brooks (2018), however, illustrate that declining tendencies are present across most of the GP (with the exception of central and southeast Kansas and northeast Oklahoma) over the period 1979–2017 even when (E)F0 tornadoes are included. They also illustrate that increasing tendencies dominate most of the SE & LMW over this same period when all tornadoes are considered.
We show in Figure 17 the record of (E)F0+ tornadoes between 1954 and 2017 for multiple sub regions of the U.S. (sub regions are based on the gridded trends in Gensini and Brooks, 2018). General increases are seen in all regions between 1954 and 1995, with the exception of the central-east GP (CEGP). Decreased population bias, heightened awareness, and increased detection and reporting contribute to these increases (Doswell et al., 1999; Verbout et al., 2006; Elsner et al., 2013). Over the period 1995–2017, which is a period without major non-meteorological and climatological changes to induce secular trends, the numbers of (E)F0+ tornadoes generally decreased in the northwestern and southern GP (NWGP and SGP, respectively) and middle UMW (MUMW), similar to what is seen when considering (E)F0+ tornadoes across the contiguous U.S. (Figure 1a). In the CEGP and SE & LMW, however, the numbers of (E)F0+ tornadoes continue to increase over the post-1995 period. The trends are not statistically significant (Table 5), but they nonetheless illustrate that the observed trends in the most recent part of the record are not caused by the exclusion of (E)F0 tornadoes.

Borders of the Mid Upper Midwest (MUMW), Northwest Great Plains (NWGP), Central-east Great Plains (CEGP), South Great Plains (SGP), and Southeast and Lower Midwest (SE & LMW) regions (a) and annual counts of (E)F0+ tornadoes within each region between 1954 and 2017 (b). The black lines in (b) represent local polynomial regression curves. Dashed vertical lines are placed at 1995, after which is the period with modern Doppler radar coverage.
Trends in annual counts of (E)F0+ tornadoes over the period 1995–2017 in the Mid Upper Midwest (MUMW), Northwest Great Plains (NWGP), Central-east Great Plains (CEGP), South Great Plains (SGP), and Southeast and Lower Midwest (SE & LMW).
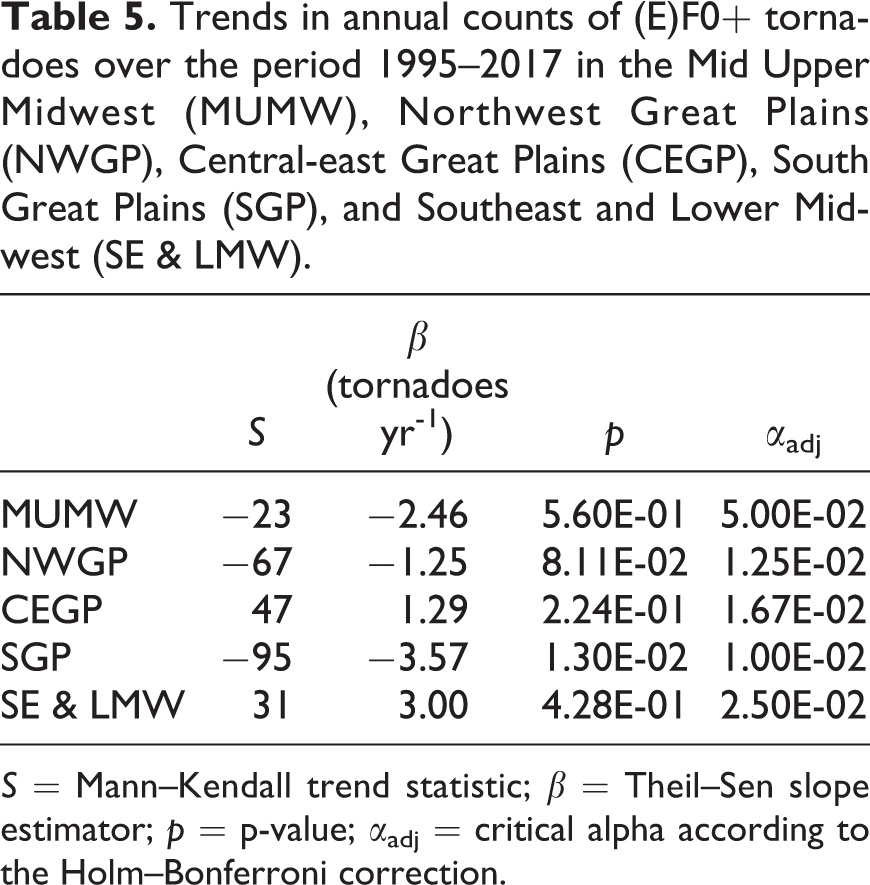
S = Mann–Kendall trend statistic; β = Theil–Sen slope estimator; p = p-value; αadj = critical alpha according to the Holm–Bonferroni correction.
Another consideration is that the eastward shift is related to shifts in the occurrence of tornado-favorable environments. Gensini and Brooks (2018) showed that trends in the annual accumulation of the significant tornado parameter 1 generally match the trends in annual tornado counts, with increases seen across most of the SE & LMW and decreases seen throughout the GP. This is notable because it adds confidence to the tornado trends and it provides evidence of a physical reason for them—it suggests that the increasing and decreasing trends seen in tornado activity in SE & LMW and in portions of the GP, respectively, are likely related to increases and decreases in the frequency of tornado-favorable environments. These observed trends are generally consistent with projections that show that severe weather- and tornado-favorable environments will likely become more common in portions of the eastern U.S. (Del Genio et al., 2007; Diffenbaugh et al., 2013; Gensini and Mote, 2014, 2015; Lee, 2012; Trapp et al., 2007, 2009; Van Klooster and Roebber, 2009); see Brooks (2013) and Tippett et al. (2015) for overviews of some of these projected changes. Lee (2012) and Gensini and Mote (2015) highlight portions of the SE & LMW, in particular, as areas with projected increases in tornado-favorable environments.
It is also possible that the observed eastward shift in tornado activity is related to one or more modes of climate variability that influence tornado-favorable conditions (e.g., shear, instability, and low-level moisture), and is therefore part of a cycle. Indication of possible west-east variability is present in the annual tornado density maps between the first few decades of the analysis, but this signal diminishes in the last few decades in most seasons. Fujita et al. (1975) also questioned whether the spatial distribution of tornadoes in the U.S. varies at random or in a systematic way based on shifts in annual tornado centroids. Recent studies provide insight into possible drivers of a spatial cycle by illustrating links between teleconnections and tornado activity in the U.S. The El Niño/Southern Oscillation, for example, has been shown to alter the spatial distribution of tornadoes and relevant environmental proxies (e.g., convective precipitation and storm relative helicity) in the U.S. (Allen et al., 2015; Cook et al., 2017; Elsner et al., 2016; Moore, 2019). Tornado activity in MAM is greatest in the SE & LMW during the La Niña phase whereas it is greatest in portions of the GP during the El Niño phase. The El Niño/Southern Oscillation varies over too short a time scale to drive a long-term eastward shift, but other oscillations with longer cycles may account for some of the shift.
V Conclusion
Mounting evidence suggests that the spatial distribution and temporal clustering of tornadoes in the U.S. are changing. The evidence of changes to the spatial distribution include a possible eastward shift in activity, which has been shown with tornado density estimates (Agee et al., 2016; Farney and Dixon, 2014), regional and gridded trend in tornado counts (Ashley and Strader, 2016; Gensini and Brooks, 2018; Moore, 2018a), and shifts in the centroids of tornado touchdowns (Moore, 2017). The evidence of changes to the temporal clustering include more frequent occurrence of days and outbreaks with many tornadoes (Brooks et al., 2014; Elsner et al., 2015; Moore, 2017; Tippett and Cohen, 2016; Tippett et al., 2016). In this paper, we reviewed the studies in which these changes are presented. We also present modified and new analyses to complement them.
Similar to those presented in previous studies (Agee et al., 2016; Farney and Dixon, 2014), our tornado density maps highlight areas in the SE & LMW where tornado activity has increased over time and areas in the GP where tornado activity has decreased over time. By producing density maps for each decade between 1958 and 2017, we also show west-east variability at the annual scale across the first few decades. The regional trends shown here, along with those reported in previous studies (Ashley and Strader, 2016; Gensini and Brooks, 2018; Moore, 2018a), also illustrate the increase in the SE & LMW and the decrease in the GP and UMW regions. The seasonal trends illustrate that DJF and especially SON have contributed most to the increase in the SE & LMW. They also illustrate that decreases in MAM and SON contribute to the decreased activity in the GP and UMW. JJA also significantly contributes to the decline of tornado activity in the GP, but not the UMW. In the UMW, JJA tornado activity decreased at a rate lower than the rates seen in the GP and SE & LMW regions. This led the mean center of JJA tornadoes to shift significantly northeastward between 1954 and 2017. The mean centers in other seasons were relatively insensitive to the changes in regional tornado activity and did not shift significantly over time. Similar to JJA, the mean center of annual tornado activity also shifted eastward over time.
This paper and others (Brooks et al., 2014; Elsner et al., 2015; Moore, 2017) illustrate that the number of days per year with few (E)F1+ tornadoes (e.g., 1–9) has significantly declined over time whereas the number of days per year with many (e.g., 20+) has significantly increased. Similar to Moore (2017), we also illustrate that the number of days per year with moderate numbers of tornadoes (e.g., 10–19) has not trended, which demonstrates that the changes are occurring mostly in the tails of the frequency distribution of tornado-day size. In addition, we show that the greatest increases in the frequency of days with many tornadoes have been in SON and DJF, and that the opposing trends at the tails of the distribution are changing the frequency/tornado-day size relationship. Lastly, we demonstrate that the increasing frequency of the big tornado days contributes to the eastward shift by showing that the tornadoes that occur on these days tend to occur in the SE & LMW, and that the increasing trend in the SE & LMW disappears when the tornadoes that occur on these days are excluded.
More research is needed to explain the changes reviewed in this study and to better understand possible societal impacts. Additional studies similar to Gensini and Brooks (2018) of the links between environmental covariates and tornado activity are also needed to further explore possible physical drivers of spatiotemporal changes of tornado activity. Likewise, links between tornado activity and modes of climate variability that operate over decade and longer time scales (such as the Pacific Decadal Oscillation and Atlantic Multidecadal Oscillation) need additional study to determine if the observed spatial shift is part of a west-east cycle. Additional efforts are also needed to characterize the environments, or patterns, present on the days with many tornadoes and to identify these patterns over time to determine if they are emerging more often, thus increasing the likelihood of big tornado days. A related avenue that might provide insight into the increased frequency of big tornado days involves exploring possible linkages between changes in the Arctic, midlatitude circulation patterns, and tornado activity in the U.S., similar to recent efforts by Trapp and Hoogewind (2018). Such observation-based studies should continue with the current tornado record, but they will undoubtedly strengthen as the post-1995 record lengthens. To continue building confidence in projections, efforts to model future environments should continue as computing resources and spatiotemporal resolutions improve.
These observation- and model-based research efforts will not only provide insight into possible changes to the climatology of tornadoes in the U.S., they will yield practical information about tornado risk that may heighten awareness, improve preparedness, and mitigate human loss. Casualty counts tend to be higher on days with many tornadoes, all else being equal (Fuhrmann et al., 2014). Furthermore, tornadoes in the SE tend to have higher casualty rates (Ashley, 2007; Ashley and Strader, 2016; Elsner et al., 2018; Strader et al., 2017a, 2017b). The increased frequencies of days with many tornadoes, especially in the SE, therefore, will potentially yield more tornado casualties.
Footnotes
Declaration of conflicting interests
The author(s) declared no potential conflicts of interest with respect to the research, authorship, and/or publication of this article.
Funding
The author(s) received no financial support for the research, authorship, and/or publication of this article.