
Abstract
Although light rain events have a small intensity and amount, light rain also exerts a significant influence on the environment and climate, and observations have revealed a significant reduction in light rain in many regions around the globe. The specific reasons for light rain reduction have not been clearly revealed. Some studies attribute the reduction in light rain to an increase in aerosol, while other studies tend to associate it with global warming. Therefore, further studies should be conducted to increase knowledge regarding the reasons for the decrease in light rain. Light rain events were analyzed using daily precipitation data collected from 67 gauge stations across Southwest China from 1960 to 2010. The results show that both the amount of light rain and the number of light rain days have decreased during the last 50 years at different magnitudes (0–2 mm, 2–5 mm, and 5–10 mm), in which the light rain amount and number of light rain days for 0–2 mm of rainfall present the largest regionally averaged decreasing rates of –0.20 mm/a and –0.73 days/a from 1960 to 2010, respectively. Furthermore, the maximum (minimum) light rain amount and number of light rain days appear in summer (winter). In addition, an increasing trend in the light rain amount in discrete events and a decreasing trend in the light rain amount in consecutive events are simultaneously revealed, in which the reduction in the frequency of consecutive light rain events is more significant than that of discrete light rain events. The reduction in light rain in the eastern part of Southwest China from 1979 to 2010 is mainly caused by a combination of water vapor reduction and warming. Moreover, the influence of aerosols on the observed reduction in light rain is not statistically significant at the inter-annual scale. The results provide some main correlation factors for predicting the long-term changes of light rain in China and even the global region.
I Introduction
Precipitation (including drizzle, rain, sleet, snow, graupel, and hail) is any product of the condensation of atmospheric water vapor that falls under the influence of gravity, which is a key physical process that links many aspects of climate, weather, and the hydrological cycle. The amount of precipitation is closely related to human life, industries, and agricultural production (IPCC, 2007; Trenberth, 2011). Many studies have reported long-term changes in annual or seasonal precipitation in various regions of the world. Manton et al. (2001) found that the number of rain days significantly decreased in Southwest Asia and the western and central South Pacific, and the contribution of extreme events to the annual total rainfall has increased. Similarly, Fujibe (2013) reported that there was an increase in intense precipitation and a decrease in light rain in Japan in all seasons from 1989 to 2003. For China, there were decreasing trends in annual mean precipitation and extreme events extending from the southern part of Northeast China, southwestward to the upper Yangtze River valley (Qian and Lin, 2005), and changes in precipitation were mainly due to changes in heavy and extreme rainfall events (Liu et al., 2005; Zhai et al., 2005).
Compared with precipitation of a greater intensity, light rain permeates into soil and resists surface runoff more easily; therefore, light rain is vital to maintain the soil moisture content, irrigate crops, and prevent forest fires (Qian et al., 2007). In arid and semiarid areas, the reduction in light rain can enhance the aridification rate, and a study has suggested that drought in northern China could be caused largely by the reduction in light rain (Yan and Chi, 2000). In addition, light rain is more likely to be affected by anthropogenic activities, including global warming and increases in aerosol concentrations; therefore, light rain changes can be regarded as evidence that human activities influence the climate. On the other hand, precipitation can clear away contaminants, including the elimination of aerosols by light rain; therefore, light rain is also important for atmospheric environmental quality.
The accumulated light rainfall amount accounts for a significant proportion of annual precipitation and makes a major contribution to precipitation frequency, although its intensity has a smaller magnitude. At the global scale, a decreasing trend of light rain events in North America, Europe, and Asia was also found from 1973 to 2009 by Qian et al. (2010); however, according to Huang and Wen (2013), in summer and winter, there is a long-term increase in light rain events in North America and Southern Europe and a long-term decrease in most of Eurasia (Central Europe, Eastern Europe, North Asia, and East China). Most studies of light rain changes focus on China. Fu et al. (2008) pointed out that the frequency of light rain was more than that of heavy rain and torrential rain in many areas of China. Qian et al. (2009) showed that the number of light rain days accounted for 83% and 74% of the total number of rain days in North and Southeast China in summer, respectively, and both the frequency and amount of light rain decreased, especially for light rain amounts of less than 2 mm. Meanwhile, there has been a significant reduction in drizzle and light rain in South China and the Pearl River Delta region (Fu and Li, 2014), which was similar to former findings in an arid region in North China (Gong et al., 2004). Liu et al. (2005) found a decrease in light rain in China from 1960 to 2000, and the decrease in light rain frequency accounted for 66% of the total rain frequency reduction. The reduction in light rain frequency has become the main contributor to the reduction in total rain frequency in China, and the increases in heavy rainfall and extreme rainfall could be contributors to the decrease in light rain, because heavy rain can release substantial latent heat to offset energy perturbations and consume a large amount of water vapor in the atmosphere (Allen and Ingram, 2002).
The reasons for different precipitation types are generally different. Discrete precipitation events usually occur under partly cloudy weather conditions, which are mainly caused by condensation under local rapid ascending motions, while consecutive precipitation events are usually on overcast days, which are mainly caused by a stable synoptic system in the context of large circulation. For example, autumn rain in West China is a typical climate phenomenon linked to the advance and retreat of the East Asian summer monsoon, which is characterized by continuous rainy days and large rainfall amounts, and is a typical example of consecutive rainfall (Ding, 2007; Ding and Wang, 2008). In autumn, frequent cold air moving southward meets warm and humid air stagnant in the region, which intensifies frontal activity and produces prolonged overcast rain. Li et al. (2011) pointed out that long-term rain and short-term rain accounted for 84.4% and 15.6% of the total rain events in China, respectively. Decreasing trends are observed in the longest consecutive rainy days, the greatest consecutive rainfall amount, and consecutive rainfall. Consecutive rainfall processes decreased in West China from 1961 to 2014 (Zhang et al., 2018). Therefore, it is necessary to reveal the individual characteristics of changes in discrete and consecutive light rain events.
The conditions affecting precipitation include water vapor, ascending motion, and the microphysical processes of clouds (Zhu et al., 2000), and the manner in which these factors affect rainfall and the extent of their impact on precipitation change are worth discussing. There are two dominant viewpoints: one is that the changes in water vapor and temperature are the main cause of change in precipitation, and the other is that aerosols strongly impact rainfall.
As reported by Trenberth et al. (2003), the water-vapor-holding capacity of the atmosphere increases with higher temperatures according to the Clausius–Clapeyron equation, which can be ascribed to the following physical mechanism: the same amount of water vapor has more difficulty condensing in a warmer environment than a colder environment. Wu and Fu (2013) also found that more water vapor caused the precipitation intensity to be stronger and the precipitation frequency to be smaller. In Southwest China, there is a close link between moderate rain events and water vapor content (Qian et al., 2007); in East China, both warming and changes in water vapor content are the most important reasons for light rain reduction, and warming was deemed the primary cause (Wu et al., 2015).
As reported by Ramanathan et al. (2001), aerosols have important microphysical effects on clouds and precipitation through their influence on cloud droplet nucleation, which affect the cloud lifetime, cloud albedo, and precipitation. Some short-term observational studies and numerical simulations have found a link between the decrease in light rain and an increase in the atmospheric aerosol concentration (Chen et al., 2014; Qian et al., 2009). Observations showed that aerosols were likely to restrain precipitation in shallow or warm clouds (Rosenfeld, 1999, 2000, 2006; Rosenfeld et al., 2001; Zhang and Wu, 2014), which may be the reason for the rapid precipitation decrease in East China, where aerosols are concentrated (Zhao et al., 2006). However, in other cases, aerosols may enhance rainfall by stimulating convection and accelerating the conversion of cloud water (Lin et al., 2006; Williams et al., 2002). In addition, Wu et al. (2016) found a counterexample of aerosols suppressing light rain on a long-term scale in a clean area of Southwest China, where light rain decreased significantly, accompanied by an increase in visibility and decrease in aerosol optical depth (AOD). Liu et al. (2011) pointed out that there may be correlations of light rain with solar radiation and cloud coverage. Another study found that light rain reduction in the warm season over the past 30 years mainly happened under partly cloudy weather conditions rather than overcast weather conditions in East China (Wu et al., 2017). Therefore, although there have been some studies on the short-term influence of aerosols on light rain, the relationship between light rain (even precipitation with greater intensity) and aerosols needs further research.
Currently, research on the long-term changes in light rain events in China mainly concentrates on the East China region, which is dense with observation stations over a flat terrain and has serious air pollution problems. Previous research has already proven the impacts of temperature and water vapor on light rain reduction in this area, and yet cannot exclude the probability of aerosols suppressing light rain, as it is difficult to find a clean area with less aerosol pollution in East China. Therefore, choosing a research region with both polluted and clean areas is important to simultaneously compare the different influences of warming, water vapor change, and aerosol increase on the long-term changes in light rain. The Southwest China region includes the Tibetan Plateau, the Yunnan–Guizhou Plateau, the Hengduan Mountains, and the Sichuan Basin. The AOD characteristic of “low in the west and high in the east” has been revealed in Southwest China (Liu et al., 2014; Tian and He, 2010), which indicates the coexistence of clean and polluted areas in this region. Hence, Southwest China is an appropriate region for comparing the influences of warming, water vapor change, and aerosol increase on observed light rain changes, and research conclusions in this region may be more convincing than those from areas with flat terrain.
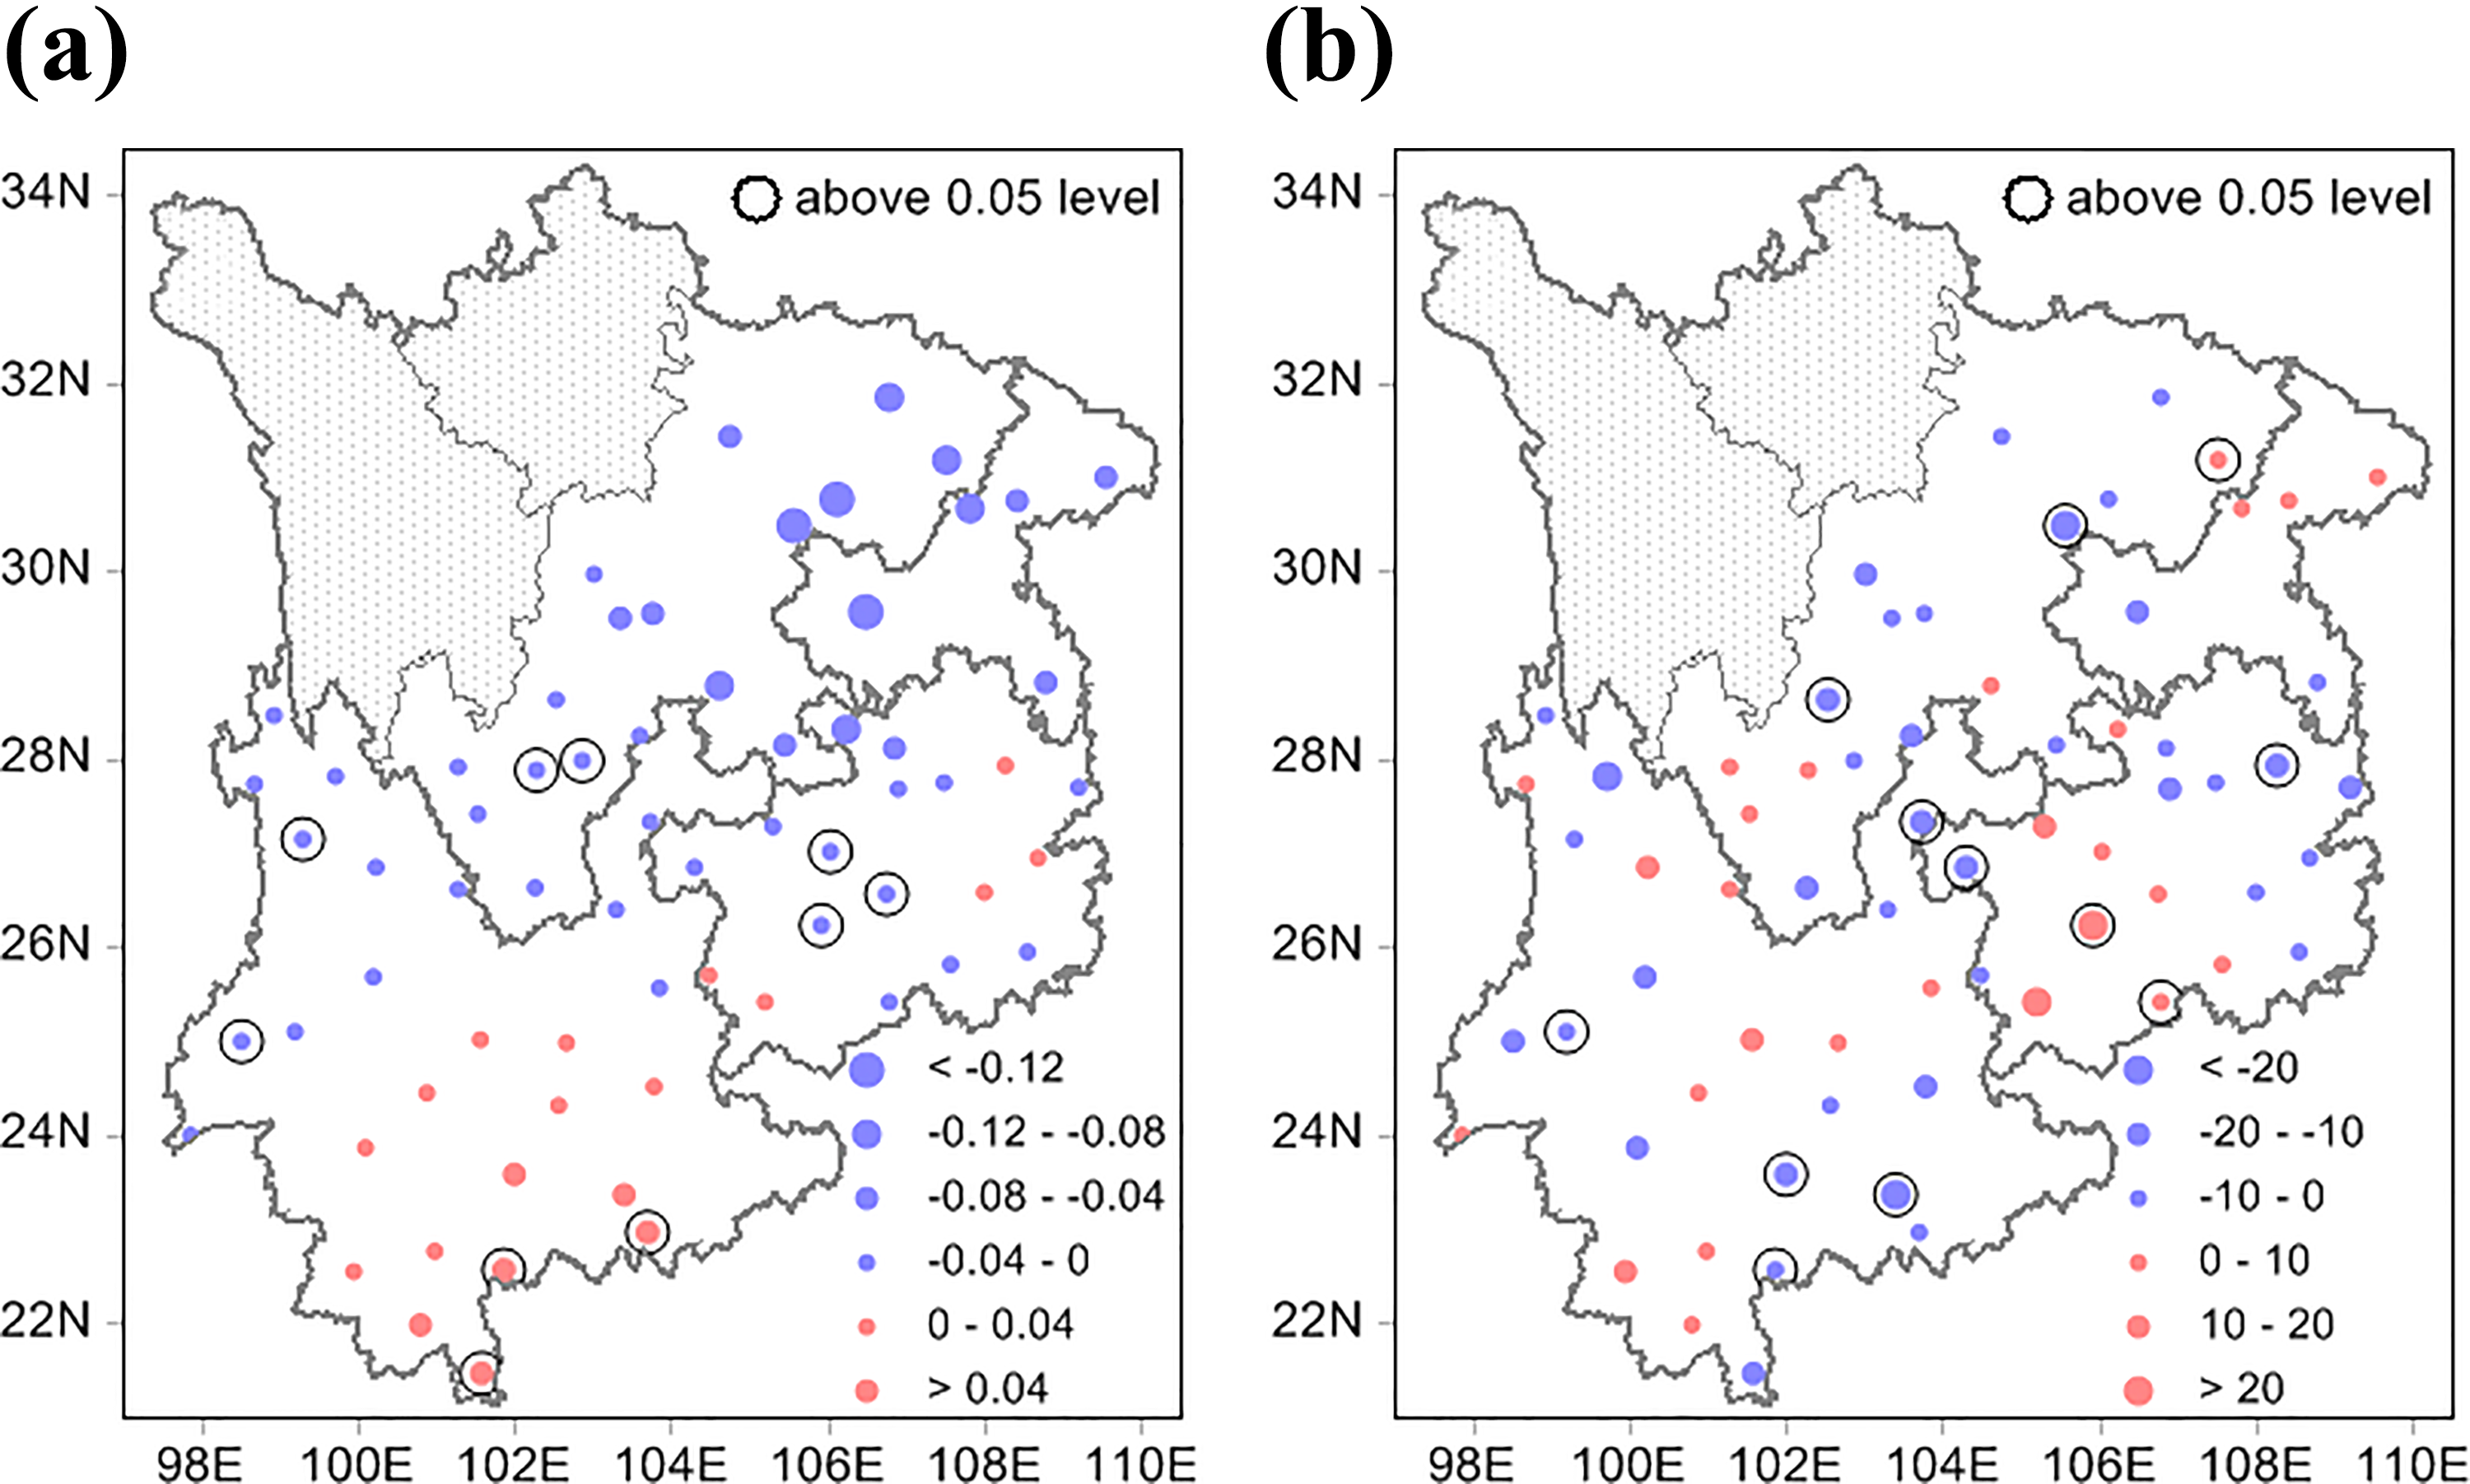
In this paper, the characteristics of the variations in light rain in Southwest China (the provincial divisions are shown in Figure 1(a)), including the Sichuan Province, Yunnan Province, Chongqing Municipality, and Guizhou Province, from 1960 to 2010, are discussed, excluding high-altitude regions (i.e. the Tibetan Plateau and the Aba and Ganzi prefectures in Sichuan Province), and the potential causes for light rain change are explored from the perspective of the influences of aerosols, water vapor, and temperature change together, which is different from the documented research. The data and methods used in this research are described in Section II. In Section III, the daily precipitation data from 1960 to 2010 in Southwest China are analyzed to examine the spatial and temporal characteristics of light rain. A deep understanding of the contributions of temperature and water vapor to light rain reduction is presented in Section IV. A further in-depth discussion of the relationships between light rain and aerosols is presented in Section V. The key conclusions are summarized in Section VI.

Linear trend coefficients of the total light rain amount (a), total number of light rain days (b), 0–2 mm light rain amount (c), number of 0–2 mm light rain days (d), 2–5 mm light rain amount (e), number of 2–5 mm light rain days (f), 5–10 mm light rain amount (g), and number of 5–10 light rain days (h). (The circles indicate significance at the 95% confidence level during 1960–2010, and the squares to the right of the corresponding circles indicate significance at the 95% confidence level during 1979–2010). The provincial divisions are shown in (a), where the region “1” indicate Sichuan Province, region “2” indicate Chongqing Municipality, region “3” indicate Yunnan Province, and the region “4” indicate Guizhou Province.
II Data and methods
1 Data
Daily precipitation data from 1960 to 2010, collected from 556 primary meteorological stations in China, covering almost all first- and second-class national climate stations, are obtained from the China Meteorological Administration (CMA). Zhai et al. (2005) regarded this dataset as the best daily rainfall dataset for studying climate change in China. Among all stations, 67 stations are located in Southwest China, and the precipitation data from these stations are used in this study.
Relative humidity (RH), specific humidity, and temperature are obtained from the ERA-Interim reanalysis dataset, which covers the region of 97°E–110.5°E, 21°N–34.5°N, at a resolution of 0.5°× 0.5°, including the 1000 hPa, 900 hPa, 850 hPa, 700 hPa, and 500 hPa levels, and spanning from 1979 to 2010, with a temporal resolution of 6 h; these data are used to investigate their respective relation to light rain events. The ERA-Interim reanalysis dataset is an improved reanalysis dataset from the European Centre for Medium-Range Weather Forecasts (ECWMF). The temperature data from the ERA-Interim reanalysis dataset shows good agreement with the radiosonde measurements compared to its former version (Poli et al., 2010), and the temperature and RH data match more closely to the radiosonde data in China, especially in the lower and middle troposphere (Zhu et al., 2012); therefore, the ERA-Interim data have been widely used to research climate change.
AOD data are obtained from the Moderate Resolution Imaging Spectroradiometer (MODIS) MOD08_D3 dataset at a spatial resolution of 1°×1° from 2001 to 2010 (Chu et al., 1998; Ichoku et al., 2003), in which the areal coverage is the same as that for the temperature and humidity data, and the potential relation between light rain and aerosols is analyzed with the AOD data.
In this study, the entire temporal period (1960–2010) is divided into three segments – 1960–2010, 1979–2010, and 2001–2010 – because there are different periods for different data: light rain observation data are available from the period 1960–2010, temperature and humidity data at high levels from the ERA-Interim reanalysis data are available from the period 1979–2010, and AOD data from MODIS are available from the period 2001–2010. These three time periods are used for quantifying the change in light rain events and analyzing the effects of water vapor, temperature, and aerosols on light rain events, respectively.
2 Methods
According to the CMA definition, light rain days are identified as those with a daily precipitation amount of less than 10 mm, including long-term drizzle and short-term storm events (Qian et al., 2009). Days with precipitation amounts of less than 2 mm and amounts of 2–5 mm and 5–10 mm are further separated and analyzed in the present study. Light rain events are divided into two types – discrete and consecutive events – which are defined by whether or not the light rain events occur on the days before and after a light rain day. A discrete light rain event is identified as a light rain day with two adjacent days that has no precipitation, and a consecutive light rain event is identified as a day with two or more consecutive days that also experience light rain.
The linear regression method is used to check the temporal trends of meteorological elements, including light rain days, light rain amounts, RH, and AOD, and the F-test method is used to evaluate the significance of the regression coefficients of all meteorological elements. Composite analysis is used to comprehend the impact of RH in the lower troposphere on light rain days. Years with higher and lower RH levels and many and few light rain days are composited. The RH gridded data are interpolated over the corresponding stations by the inverse distance weighting method, and then the data are standardized. If the standardized value is more (less) than 1 (–1), its corresponding year is selected as a positive (negative) abnormal year. The significance of the difference between the composition of high and low values is tested using the t-test.
The correlation coefficients of RH and precipitable water (PW) in the lower troposphere with light rain days are calculated. The empirical orthogonal function (EOF) analysis is employed to obtain the dominant EOF modes and principal components of the light rain amount, light rain days, RH, and PW (both RH and PW are interpolated over the corresponding stations) in the lower troposphere; then, the first two principle components and their corresponding modes are analyzed to reveal their temporal and spatial characteristics.
The RH can be calculated using meteorological elements, and RH in the lower troposphere is calculated by integration from the surface to 680 hPa (equation (1)), which corresponds to the definition of a low-level cloud (Wu et al., 2015):
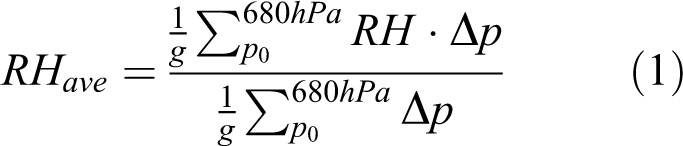
where P0 represents the surface pressure and RHave represents the average RH in the lower troposphere.
In addition, PW can be calculated according to equation (2):
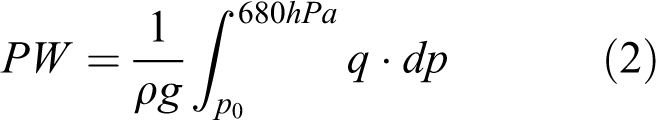
where q represents specific humidity, P0 represents surface pressure, and ρ represents the density of liquid water.
The Clausius–Clapeyron equation is also used to comprehend the impacts of temperature and water vapor on light rain days from a physical perspective (Fujibe, 2013):

where esat(T) represents the saturation water vapor pressure over water (esat(water)(T)) or ice (esat(ice)(T)) at the corresponding temperature.
III Long-term changes in light rain in Southwest China
1 Different magnitudes of light rain
The total annual mean light rain amount and number of light rain days during the period 1960–2010 in Southwest China are 314.15 mm and 134 days, respectively. The total light rain amount reaches its largest (lowest) value of 351.71 (261.04) mm in 1961 (2009), over 154 (109) light rain days. Figure 1(a) to (h) indicate the spatial distribution of the linear trend coefficients of different magnitudes of light rain during the periods 1960–2010 and 1979–2010. The light rain amount and number of light rain days at most stations in Southwest China show a distinct decreasing trend, except for some stations in southern Sichuan and central Yunnan (Figure 1(a) and (b)). The regionally averaged linear trend coefficients of the total light rain amount and number of light rain days are –0.62 mm/a and –0.81 day/a from 1960 to 2010, and –0.95 mm/a and –0.65 day/a from 1979 to 2010, respectively, which pass the statistically significant F-test at the 95% confidence level. These results further confirm that the reduction in the number of light rain days causes a decrease in the light rain amount (Qian et al., 2007).
The annual mean light rain amount and number of light rain days at different intervals, including 0–2 mm, 2–5 mm, and 5–10 mm rainfall amounts, are 53.41 mm, 99.63 mm, and 161.10 mm and 81 days, 30 days, and 22 days from 1960 to 2010, respectively. However, from 1979 to 2010, these values are 51.51 mm, 98.37 mm, and 158.72 mm and 73 days, 30 days, and 22 days, respectively. Figure 1(c) to (d) indicates that the reduction in 0–2 mm light rain occurs at almost all stations in Southwest China, most of which pass the significant F-test at the 95% confidence level. The regionally averaged amount and number of days at 0–2 mm of rainfall show linear trends of –0.20 mm/a, –0.73 day/a from 1960 to 2010, and –0.27 mm/a, –0.49 day/a from 1979 to 2010, respectively. Most stations present similar distributions of the linear trend coefficient for rainfall amounts of 2–5 mm and 5–10 mm and light rain days, as shown in Figure 1, but more stations are accompanied by an increase in the linear trends for larger rainfall amount intervals (0–2 mm, 2–5 mm), and fewer stations present a significant decreasing trend for larger rainfall amount intervals (0–2 mm, 2–5 mm) (Figure 1(e) to (f)). The regionally averaged trends of the light rain amount and number of light rain days at 2–5 mm rainfall totals reach –0.15 mm/a and –0.05 day/a, respectively, and those at 5–10 mm rainfall totals reach –0.26 mm/a, and –0.04 day/a from 1960 to 2010, and –0.37 mm/a, and –0.09 day/a from 1979 to 2010, respectively. These results indicate that 0–2 mm light rain amount decreases significantly compared to other intervals in Southwest China, which corresponds to previous research in East China (Qian et al., 2009).
The time-variant percentages of light rain days at each interval compared to the total number of light rain days from 1960 to 2010 are shown in Figure 2. Light rain days with 0–2 mm of rainfall comprise the largest proportion and show a significant decreasing trend at a rate of –0.174%/a, and light rain days with 2–5 mm and 5–10 mm of rainfall account for approximately 20% and 10%–20% of the total number of light rain days experiencing 0–10 mm of rainfall, which shows a slow decreasing trend at rates of 0.10%/a and 0.075%/a, respectively. The aforementioned results indicate a significant transition from light rain to greater intensify rainfall during the most recent 50 years, which has been found in semiarid regions in China (Gong et al., 2004).
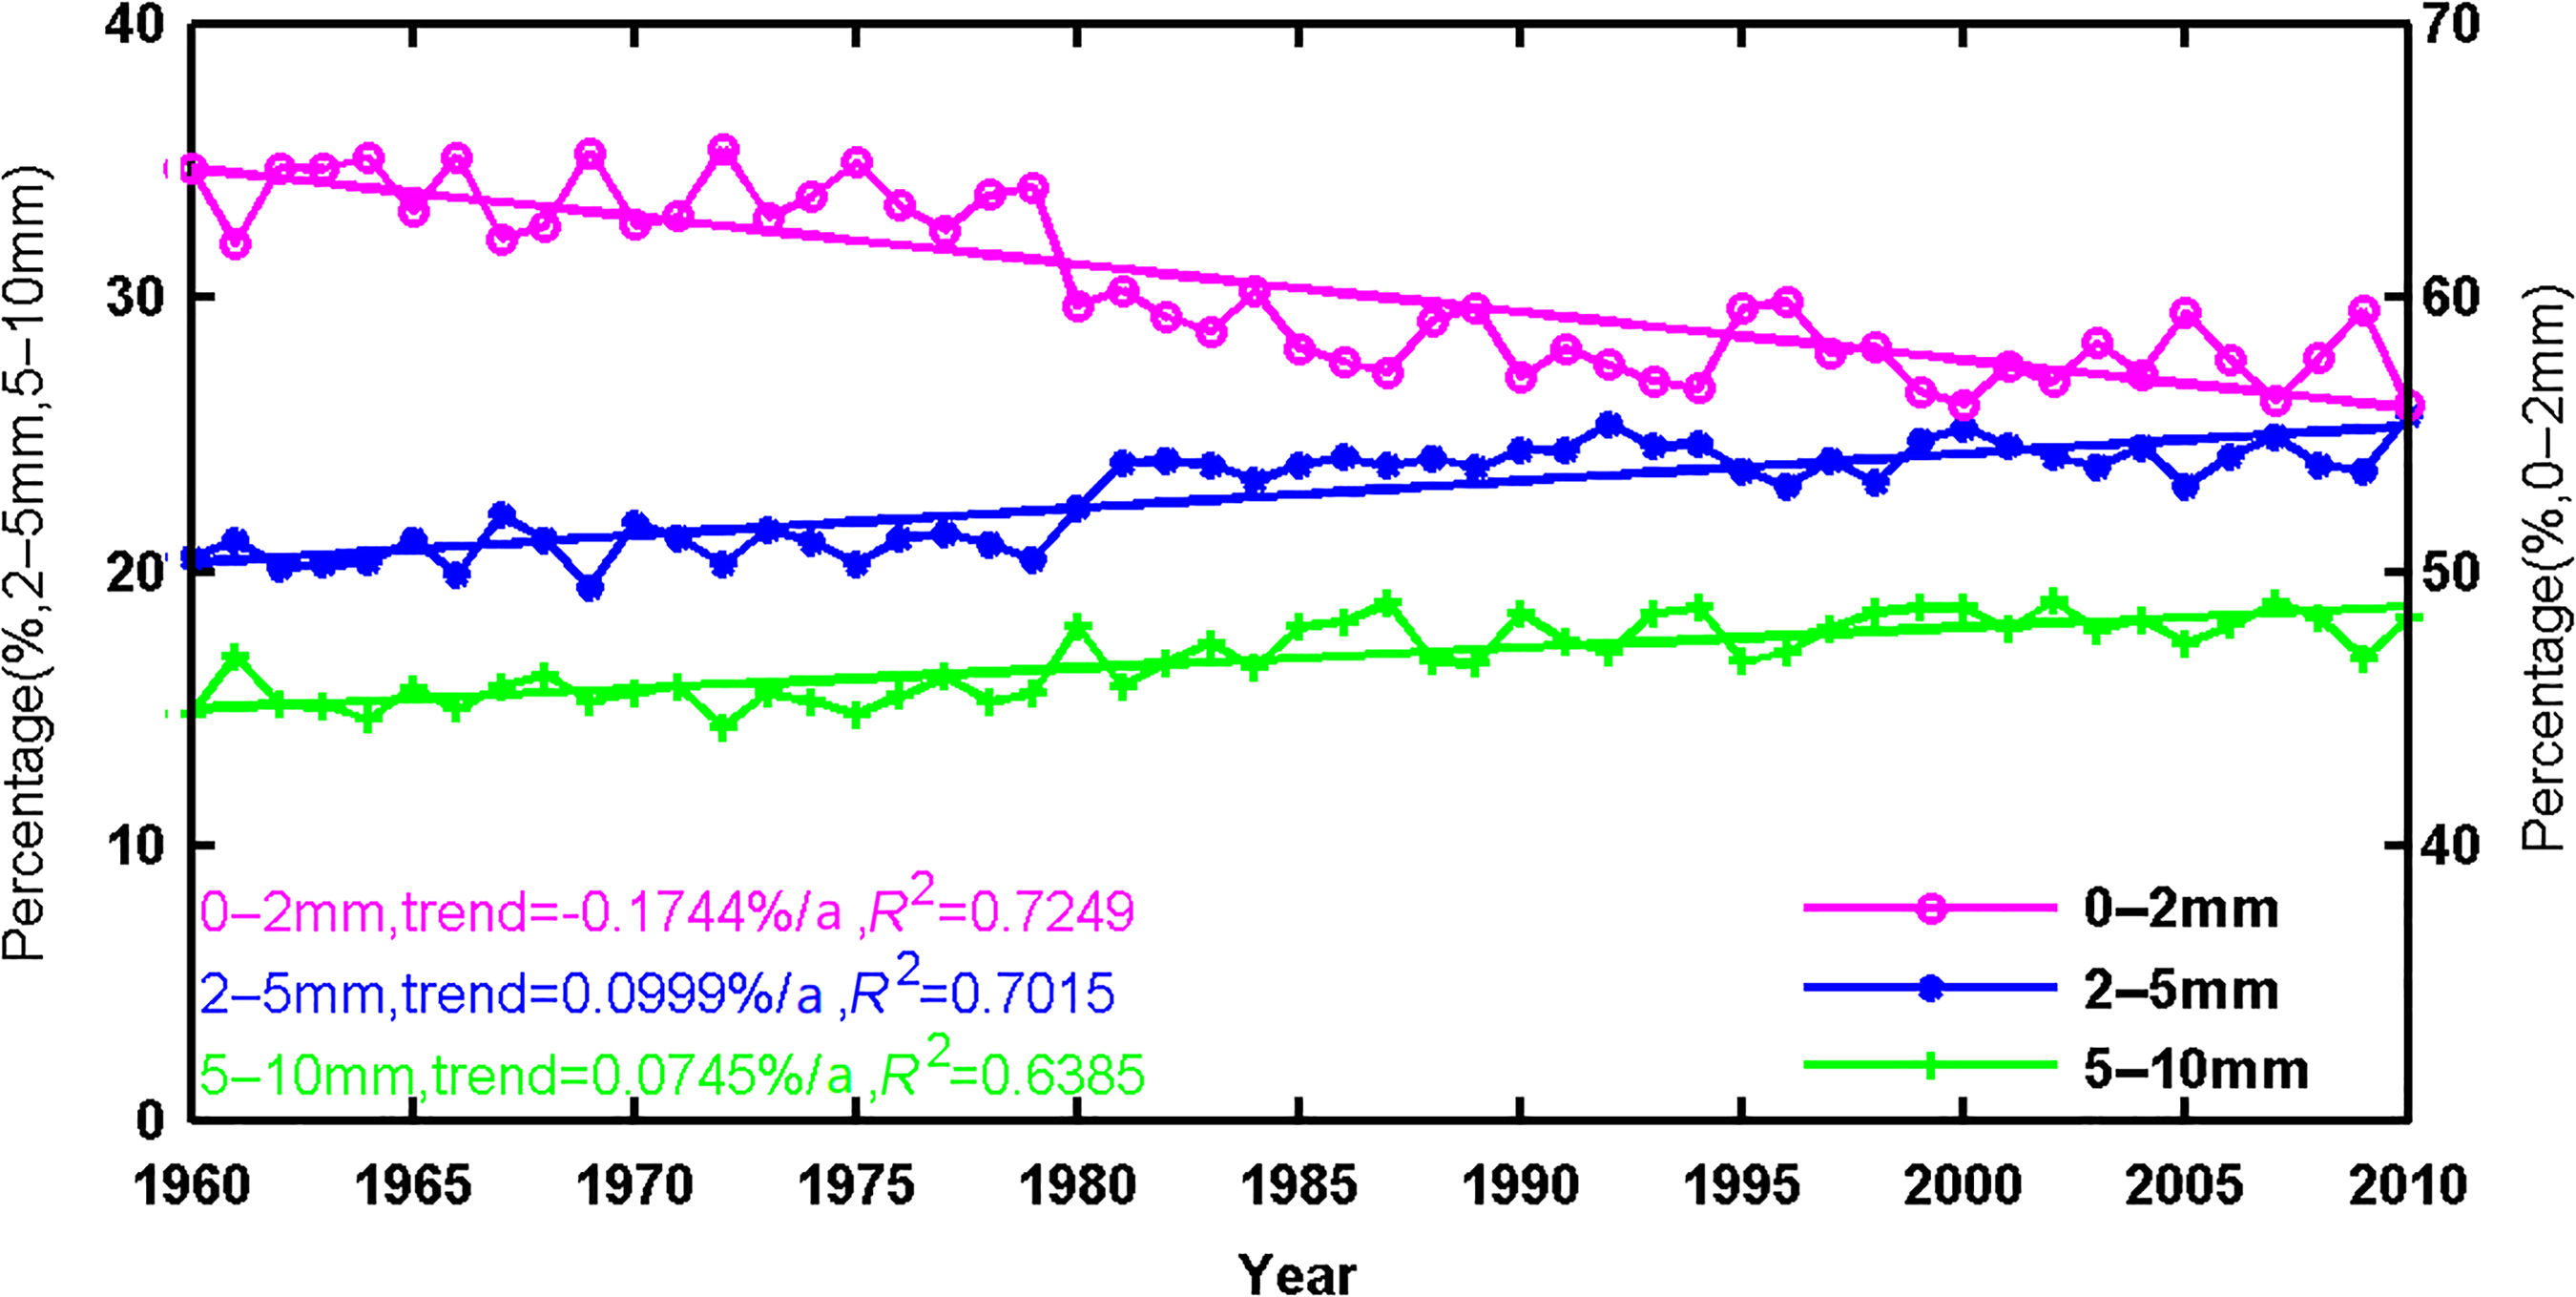
Linear trends of the percentage of light rain days at different magnitudes during 1960–2010.
2 Seasonal light rain changes
To understand the characteristics of light rain change in different seasons, the total number of light rain days in each month from 1960 to 2010 is calculated, and unary linear regression analysis is used to reveal the seasonal and annual light rain amounts and number of light rain days. The monthly change in the number of light rain days (shown in Figure 3) is in accordance with the characteristics of the probability of light rain days. A monthly averaged frequency of 0–2 mm rainfall reaches 6.89, which is larger than that of 2–5 mm and 5–10 mm rainfall amounts each month. The number of light rain days with 2–5 mm and 5–10 mm of rainfall is below four. In addition, the number of light rain days with 0–2 mm of rainfall includes two maximum values: 7.84 times in January and 7.47 times in October, while the frequencies of 2–5 mm and 5–10 mm light rain days reach maximums in June and July, respectively.
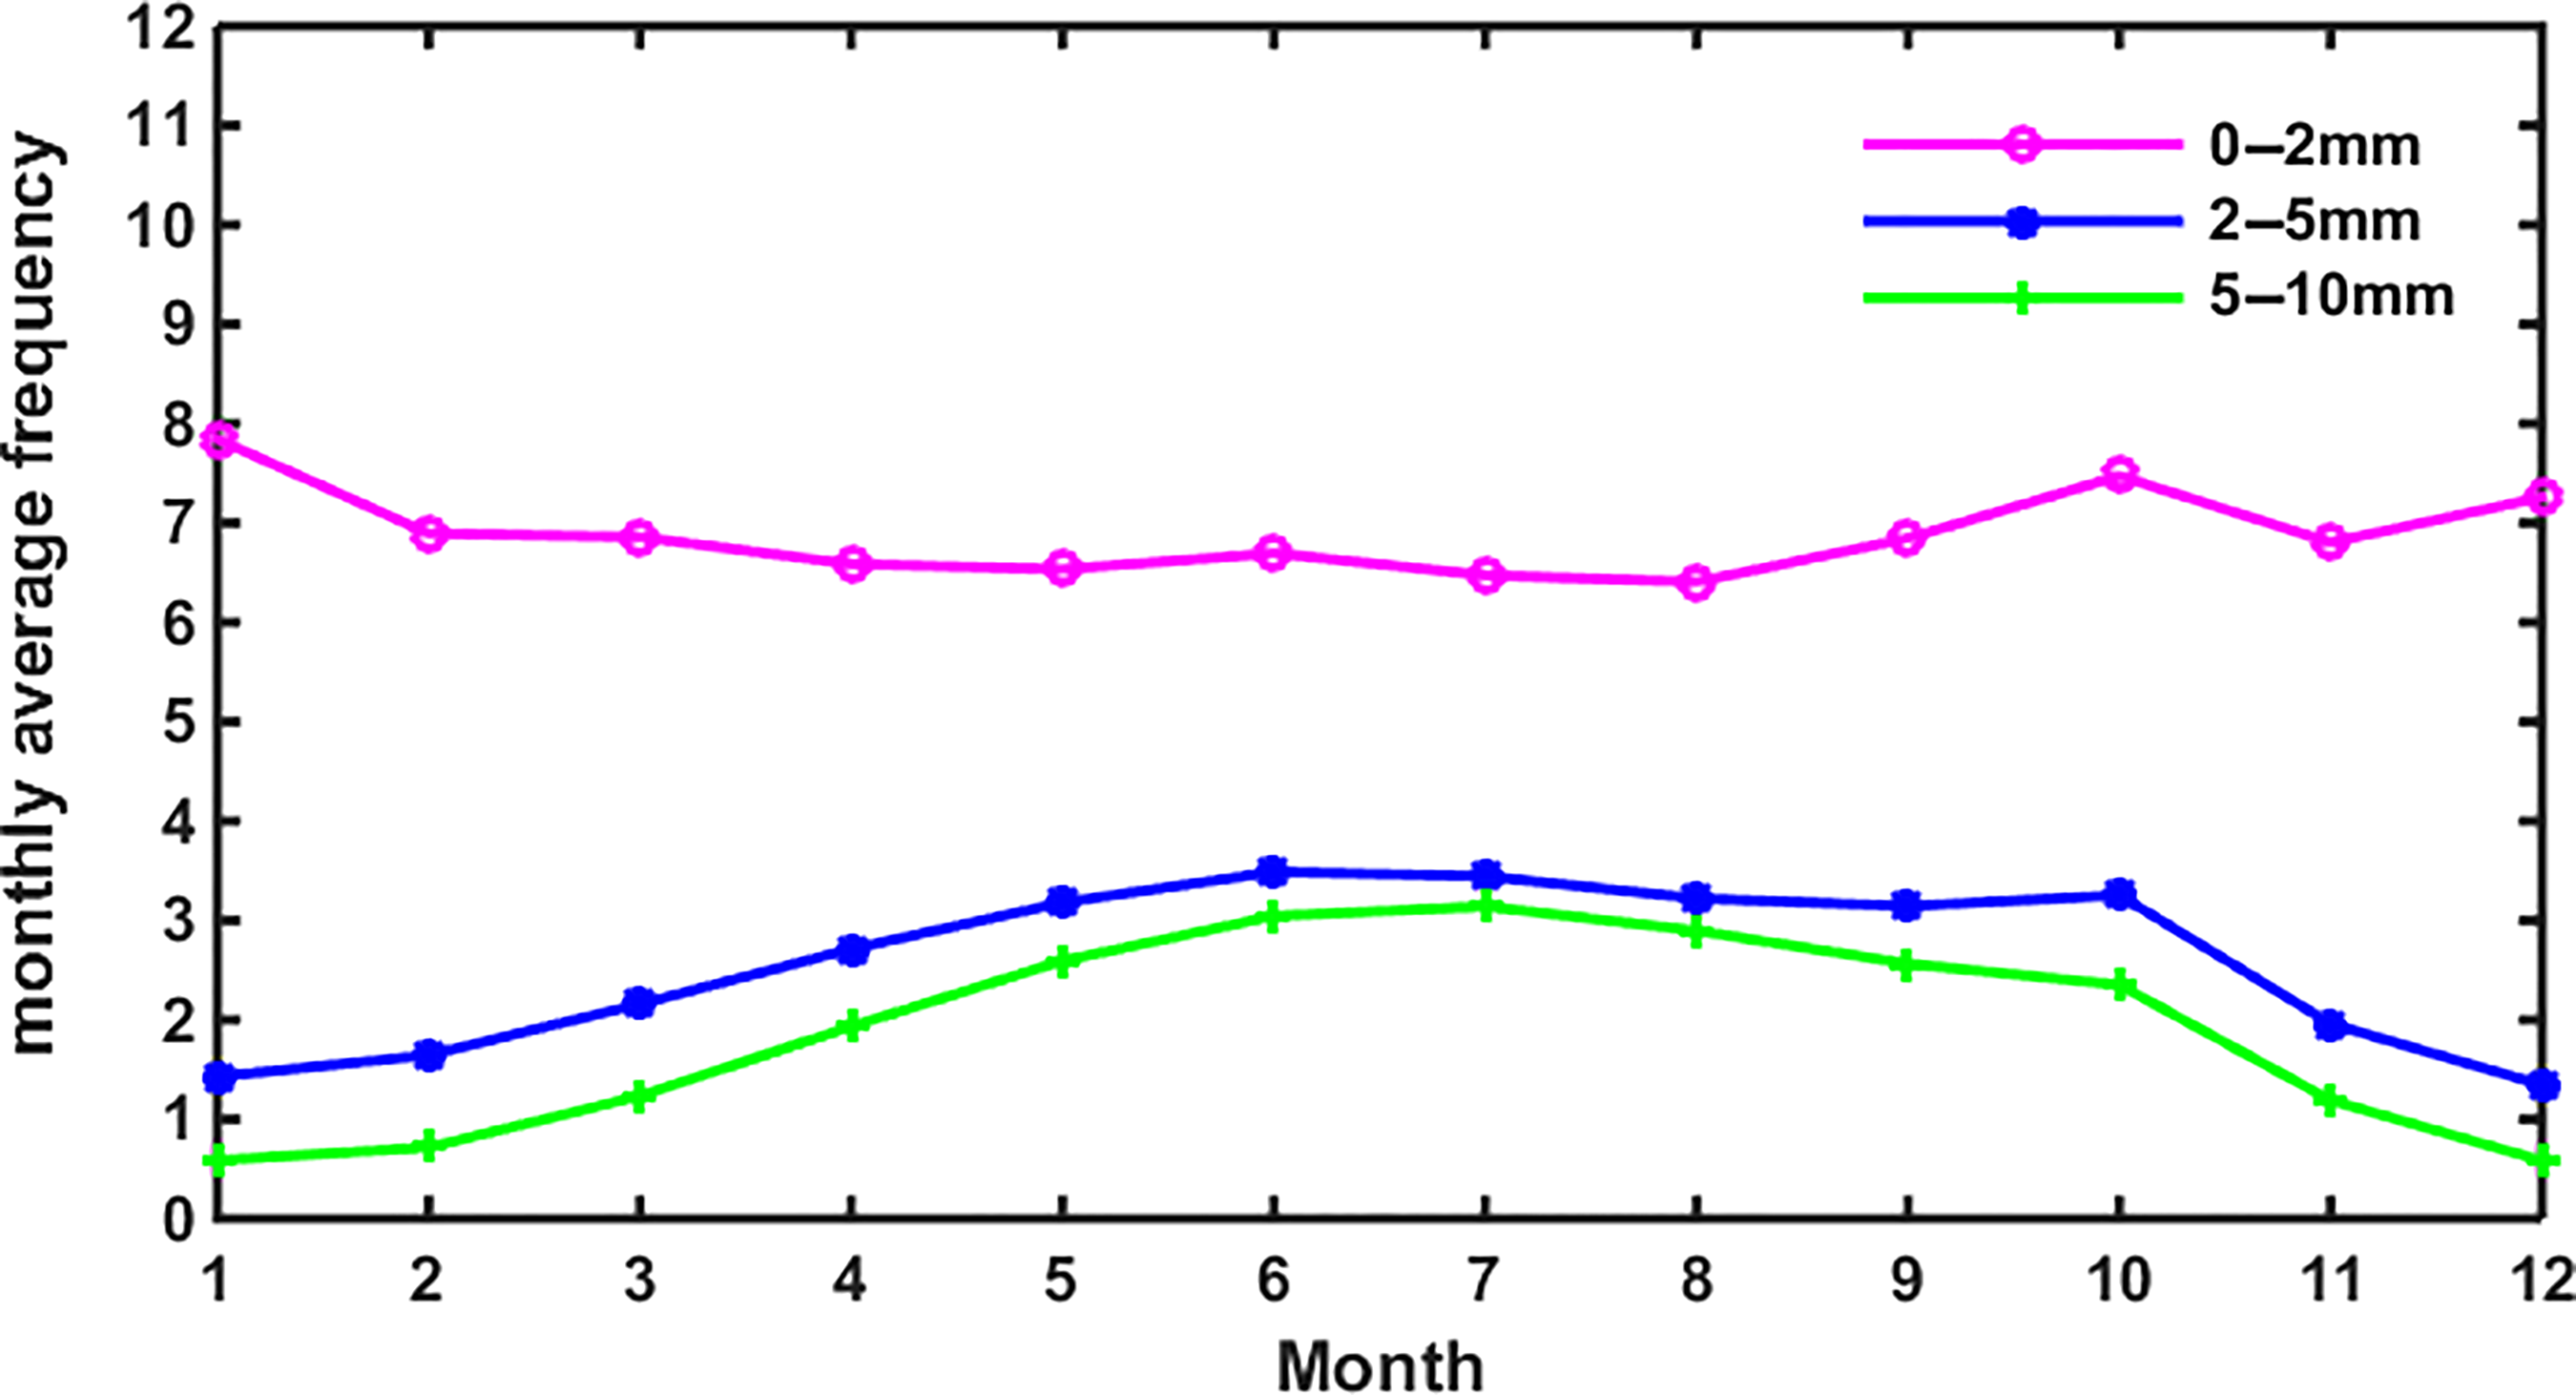
Monthly average number of light rain days at different magnitudes.
Temporal changes in light rain amount and the number of light rain days in different seasons from 1960 to 2010 are displayed in Figure 4. Meanwhile, the annual average and the trend coefficient for different magnitudes of rainfall in the four seasons are shown in Tables 1 and 2, respectively. Figure 4(a) shows that the light rain amount reaches its largest value of 120 mm in summer and its smallest value of 60 mm in winter. The light rain amount decreases in spring, summer, autumn, and winter, with linear trends of –0.037, –0.229, –0.370, and –0.062 mm/a, respectively, in which the most significant decreasing trend is found in autumn. Figure 4(b) shows that the seasonal average trends for light rain days are almost in accordance with the light rain amount, but the weakest decrease is in summer at a rate of –0.115 day/a, and the fastest decrease is in winter at a rate of –0.315 day/a. Similarly, the annual average light rain amount and number of light rain days with 2–5 mm and 5–10 mm of rainfall are the largest in summer and smallest in winter, while those with 0–2 mm of rainfall in four seasons exhibit little difference (Table 1). Both the light rain amount and number of light rain days with 0–2 mm, 2–5 mm, and 5–10 mm of rainfall in summer and autumn show significant decreasing trends with the coefficients (Table 2). The light rain amount and number of light rain days in winter show stronger inter-annual changes than those in the other seasons. In addition, the trend coefficients for light rain days are more significant than those for the light rain amount, which indicates that the daily rainfall amount has increased from 1960 to 2010.
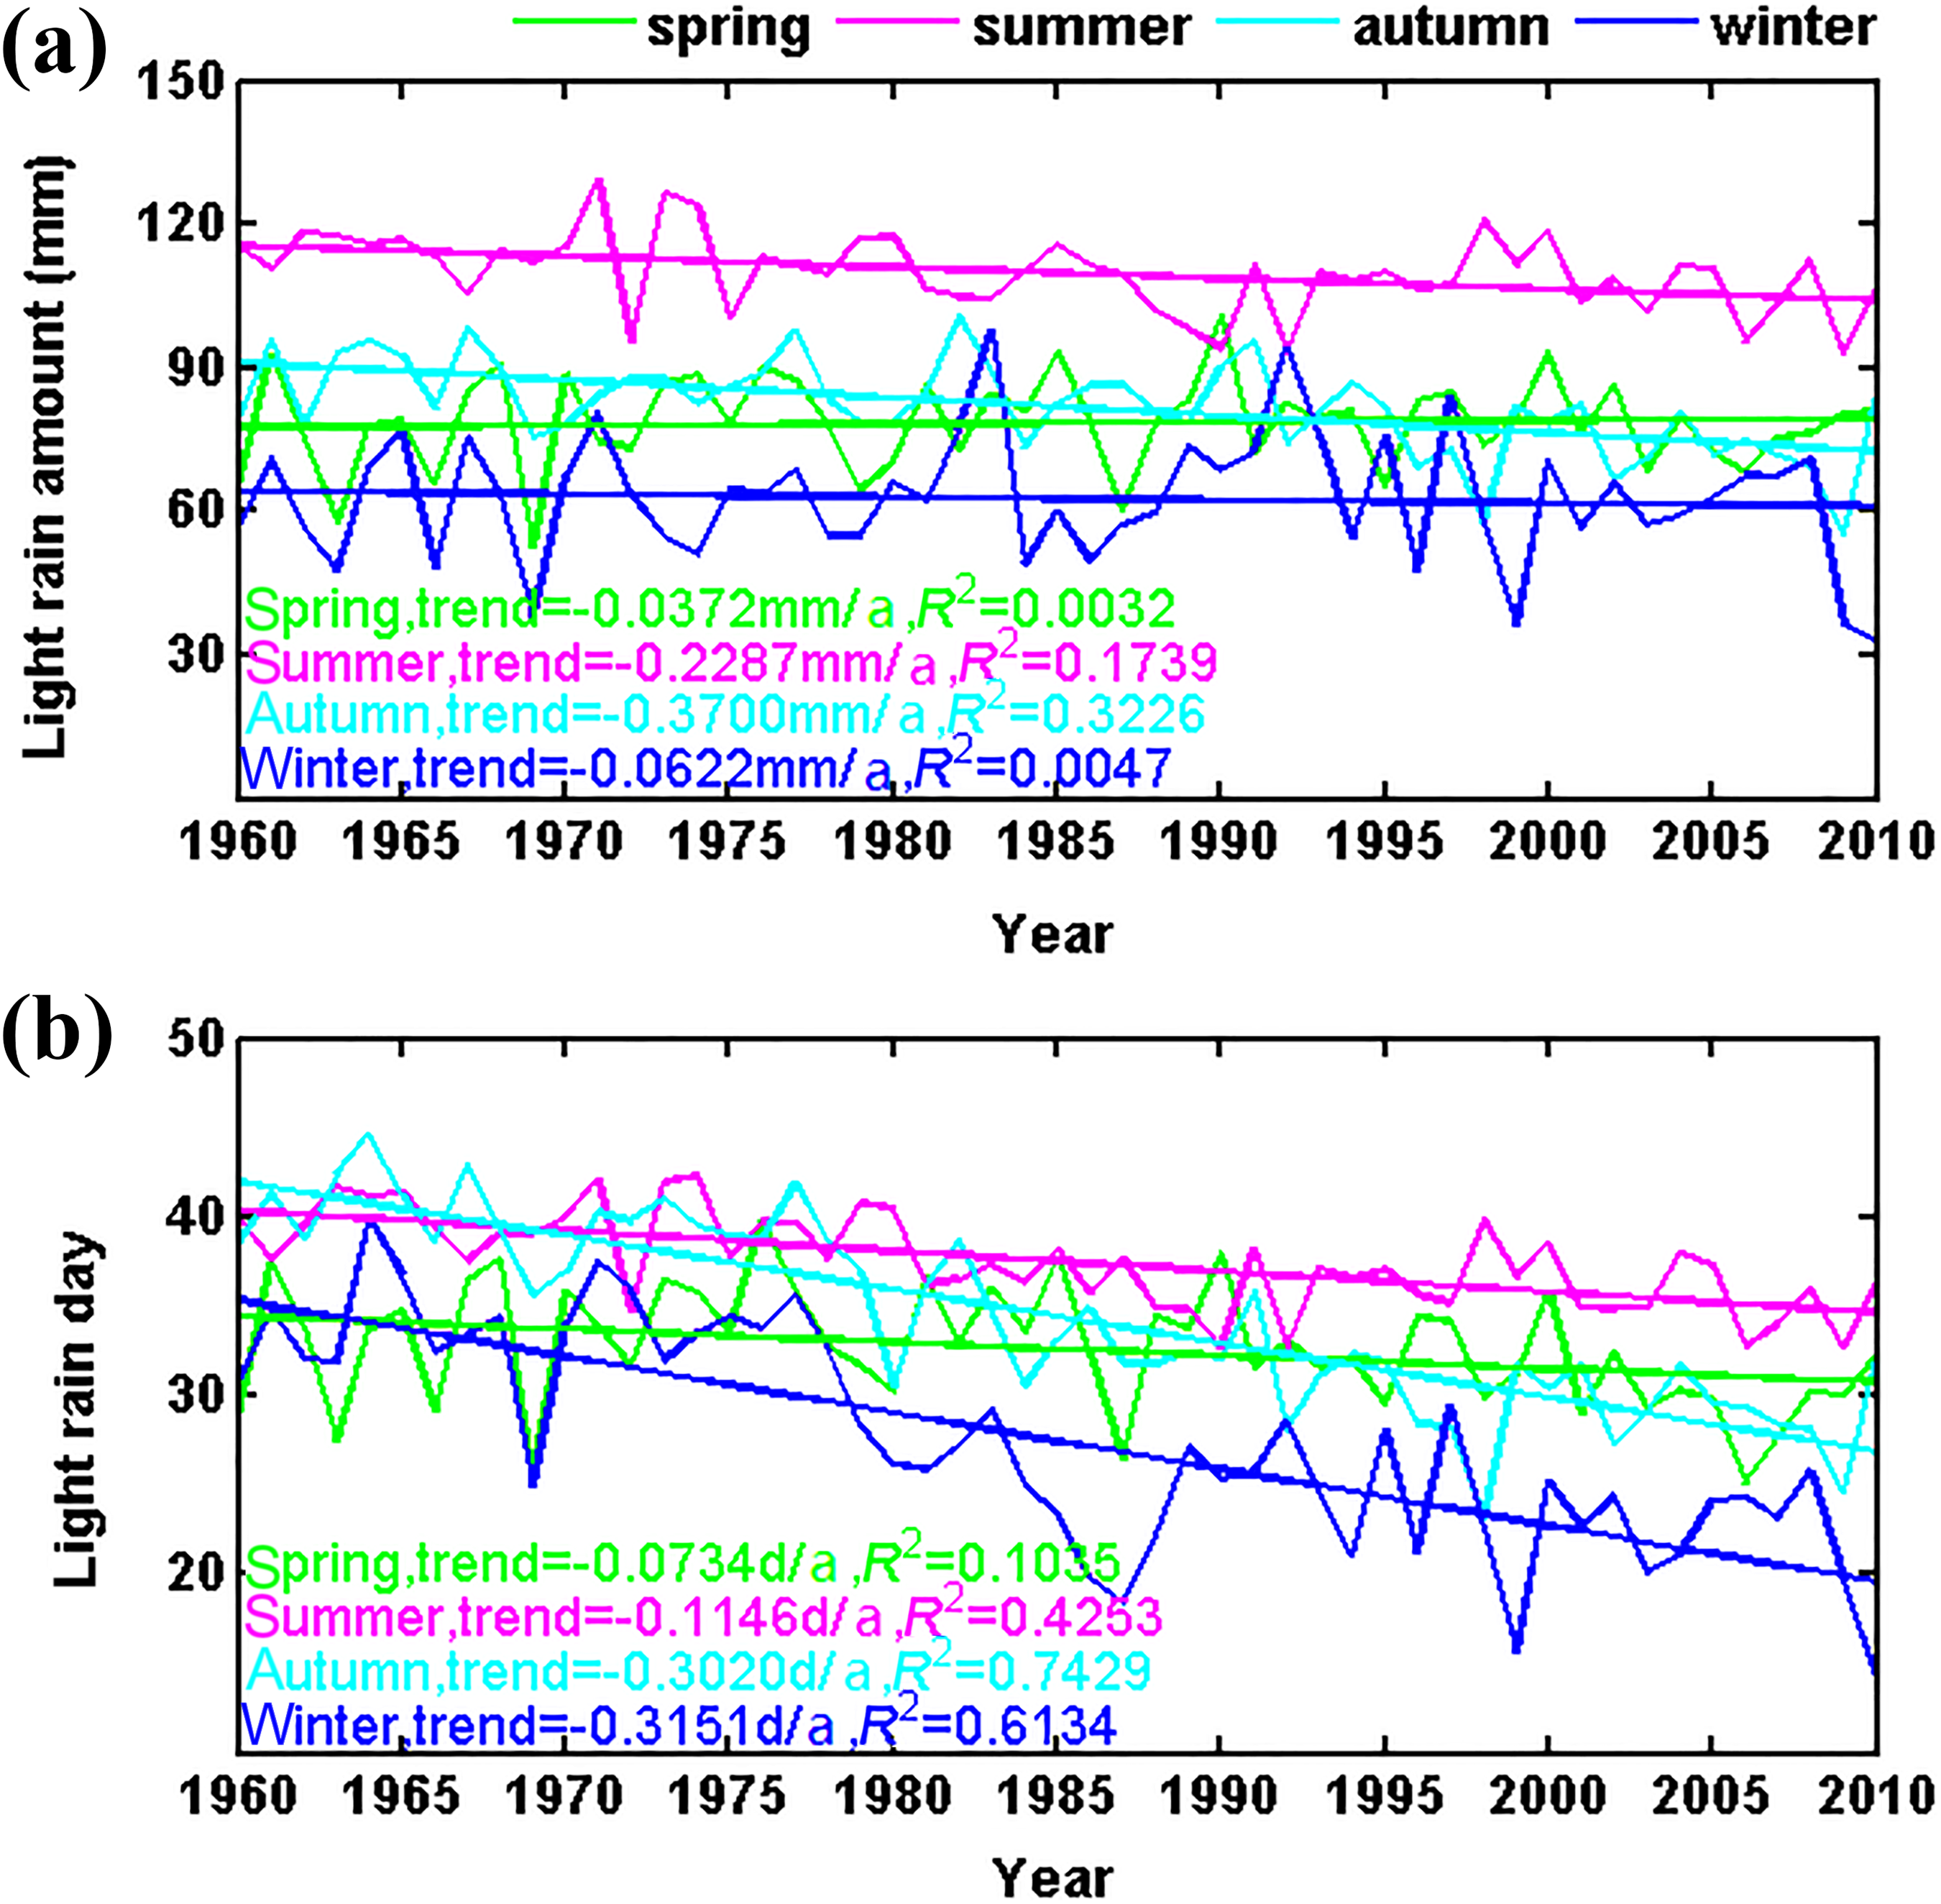
Linear trends of the light rain amount (a) and number of light rain days (b) in different seasons during 1960–2010.
The annual average light rain amount and number of light rain days with 0–2 mm, 2–5 mm and 5–10 mm of rainfall in four seasons during 1960–2010.
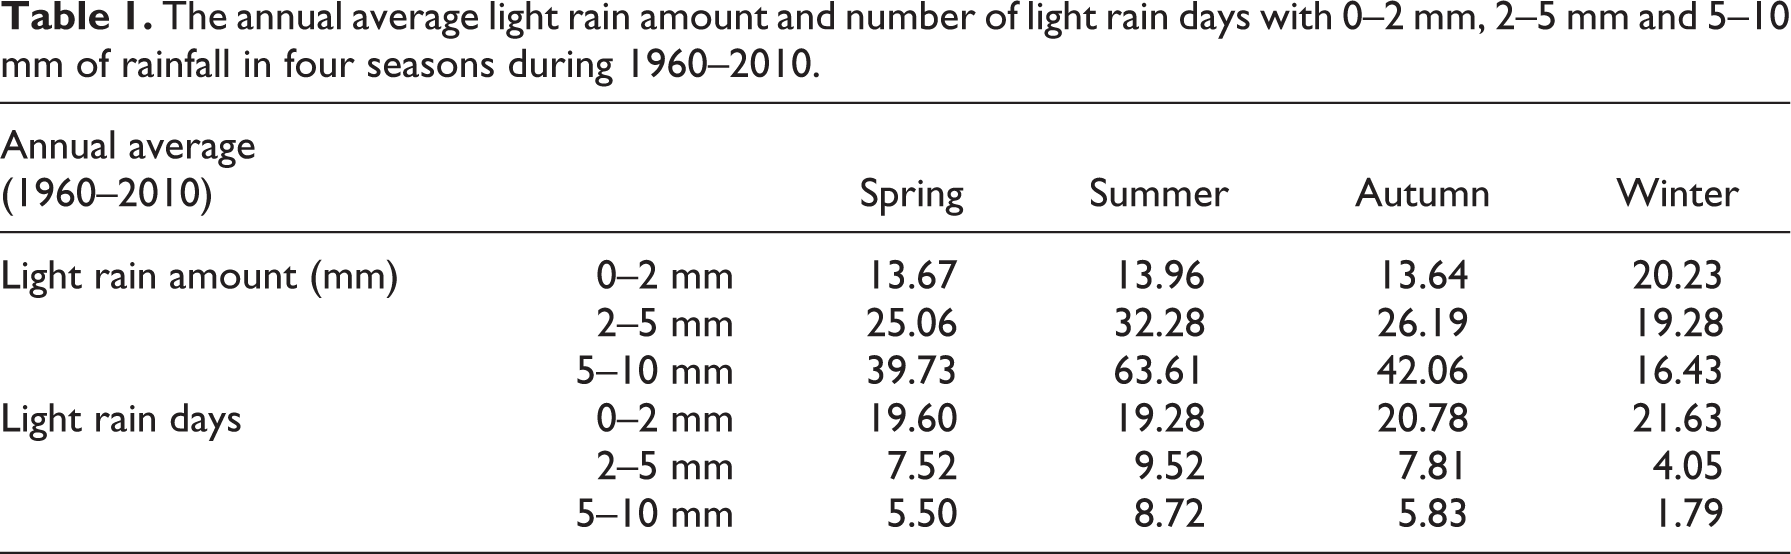
The trend coefficients of light rain amount and number of light rain days with 0–2 mm, 2–5 mm and 5–10 mm of rainfall in four seasons during 1960–2010.
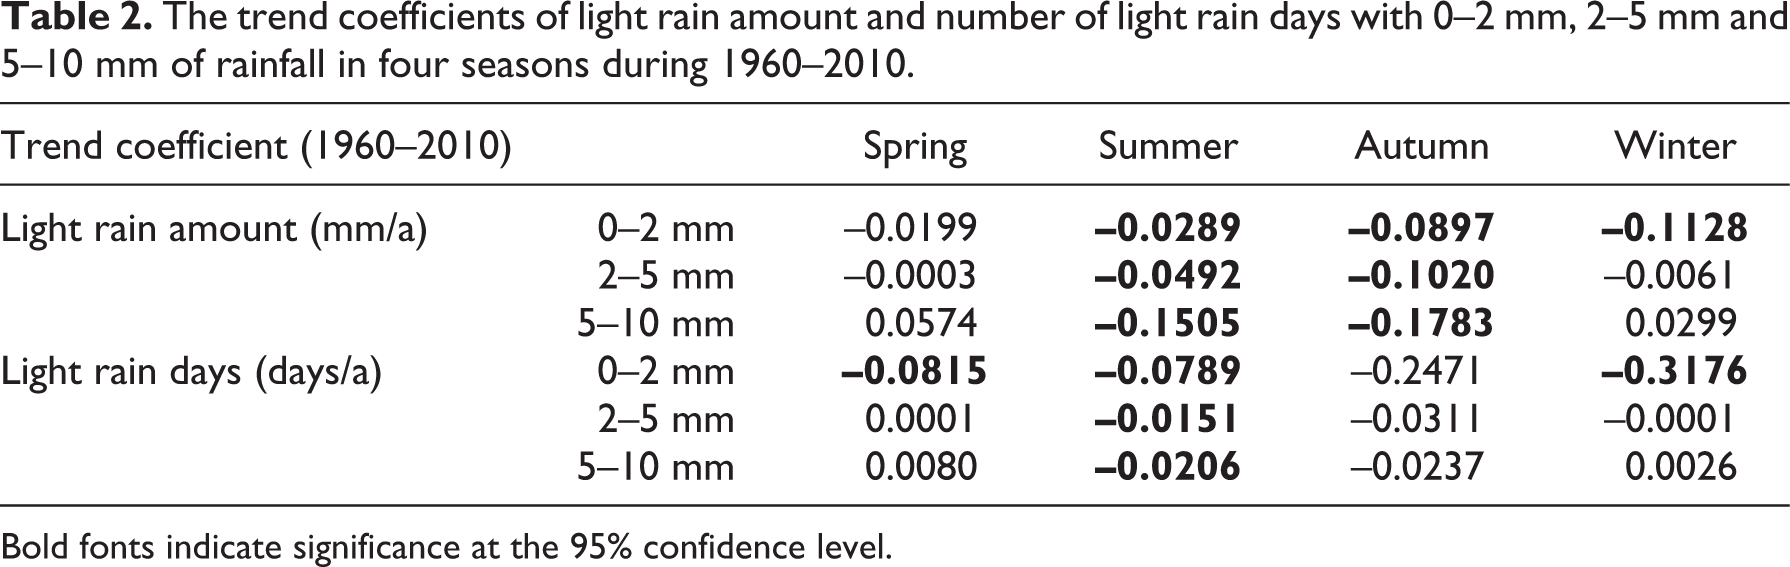
Bold fonts indicate significance at the 95% confidence level.
3 Discrete and consecutive light rain events
Figure 5 shows the temporal characteristics of the regionally averaged discrete and consecutive light rain events. It can be found that both discrete and consecutive light rain events have decreased during recent decades, in which the reduction in consecutive events is more significant than that in discrete events (Figure 5(a)). The linear trends of consecutive events reach –0.169/a from 1960 to 2010, while those of discrete events have a weak rate of –0.0319/a. Compared with discrete events, the annual fluctuation in consecutive events is more distinct. Before 1971, the number of consecutive events is higher than the number of discrete events, and vice versa.

Linear trends of the total light rain events (a), daily average amount (b), and total amount of discrete and consecutive light rain (c) during 1960–2010.
The daily average amount of light rain during discrete events is less than that in consecutive light rain events for the 0.1 mm threshold, but both of these events increase significantly with similar temporal characteristics at rates of 0.009 mm/a (discrete) and 0.008 mm/a (consecutive), as shown in Figure 5(b). The differences in the two types of light rain lie in their temporal characteristics: the daily average light rain amount in consecutive events remains at approximately 2.2 mm for the period 1960–1979 and increases to 2.57 mm in 1980, then is maintained at approximately 2.5 mm, while the daily average light rain amount in discrete events shows no significant fluctuation during the study period.
The trends of the total annual light rain amount during discrete and consecutive events show a significant difference (Figure 5c). The total amount of discrete light rain remains between 70 and 80 mm, with an increasing trend of 0.21 mm/a from 1960 to 2010, while the total amount of consecutive light rain is maintained at approximately 240 mm, with a decreasing rate of 0.82 mm/a from 1960 to 2010. The light rain amount in discrete events fluctuates slightly in the periods 1960–1973 and 1990–2010, followed by a distinct variation during 1973–1990, in which the minimal value of 63.51 mm is reached in 1988. In contrast, the light rain amount in consecutive events shows a distinct fluctuation from 1960 to 2010, with two minimum values of 195.19 mm in 1969 and 180.96 mm in 2009.
The spatial distributions of the linear trend coefficients for discrete and consecutive light rain from 1960 to 2010 and from 1979 to 2010 show similar characteristics. The temporal trends of discrete and consecutive total events, daily average amount, and total amount in most stations are similar to the regional average situation. The total number of discrete light rain events presents the characteristic of “increasing in the west and decreasing in the east”.
All of the aforementioned characteristics indicate that the reduction in the total light rain amount is mostly due to the reduction in the light rain amount in consecutive events. The frequency of consecutive events decreases significantly, while the daily light rain amount in both discrete and consecutive events increases from 1960 to 2010, which is consistent with the aforementioned conclusions: the daily average light rain amount increases, while the light rain frequency decreases. In addition, changes in the annual and seasonal light rain amount depend on changes in the number of light rain days in Southwest China, which is in accordance with the research of Wang et al. (2006) and Lin and Zhao (2009); whereas, the increase in the total light rain amount in discrete events is mainly caused by the increase in light rain intensity. The significant decrease of consecutive light rain events indicate that the circulation background of continuous light rain has changed a lot in recent decades. It is possible that the urbanization process, heat island effect, and greenhouse effect caused by human activities have changed the conditions for maintaining a stable synoptic system. However, the specific reasons need further research.
IV Causes of light rain reduction
The analysis of light rain changes in Southwest China indicates that both the light rain amount and the number of light rain days have obviously reduced over the last 50 years. To investigate the causes of light rain reduction, RH, PW content, and saturation water vapor pressure in the lower troposphere from 1979 to 2010 are calculated.
Suitable temperature and humidity conditions are necessary for the condensation of water vapor into droplets, but temperature and water content at different heights should have different influences on light rain changes. A significant correlation between low-level temperature, humidity conditions, and light rain events is revealed by Wu et al. (2015). Therefore, these two meteorological elements in the lower troposphere (from the surface to pressure levels higher than 680 hPa) are discussed in the following section.
The distributions of the linear trend coefficients of RH and the PW content in the lower troposphere, as well as temperature at the surface from 1979 to 2010, are shown in Figure 6. Both of the distributions show obvious decreasing trends in the eastern part of Southwest China, while in the southwestern part, the RH and PW show increasing trends that fail to pass the significant F-test at the 95% confidence level (Figure 6(a) and (b)). In addition, most stations in Southwest China increase with linear trends higher than 0.02°C/a, especially in the west of Southwest China (Figure 6(c)). The correlation analysis of different magnitude light rain days with RH and PW from 1979 to 2010 shows that the total number of light rain days (especially 0–2 mm rainfall events and discrete light rain events) in the eastern part of Southwest China is closely related to the RH and PW in the lower troposphere (with a correlation coefficient above 0.3). In accordance with the assumption that the water vapor content is stable, the RH would decline due to the increasing saturation vapor pressure, which is positively related to temperature; thus, rainfall events that might have occurred would be reduced according to the Clausius–Clapeyron equation (Trenberth et al., 2003).

Spatial distribution of the trend coefficients of RH (a), PW content (b) in the lower troposphere and temperature at surface (c) during 1979-2010. (The circles indicate significance at the 95% confidence level during 1979–2010).
Composite analysis is applied to analyze the relation between RH in the lower troposphere and the number of light rain days. According to the aforementioned criteria, the average differences in RH between more light rain years (1979, 1982, 1983, 1985, 1991) and fewer light rain years (1987, 1999, 2006, 2007) are shown in Figure 7(a), and the differences in the number of light rain days between higher RH years (1981, 1985, 1989, 1990, 1991, 1997) and lower RH years (1979, 1986, 1987, 2006, 2007, 2009, 2010) are shown in Figure 7(b). The average difference in RH in the lower troposphere between years with many and few light rain days reaches 1.76%, and the positive abnormal values in the eastern part of Southwest China are almost greater than 2%, which passes the significant t-test at the 95% significance level. The number of light rain days in higher RH years is greater than that in lower RH years, in which the statistically significant difference reaches 27 days in the eastern part of Sichuan Province, Chongqing Municipality, and the southern part of Yunnan Province. These results indicate that light rain days are more prevalent in those years with higher RH in the lower troposphere, especially in the eastern part of Southwest China, and vice versa. Meanwhile, there are similar changes among RH, the light rain amount, and the number of light rain days in Southwest China from 1970 to 2010, except for 1995 (Figure 8). In addition, RH and light rain fluctuate distinctly before 2000, followed by significant decreasing trends after 2000.

Composite analysis between the number of light rain days and RH in the lower troposphere (the dots in a indicate the difference in RH in the years with more and fewer light rain days, and the dots in b indicate the difference in light rain days between higher and lower RH years. The circles indicate significance at the 95% confidence level during 1979–2010).

Comparison of the standardized RH with the standardized light rain amount and number of light rain days during 1979–2010.
The EOF analysis is also applied to the light rain amount, light rain days, RH, and PW content in the lower troposphere, and the interpretation variances in the first two modes are 20.6% and 10.6%, 19.6% and 9.98%, 45.25% and 22.24%, and 71.35% and 18.36% for the light rain amount, number of light rain days, RH, and PW content, respectively. The first spatial mode of EOF analysis (EOF1) values of the four meteorological variables are almost positive in Southwest China, except for the number of light rain days in some areas across northern Sichuan. The main characteristics of the light rain amount and number of light rain days are that they have been affected by strong and weak value regions, while RH is strong in the southeastern area and the PW content is strong in the southwestern area (Figure 9(a), (e), (i), and (m)). By comparing the four first temporal modes of EOF analysis, (PC1s) of light rain amount, number of light rain days, RH, and PW content, the first three elements show similar decreasing trends, while the PW content reaches a minimum in 1984 (Figure 9(b), (f), (j), and (n)). These results indicate that the four meteorological variables decrease across all of Southwest China from 1979 to 2010. The second spatial mode of EOF analysis, (EOF2) values of the four meteorological variables show different characteristics: the light rain amount and the number of light rain days present a “positive–negative–positive” pattern from west to east in Southwest China, while the RH and PW content display a “southwest positive and northeast negative” pattern. The second temporal mode of EOF analysis, (PC2) values of these variables increase similarly with substantial fluctuation, and these values are almost negative before 1993 and positive after 1993, which indicates that the light rain amount and number of light rain days in Yunnan and Guizhou provinces are less than those in eastern Sichuan and Chongqing. At the same time, the RH and PW content in Yunnan are lower than those in Guizhou, Sichuan, and Chongqing from 1979 to 1993. In addition, there is more light rain in eastern Sichuan and Chongqing, and the RH and PW content is lower in Yunnan from 1993 to 2010.

EOF analysis (the first two EOFs and PCs): light rain amount (a~d), light rain days (e∼h), RH (i∼l), and PW content (m~p) during 1979–2010.
The aforementioned results indicate that there is a close correlation between the lower tropospheric RH and the number of light rain days from the period 1979–2010 over the eastern region of Southwest China. According to the Clausius–Clapeyron equation, the saturation vapor pressure increases with temperature, and the RH is determined by the specific humidity and saturation vapor pressure. The linear trend coefficients of the average temperature and saturation vapor pressure in the lower troposphere are 0.0274 K/a and 0.0312 hPa/a (Figure 10(a)) from 1979 to 2010, respectively. To distinguish the individual contributions of temperature and specific humidity to the variations in RH, the RH, calculated under the assumptions that only temperature (specific humidity) varies with time, and specific humidity (temperature) stays constant at its 1979 value, is denoted as RHT (RHq), while the RH calculated based on the variations in both temperature and specific humidity with time is denoted as RHT, q. In addition, the actual RH is taken from the ERA-Interim dataset, and a comparison of different contributions of RHT, RHq, and RHT, q is shown in Figure 10(b). RHT, RHT, q, and RH decrease, with trend coefficients of –0.0006/a, –0.0008/a, and –0.001/a, respectively. In addition, RHT, q and RHT present similar fluctuation characteristics compared with the actual RH, and the correlation coefficients of the actual RH with RHT, q and RHT are 0.917 and 0.683, respectively. On the other hand, RHq increases by 0.0003 per year from 1979 to 2010, and the correlation coefficient with RH is only 0.1303. As a result, the impact of warming is very important to the long-term reduction in RH in Southwest China.

Linear trends in temperature and the saturation vapor pressure in the lower troposphere (a), and RHT, RHT,q, RHq, and the actual RH (b) during 1979–2010.
V The influence of aerosols on light rain
All of these analyses focus on the impacts of temperature and humidity on light rain change; however, the potential influence of aerosols on light rain has not been analyzed. In this section, we focus on discussing whether aerosols significantly affect light rain events on the long-term scale in Southwest China from 2001 to 2010, due to the lack of AOD data before 2000. The method of comparing clean areas and polluted areas is adopted to explore the influence of aerosols on light rain.
We distinguish the clean (AOD less than 0.5) and polluted (AOD greater than 0.5) areas according to the spatial distribution of AOD from 2001 to 2010 in Southwest China. The trend coefficients of light rain days, AOD, and RH are calculated from 2001 to 2010 in Southwest China (Figure 11) to compare the influences of AOD and RH on light rain events. As shown in Figure 11(a), most stations in clean areas show light rainfall decreasing trends that fail to pass the significant F-test at the 95% confidence level, while several stations in polluted areas show increasing trends. At the same time, the AOD changes slightly and fails to pass the significant F-test at the 95% confidence level (Figure 11(b)). In addition, the mean trend coefficient of the AOD reaches 0.0029/a from 2001 to 2010. Figure 11(c) presents a similar distribution of the RH trend from 2001 to 2010 compared with that from 1979 to 2010, and shows that most stations in the eastern part of Southwest China experience significant decreases. This analysis indicates that both light rain days and RH decrease at most stations in Southwest China from 2001 to 2010, while the AOD decreases slightly, with trend coefficients from –0.004 to 0.004/a.

Linear trend distributions of light rain days (a), AOD (b), and RH (c) during 2001–2010. Grey regions indicates polluted area where AOD greater than 0.5 (The circles indicate significance at the 95% confidence level).
A composite analysis (Figure 12) is used to discover the relation between AOD and the number of light rain days. As shown in Figure 12(a), the AOD differences in more light rain years (2004, 2005) and fewer light rain years (2006, 2007) are negative in polluted areas in the Sichuan Basin and positive (above 0.02) in the clean areas, respectively, in which few areas pass the significant t-test at the 95% confidence level. At the same time, the difference in the number of light rain days between higher AOD years (2006) and lower AOD years (2004, 2010) is negative and fails to pass the t-test, as shown in Figure 12(b). Therefore, the composite analysis illustrates that there is no significant correlation between the AOD and the number of light rain days from 2001 to 2010.
Time series of the AOD (a), light rain days (b), and light rain amount (c) in clean and polluted areas during 2001–2010 (the rectangles indicate significance at the 95% confidence level).
The comparison among the AOD temporal series, light rain amount, and number of light rain days between clean and polluted areas from 2001 to 2010 is shown in Figure 13. Significant differences in AOD between clean and polluted areas can be found (Figure 13(a)), and the AOD shows a slight annual variation in both clean and polluted areas. The annual mean AODs in clean and polluted areas are 0.3 and 0.6, respectively, and their differences over the entire time period pass the significant t-test at the 95% confidence level. On the other hand, the light rain amount and number of light rain days show no significant difference between clean and polluted areas, and they present similar time variations from 2001 to 2010. The mean annual value of the number of light rain days in both clean and polluted areas is 115 days, and only the difference in the number of light rain days in clean and polluted areas in 2009 (10.95 days) is significant according to a t-test at the 95% confidence level (Figure 13(b)). The light rain amount in polluted areas is slightly higher than that in clean areas, except in 2003 and 2009, but only the differences in 2002 (23.35 mm) and 2007 (17.77 mm) are significant according to a t-test at the 95% confidence level (Figure 13(c)).
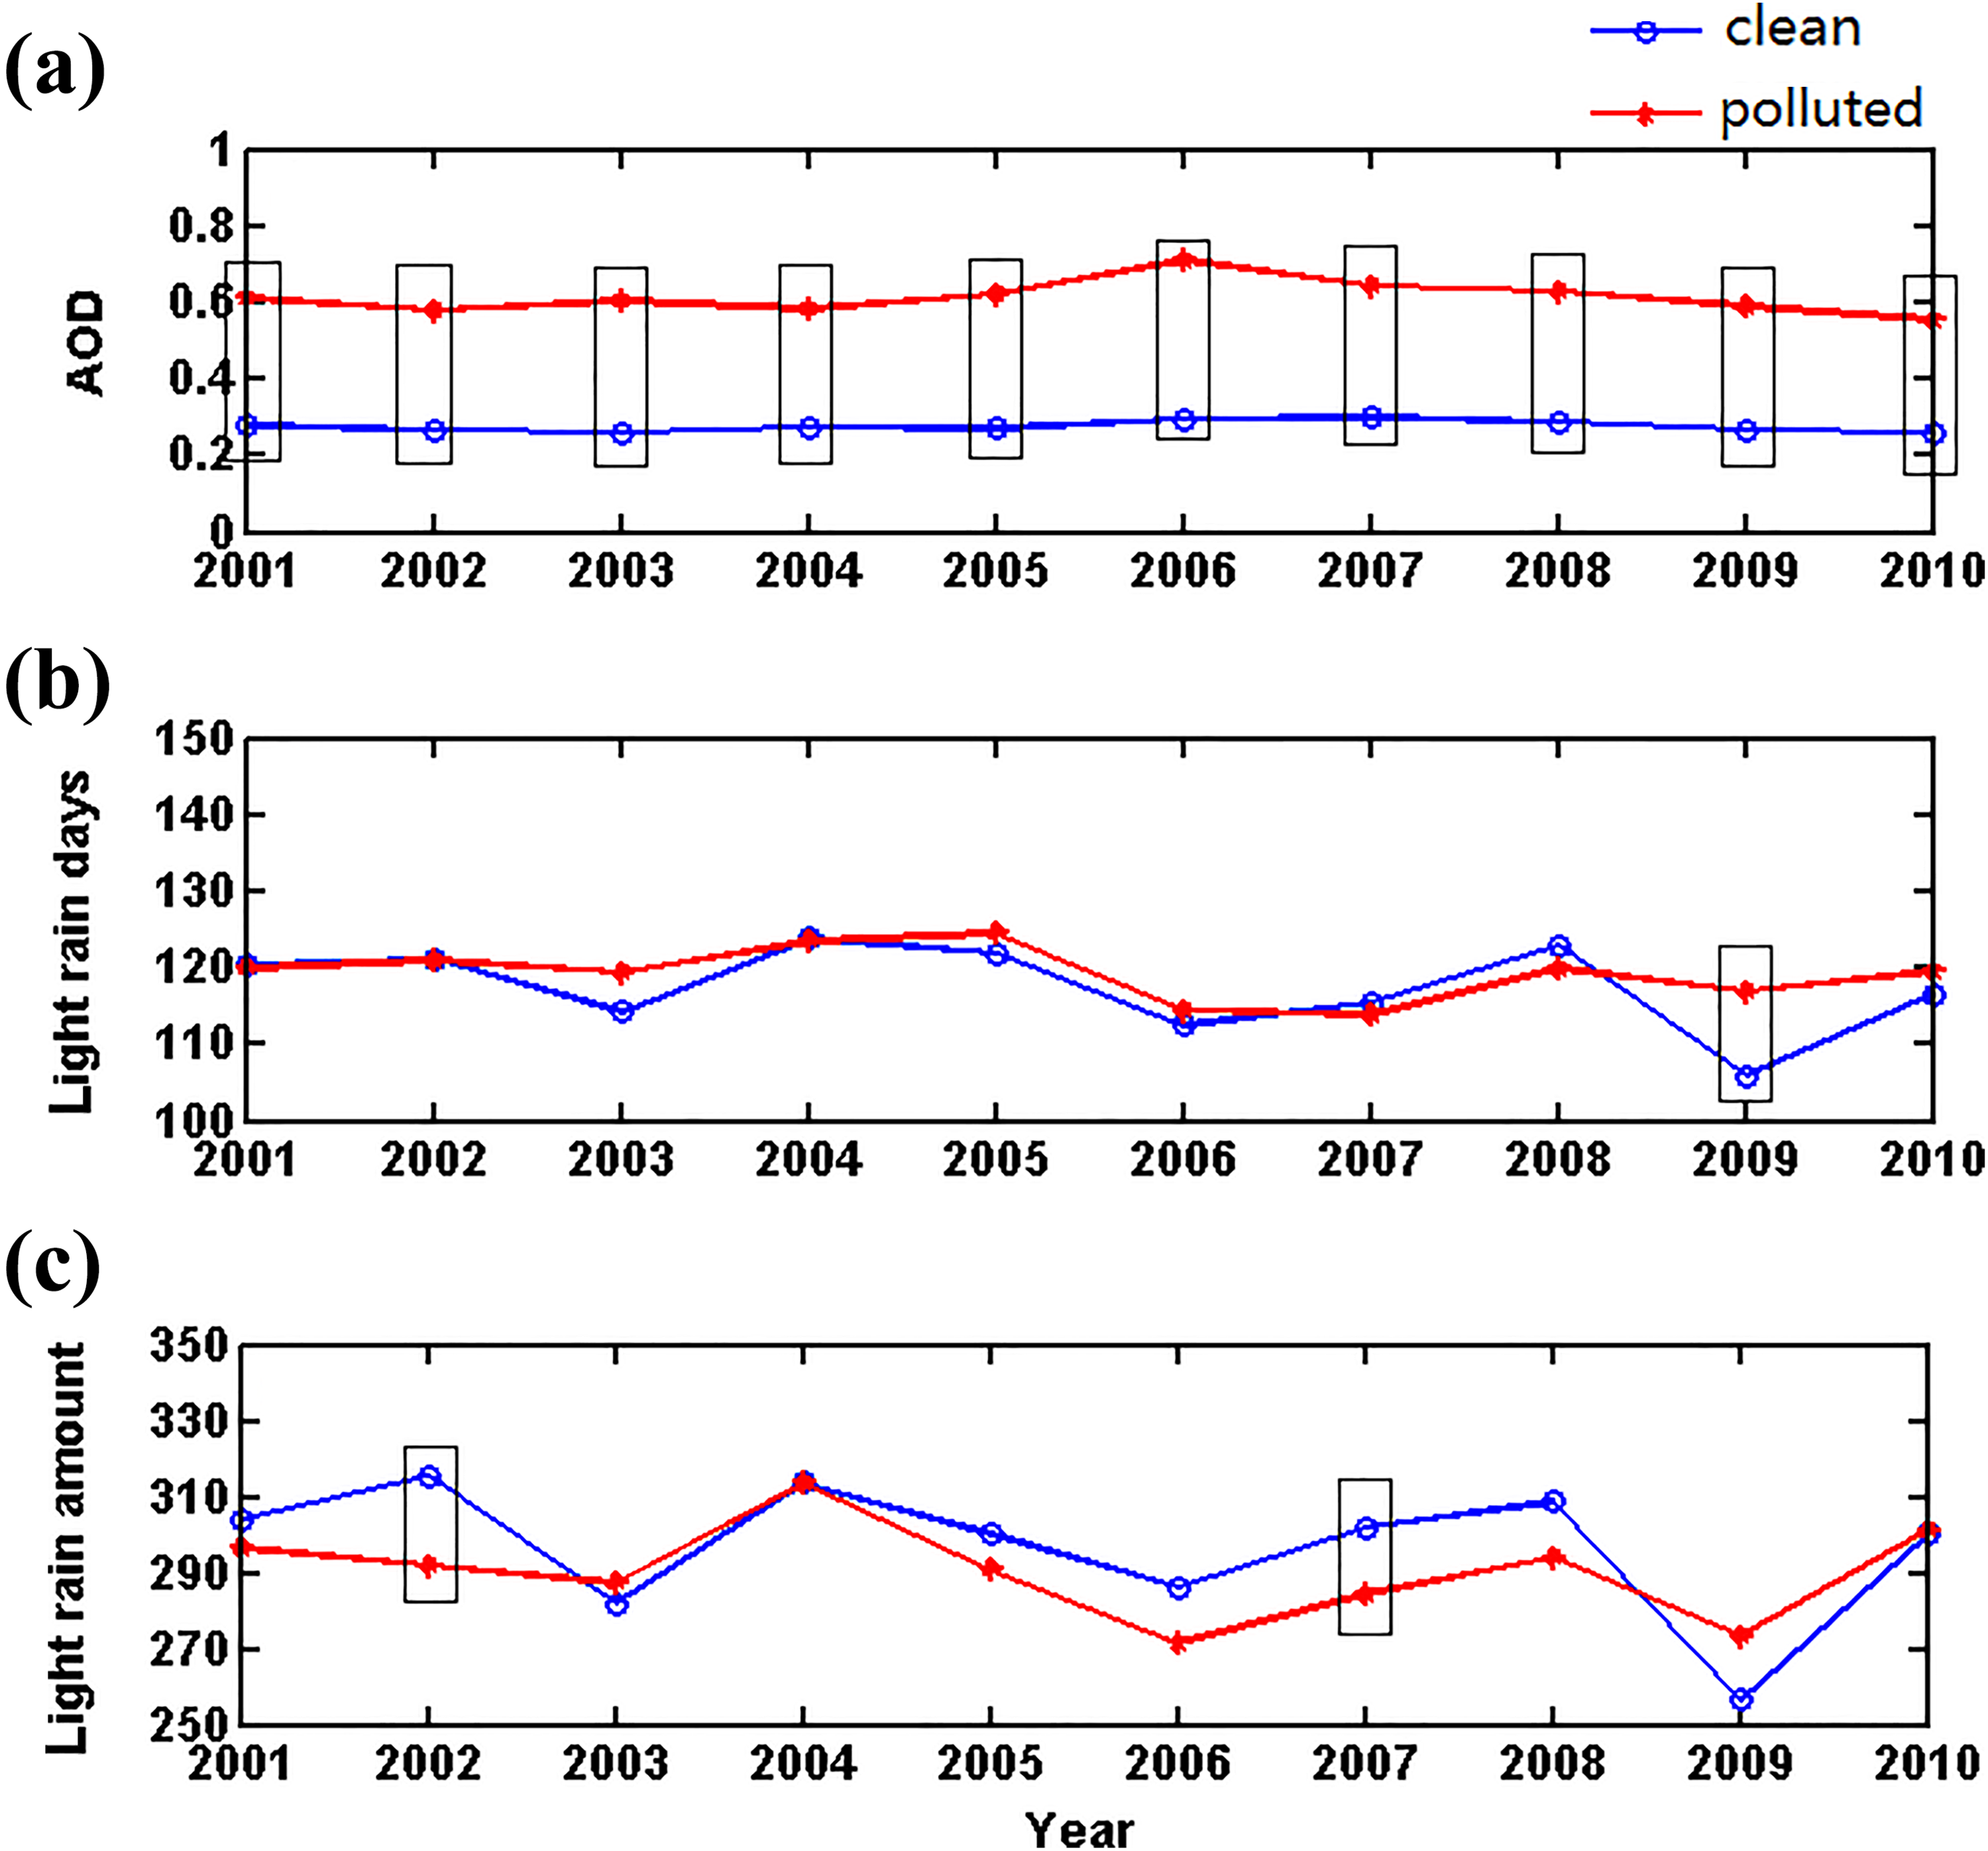
Time series of the AOD (a), light rain days (b), and light rain amount (c) in clean and polluted areas during 2001–2010 (the rectangles indicate significance at the 95% confidence level).
Although the light rain changes in the polluted and clean areas present some differences, these differences do not pass the significance test. In addition, the light rain amount in polluted areas is slightly higher than that in clean areas in almost all years. Therefore, aerosols should not be regarded as the most important factor that suppresses light rain events over a long-term scale. On the other hand, the longest and most reliable AOD data can only be dated back to 2000, which also restricts exploring the influence of aerosols on light rain reduction at the interannual scale, despite some supporting evidence found at the weather time scale from some short-term observations and numerical simulations (Rosenfeld, 2000; Rosenfeld et al., 2001, 2007, 2008).
VI Conclusions
We discuss the characteristics of light rain change from different aspects, including magnitude, season, and type in recent decades, using daily precipitation data from 67 stations in Southwest China. The RH, PW content, and saturation vapor pressure in the lower troposphere are calculated based on temperature and humidity data from the ECWMF, and AOD data are from MODIS, all of which are used to investigate the cause of light rain change. The main conclusions of the study can be summarized as follows: Both the light rain amount and number of light rain days with 0–2 mm, 2–5 mm, and 5–10 mm of rainfall decrease at most stations from 1960 to 2010 in Southwest China, but there are more stations with increasing trends in 0–2 mm light rain compared to those with 2–5 mm and 5–10 mm of light rain. The regionally averaged trend coefficients of the light rain amount and number of light rain days are –0.62 mm/a and –0.81 day/a from 1960 to 2010, and –0.95 mm/a and –0.65 day/a from 1979 to 2010, respectively. The number of light rain events are mainly distributed within the 0–2 mm rainfall category, accounting for approximately 70% of the total number of light rain events. The average frequency of 0–2 mm light rain days is approximately seven times every month at each station in Southwest China, while the frequencies of 2–5 mm and 5–10 mm light rain days are less than six, with higher values in the summer (June, July, and August). Both the light rain amount and number of light rain days decrease throughout the four seasons from 1960 to 2010, and their maximum and minimum values are found in summer and winter, respectively. The average annual discrete and consecutive light rain events have decreased in recent decades, while consecutive light rain events have presented more significant decreases. In addition, the light rain amount during discrete and consecutive events has displayed a decrease in consecutive events and an increase in discrete events. In addition, the daily average amount of consecutive light rain exceeds that of discrete events by 0.3 mm, and the rainfall amounts in consecutive and discrete light rain events have increased significantly. The RH and PW content in the lower troposphere decrease significantly in the east of Southwest China, and the results of the composite analysis and EOF analysis indicate that there is a close relationship between the number of light rain days and the humidity condition in the east of Southwest China; the reason causing this reduction in RH can be attributed to warming. There is no sufficient evidence to prove the significant influence of aerosols on the reduction in light rain events in Southwest China at the inter-annual scale.
According to our analyses, we find that the light rain decrease in Southwest China is mainly caused by the combined changes in water vapor content and warming in the lower troposphere. There has not been any further analysis to determine the cause of light rain changes in terms of different magnitudes, different seasons, and different types of rain; in addition, the light rain reduction in Yunnan cannot be well explained using water vapor and warming and needs further study. The influence of the aerosols on light rain events is discussed at the inter-annual scale because daily AOD data are lacking in Southwest China on the long-term scale. Therefore, the conclusion that light rain events are not influenced by the aerosols in this section is only suitable for the long-term scale, and whether the aerosols affect light rain events on the short-term scale needs further research. According to previous and present researches, the reduction in light rain in China (including both polluted and clean areas) is mainly caused by warming, which provides the main correlation factor for predicting the long-term changes of precipitation in other regions of the globe.
Footnotes
Acknowledgement
We thank all of the dataset providers.
Declaration of conflicting interests
The author(s) declared no potential conflicts of interest with respect to the research, authorship, and/or publication of this article.
Funding
The author(s) disclosed receipt of the following financial support for the research, authorship and/ or publication of this article: This work is supported by the Chinese National Science Foundation (Grant Numbers 41275162, 41675149, 41775087, and 41875178) and the National Key R&D Program of China (Grant Number 2018YFA0606004). This work is also supported by the Chinese Jiangsu Collaborative Innovation Center for Climate Change, and the Program for Key Laboratory in University of Yunnan Province.