
Abstract
A submarine eruption in Cumberland Bay, Robinson Crusoe Island, was reported by Thomas Sutcliffe, the former British Governor, shortly after the earthquake that struck the coast of Chile on 20 February 1835. This episode was described by Charles Darwin in his Voyage of the Beagle and extensive mention has been made since then, especially stimulated by a renowned painting by J.M. Rugendas. Because of the apparent causal relation, this event has also been widely cited as an example of remote tectonically triggered eruption. However, there are inconsistencies that pose doubts about the actual occurrence of an eruption. Here we present evidence against the hypothetical eruption based on both the absence of any geological evidence and a reinterpretation of the historical accounts. We first observe that no bathymetric anomaly is present immediately below the place of the depicted ‘eruptive column’. We also note the absence of any deposit or recent volcano morphology and then unravel some incompatibility between the expected volcanological parameters and the featured column. In addition, we analyse the historical records and conclude that they are compatible with a tsunami entering the bay. By means of numerical simulations we further demonstrate that the accounts well match with the expected behaviour of a distant earthquake-triggered tsunami. We infer that some tsunami-related processes (sound waves, rockfalls, lightning) may have been misunderstood at that time. The latter corresponds to the current knowledge of natural processes but also could have been deliberatively amplified in Sutcliffe’s report. Our multidisciplinary approach provides full consistent geographical evidence of a fact that did not happen. This finding is relevant from the hazard’s perspective, but also for the science of earthquakes and eruptions, or the knowledge of processes that control the late secondary volcanism at oceanic islands and seamounts.
I Introduction
On 20 February 1835, an earthquake of estimated magnitude ∼8.0–8.5 (Cisternas et al., 2010; Lomnitz, 2004; Ramírez, 1988) took place off the Concepción area, in Central Chile. The effects of the megathrust earthquake and tsunami were described by Charles Darwin (Darwin, 1835, 1840), who was in southern Chile at that time and visited the Concepción area shortly after the event. The post-earthquake and tsunami survey allowed him to appreciate the extent of damage along the rupture zone and hence the magnitude of the event (Darwin, 1835, 1851). He recorded coseismic uplift and maximum tsunami heights. In addition, Darwin experienced directly the reawakening of the Osorno Volcano, which erupted on 12 January
Shortly after the

Location map for San Juan Bautista village and Cumberland Bay area. Left panel shows Robinson Crusoe Island in the context of the Juan Fernández Ridge and the continental margin. Rupture of the
Questions about this eruption have a wide impact on hazards issues, beginning with the status of Robinson Crusoe Island as an active volcano as listed in some global records (e.g. Siebert et al., 2010). Given that the most recent eruptive activity dated in c. 800 ka (Reyes et al., 2017), Robinson Crusoe Island should be no longer considered as an active volcano and consequently deleted from the national or regional catalogues (e.g. Gonzalez-Ferrán, 1995; Lara et al., 2011), and thresholds and mechanisms for remote triggering of volcanic eruptions by distant earthquakes (e.g. Eggert and Walter, 2009; Watt et al., 2009) should not consider this as an example. The main goal of the present article is to show evidence to discredit this eruption based on (a) absence of geological evidence of products or effects of any eruptive activity; (b) incompatibility of such an event with prevailing physical conditions; (c) a critical review of the historical sources; and (d) evidence of an earthquake-triggered distant tsunami as an alternative explanation. This contribution takes a multidisciplinary approach of physical geography and also shows how biased the historical record could be and to what extent political or historical context can influence the understanding of natural processes and ultimately the perception of risk.
II Material and methods
We used an eclectic approach taking advantage of several methods and types of data. Historical sources (paintings and reports) were scrutinised by formal historiographical methods. Geological evidence (or its absence) was investigated through both the surface reconnaissance and mapping of the coastal area and the study of bathymetry. Global bathymetry (e.g. GMRT at www.GeoMapApp.org) is not detailed enough to explore the seafloor in search of geomorphological signatures of any recent eruptive activity. Instead, we used data from a multibeam bathymetric survey produced by a private company under contract for the Preparatory Commission for the Comprehensive Nuclear Test-Ban-Treaty Organization (www.ctbto.org). This is a 6 m resolution survey that covers part of the area of interest, which corresponds to Cumberland Bay and nearby.
In addition, forensic analysis of the paintings was conducted using a photogrammetric study performed with photos of the Cumberland Bay area taken with a conventional digital camera and processed with Agisoft Photoscan Professional software (v. 1.3.1; www.agisoft.com), one of the most widely used in the community of Earth sciences (e.g. Tavani et al., 2014; Triantafyllou et al., 2019; Verhoeven, 2011). This approach is based on the Structure from Motion (SfM) technique, which relies on the projection of tie-points recognised across a set of overlapping images taken from different points of view. A point cloud and then a 3D space can be recreated from a set of even non-optimised images with minimum overlap. A number of examples have been recently discussed in fields of Earth sciences (e.g. Caravaca et al., 2019; Tavani et al., 2014), archaeology (e.g. Verhoeven, 2011) and education. Positioning of the ‘eruptive’ column was manually performed by insertion of this object in the mesh (with its relative dimensions taken from the paintings) conveniently oriented as in the illustrations, with scaling validated with the absolute position and dimensions of geographical elements recognised in both the landscape and the paintings.
Historical accounts were compared with the expected impact by tsunamis with different sources by means of numerical simulations. The purpose was to test whether an earthquake-induced tsunami reproduced the accounts and if a submarine eruption displayed a comparable inundation pattern. The simulations were carried out with the Non-hydrostatic evolution of Ocean WAVEs (NEOWAVE) model (Yamazaki et al., 2009, 2011). This model solves the non-linear shallow water equations considering a vertical velocity term to account for weakly dispersive waves. We used four nested grids of different resolution. The level 1 and 2 grids were generated from the 30 arcmin General Bathymetric Chart of the Oceans (GEBCO) data with a resolution of 120 and 30 arcsec, respectively, while level 3 and level 4 grids were built from nautical charts 5410, 5411, 5412, and 5413 with a resolution of 6 and 1 arcsec, respectively. The level 4 grids also used a topography obtained from a contour map provided by CONAF (www.conaf.cl) with a nominal horizontal resolution of 20 m. We used the simulation of the 2010 event as a test for the modelling of 1835 event. These events are comparable, but not identical, in terms of the rupture zone and magnitude. The source for the 2010 tsunami was taken from Hayes et al. (2010) and the numerical model was validated with the tsunami inundation heights and run-ups from a post-tsunami survey (Fritz et al., 2011; Winckler et al., 2010). The 1835 earthquake source model given by Jorquera (2018) with a total length of 250 km, a width of 130 km and a uniform slip of 11.5 m was used to simulate the tsunami. The estimated magnitude was Mw 8.5, however, the two-segment model was modified and divided into five segments with variable strike angle to be consistent with the geometry of the subduction zone. The total length, width, slip and dip angle remained the same as in the original model. Modelling of tsunami waves caused by submarine eruptions is a complicated process because of the lack of reliable input parameters and the physics involved. Waves caused by underwater explosions can be modelled using simple one phase physics (e.g. Smith and Shepherd, 1995) or more complex multiphase models (Gisler, 2008). For running this numerical simulation with NEOWAVE model a grid with a resolution of 3 arcsec was used. The analytical solution proposed by Kakinuma (2016) was taken as a modelling approach modifying some input parameters. We set the water depth to 150 m (average value for the Cumberland Bay area; Figure 2) and increased the magma temperature to 1250 K, which would be a lower bound for basalts (e.g. Thivet et al., 2020) and an upper bound for more evolved magmas. There is, however, a high level of uncertainty in the selection of eruptive parameters (e.g. magnitude, dissolved water in magma), which is worst in the absence of tephra layers useful for an unbiased reconstruction. Despite the uncertainty, some ranges can be derived from the global catalogue of submarine eruptions. A recent analogue for the 1835 event could be the eruption of the Kick’em Jenny Volcano in the Lesser Antilles, which last erupted in 2001 from a depth of c. 185 m (Lindsay et al., 2005), or the El Hierro 2011–2012 eruption in the Canary Islands, which erupted from a depth of c. 300 m (Carracedo et al., 2012).
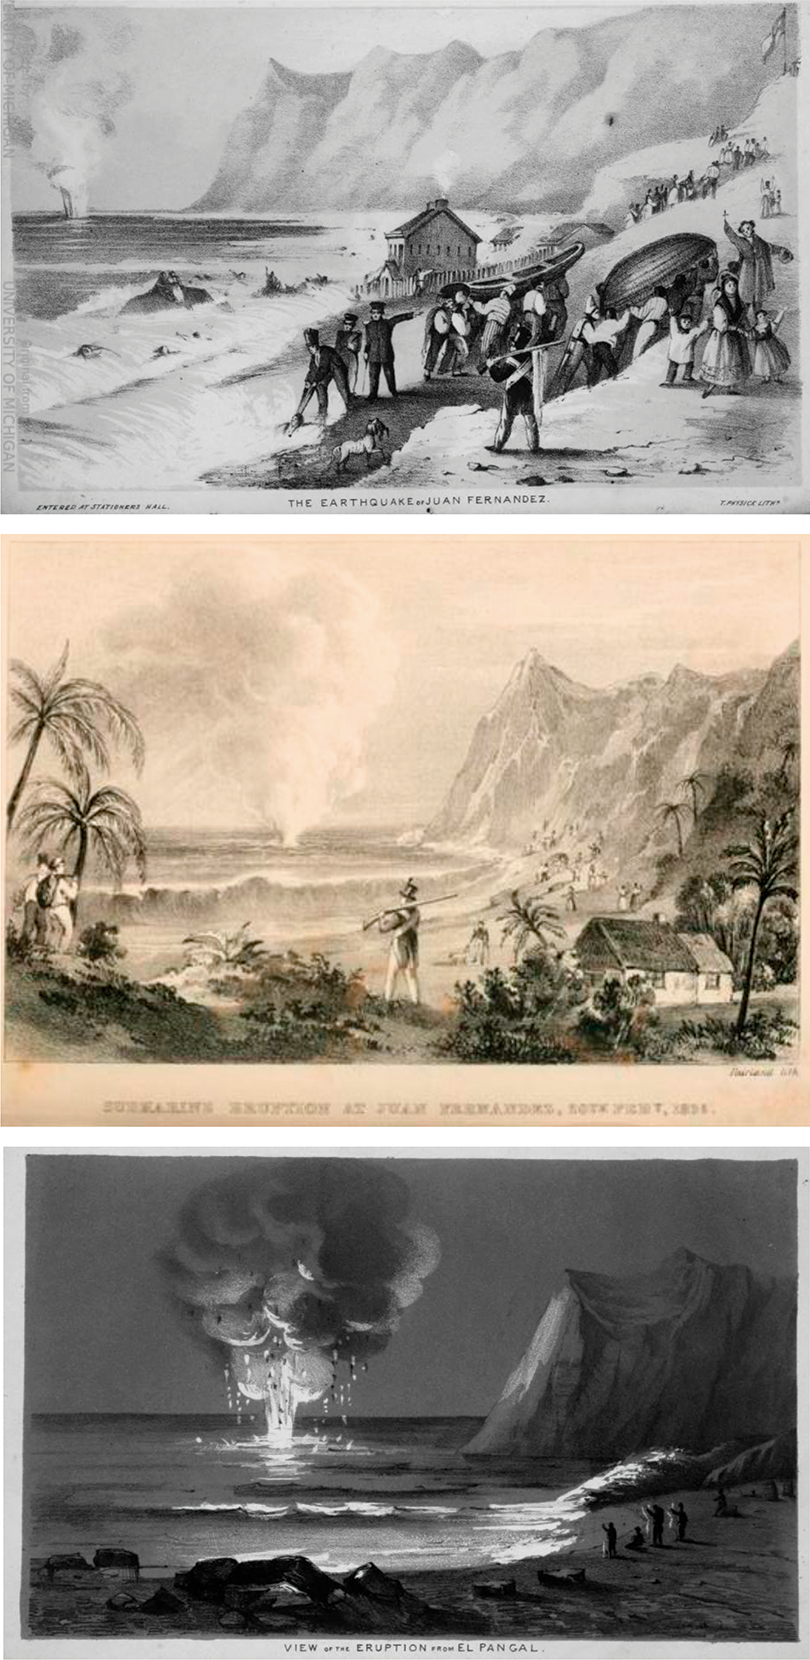
Different paintings that depict the ‘eruption’ at Cumberland Bay in
III Inspection of the historical accounts
1 The Sutcliffe report and other sources
Here we reproduce the most relevant fragments of the Sutcliffe report adding comments on those aspects that we use afterwards for the analysis (capital and lower case are as in the original; bolds are ours). Additional sources in the report are quoted in supplement Table S1. Regarding 20 February, Sutcliffe wrote: On the evening of the 19th February, I heard a strange Shortly after the explosion, I observed a large column, something like a water spout, ascend in a rapid manner out of the sea, which surprised me, there not being a cloud to be seen; it proved to be smoke, which soon covered the horizon, and eastward point of the bay, called Punta de Bacalao…During the night, until about two or three o’clock in the morning, there appeared, at intervals, violent volcanic eruptions, which kept all of us awake, and in constant dread of something happening even more terrible than what we had experienced. These phenomena had been preceded from sunset by heavy flashes of lightning, in the direction where I had seen the smoke before mentioned. The day following I went in the boat with a lead and line to sound where I had observed the smoke, but found no alteration in the bottom, as all the coast near the point of Bacalao is full of fissures, and on shore there are still remains of a crater near the place where the eruption exploded. I am induced to take this course, more especially, in consequence of the extraordinary accounts which have been published in this country relative to the total destruction of the island,
The Sutcliffe report is hence the primary source and includes both the report by the governor himself and those from subordinate officials. This report includes some contradictory elements, as the time of the first wave incursion on the island (which is reported at the same time of the earthquake) and the time of appearance of the explosions. The primary account is actually less specific, stating ‘a tremendous explosion’ that shortly after became ‘a large column, something like a water spout’, which later ‘proved to be smoke, which soon covered the horizon’. We interpret this piece as the occurrence of rockfalls from the cliffs. Rockfalls are a common erosive process that was probably enhanced by the tsunami well along the cliffs. Rockfalls and even debris flows apparently also occurred inland (Table 1). Lightning was reported several hours later at the evening and only after this observation the interpretation of a volcanic eruption arose being incorporated to the reports.
In addition to the diffuse description or misinterpretations in the report, it is important to note the context in relation to a previous publication in the Nautical Magazine and Naval Chronicle in 1837 (Sutcliffe, 1839). Sutcliffe had serious problems with the prison management since he was hired in 1834. His leadership was widely criticised in official documents, and after the earthquake a mutiny in September culminated with his resignation and a subsequent trial, where severe criticism was raised as to his authority (Vicuña Mackenna, 1883). Articles then published in 1837 in the Nautical Magazine, where parts of trial were reported, questioned Sutcliffe’s credibility and financial management. Urged by his friends, Sutcliffe published a detailed account of both the events on Robinson Crusoe Island and the trial, including a refutation of the statements in the Nautical Magazine. In this context, Sutcliffe’s accounts portray him as a competent and brave authority, probably augmenting the facts despite the obvious damage suffered by the island as a consequence of the tsunami (Palacios, 2015). A complete summary of his round trip was published as Sixteen Years in Chile and Peru (Sutcliffe, 1841) and later in ‘Crusoniana’ (Sutcliffe, 1843). One reason for the long-lasting credibility of the Sutcliffe’s report would be the support given by R FitzRoy. In addition, Sutcliffe’s testimony was reproduced by Darwin and then by Lyell and thus became an indisputable myth for decades.
2 Analysis of the paintings
We compiled a set of paintings based on the Sutcliffe’s report (Figure 2; all the informal names referred are shown in Figure 3). These are lithographs published by Sutcliffe (1839) that we consider as the original source. A coloured version of Figure 2(a), included in Kozák and Černák (2010), is provided in the supplemental material, along with a version of the painting by M Rugendas, which was drawn after the event based on Sutcliffe’s report. Figure 2(a) seems to have the observer at the dock or somewhere close to the shoreline because people appear to be walking fast to a safe place during the inundation. The flag blowing uphill in Figure 2(b) would be located at the Santa Barbara Fort and thus the observer in this picture should be close to the identified warehouse. Figure 2(c) is labelled as El Pangal Bay, although the viewpoint seems to be the same of the others and different from what is expected from that bay. In Figure 2(a) and 2(b) a kind of white column is observed on the sea surface to the left of the place referred as Punta Bacalao in old maps (see Figure 3 with local names). The column apparently consists of a basal ‘gas thrust region’ with a darker ‘convective zone’ above (quotation marks for scientific terms related to the main features of eruptive columns; e.g. Cioni et al., 2015 and references therein). The basal zone is 5–15% of the column height. Shadows to the right of people standing in the bay in Figure 2(a) (i.e. to the south) are consistent with the time reported for strong sea waves (11:30 hrs. local time, Table 1). A hand coloured version of Figure 2(a) is quoted by Kozák and Čermák (2010) showing the ‘gas thrust region’ in red and yellow (whereas the chimney from a house emits a white smoke) and the ‘convective zone’ partially yellow (see supplemental material). The latter is not fully consistent with what is expected in a volcano eruption and could be just a selection by the painter. Figure 2(c) shows a painting from the El Pangal Bay at night, although the viewpoint is not actually at El Pangal but probably at Lord Anson’s place (Figure 3). The column in this image also presents a ‘gas thrust region’ that is c. 17% of the total column height with a ‘convective zone’ that has a larger lateral development. A salient feature in this image is the presence of falling and apparently burning fragments, which describe a vertical trajectory from the ‘convective zone’. This account is consistent with the report of repeated ‘volcanic eruptions’ accompanied by lightning during the following early morning, at 2–3 am 21 February. Vertical rather than parabolic trajectories for the ejected fragments are different than expected in volcanic eruptions, moreover in shallow water submarine eruptions where lateral tephra jets are the first visible expression of the magma-water interaction, as observed in the Surtsey eruption in 1963 and many others (e.g. White et al., 2015 and references therein). It is worth noting that Surtsey

Map view of Cumberland Bay with the inferred location for the
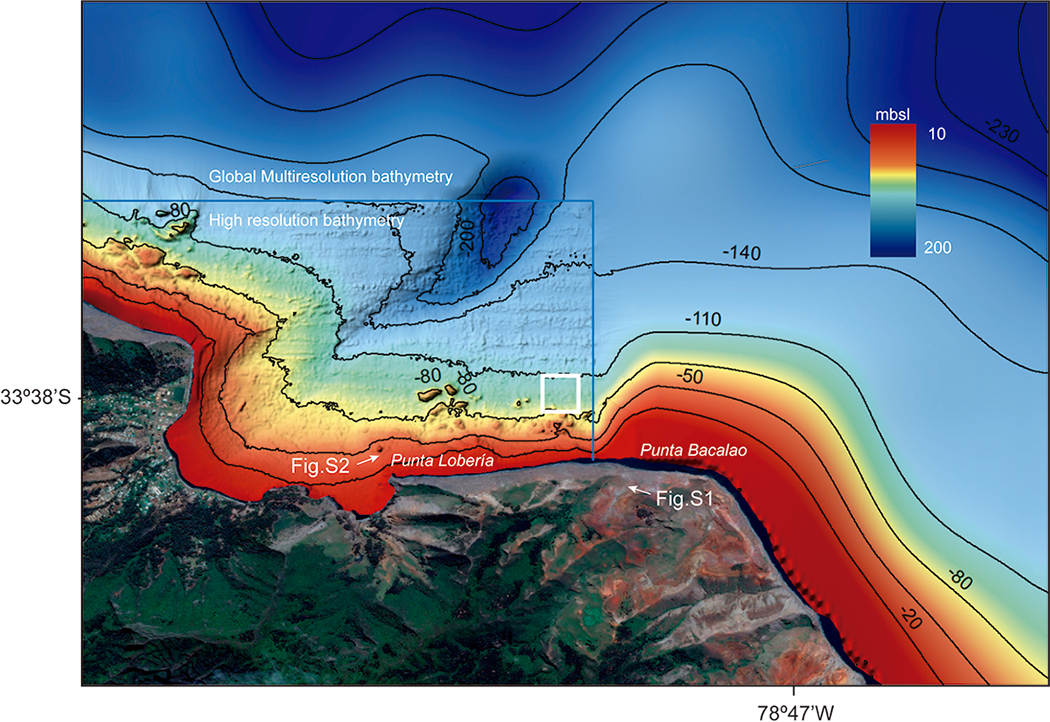
Bathymetry of Cumberland Bay and northern coast of Robinson Crusoe Island. White box shows the inferred site of the
Taken together, the images of the event are coherent in terms of location and general features, but contain some contradictory elements (fire, smoke) that seem to be added as artistic interpretation, which in turn could be influenced by the prevailing idea of an eruption.
3 Photogrammetric analysis
All the paintings and accounts are consistent with a location in Cumberland Bay, some distance to the west of Punta Bacalao. A. Renard, who was not there in 1835 but visited the island in 1876 being in charge of collecting rock specimens (Renard, 1889), mentioned one English mile (1.609 km) as the distance from the coast to the ‘column’ reported by Sutcliffe. Based on these geographical references, we performed a photogrammetric analysis to define the possible area for the ‘vent’, which we surveyed later on the bathymetry. As a first approach, we plotted possible lines of sight from the three different viewpoints (dock, Santa Bárbara Fort and Lord Anson’s place). We then built a point cloud (29,319 points) from 51 digital images taken from different positions, all of them trying to mimic the viewpoints in the historical images and adding new perspectives for a better modelling of the object (Figure 3). With this procedure we found the most probable area (Figures 1 and 3) extracting coordinates (with 0.5 km uncertainty envelope) for further inspection. Column height was calculated using a distance-height scaling using notable surface points that serve as reference. From the scaled dimensions the height of the supposed eruptive column ranges in c. 630–650 m in the pictures. We then used these values to test the feasibility of such a structure in natural systems.
IV Geological evidence
1 Surface geology
Robinson Crusoe Island is a deeply eroded terrain with mostly preserved rocks representing the shield stage (Lara et al., 2018) and scarce fresh volcanic landforms. The latter correspond exclusively to the rejuvenated stage of volcanism that has been dated preliminary in c. 800 ka (Reyes et al., 2017). Being dominantly a basaltic volcanic complex, tephra layers are scarce and outcrop as thin layers interbedded with lavas. A few exceptions are the locally meter-thick ash flow layers observed in NE coast (Punta Bacalao), all part of the erupted sequence of rejuvenated volcanism (Figure S1). They are all indurated although strongly scoured rocks with remaining pinnacles. Slopes in the deeply eroded surface (because of the sheep cattle in the 19th and 20th centuries) expose partially friable layers of fine reddish and yellowish reworked material. In addition, the cliffs in the NE coast expose some other features of differential erosion such as cavities and craters. Taken together, the colours and forms mimic the features of recent volcanic landscapes and could be misinterpreted. On the other hand, ash fall horizons are present in the NW coast (Bahía del Padre), but they are indurated and covered by lava flows from the rejuvenated stage dated in c. 1 Ma (Reyes et al., 2017). This view is coincident with descriptions provided by early visitors as J.D. d’Urbille in 1838 (d’Urbille, 1846), A. Renard in 1876 (Renard, 1889) and later on by C. Skottsberg and P. Quensel in 1908 (Quensel, 1912, 1952), who all recognised an eroded volcanic landscape without any sign of recent activity.
In summary, loose primary or juvenile volcanic material is totally absent in the island. There are no ash fall layers on the surface, banks or disseminated grains different from those related to the Pleistocene units. Only a few reports from local eyewitnesses mention occasional floating pumices that seem to be related to rafts that travelled from distant sources. For example, Baker (1967) reported floating pumices that he related to an eruption of McDonald Island in the Indian Ocean. Storms that mostly affect the south coast usually carry some exotic pyroclastic material (along with trash), although steep cliffs preclude deposition on the narrow beaches. No remnants of primary local volcanic material are present or reworked on the island.
2 Bathymetry of Cumberland Bay
A key evidence of a shallow submarine eruption is either the constructional (e.g. tuff rings or pyroclastic cones, lava flows) or erosional morphology (e.g. craters) observed in the seafloor (White et al. 2015 and references therein). From the empirical relation by Sato and Taniguchi (1997), a crater at the seafloor c. 300 m wide should form as a response of a magma withdrawal in phreatomgamatic eruptions of Volcanic Explosivity Index (Newhall and Self, 1982) in the range of 2–3. The area of Cumberland Bay is, however, gently dipping and smooth because of the fine grain sediments, only perturbed by a metre-scale roughness that appears mostly close to the shoreline. In fact, the high-resolution bathymetry shows locally a coarse-grained fabric that can be interpreted as fallen blocks from the cliffs. Local inhabitants know well these areas and use to call them ‘bajos’ (shallow places). Photographs from some of these places show blocky aggregates formed by irregular metre-scale rocks (see supplemental material). The inferred site of the supposed eruption lies in a flat area near the rough sector. A close inspection of the area shows no evidence of volcano morphologies, neither fresh nor buried by sediments.
3 Comparison with observed shallow submarine eruptions
Despite the absence of direct evidence of volcanic activity or derived products, we analysed the plausibility of such an eruption and especially the credibility of the features depicted in the historical paintings. A compilation of more than 20 shallow submarine eruptions (those occurred at depths shallower than 500 m, Rubin et al., 2012) shows a dispersion of depths and column height that mostly lies below an exponential curve (Figure 5). Mastin and Witter (2000 and references therein) compiled 72 submarine vents from where more than 250 shallow submarine historical eruptions have been reported, although column height is not frequently informed. From that record, only four volcanoes with seven eruptions that breached the water surface were sourced at depths >100 m. Whereas magmas erupted from subaerial vents decompress to atmospheric pressures (c. 0.1 MPa), submarine magmas decompress to the hydrostatic pressure corresponding to the water depth at the vent. At a water depth of 100 m, the hydrostatic pressure is 1 MPa and the erupting magma, which tensile stress is c. 5–6 MPa, has to exceed 6–7 MPa. The latter is possible for basaltic magmas with c. 3% of dissolved water and thus intense explosive eruptions can occur at depths <500 m (Cas and Simmons, 2018), but only if the volatile content, strain rate affecting magma in the conduit and gas overpressures are high enough. The historical record shows that a column with such a height (c. 600 m) sourced in a shallow seafloor (c. 150 m) is possible, although not frequent (Figure 5). Harder to conciliate with nature is the structure of the column with an apparent ‘thrust’ zone and without the typical cypresoidal form and the occurrence of base surges, as observed in Surtsey eruption and many others. On the other hand, Latter (1981) has compiled some 92 cases of tsunamis of volcanic origin with only a fraction of them related to eruptions through surface water.

Plot of column height against water depth for a number of shallow submarine eruptions (Sursetyan eruptions). Note the rapid decay of column height with the increase of water depth, as expected for higher hydrostatic pressures. Explosive activity is possible with c. 130 m of water column and steaming above sea level is plausible, although typical Sursetyan eruptions show different patterns.
V Tsunami numerical simulations
For calibration purposes, Figure 6 shows results of numerical simulations of the 2010 tsunami where the rupture zone is taken from Hayes et al. (2010). Figure 6(a) shows a snapshot of the tsunami propagation to Juan Fernandez Island. The tsunami directivity makes the waves propagate directly to the island. In addition, seamounts of the Juan Fernández Ridge (Lara et al., 2018b) play an important role on tsunami diffraction and focusing as the tsunami approaches Cumberland Bay. Figure 6(b) shows the tsunami waveform of a point located inside the bay, while Figure 6(c) shows the maximum tsunami amplitude around Robinson Crusoe Island. This result is in good agreement with tsunami inundation height reported by Fritz et al. (2011) and Winckler et al. (2010). The maximum tsunami amplitude was obtained at ∼49–51 minutes after the earthquake and was caused by the first tsunami wave. It is important to notice that even though the leading tsunami wave had an amplitude ∼2 m as it propagated from the source to the island (Figure 6(a)), the diffraction and shoaling phenomena can amplify the wave up to four times at water depths shallower than 100 m (Figure 6(c)).
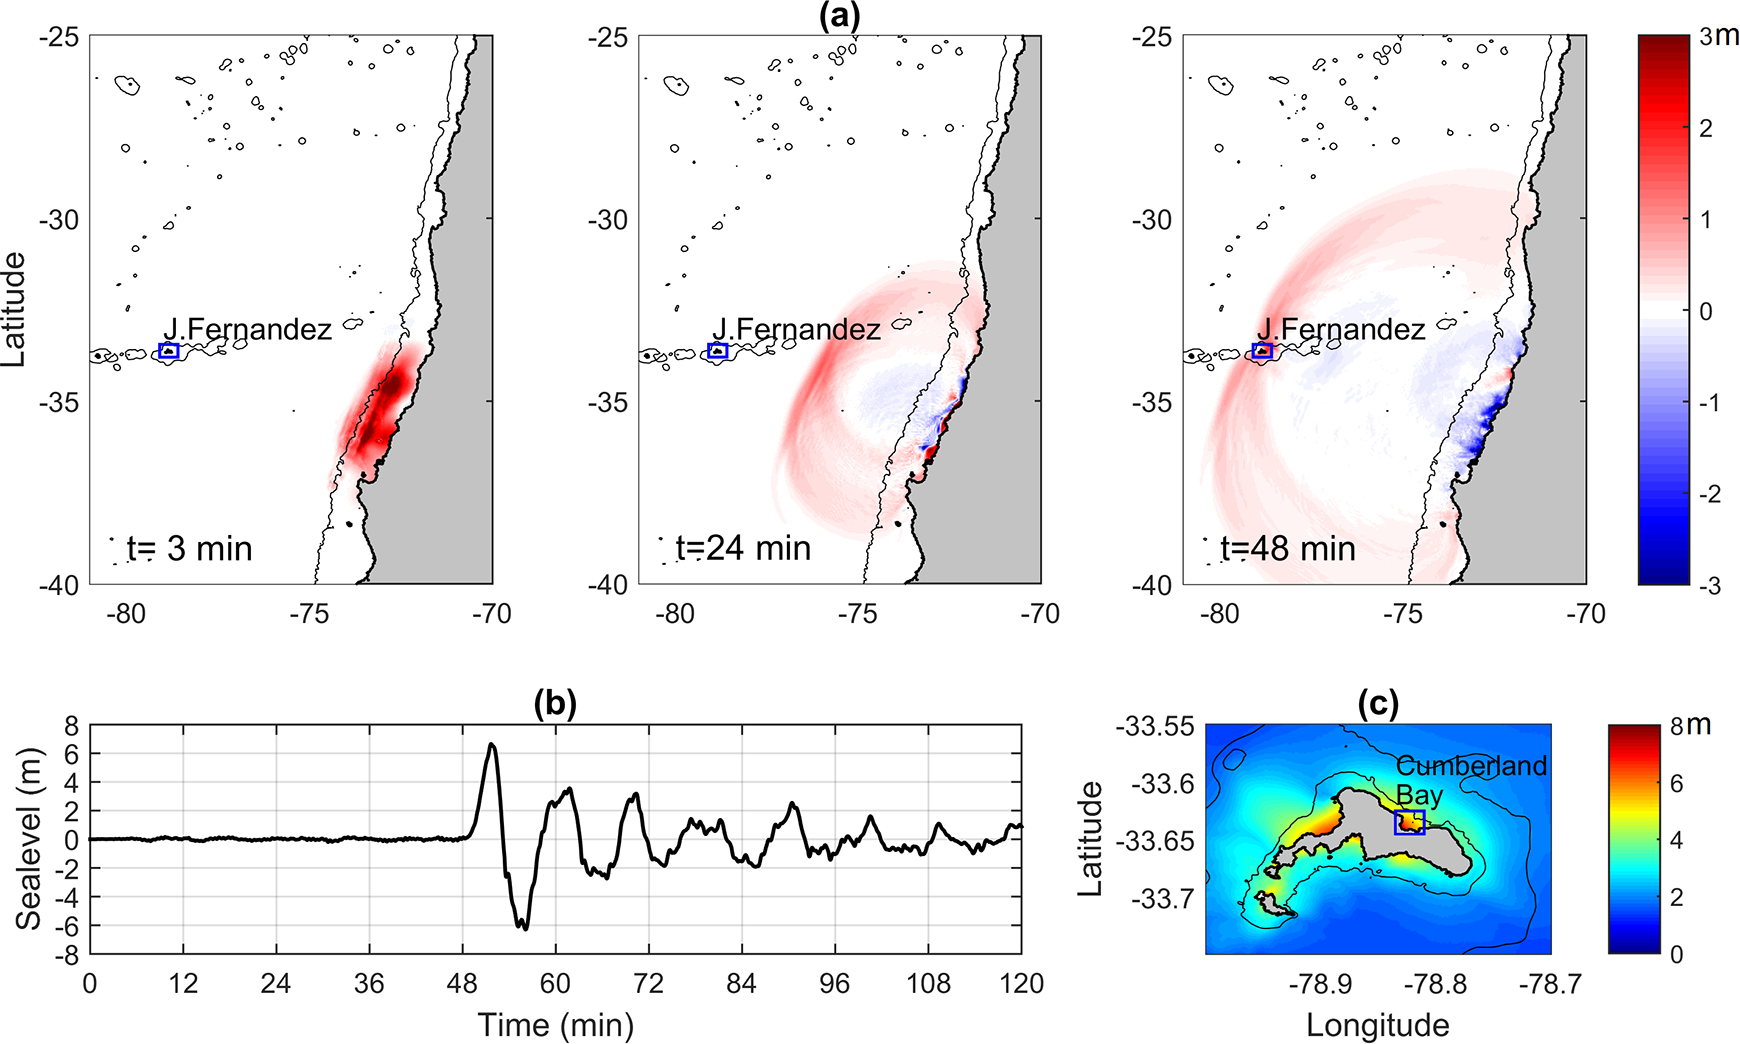
Results of numerical simulation of
Figure 7 shows the modelled results for the

Results of numerical simulation of
A plausible (although not necessarily probable) array of input parameters for a submarine eruption could reproduce the reported run-up over the coast. The dispersion pattern is, however, concentric and formed by an initial cavity on the sea surface followed by a bulge that propagates outward. Taking advantage of the analytical solutions by Kakinuma (2016), we find that a phreatomagmatic eruption in the reasonable range implies an erupted volume of c. 1–10 x 106 m3, produces an initial water surface displacement of several metres and a maximum run-up of c. 6–8 m over the coast of Cumberland Bay (Figure 8).

Results of numerical modelling of theoretical phreatomagmatic eruption at Cumberland Bay (see text for details): (a) snapshot of tsunami propagation; (b) tsunami waveform at a tide gauge located inside Cumberland Bay; (c) maximum tsunami amplitude.
VI Discussion
1 Facts and misinterpretations
Historical evidence is consistent with the occurrence of a natural process with cascading effects at Cumberland Bay, but inconsistent with an eruption. In fact, although plausible, there is no evidence in the seafloor or deposits on the land that can be related with a recent eruptive event. Thus, are those accounts completely false and the paintings only an artistic recreation based on misleading interpretations? A growing scientific understanding of volcanic processes was taking place at that time (for a more detailed review of the history of volcanology, see Sigurdsson, 1999, 2015).
South America was also a place for very active volcanism in the 19th century, as observed by a number of European naturalists, voyagers and scientists. The 1828–1829 eruption of the Antuco Volcano in Chile motivated the subsequent description of the eruptive activity by C. Gay. The 1835 eruption of the Osorno Volcano in Chile, which occurred only a month before the event at Robinson Crusoe Island, received great attention because of the accounts by Darwin (1839). Darwin also referred to other coeval eruptions in Southern Andes that followed the 1835 Concepción earthquake, and even other as distant as the Consiguina Volcano in Nicaragua. These events were pivotal in shaping his understanding of the relations between tectonics and volcanism, and certainly influenced the thinking of his contemporaries. Sutcliffe’s report could have been also influenced by previous historical reports, for example the assertion by Spanish voyagers (Juan and Ulloa, 1760) describing Robinson Crusoe Island as volcanically active in 1743, and by his own experience of the 1822 earthquake in central Chile.
Facts in turn might have been amplified in order to save his honour as former governor, especially when facing disturbance and loosing control of the guns during the episode.
So what was going on in

Timeline of modelled facts and historical accounts.
On the other hand, the effect of a rough topography of the island, which promotes interference and ‘splash’ along the coast, might have produced a sound wave that people interpreted as an explosion. Massive rockfalls are highly probable as a result of the wave impact over the cliffs and would have contributed to the sound wave that mimic an explosion. Furthermore, rockfalls displaced large blocks and also left fine-sediment plumes that could be perceived as the persistent ‘smoke’ from the bay. The increase of the wave amplitude due to the steep topography is a well-documented phenomenon. For example, the 2010 tsunami generated maximum inundation heights of ∼8–10 m at the river mouth in Constitución, however, the maximum run-up at a cliff just south of this location reached up to 29 m (Fritz et al., 2011). In a similar manner, while the maximum inundation height at Llico, located at the southern shore of the Gulf of Arauco, was ∼8 m on the flat land, the maximum run-up reached up to 18 m at the neighbouring cliff (Mikami et al., 2011). This process is usually accompanied by rockfalls as observed in a number of places even at large distances (e.g. Bryant, 2014; Röbke and Vött, 2017).
Finally, the mention of ‘fire’ and ‘volcanic eruptions’ is more difficult to reconcile with a non-volcanic natural process. However, earthquakes and related processes are sometimes associated with certain forms of phosphorescence that literature calls triboluminiscence (e.g. Freund, 2019) and describes as a result of the electric charge separation caused by friction and tearing processes during the earthquakes. A slightly different mechanism has been proposed by Enomoto et al. (2019) for the 1993 Hokkaido Nansei-Oki earthquake in the Aonae harbour, Okushiri Island in Japan. In their view, the electric discharge comes from the large electrical potential differences within the seawater mist during the tsunami advance and the flames results by ignition of the organic gases released from the seafloor (see also the historical paint in Figure A2 in Enomoto et al., 2019, which is a wooden print of the 1896 Meiji-Sanriku tsunami, where sea rollers and fires are nicely visible and provide another analog). The latter is a plausible condition in Cumberland Bay, which is covered by fine sediments rich in organic matter transported by the streams. Flames and explosions were also observed by Captain Fitz Roy in San Vicente Bay, Concepción (Darwin, 1839) and are interpreted as a result of gas escape from the seafloor. A key point is that the mention of some kind of lightning appears just at evening, which we interpret as a result of the reduced sunlight rather than the first occurrence. Thus, the succession of tsunami waves that struck the bay but also severely the cliffs produced both rockfalls and gas escape that could have been mixed in an interpretation according to the current understanding of the natural processes. Hierarchical relations would have made the additional accounts a mere confirmation of the governor’s interpretation. A timeline in Figure 9 summarises the modelled facts and put accounts in context.
2 Consequences for modern volcanism and active volcanoes
Most of the empirical criteria to distinguish active volcanoes lie on the record of historical eruptive activity, although more formal assessment requires probed activity during the Holocene or some kind of instrumental evidence of internal activity (e.g. Ewert et al., 2005; Ewert, 2007). The latter is the U.S. Geological Survey scheme and has been used worldwide. In fact, this criterion was adopted in Chile, where a geologically active volcano is one with at least one episode of eruptive activity in the Holocene (Lara et al., 2011). Thus, a historical eruption in Robinson Crusoe would imply that Robinson Crusoe Island be integrated to the volcano list taking part of the planned monitoring network.
On the other hand, a recent eruption in Robinson Crusoe Island would imply that rejuvenated volcanism occurred after a long gap of c. 3 Ma, which would be longer than other hiatuses reported for Juan Fernández Ridge (Lara et al., 2018a, 2018b), and longer than usual (0.5–2.0 Ma) reported for fast-moving plates (García et al., 2010). The latter requires a mechanism that appears a priori unlikely because of the Nazca Plate velocity and the thermal properties inferred for the feeder mantle plume in this setting (e.g. Reyes et al., 2017).
Real eruptive activity at Robinson Crusoe Island would pose a significant risk to the population at San Juan Bautista village, and its intensity would be higher if this activity occurred below the sea. A recent example at Krakatoa (https://magma.vsi.esdm.go.id) adds to other well-documented submarine eruptions where impact is a function of the magnitude of the eruption and the exposure. As an exercise, if Robinson Crusoe Island is considered and active volcano, then its position in the ranking of active volcanoes in Chile (Lara et al., 2011) would be in the top 50, which probably implies that should be considered for instrumentation.
In addition, the
VII Conclusions
Historical accounts and paintings of the supposed eruption in Robinson Crusoe Island in
Supplemental material
Supplemental_Figures - The AD1835 eruption at Robinson Crusoe Island discredited: Geological and historical evidence
Supplemental_Figures for The AD1835 eruption at Robinson Crusoe Island discredited: Geological and historical evidence by Luis E Lara, Rodrigo Moreno, Valentina Valdivia, Rafael Aránguiz and Marcelo Lagos in Progress in Physical Geography: Earth and Environment
Supplemental material
Supplemental Material, Table1_historical_accounts_1835discredited_(version_1) - The AD1835 eruption at Robinson Crusoe Island discredited: Geological and historical evidence
Supplemental Material, Table1_historical_accounts_1835discredited_(version_1) for The AD1835 eruption at Robinson Crusoe Island discredited: Geological and historical evidence by Luis E Lara, Rodrigo Moreno, Valentina Valdivia, Rafael Aránguiz and Marcelo Lagos in Progress in Physical Geography: Earth and Environment
Footnotes
Acknowledgements
Luna Pérez did a superb technical assistance with the compilation of submarine eruptions. Valentina Astudillo performed a prospective analysis at the very beginning of this project and Mirella Piña-Gauthier was pivotal with the SIG and fieldwork. We also thank Dr Yoshiki Yamazaki for his advice with the numerical simulation of tsunamis generated by volcanic eruptions. We are in debt with Bruno Ladrón de Guevara (BENTOS) who provided access to the high-resolution bathymetry of the Cumberland Bay, and to Cristián Rodrigo who initially compiled a local bathymetric grid. We thank to Marcelo Rossi for the submarine pictures of Punta Lobería. Comments by two anonymous reviewers provided valuable insight that improved this manuscript.
Declaration of conflicting interests
The author(s) declared no potential conflicts of interest with respect to the research, authorship, and/or publication of this article.
Funding
The author(s) disclosed receipt of the following financial support for the research, authorship, and/or publication of this article: This study was funded initially by the Fondecyt 1110966 and recently by Fondecyt 1141303 grants to L.E. Lara. This is also a contribution to the research tasks of CIGIDEN (Fondap 15110017).
Supplemental material
Supplemental material for this article is available online.
References
Supplementary Material
Please find the following supplemental material available below.
For Open Access articles published under a Creative Commons License, all supplemental material carries the same license as the article it is associated with.
For non-Open Access articles published, all supplemental material carries a non-exclusive license, and permission requests for re-use of supplemental material or any part of supplemental material shall be sent directly to the copyright owner as specified in the copyright notice associated with the article.