
Abstract
New and updated multi-century tree-ring chronologies from living oak trees, remnants, and archeological beams from across the Driftless Area of southwest Wisconsin and northeast Iowa, USA, were developed to fill a spatial gap in the network of available tree-ring chronologies. We produced a robust 303-year summer drought reconstruction (June–August Palmer’s Modified Drought Index (PMDI): r 2 = 0.45) that identified clusters of extreme droughts and pluvials (PMDI ≤ –4.0 or ≥ 4.0) in the early 1700s and more even distributions of drought conditions, with the exception of the post 1930s period when drought became relatively infrequent. Compared to the Living Blended Drought Atlas (LBDA) and the North American Drought Atlas (NADA), our reconstruction more accurately represented moderate moisture conditions across the Driftless Area, the NADA and LBDA more closely represented extreme pluvials, and our reconstruction and the LBDA better represented extreme drought years. The three reconstructions largely captured the same high-frequency variability in drought conditions and differed most at low frequencies. Significant correlations were identified between our reconstruction and corn (r = 0.30, n = 91, p = 0.002) and soybean (r = 0.25, n = 81, p = 0.012) yields, with the strength of the correlations increasing over recent decades suggesting a tighter coupling of interannual climate variability and crop productivity in the region. Superposed epoch analyses indicated significantly wetter conditions in the Driftless Area two years after major volcanic eruptions. In the context of long-term climatic variability, the Driftless Oaks drought reconstruction demonstrated that drought and pluvial conditions more extreme than those experienced during the instrumental record have occurred in the past.
I Introduction
Tree-ring-based reconstructions of climate provide key insights into the spatial and temporal aspects of climate variability over long time periods, thereby providing context to better understand current climate dynamics and inform preparations for future conditions (Cook et al., 2007). This is particularly valuable for agricultural regions of the world where the availability of water can determine the success or failure of crops, economies, and societies (Acuna-Soto et al., 2005; Buckley et al., 2010; Cook et al., 2007, 2010a; Douglass, 1929; Weiss et al., 1993). An excellent example of the value tree rings hold as a climate proxy is the North American Drought Atlas (NADA). The NADA is an evolving, grid-based reconstruction of drought based on an expansive network of tree-ring chronologies that covers much of the continent (Cook et al., 1999, 2004, 2010c). The information about drought made available through the NADA greatly improved understanding of the range of drought conditions that occurred in North America over the past millennia, identified forcing mechanisms of drought variability at multiple time scales (e.g. Cook et al., 2011), and illustrated the influence of extreme droughts on human communities (Cook et al., 2007; Stahle et al., 2007). The myriad studies that have used NADA data, with 968 references to Cook et al. (2004) in the Web of Science core collection alone (accessed July 31, 2019), powerfully illustrate the valuable application of proxy data to provide long-term context for present climatic conditions and improve forecasts of what is yet to come. The evolution of computing power, statistical techniques, and available tree-ring methods continue to expand the scope and extent of the NADA, the most recent version of which is the Living Blended Drought Atlas (LBDA) (Cook et al., 2010b), yet opportunities exist to improve the foundation on which this and other regional climate reconstructions are based - the network of tree-ring data (Cook et al., 2010b). In particular, drought atlas grid points draw tree-ring data from a broad search radius when few chronologies are close, and developing local tree-ring data can help improve representations of landscape- to regional-scale drought variability in past climate conditions (Maxwell and Harley, 2017)
The Upper Midwest of the United States is an agricultural region with a low density of tree-ring chronologies relative to many areas in North America (Figure 1a). The dearth of regional tree-ring data is related to naturally diminishing tree cover across the ecotonal transition from forest to prairie, as well as widespread logging in the 1800s and 1900s, which removed much of the primary forest that once covered the region (Rhemtulla et al., 2007). Opportunities to locate and sample old trees remain, particularly in remnant oak (Quercus spp.) savannas that were once common along the prairie–forest border (Nuzzo, 1986). Researchers have developed multi-century hydrologic reconstructions from the growth rings of oak trees in Iowa, Illinois, Indiana, and Missouri (Blasing and Duvick, 1984; Cleveland and Duvick, 1992; Duvick and Blasing, 1981; Maxwell and Harley, 2017; Stambaugh et al., 2011), yet a substantial area of the region still lacks local tree-ring data. A local perspective on climate variability would benefit this region where recent extreme events, such as the drought of 2012, highlighted the susceptibility of the region’s agricultural systems to drought (Boyer et al., 2013).

Study area map showing (a) the low density of available chronologies used by the North American Drought Atlas (NADA) over the Midwestern United States and the Driftless Area of southwest Wisconsin, and (b) the rolling topography of the Driftless Area, sample sites included in this study, existing chronologies available through the International Tree-Ring Data Bank (ITRDB), locations of Historical Climatology Network (USHCN) stations within the study area, and the location of NADA grid points for two versions of the reconstruction – the NADA described by Cook et al. (2004) and the more recent Living Blended Drought Atlas (LBDA) (Cook et al., 2010b).
Here, we report the development of a new set of multi-century tree-ring chronologies from oak trees growing across the Driftless Area of southwest Wisconsin, USA, that fills a spatial gap in the network of currently available tree-ring chronologies. In addition to these new chronologies, we updated four oak chronologies developed in the Driftless Area of northeast Iowa in the 1980s (Blasing and Duvick, 1984; Cleveland and Duvick, 1992; Duvick and Blasing, 1981). We use these chronologies to (a) reconstruct patterns of drought over recent centuries and assess drivers of past variability, (b) examine observed regional climate extremes in the context of the spatial and temporal variability of drought across the Driftless Area, (c) compare our reconstruction to other hydrologic reconstructions for the region to illustrate spatial and temporal variability of drought across the Upper Midwest, and (d) test for relationships between our tree-ring data set and crop yield across the study area. The overall aim of this research is to expand and update the relatively sparse and out-of-date tree-ring data available for the region for improved characterization of long-term climate variability and change in the Driftless Area.
II Methods
2.1 Study area
The Driftless Area is a rural landscape of rolling hills dissected by steep stream valleys in the Upper Midwest of the United States, and is named for its lack of glacial deposits (Figure 1b) (Knox et al., 2019; Martin, 1965). The complex topography of the Driftless Area includes numerous ridges and bluffs rising 100m or more above neighboring floodplains and has generally limited the size of farms and fields in most places. As a result irrigation systems are rare, making the region’s corn and soybean productivity susceptible to droughts. Historically, the Driftless Area spanned a prairie–forest ecotone and supported widespread savannas and woodlands of bur oak (Quercus macrocarpa) and white oak (Quercus alba) trees (Finley, 1976). Modern land cover is a pastoral mix of agriculture and woodlands. Oak radial growth in this and other regions reliably records moisture conditions (e.g. Cleveland and Duvick, 1992; Drobyshev et al., 2011; Gildehaus et al., 2015; Stahle et al., 2013). This marked climate response, coupled with the longevity of Driftless Area oak species, helped focus our research on the identification and sampling of pre-European settlement oak trees with the intent of developing multi-century proxy records and reconstructing drought.
The climate of the Driftless Area is humid continental, with cold winters and mild summers (Figure 2a). Mean temperatures range from −8.8°C in January to 22.1°C in July. Mean annual precipitation is 840mm, with approximately 70% of annual moisture delivered from April through September. Recent decades have seen increased precipitation and rising temperatures relative to the long-term averages (Figure 2b) (WICCI, 2011). Years of both extreme moisture and drought occurred throughout the period of instrumental climate records, with downscaled climate change projections suggesting that extreme events will become more frequent in the future (WICCI, 2011). These projections are underscored by a recent series of extreme droughts and floods that affected the Driftless Area and resulted in 300–400 million USD in crop losses (Fitzpatrick et al., 2008).

Climate of the study area shown as (a) mean monthly precipitation and temperature from 1895–2014 and (b) annual precipitation and mean annual temperature time series from NCDC Wisconsin Division 7 climate data and five HCN stations spaced across the study area (locations shown in Figure 1b).
2.2 Tree selection and field methods
The identification of sampling locations offered a unique challenge for this research. Available public lands are relatively limited in the Driftless Area and were surveyed using historical aerial photographs through the Wisconsin Historic Aerial Imagery Finder (www.sco.wisc.edu/whaifinder/whaifinder.html, accessed September 1, 2014), with promising sites surveyed on foot. Additionally, an active public outreach effort resulted in over 250 invitations to scout private lands for candidate trees, many of which resulted in the identification of old oaks that were included in this research. We also contacted owners of historic buildings with the intent of sampling old oak timbers and extending the chronology through the inclusion of archeological specimens.
Field work conducted by teams of undergraduate students spanned seven years (2012–2013 and 2013–2014 in Wisconsin and 2018 in Iowa). All living trees were sampled during the dormant season (October–April) to minimize risk of encouraging or spreading oak wilt (Ceratocystis fagacearum) among the sampled trees. Old living oak trees in the white oak group (Quercus alba and Quercus macrocarpa) were identified at each site through surveys and with the assistance of numerous landowners. Two primary considerations guided the selection of sampled trees, one regarding individual tree morphology and the other regarding site characteristics: (a) the presence of a spreading-crown structure, suggesting a tree that established and grew in open conditions with minimal influences of inter-tree competition indicative of pre-Euro-American settlement conditions; and (b) a focus on trees growing on south- and southwest-facing ridges, bluff edges, or steep topography to maximize the likelihood of annual growth being limited by available moisture instead of other climatic variables. Of note, establishment in prairie and savanna settings caused the morphological characteristics used to identify old-growth trees in this study to contrast with those used in other parts of eastern North America where the oldest trees often exhibit tall, branch-free trunks and compact canopies (Pederson, 2010). Trees sampled for the previous Iowa studies had been tagged and roughly mapped in the 1980s and were located where possible with the guidance of John Pearson, ecologist with the Iowa Department of Natural Resources. An increment borer was used to collect 5.15mm diameter core samples from living trees. Each sampled tree was inventoried for species, crown structure, health, and diameter at breast height (DBH), then photographed and georeferenced. We attempted to obtain increment cores along at least two radii per tree, though rot was a limiting factor in some cases.
In addition to living trees, we collected tree-ring samples from in situ oak stumps and oak beams in historic structures likely built during the European settlement era (ca. 1830s–1850s) and locally sourced (e.g. Western Historical Company, 1881: 472). The stumps targeted were from recently cut oak trees that had grown in pasture settings, and we used a chainsaw to collect cross sections from those that were sufficiently intact. Most historic structures were constructed from locally abundant limestone blocks and were associated with the arrival of large numbers of Euro-American immigrants to the Driftless Region in the early 1800s (a thoughtful review of the Indigenous and early European settlement of the region is provided by Meine and Keeley, 2017). In these structures, timbers were used as either rafters or door and window lintels (e.g. https://npgallery.nps.gov/AssetDetail/NRIS/80000153), and historical materials lists, lien documents, and memoirs indicate that most timbers used in construction were harvested locally (e.g. Meeker, 1872: 280). Timbers were considered for sampling if they exhibited white oak ring structure (Hoadley, 1990) and evidence of being hand-hewn. Core samples were collected using a 15mm diameter dry-wood archeological bit. We attempted to sample historic beams where bark or cambium was visible to increase the likelihood of collecting the annual ring produced during the year the timber was harvested (Bannister, 1962).
2.3 Laboratory methods and chronology development
All tree-ring samples were air-dried and processed by standard methods (Stokes and Smiley, 1996). Master chronologies were developed for each site by visual crossdating and skeleton plotting (Stokes and Smiley, 1996; Yamaguchi, 1990). Tree-ring samples from stumps and archeological structures were first internally crossdated with other samples collected at the site, then crossdated with living trees sampled onsite when possible, or otherwise using a regional list of marker years or quantitatively by comparing ring-width data to a master regional chronology developed from all crossdated living trees. All crossdated samples were scanned at 1200+ dpi optical resolution using a flatbed scanner, and ring-width measurements were collected from the resulting images using WinDENDRO v2012 and v2014 (Regent Instruments, Inc.). Crossdating of each ring-width series was confirmed using the computer software COFECHA (Holmes, 1999).
Standardized ring-width index (RWI) chronologies were developed for each site individually to conduct a preliminary screening that ensured trees across the study area expressed similar climate–tree growth relationships at the site-scale before pursuing a regional approach. Visual inspection of the individual tree-ring samples revealed that most exhibited wide inner rings indicative of open-growth-canopy conditions. At the site-scale, the age-related growth trend of each series was removed by relativizing to fitted linear or negative exponential regressions or to a horizontal line through the mean. Residual (RES) chronologies were developed by combining the unitless indices for each year of the chronology using a robust bi-weight mean that reduced the influence of outliers, followed by the removal of all autocorrelation from the RWI chronology through autoregressive modeling (Cook, 1985). The site-level chronologies were developed using the computer program ARSTAN v44h2 (Cook and Krusic, 2013).
We examined similarity among site chronologies with respect to distance decay, spatial gradients as depicted through ordination of the chronologies, and variance–covariance models over both space and time to determine if a coherent signal was present in our data set that would justify a regional climate reconstruction. These steps, often conducted but rarely reported, are included here to illustrate and emphasize the importance of considering data at multiple scales to justify scaling up to a regional perspective on drought in the Driftless Area.
Distance decay is a fundamental feature in the geographic patterns of climate (Sui, 2004; Zhao et al., 2015). This characteristic is expressed in tree-ring data as decreasing similarity in ring-width patterns across increasing distances between sites (Fritts, 1991). We assessed this phenomenon by comparing the Pearson product-moment correlation coefficient (r) and linear distance (m) between each combination of sites with (1) >20 years of overlap in their respective RES chronologies and (2) where living trees were sampled to ensure a precise growing location. Trend in the plot of r vs m would indicate the existence of distance decay in the climate conditions of our study area and/or the climate–tree growth relationships expressed at our sites. A lack of trend would suggest a relatively coherent climatic influence across the study area.
Principle components analysis (PCA) was used to visualize growth patterns among the RES chronologies and to explore if the chronologies exhibited distinct growth that may suggest the existence of spatial gradients in growing conditions across the study area. PCA was conducted on a matrix of chronologies composed of site-scale chronologies for which the expressed population signal (EPS), a measure of the common signal strength within a chronology as effected by sample depth (Wigley et al., 1984), was >0.8 during the time period shared among all sites as determined using the common.interval() function of the dplR library in R (Bunn, 2008). We used a threshold of 0.8 in this case rather than the more commonly applied 0.85 to accommodate the relatively low sample depth of some site-scale chronologies and because this was a screening process and not the development of a final reconstruction. The chronologies selected through this process were combined into a symmetrical matrix that balanced our desire to maximize the number of years spanned among the included chronologies with consideration of how low sample depth at some individual sites affected the shared signal expressed at the site-scale. The resulting matrix was transposed, with sites as rows and years as columns, and ordinated using the prcomp() function in R (R Development Core Team, 2019). A map of the study site locations was used to subjectively assign each site chronology to an apparent geographic region within the study area. A biplot of each site by its scores on the first and second PCA axes was created, with symbology based on the subjectively identified geographic regions and minimum bounding boxes drawn to illustrate the distribution of sites within ordination space.
Finally, we examined synchrony among the network of sites relative to the subjectively defined geographic regions using variance–covariance mixed models estimated by the dendro.varcov() function of the R package DendroSync (Alday et al., 2018). We calculated the restricted maximum likelihood estimation of variance for each of four models with variants for homoscedastic and heteroscedastic data, for consideration of a total of eight models. The results for each model fit were assessed using a set of log-likelihood statistics, and the best performing model was used to estimate synchrony within and among the groups. Temporal variation in synchrony was assessed using the sync.trend() function of the DendroSync package to implement a similar assessment of within- and among-group synchrony over sequential 40-year windows lagged by 5 years. The results of each analysis were graphed for visual interpretation.
Based on the comparisons of growth patterns among the site chronologies and over time, we developed a regional RWI chronology that included the full complement of ring-width measurements. We explored several approaches to standardization for the regional chronology, including regional curve standardization (Helama et al., 2017), signal-free standardization (Melvin and Briffa, 2008), and splines across a range of stiffnesses (Cook, 1985). A lack of pith dates for many samples limited the feasibility of using regional curve standardization (Dietrich and Anand, 2019) and a possible region-wide land-use event in the mid-1800s reduced the appropriateness of signal-free standardization. These considerations, combined with the desire to compare our results to the NADA and LBDA, led us to standardize our tree-ring width series by fitting a 30-year smoothing spline to each measurement series, divide the ring-width measurement of each year by the curve-fit value, and calculate a bi-weight robust mean for each year of the chronology (Cook, 1985). The resulting STD chronology was truncated based on an expressed population signal of >0.85 (Wigley et al., 1984) and a signal-to-noise ratio >5 as calculated over 40-year moving windows. Development of the Driftless Oaks regional chronology was carried out using the dplR package of R (Bunn, 2008).
2.4 Calibration, verification, and reconstruction
Identification of the climate signal embedded within our tree-ring data set followed a stepwise process that included a rudimentary assessment of spatial climatic variability across our study area along with analyses of climatic influences on annual tree growth, scaled up from individual-site chronologies to the regional chronology. Monthly records of precipitation and temperature (mean, maximum, and minimum) were obtained from US Historical Climatology Network station data (USHCN, 2019) for the five weather stations within our study area: WI472001 (Darlington, WI), WI474546 (Lancaster, WI), WI476827 (Prairie du Chien, WI), WI478827 (Viroqua, WI), and IA132864 (Fayette, IA) and US National Climatic Data Center divisional data (NCDC, 2015; Vose et al., 2014) (Figure 1b). We used correlation analyses to compare annual average temperature and total precipitation among the HCN sites and mean monthly precipitation and temperature for each data set were compared to NCDC Wisconsin Division 7 climate data using t-tests. Wisconsin Division 7 was chosen because it falls entirely within the borders of the Driftless Area and included most of the chronology sampling sites (Figure 1b). Relative consistency across weather-station data justified the use of divisional climate data in the remaining analyses.
Site-scale RES chronologies were compared to monthly records of precipitation, mean temperature, maximum temperature, minimum temperature, and Palmer’s Modified Drought Index (PMDI) (Mo and Chelliah, 2006) for NCDC Wisconsin Climate Division 7 using correlation analysis. We used the RES chronologies to minimize the potential influence of autocorrelation on identified climate–growth relationships, particularly for sites with relatively low sample depth where shared growth patterns unrelated to climate could be represented in the chronology (Cook and Kairiukstis, 1990). We targeted PMDI to enable eventual comparison with the LBDA (Cook et al., 2010b). Exploratory analyses indicated that annual tree growth was more strongly related to seasonal than monthly climate variables (sensu Meko et al., 2011). We therefore focused our analyses on the three seasonalized climate variables that most strongly correlated with annual tree growth: April–June precipitation, June–July maximum temperatures, and June–August PMDI. All site-level RES chronologies were correlated with these seasonalized climate variables using moving 40-year correlations over the time period 1895–2014 to examine the temporal stability of the site-scale climate–growth relationship. The climate variable targeted for reconstruction was chosen based on the strength and consistency of its correlation with the site chronologies and the practical explanation of that relationship based on sample site characteristics and tree physiology.
Based on a consistent relationship between climate and tree growth at the individual-site scale and relatively uniform climate conditions among the weather stations, the regional STD chronology, hereafter referred to as the Driftless Oaks chronology, was selected for comparison with monthly divisional precipitation, maximum temperature, and PMDI data. We used the STD chronology in this case based on the consistency of climate response indicated among the RES chronologies and because the greater sample depth of the regional chronology increased our confidence that low-frequency variability retained in the STD chronology was related to regional climate rather than local conditions or events. Comparisons were carried out for the time period 1895–2014 using response function analysis, correlation analysis, and moving correlation analysis over 40-year windows as implemented in the dcc() function of the treeClim package for R (Zang and Biondi, 2015). Verification of each significant and stable climate–tree growth relationship was carried out using a split-sample approach where data from half of the period with instrumental climate data were used to calibrate the climate–tree growth relationship and verification was performed using the remaining data withheld from the calibration. The process was repeated with inverted time periods to complete the verification process. Regressions developed for each split sample were assessed through a suite of metrics including calculations of a sign test, product means test, reduction of error (RE) (Fritts, 1976), and coefficient of efficiency (CE) (Briffa et al., 1988). Where verification metrics were consistent between data sets, a linear regression-based transfer function was determined for the entire period. A reconstruction based on the Driftless Oaks chronology was developed for the period where the subsample signal strength (SSS), a more appropriate measure of signal quality in transfer-function-based climate reconstructions than the commonly referenced EPS (Buras, 2017), exceeded the suggested >0.85 threshold (Wigley et al., 1984). The reconstruction was then rescaled to match the variance of the instrumental PMDI record (Cook et al., 2004), with the equivalent variance explained for the rescaled reconstruction (r 2 vs ) calculated following McCarroll et al. (2015).
2.5 Interpreting the reconstruction
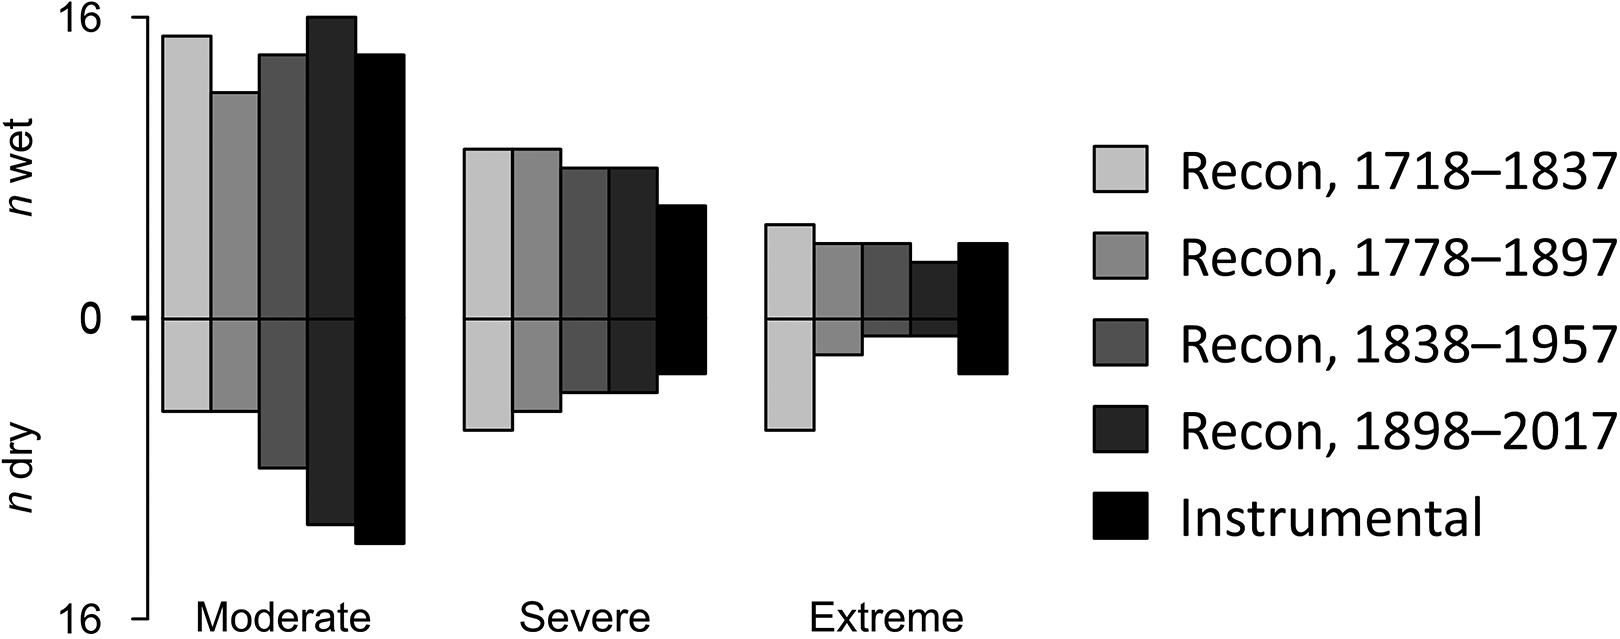
We characterized the Driftless Oaks PMDI reconstruction by quantifying drought frequency, duration, and intensity relative to the instrumental record (following Woodhouse and Lukas, 2006). The 10th percentile of wettest and driest years in the rescaled reconstruction were tabulated for comparison with the instrumental record and used to calculate the extreme value capture (EVC) for pluvial and drought conditions independently to identify potential bias in the reconstruction (McCarroll et al., 2015). Drought frequency was examined in the context of categories described by Palmer (1965): moderate (PMDI −2.0 to −2.9), severe (PMDI −3.0 to −3.9), and extreme (PMDI ≤ −4.0), where “[PMDI] of −4.0 spells economic disaster in any region in which the established economy is significantly dependent on the vagaries of weather for its moisture supply” (Palmer, 1965: 45). Pluvials were interpreted with respect to the comparable categories of moderate (PMDI 2.0 to 2.9), severe (PMDI 3.0 to 3.9), and extreme (PMDI ≥ 4.0). The frequency of each PMDI category was calculated for multiple 120-year periods of reconstruction to compare with frequencies of similar events over the 120 years of the instrumental record.
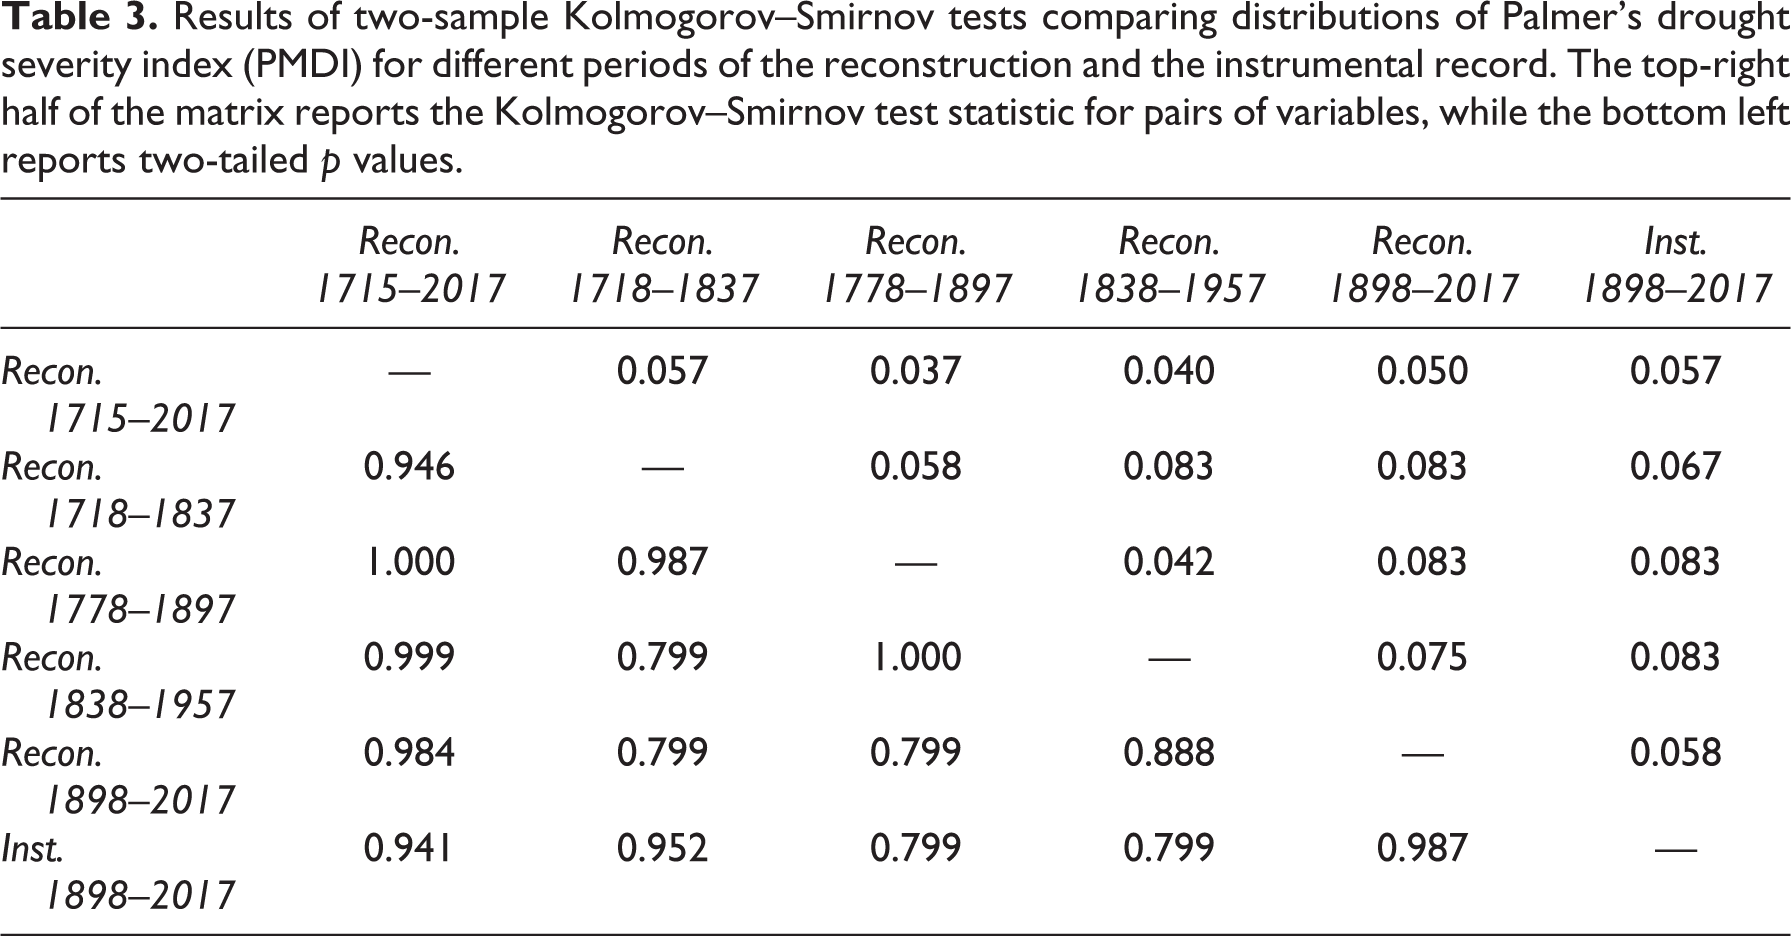
Variability in general drought conditions by century was examined by comparing four sets of reconstructed PMDI distributions to the instrumental data using two-sample Kolmogorov–Smirnov tests: 1718–1837, 1778–1897, 1838–1957, 1898–2017, and 1718–2017. Drought duration, an important consideration for management plans regarding the possibility of multi-year droughts, was quantified by runs analyses that summed the number of sequential years where reconstructed PMDI was greater or less than the mean from 1895–2017 to illustrate the duration of shifts in moisture conditions over time. Drought intensity, a measure that combines the severity of drought conditions with the duration of a drought, was quantified as the sum of summer PMDI during each period of continuous above- or below-average PMDI to account for cumulative effects during each episode. Though this metric is imperfect and does not account for moisture conditions during the intervening cool season, it does provide an estimate of the cumulative drought impacts over time, which may be particularly relevant to the growing season and agricultural production.
We compared our reconstruction to the nearest NADA and LBDA grid points to determine if this newly developed network of tree-ring chronologies provided additional insight into drought conditions over the Driftless Area. We obtained reconstructed PMDI for the 11 LBDA grid points that fell within NCDC Wisconsin Climate Division 7 and the boundaries of the Driftless Area (Figure 1b). Additionally, because the LBDA incorporates instrumental PMDI data into the available time series, we included the Palmer’s Drought Severity Index (PDSI) reconstruction from NADA grid point 208 (42.5°N, 90°W), which is based solely on tree-ring data and is the nearest to our study area, in our comparison (Figure 1b). The reconstructions for these grid points were largely based on the same available tree-ring data (see Figure 5 in Cook et al., 2010b) and included data from the original Iowa collections, additional collection sites in northern Illinois that had been used to reconstruct precipitation for the Midwest (Blasing and Duvick, 1984; Duvick and Blasing, 1981), and chronologies from outside of the Driftless Area. Of note, the calibration and verification of the LBDA for this region indicate skillful reconstructions, but are not as strong as for other regions of the continent (see Figure 6 in Cook et al., 2010b). Data from our Wisconsin sites were not incorporated into the grid point reconstructions and represent independent, local data used in the Driftless Oaks reconstruction.
We compared our Driftless Oaks reconstruction, the average LBDA time series, and NADA grid point 208 reconstructions to instrumental PMDI data for NCDC Wisconsin Division 7 with respect to interannual variability using correlation analysis over moving 40-year windows. The ability of each reconstruction to capture extreme values in the instrumental data was quantified by calculating residuals as the reconstructed value minus the instrumental value, with positive results indicating overestimation of moisture availability and negative results indicating an underestimation of moisture availability. We compared mean residuals between the different chronologies by quartile using t-tests. Direct comparisons of our reconstruction with the NADA and LBDA were conducted using moving correlation analysis between the two reconstructions over 40-year windows, as well as moving correlations of the series after they were filtered by (a) first-differencing to compare high-frequency variability, and (b) smoothing with 20-year cubic splines to compare low-frequency variability. We supplemented the correlation analyses by assessing coherence among the reconstructions over frequency and time domains using the wtc() function as implemented in the biwavelet package of R (Cazelles et al., 2008; Grinsted et al., 2004).
We estimated the spectral density of the Driftless Oaks reconstruction using the non-parametric multitaper method (MTM) (Riedel and Sidorenko, 1995; Thomson, 1982). We chose MTM from the range of spectral analysis techniques for its strengths in analyzing data with quasi-periodicity, potentially low signal-to-noise ratios, and potentially non-stationary characteristics (Mann and Lees, 1996). We conducted the spectral analysis over a range of time-bandwidth and taper conditions and found relatively consistent results. The final analysis was conducted with a time-bandwidth parameter of four over eight Slepian tapers, centered using the Slepian method, and implemented in the multitaper package of R (Rahim and Burr, 2016). Significance in spectral power was tested using the harmonic F-test (p < 0.01) to account for the complexity of climate time series (Mann and Lees, 1996; Thomson, 1982). We examined the changes in these modes of variability over time using a continuous Morlet wave transform (Torrence and Compo, 1998) as implemented in the dplR package in R (Bunn, 2008).
To link our analyses of periodicity in the Driftless Oaks reconstruction to known drivers of regional and hemispheric climate variability, we explored the potential influences of explosive volcanic eruptions and several oceanic–atmospheric processes on drought in southwest Wisconsin. Though the impacts of volcanic eruptions on tree growth have most often been examined at relatively cool sites where temperature is a primary limiting factor (e.g. Salzer and Hughes, 2007), the lower temperatures (Cole-Dai, 2010) and increased diffuse light levels (Gu et al., 2003) produced by climatically effective volcanic eruptions could potentially improve growing conditions in regions where tree growth is limited by drought, such as in the prairie–forest ecotone of the Driftless Area. We therefore tested for the effects of volcanic eruptions on climate in southwest Wisconsin, first using instrumental temperature, precipitation, and drought data to ensure a link existed to regional climate, and then the Driftless Oaks PMDI reconstruction. We examined departures in mean climate conditions for each year of a seven-year window (t−1 to t+5) around a set of major eruptions described by Robock (Table 1 in Robock, 2000) using superposed epoch analysis (SEA) (Lough and Fritts, 1987). Based on preliminary analyses, the instrumental data used were NCDC Wisconsin Division 7 mean maximum temperatures from previous-year November through current-year July, mean annual precipitation, and mean growing season PMDI (March–October). Mean departures were compared to boot-strapped confidence intervals derived from 1000 Monte Carlo simulations for the determination of significance as implemented in the SEA function in the dplR package in R (Bunn, 2008).
To investigate possible teleconnections relevant to the climate of our study area (Andresen et al., 2012), we compared NCDC Wisconsin Division 7 mean June–August PMDI with monthly and annual time series of the North Atlantic Oscillation (NAO), Pacific Decadal Oscillation (PDO), Pacific-North American pattern (PNA), the Southern Oscillation Index (SOI), NINO3.4, and NINO4 obtained from the Global Climate Observing System Working Group on Surface Pressure (www.esrl.noaa.gov/psd/gcos_wgsp, accessed February 25, 2016). Indices for phenomena with interannual variability were compared with PMDI by correlation analysis and were considered for both the current and previous years to consider lagged relationships. Potential influences of the PDO, which is characterized by low-frequency regime shifts, were investigated by assigning each year of the PDO time series to either positive or negative phase as defined by Mantua et al. (2002), stratifying the correlation analyses between climate and the interannual climate indices by PDO phase, and comparing mean PMDI by phase of the PDO through Student’s t-tests.
Finally, to explore the usefulness of our reconstruction for informing the effects of climatic variability on agricultural productivity, we compared our drought reconstruction to annual yields per acre of corn and soybeans in Grant County, southwest Wisconsin, which is entirely within our study area and where irrigation systems are uncommon. Annual crop yields per acre were obtained from the US Department of Agriculture National Agricultural Statistics Service Quick Stats portal (https://quickstats.nass.usda.gov/, accessed August 5, 2019). Yield data were available for the years 1928–2018 for corn and 1938–2018 for soybeans. Both crop yield series exhibited exponential increases over time, likely due to changing technology, crop genetics, and planting techniques (Garcia et al., 1987), and were therefore standardized by dividing the value for each year by the value predicted for the same year using a 20-year smoothing spline. The resulting standardized crop yields were compared to the Driftless Oaks reconstruction using correlation analysis over the full extent of their overlap, as well as over moving 40-year windows, forward evolutionary windows beginning with the first 40 years of overlap, and backwards evolutionary windows to examine changes in the relationship between crop production and climate over time.
III Results and discussion
We collected tree-ring samples from a total of 420 living trees, 15 stumps, and 17 beams from six historic structures at 46 sites across southwest Wisconsin and updated existing chronologies at four sites in northeast Iowa (Figure 1). Crossdating was successful on 812 of 852 core samples and cross sections, including all samples collected from historical structures. Samples that did not crossdate were generally short sequences due to rot and exhibited relatively little interannual variability. Combined with data from previous collections in Iowa, our total data set included 1003 measurement series from 520 trees, 15 stumps, and 15 timbers from historical structures that yielded 50 site chronologies, 43 of which were derived from living trees. Earliest dates ranged from 1631 to 1921, and mean series inter-correlations ranged from 0.45 to 0.72 (Table 1, Figure 3a).
Site information for the Driftless Oaks chronologies.

Descriptors include the number of trees by species (Quercus alba [QUAL]; Quercus macrocarpa [QUMA]) for collections by University of Wisconsin-Platteville researchers, mean inter-series correlation among all measured series (r-bar) and first year of a 40-year window where the expressed population signal (EPS) was >0.8 (Wigley et al., 1984). Species is listed as Quercus for historical structures due to the extremely similar anatomy of bur and white oak (Hoadley, 1990).

Site-level characteristics including (a) temporal extent and common interval of the individual RES chronologies, (b) a plot of inter-chronology correlation against distance to visualize distance decay, (c) a biplot of axis 1 and axis 2 PCA scores illustrating the general overlap of most chronologies in ordination space, (d) a plot of within-group synchrony over time, and (e) a plot of between-group synchrony over time. Collectively, these results depict a relatively coherent regional pattern of tree growth among the sites, with a somewhat stronger relationship among sites in the central and southern parts of the study area.
A plot of inter-chronology correlations and distance between chronologies revealed no trend, indicating that distance decay, though visually present, was not significant and less important than variations in local site conditions in creating differences among our chronologies (Figure 3b). The common interval of the RES chronologies spanned 1864–2012 and included 40 chronologies, with the three living tree chronologies that were excluded never meeting an EPS cutoff of 0.8 due to low sample depth (Figure 3a). Each of the 40 chronologies was assigned to a subjectively delineated region for comparison of growth patterns in different parts of the study area. This process was repeated iteratively with 3–6 regions used, all of which produced approximately the same results (Figure 1 shows division of sample locations into northern, central, and southern regions). The first two axes of the PCA explained only 20% of the variance in the original data, indicating a relatively weakly structured matrix that could be in part due to the low sample depth in individual-site chronologies. No gradients were visible in the biplots with any set of geographic regions and the distribution of sites from each region showed considerable overlap in ordination space, with the exception of one site in the southern region (site PMT in Table 1 and located on UW-Platteville campus property) and one site in the northern region (site JBL which included only five trees) (Figure 3c). Thus, the low explained variance by the leading eigenvectors further supports the idea that climate and climate–tree growth patterns have been relatively consistent across the region for at least the past 150 years.
The variance–covariance modeling identified a general positive-definite matrix structure as the best fit in consideration of three regions. Overall, synchrony within regions was consistently stronger and increasing over time among the central and more southern sites and weaker, with some deterioration over time, among the northernmost sites (Figure 3d). Synchrony among regions was greatest for the southern and central regions, and again weaker in all comparisons to the northern sites (Figure 3e). This suggests that the northernmost RES chronologies exhibit somewhat different growth patterns over time, potentially related to the difference in precipitation identified among the HCN climate time series described below. The increasing within-group synchrony over time among central and southern sites could be an indication of increased homogeneity in forest structure since the 1800s due to altered land-use and disturbance regimes across the region (Rhemtulla et al., 2009), though similar changes would be expected among the northern sites. Despite these moderate differences in synchrony over space and time, as a whole the variance–covariance models suggested that the trees sampled for the Driftless Oaks have expressed relatively similar variability in growth patterns since at least the 1860s. Together, these analyses support the development of a regional ring-width chronology while giving note that the chronology may not capture climate conditions in the northern reaches of our study area as well as in the south. The combined Driftless Oaks STD chronology spanned 1631 to 2017, with a robust EPS beginning in 1673 and SSS beginning in 1715 (Figure 4).
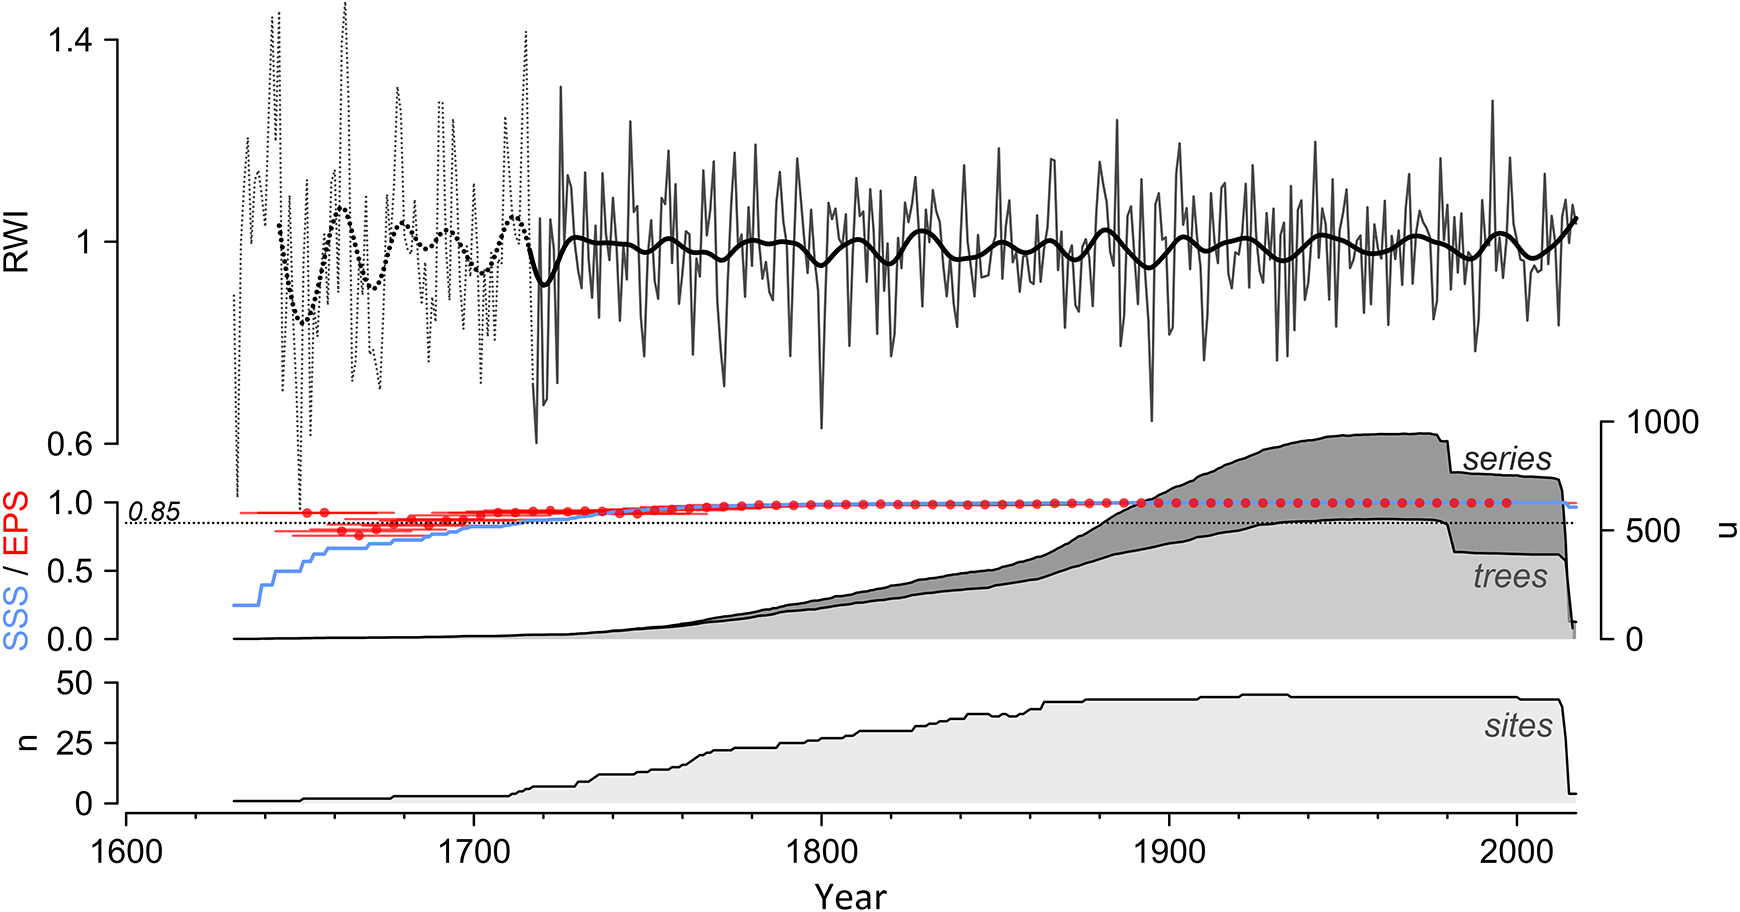
The Driftless Oaks chronology, including the annual standard (STD) ring-width index chronology as a gray line overlain with a bold 15-year spline to highlight low-frequency variability in the chronology, the expressed population signal (EPS) of the chronology calculated over 40-year windows, Subsample Signal Strength (SSS), and the number of series, trees, and sites incorporated into the chronology over time.
Data for the weather stations within our study area illustrated relatively similar conditions over time with a few exceptions (Figure 2b). Despite these minor differences among the HCN records, correlations between the HCN and divisional data using the seasonal variables ranged from r = 0.90–0.96 for temperature and r = 0.83–0.91 for precipitation, all highly significant, supporting the use of divisional climate data as a target for calibration and reconstruction. Comparison of the 43 RES chronologies from living trees with the seasonalized NCDC Wisconsin Division 7 climate variables identified significant (n > 93, p < 0.05) correlations with June–July maximum temperatures for 41 sites (mean r = −0.39), April–June precipitation for 42 sites (mean r = 0.43), and June–August PMDI for all 43 sites (mean r = 0.46). Moving 40-year correlations indicated that most site chronologies exhibited significant correlations (r > 0.26, df = 38, p < 0.05) with each variable for the duration of the instrumental record (Figure 5). Overall, correlations with June–August PMDI were the strongest and most consistent among the seasons considered over the instrumental period. Collectively, these results supported the creation of a regional chronology and the choice of summer drought as the target variable for reconstruction.
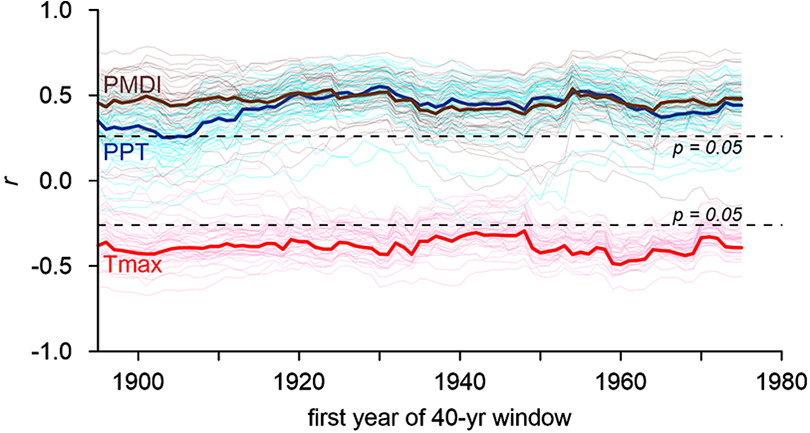
Moving correlations between each of 43 individual residual (RES) chronologies and seasonalized NCDC Wisconsin Division 7 climate variables including June–July maximum temperature (Tmax), April–June precipitation (PPT), and June–August Palmer’s drought severity index (PMDI). Thin lines represent correlations for individual-site RES chronologies; bold lines indicate the mean correlation across all sites.
Correlation analysis between the Driftless Oaks chronology and monthly climate identified a classic moisture-sensitive climate response including significant inverse correlations and response functions with current and previous growing season maximum temperatures, significant positive correlations and response functions with growing season precipitation, and significant positive correlations and response functions with current-year PMDI (n = 123, |r| > 0.28, p < 0.05) (Figure 6a). Moving correlation analyses indicated a stable relationship between the chronology and May–October PMDI at the scale of 40-year windows (Figure 6b). Our reconstruction focused on June–August PMDI to maximize comparability with the NADA and LBDA. Verification metrics indicated significant and skillful reconstructions of drought for both sides of the split verification, and a linear regression transfer-function based on the entire instrumental record explained 45% of the variance in instrumental summer drought (Figure 7a).
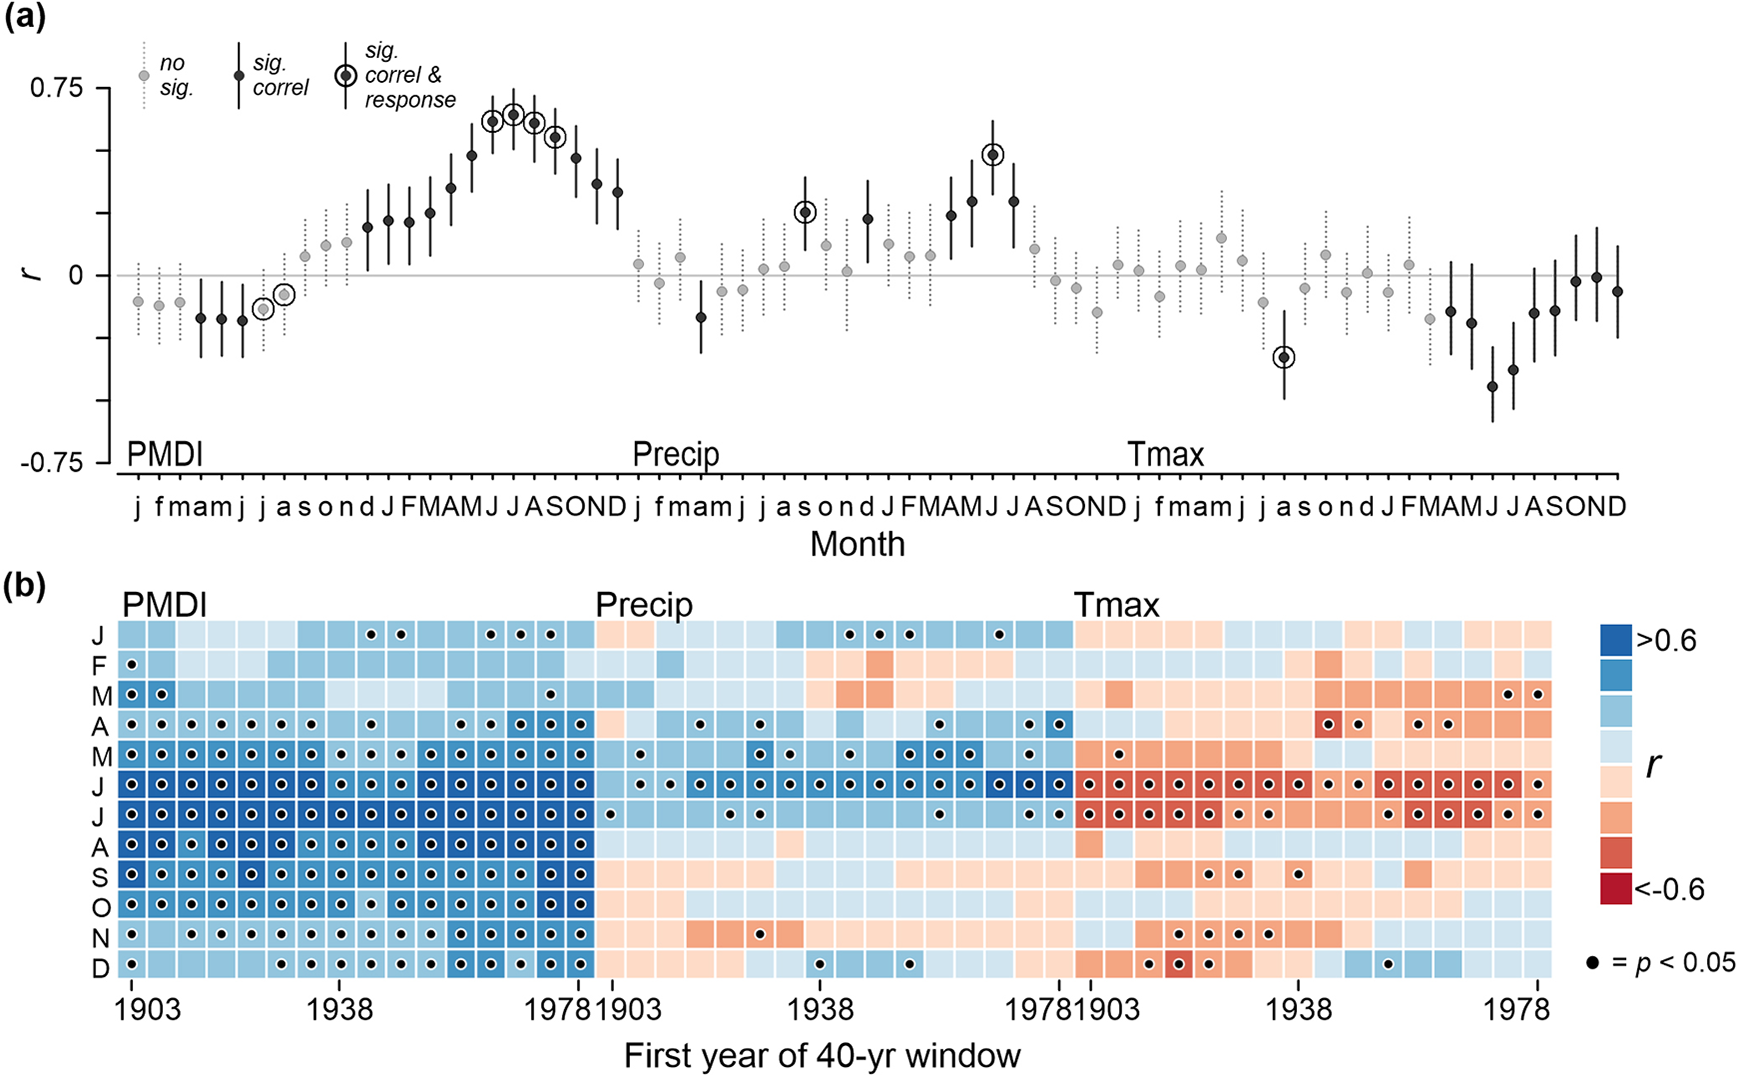
Climate–growth relationships exhibited by the Driftless Oaks chronology.
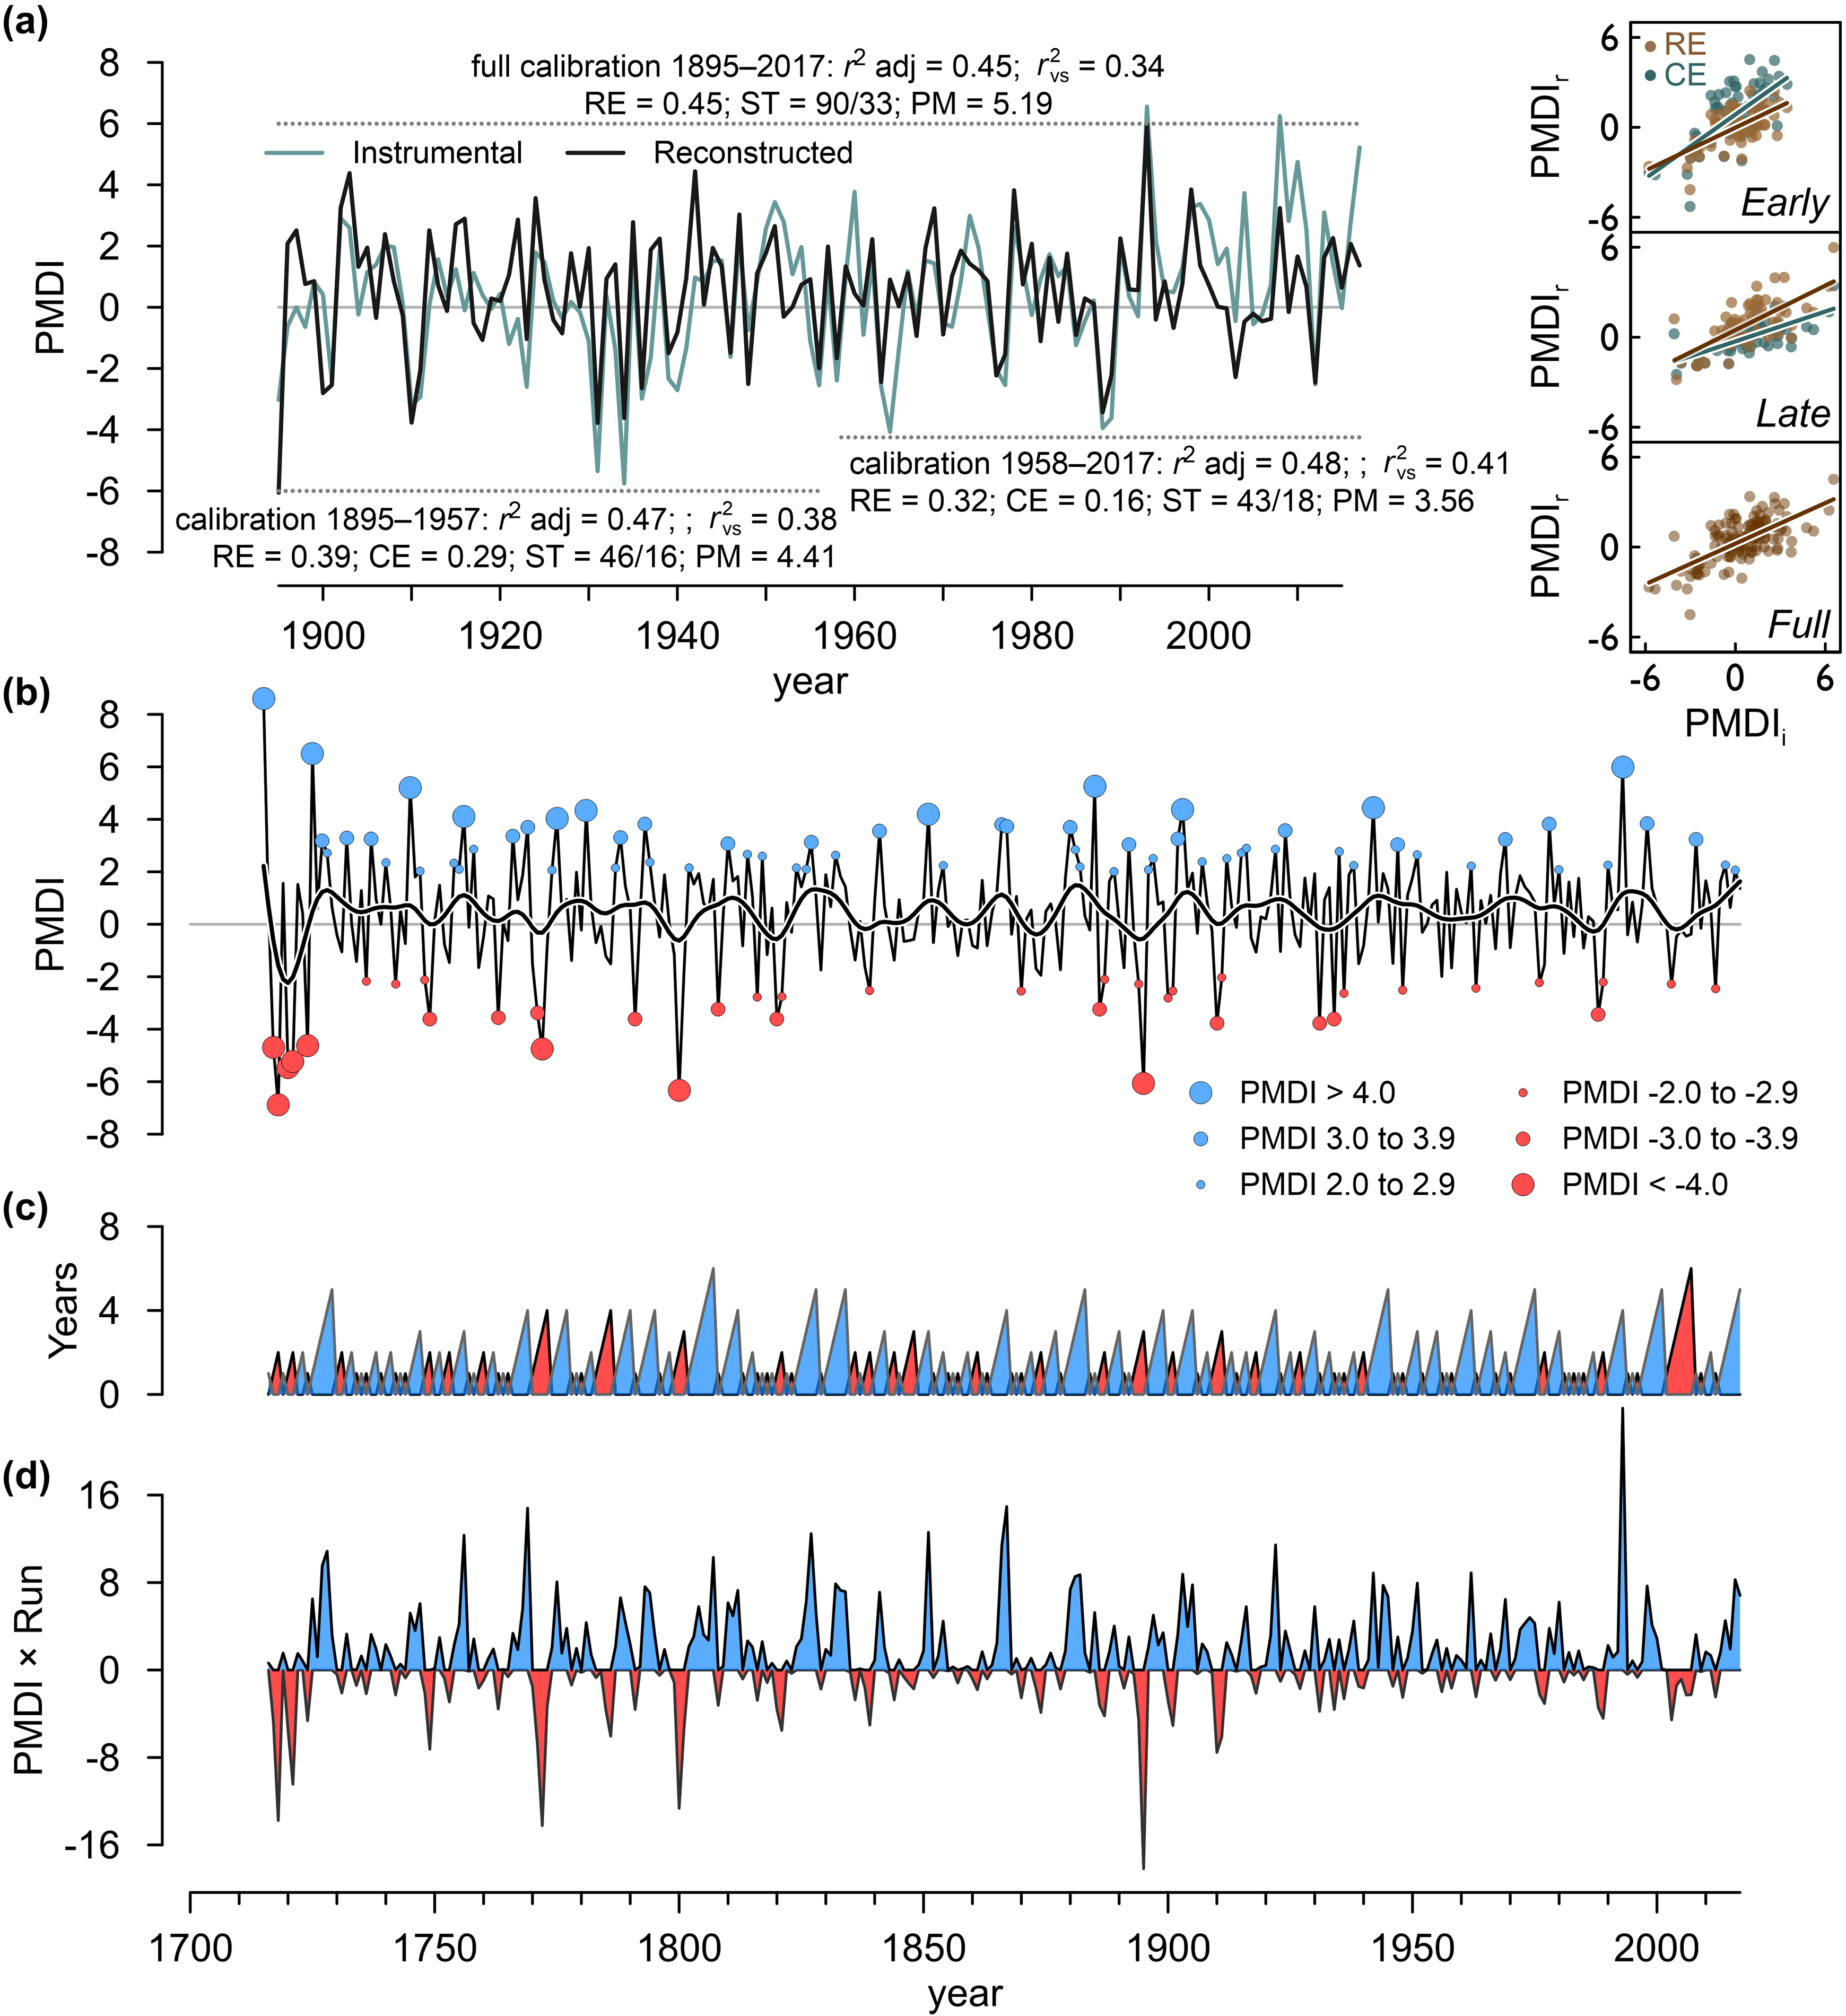
Reconstruction of National Climatic Data Center Wisconsin Division 7 June–August Palmer’s drought severity index (PMDI) based on the Driftless Oaks chronology.
Visual examination of the instrumental and reconstructed PMDI time series over the calibration period identified an apparent weakening in relationship between the series over the 2000s and 2010s due to the trees not capturing the full extent of recent extreme wet events. This weaker relationship was clearly illustrated in scatter plots of reconstructed and instrumental PMDI for each of the calibration and verification windows (Figure 7a). In a post-hoc comparison, calibration and verification based on the period 1955–2000 returned stronger results than the period 1955–2017 (r 2: 0.51 vs. 0.45, RE: 0.39 vs. 0.36, CE 0.29 vs. 0.20). Calibration based on the period 1895–2000 produced a reconstruction that explained more variance over the instrumental record than the reconstruction based on the full calibration (r 2 0.49 vs. 0.45) and exhibited a significantly lower mean based on a two-sample T-test (mean PMDI 0.39 vs. 0.15, t = 1.71, df = 772, one-tailed p = 0.04). Rescaling each version of the reconstruction to the instrumental data yielded identical reconstructions, however, suggesting that while the extreme wet conditions of the 2000s were not fully represented in tree growth, and thus resulted in a lower r 2 value, the overall relationship between climate and patterns of tree growth was consistent over the calibration period. We therefore used the full 1895–2017 instrumental period in our calibration. Based on the period where SSS >0.85 (Figure 4), the final Driftless Oaks drought reconstruction extended from 1715–2017 (Figure 7b).
A weakening of the statistical relationship between tree growth and drought over the first two decades of the 2000s has been documented elsewhere in the Midwestern United States (Maxwell et al., 2016), though a clear mechanism is yet to be identified. If recent patterns in precipitation are within the range of variability over the extent of our chronologies, then including their influence on the resulting reconstruction would be appropriate. However, if these conditions are unprecedented in the lifetimes of the trees sampled for this work, a strong likelihood given the projected impacts of climate change on precipitation patterns in southwest Wisconsin (WICCI, 2011), then exclusion of precipitation data for the 2000s to produce a reconstruction that is more representative of past conditions could be justified. Previous drought reconstructions for central North America corroborate the extraordinary recent pluvial in which the 20th century was the wettest in 300–400+ years (Ford, 2014; Maxwell and Harley, 2017). Furthermore, we have anecdotally observed an unusual “graying” of oak leaves on trees across the Driftless Area over recent years, in many cases leading to the eventual death of the afflicted trees. A similar phenomenon has been observed elsewhere in the region and may be associated with excessive soil moisture during the growing season (Kueper, 2020). Researchers in Spain documented negative impacts of wet spring soils on oak health (Rozas and García-González, 2012), and a similar relationship with spring moisture has been documented in other North American oak savanna systems (Gildehaus et al., 2015). While we feel the reconstruction reported here and analyzed below is a robust representation of historical climate conditions, increased precipitation projected in many climate change scenarios and documented for the Driftless Area (WICCI, 2011) may act as a stressor for oaks adapted to the drier conditions found in sites that historically supported oak savanna. Further research on this topic is warranted.
The EVC of the reconstruction was significant for both dry years (4 of 12 years, p < 0.05) and wet years (7 of 12 years, p < 0.001), with an overall extreme value capture rate of 46% (p < 0.001). In addition to better representing wet conditions, the overall Driftless Oaks reconstruction exhibited a bias toward positive PMDI values in terms of mean conditions (mean reconstructed PMDI = 0.45) that closely matched the instrumental period for Wisconsin NCDC Division 7 (mean PMDI = 0.47) due to rescaling. This bias toward better representation of pluvial extremes is likely a result of the identified climate response of oaks in the Driftless Area aligning with peak seasonal delivery of moisture, and notably highlights the potential under-representation of extreme drought conditions over the reconstruction (Wise and Dannenberg, 2019). We therefore stress that our reconstruction is a minimum estimate of past droughts and likely underestimates the full depth of drought conditions over time. Given this known bias, the distribution of 10th percentile events was uneven over the extent of the reconstruction. A total of 24 events in the upper and lower 10th percentiles occurred in the 1700s, 18 such events occurred in the 1800s, and 17 events occurred in the 1900s (Table 2). Based on the categories described by Palmer, a cluster of extreme drought years (PMDI ≤ −4.0) occurred in the early 1700s but were otherwise relatively evenly distributed though time (Figure 7b, Table 2). Interpretation of the early 1700s should be cautious because, although robust during this time, sample depth of the chronology is low. However, a precipitation reconstruction for Iowa indicates this is a time of extreme low precipitation (Blasing and Duvick, 1984), and an as-yet unpublished set of eastern redcedar chronologies being developed by the authors from sites across the Driftless Area indicates a marked period of high temperatures during the early 1700s that aligns with the drought indicated in the Driftless Oaks reconstruction; this combination can result in extreme drought conditions (Griffin and Anchukaitis, 2014).
The driest and wettest years in the Driftless Area of southwest Wisconsin over the past three centuries listed by year and summed by century.

PMDI: Palmer’s drought severity index
The runs analysis depicted a climate system with relatively little low-frequency variability, with no period of consistently wet or dry conditions longer than six years documented in the past 300 years (Figure 7c). Shorter duration pluvials and droughts of 3–5 years occurred more frequently, with 36 such events in the reconstruction. The mean wet run was 2.5 years and the mean dry run was 1.5 years. Drought intensity illustrated four droughts that exceeded any experienced during the instrumental record, including during the 1720s–1730s, 1770s, 1790s, and 1890s, and a general lack of deep, prolonged drought during the instrumental record (Figure 7d). This trend toward wetter conditions is similar to that documented in the surrounding states of Indiana, Illinois, and Iowa (Ford, 2014; Maxwell and Harley, 2017). The frequency of moderate, severe, and extreme PMDI values varied among the periods considered and clearly illustrated two key aspects of the reconstruction: (a) the bias toward representing wet conditions and (b) the high number of extreme drought events documented in the early 1700s (Figure 8). These two points either indicate flawed assumptions (rescaling based on the full instrumental record in a time of potentially unprecedented climate and the potential effects of lower sample depth) or important components of the hydrologic history of the Driftless Area (representation of a broader range of historical conditions and identification of an important regional drought), and both require additional research to address. Importantly, however, no differences in PMDI distributions were identified among the instrumental data and the different periods of the reconstruction, suggesting that overall the Driftless Oaks reconstruction is likely representative of drought conditions through time (Figure 9, Table 3).
Frequency in years of wet and dry conditions for different periods of the Driftless Oaks reconstruction and instrumental Palmer’s drought severity index (PMDI) records.

Probability density functions of instrumental and reconstructed Palmer’s drought severity index (PMDI) over different time periods.
Results of two-sample Kolmogorov–Smirnov tests comparing distributions of Palmer’s drought severity index (PMDI) for different periods of the reconstruction and the instrumental record. The top-right half of the matrix reports the Kolmogorov–Smirnov test statistic for pairs of variables, while the bottom left reports two-tailed p values.
Comparison of the Driftless Oaks, the mean of the LBDA grid point reconstructions, and NADA grid point 208 to NCDC Wisconsin Division 7 PMDI indicated that while all of the reconstructions were significantly correlated with the instrumental data for the full period considered, differences among the reconstructions emerged in the late 20th century. The Driftless Oaks reconstruction and LBDA exhibited stronger correlations during the 1950s through the 1970s, while the LBDA was the superior time series after that period because it directly incorporated instrumental measurements (Figure 10a). Residuals were broadly similar among the different reconstructions, in that they overestimated available moisture during the driest years and underestimated available moisture during the wettest years (Figure 10b). The NADA and LBDA better captured droughts around the 25th percentile, while the three reconstructions captured conditions from the 30th to 50th percentiles nearly identically (t < 0.8 and p > 0.23 in both cases). The Driftless Oaks better represented available moisture in the 50th–75th percentiles (t = 1.4 and p = 0.08 with LBDA; t = 1.6, p = 0.06 with NADA). The Driftless Oaks reconstruction and LBDA more closely represented dry conditions during the most extreme years, while the NADA and LBDA performed better in the very wettest years. It should be noted, however, that seven of the years with the greatest available moisture in the instrumental record occurred after the 2003 end date of the NADA. Explanations for these results lie in the spatial characteristics of the phenomena recorded. Precipitation is relatively patchy at regional scales, making the local Driftless Oaks reconstruction more capable of accurately representing years of moderate PMDI, particularly for wetter years. More extreme droughts and pluvials, however, are often expressed at regional to continental scales (Andreadis et al., 2005), likely enabling the broader distribution of chronology sites utilized in the gridded drought atlas reconstructions to capture variability at those scales.
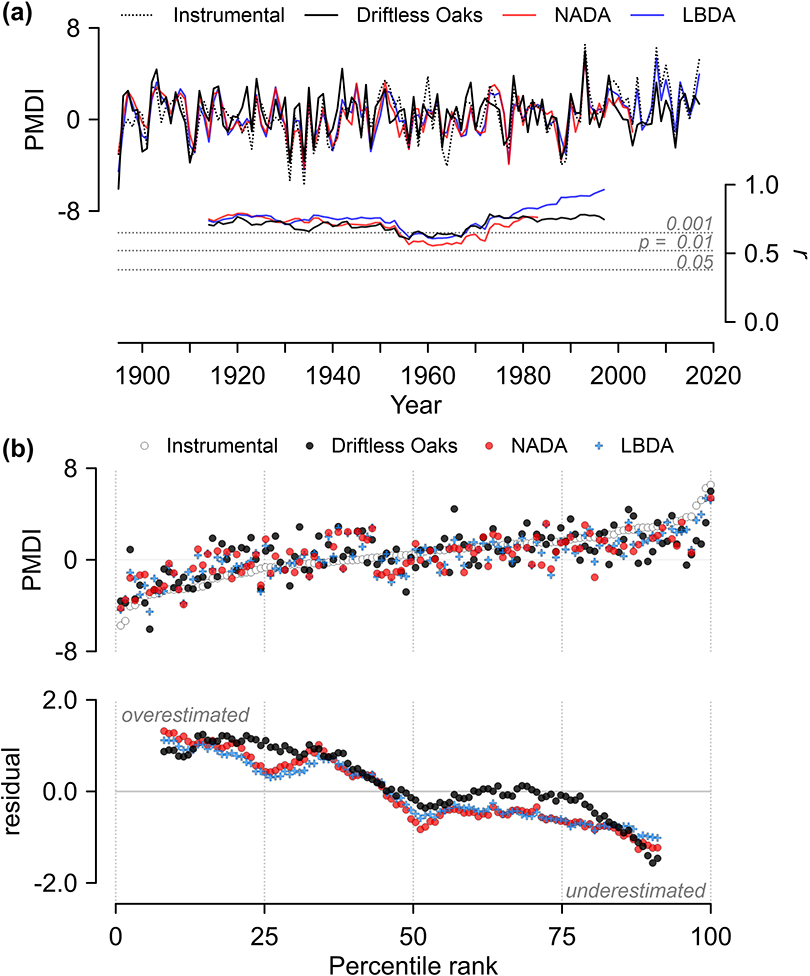
Comparison of the Driftless Oaks, North American Drought Atlas (NADA), and Living Blended Drought Atlas (LBDA) reconstructions with instrumental Palmer’s drought severity index (PMDI) data for National Climatic Data Center Wisconsin Division 7.
When considered over the full reconstruction period, all three reconstructions largely captured the same high-frequency variability in drought conditions and differed most at low frequencies (Figure 11a, 11b). Overall, the moving correlations were stronger between the first-differenced reconstructions than the unfiltered interannual reconstructions, while correlations were consistently stronger between the Driftless Oaks and the LBDA reconstructions compared to the NADA reconstruction (Figure 11c). Differences between the smoothed reconstructions were evident in the mid-1700s, early 1800s, and again in the mid-1800s. In each case the Driftless Oaks reconstruction indicated wetter conditions than either the LBDA or the NADA, with correlations between the smoothed chronologies completely deteriorating for much of the 1700s. Coherence between the Driftless Oaks and NADA reconstructions varied over time and periodicity, with the greatest coherence at lower periodicities over the 1800s and 1900s alongside substantial periods of difference at the 4–16 year periodicity for much of the overlap between series (Figure 11d). Coherence was stronger and more consistent with the LBDA with the exception of the 4–16-year band for much of the 1800s and late 1900s (Figure 11e). Coherence at 32+ year periodicity was negligible in both cases, likely due to the effects of standardization with 30-year splines and a substantial loss of signal at lower frequencies. Overall, the results of these comparisons in the context of the tree-ring data on which the LBDA and NADA are based suggest that drought conditions in the Driftless Area are broadly similar to regional and sub-continental scales in the 16–32-year band of periodicity. Local variability, and thus local data, become increasingly important at a periodicity around 4–16 years, particularly during years of moderate moisture conditions. This is well illustrated by the lower correlations among the reconstructions during the mid-1800s, a period with relatively few extreme drought or pluvial events (Figures 11a, 11c).

Comparison of the Driftless Oaks, Living Blended Drought Atlas (LBDA), and North American Drought Atlas (NADA) drought reconstructions (a) as interannual time series and (b) reconstructions smoothed using 15-year splines, (c) moving correlations over 40-year windows comparing the interannual reconstructions and each reconstruction filtered through first-differencing and the 15-year smoothing spline, (d) coherence between the Driftless Oaks and NADA reconstructions, and (e) coherence between the Driftless Oaks and LBDA reconstructions.
Reconstructions from previous studies have shown severe droughts that occurred in the North American West and Plains regions during the period overlapping this study, yet in each case the Driftless Area was depicted to be on the fringe of the most severe drought conditions. Stahle et al. (2007) report two significant, single-year droughts for central North America in the mid-1800s, the Kiowa “Sitting Summer” drought of 1855 and the “Yankee Weather” drought of 1864, that fell within a broad period of mid-1800s drought identified by Herweijer et al. (2007), yet neither of these years were remarkable in the Driftless Oaks reconstruction and the spatial signature of each drought weakened toward the Driftless Area. A drought reconstruction for the Central Lowland Plains of Missouri and southern Iowa developed by Stambaugh et al. (2011) identified similar extreme conditions in the early 1700s, and shared several severe drought years with the Driftless Oaks reconstruction, including 1800 and 1820.
Spectral analysis of the Driftless Oaks reconstruction identified four significant peaks in frequencies, including peaks circa 4.1, 4.4, 4.7, and 12.6 years (Figure 12a). The multiple peaks of circa 4.1–4.7 years are broadly similar to peaks evident in regional tree-ring records that attenuates toward our study area (Meko et al., 1985), but overall the bi-decadal periodicity often identified in Great Plains tree-ring-based hydrologic reconstructions is lacking (Blasing and Duvick, 1984; Stambaugh et al., 2011; Stockton and Meko, 1983). When viewed over time, none of these peaks in variability were consistent as visualized through the wavelet transform (Figure 12b). Overall, the results of the spectral analysis and wavelet transform illustrate that drought variability, as estimated by the Driftless Oaks reconstruction, contains important periodicity, but that this periodicity shifts over time.
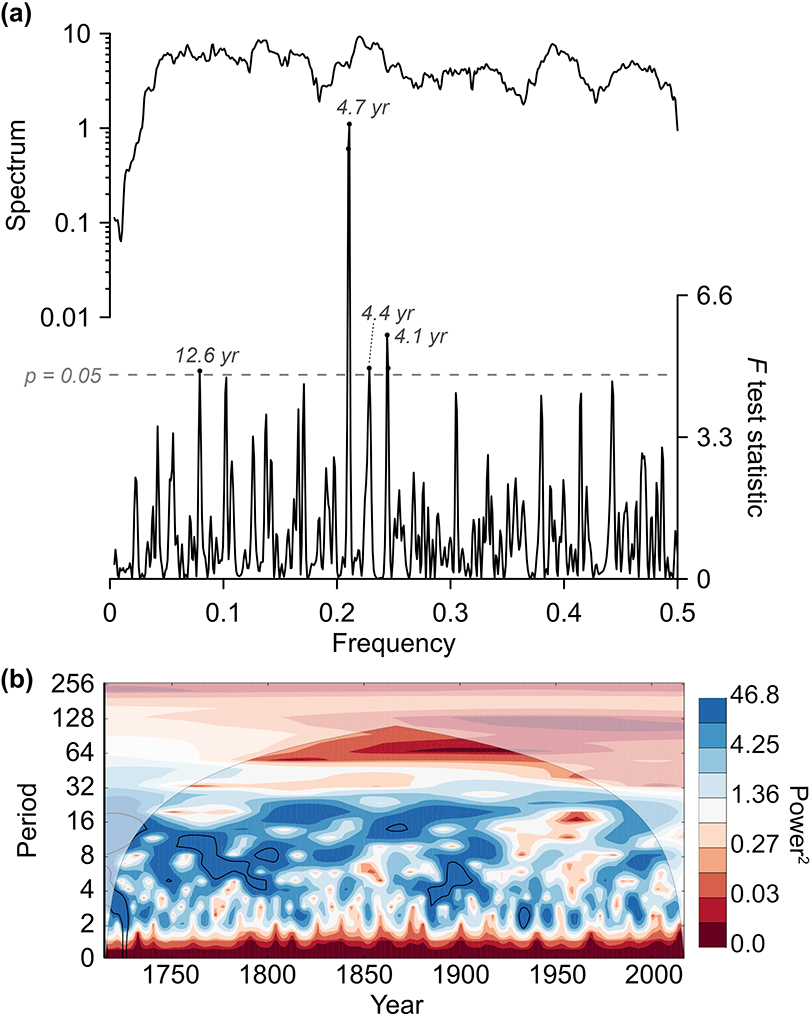
Spectral density and wavelets of the Driftless Oaks June-July-August (JJA) Palmer’s drought severity index (PMDI) reconstruction.
Comparing the Driftless Oaks reconstruction to volcanic eruptions identified a significant positive departure in PMDI two years following major eruptions and a significant negative departure three years following (Figure 13a). The physical mechanism explaining the positive PMDI departure at a two-year lag likely includes, at least in part, significantly cooler conditions (Figure 13b) and higher precipitation (Figure 13c) identified in the instrumental record for NCDC Wisconsin Division 7 two years after major eruptions, while explanation of the negative departure is more ambiguous. The reductions in temperature that follow major eruptions (Robock, 2000) alter hydrologic conditions for multiple growing seasons by reducing evaporation in many cases (Grinsted et al., 2007) and potentially increasing water-use efficiency through increased levels of diffuse light, as has been documented in the temperate forests of the Midwestern United States (Rocha et al., 2004; Yang et al., 2010) and elsewhere (e.g. Zhang et al., 2011). Together, these results represent a local expression of global-scale phenomena in the hydrologic conditions of the Driftless Area.
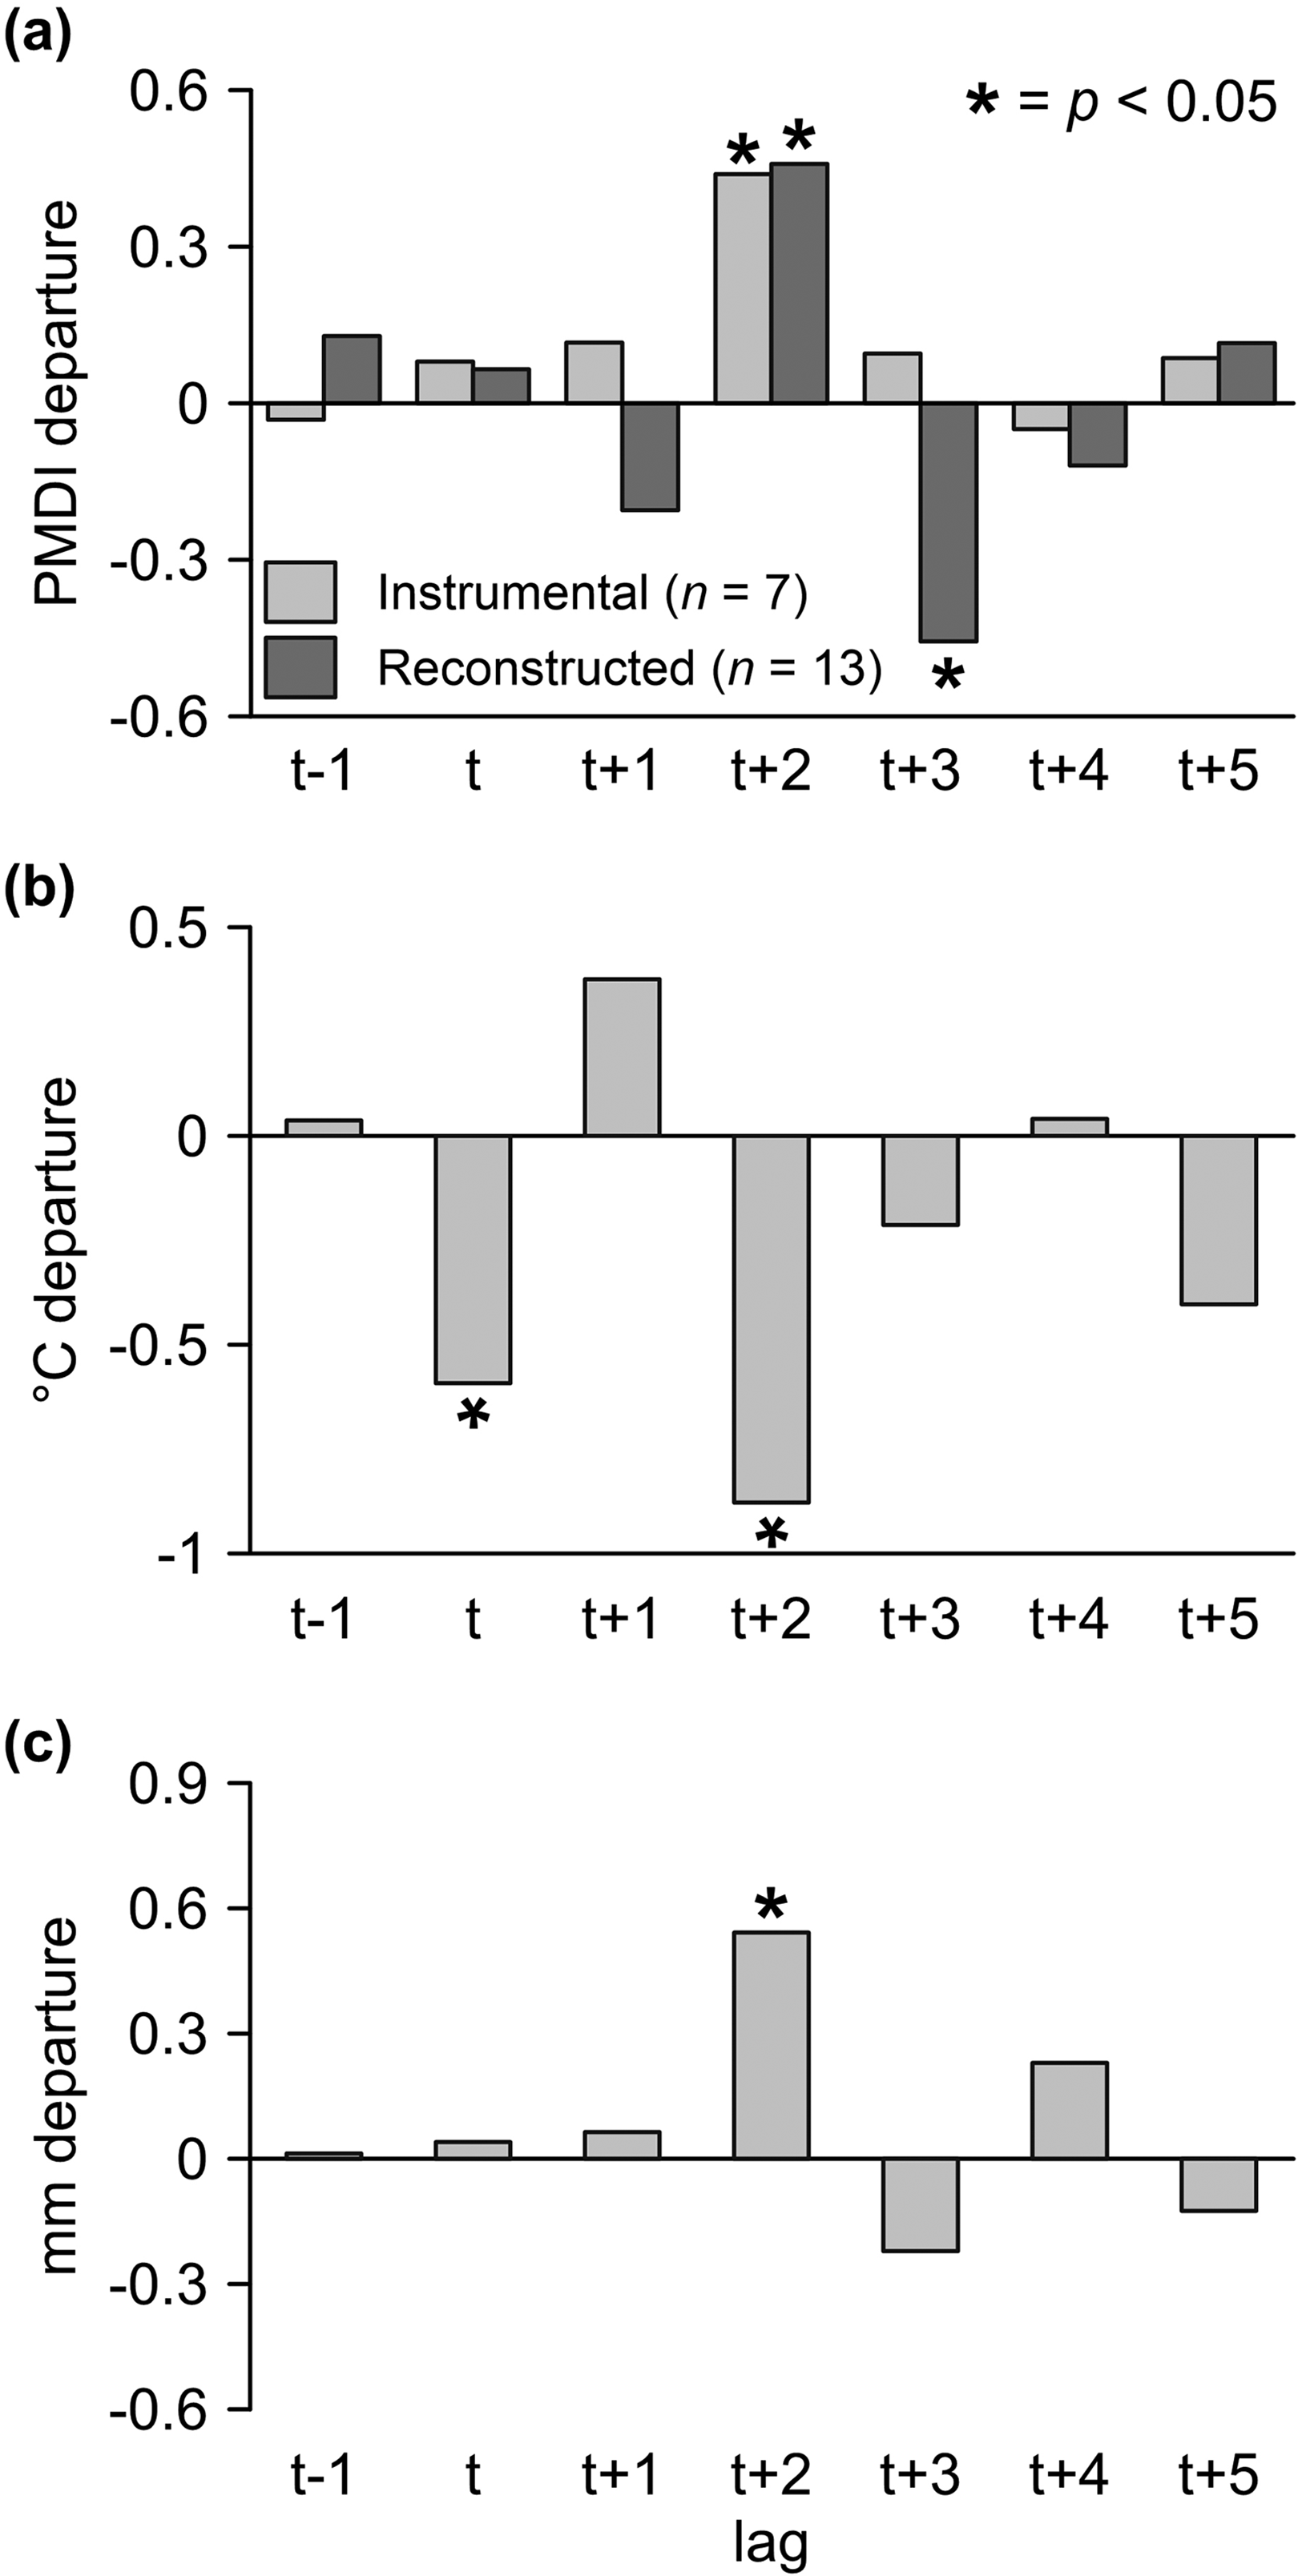
Results of superposed epoch analyses comparing major volcanic eruptions (eruption year is labeled “t”) of the past 250 years based on dates reported by Robock (2000) with (a) mean instrumental March through October Palmer’s drought severity index (PMDI) and reconstructed June through August PMDI for southwest Wisconsin based on the Driftless Oaks residual chronology, (b) mean maximum temperature from January through July, and (c) mean annual precipitation. Instrumental climate data are for National Climatic Data Center Wisconsin Division 7.
Comparison of instrumental summer PMDI to coupled oceanic–atmospheric climate indices indicated relatively weak influences of teleconnections on the climate of the study area. No significant correlations were identified between PMDI and any of the climate indices considered when compared over the full time period of each index, with correlations ranging from 0.04–0.11. Comparison of monthly PMDI with PDO phase identified only one month (June) with a significant relationship within the instrumental PMDI record, which exhibited drier conditions during positive phase PDO (mean PMDI = 0.12) than during negative phase PDO (mean PMDI = 0.98, t = −1.97, p = 0.03). Though often considered to have the greatest impact on cool season hydrologic conditions (Mantua and Hare, 2002), the influence of northern Pacific Ocean sea surface temperatures has been linked with June–July–August drought in the Upper Midwest (Barlow et al., 2001). However, a trend toward higher PMDI values over recent decades in the instrumental record may have driven this result, as no significant difference among PDO phases is evident in regional instrumental data when they are considered from the years 1900–1998.
Despite the potentially weak direct relationship between PDO and Driftless Area drought conditions, stratification of correlation analyses with other indices by PDO phase resulted in a set of significant relationships identified between PMDI and the ENSO indices during warm PDO conditions. These relationships included significant correlations between PMDI and mean SOI from previous October through April (r = −0.41, p = 0.0002), March through June NINO3.4 (r = 0.30, p = 0.006), and previous November through September NINO4.0 (r = 0.31, p = 0.004). These results suggest that warm phase PDO conditions extend the reach of ENSO teleconnections into southwest Wisconsin, leading to moderately wetter summers during El Niño-like conditions and moderately drier summers during La Niña conditions. No significant results were identified with the NAO. Similarly weak relationships were identified between each of the indices considered and the Driftless Oaks reconstruction. The overall conclusion drawn from these results is that although coupled oceanic–atmospheric processes do influence summer drought conditions in the Driftless Area, the relationships may be too weak to provide significant predictive power, particularly given the uncertainty surrounding the past and future expressions of PDO variability (Newman et al., 2016).
Significant correlations were identified between the Driftless Oaks reconstruction and yields of both corn (r = 0.30, n = 91, p = 0.002) and soybeans (r = 0.25, n = 81, p = 0.012). In particular, years of sharply lower yields coincided with drought conditions in the Driftless Oaks reconstruction, such as in 1936, 1988, and 2012 (Figure 14a). Importantly, crop yields for both corn and soy exhibit increasing correlations with the reconstruction over time (Figure 14b). This relationship has been previously noted (Hu and Buyanovsky, 2003; Lobell et al., 2014; Mishra and Cherkauer, 2010), and it supports the notion of an increasingly tight control of climate on interannual variability in crop production in the Driftless Area over recent decades and likely into the future. The instrumental PMDI record (shown in Figure 7a) has increased substantially over the duration of the crop records, suggesting that at least some of the upward trend in yield is also due to changing climate that has produced more favorable growing conditions. Recent extreme wet years suggest that negative impacts from excessive moisture could increase as well (Yin et al., 2020), though the generally well-drained landscape of the Driftless Area may moderate such impacts (Li et al., 2019). The decline in oak health anecdotally observed by the authors and described earlier, however, may be a visual indication of parallel impacts of excessive moisture on oaks as well as crops. Regardless of whether recent changes in precipitation are due to climate change or simply a return of conditions similar to those prevalent during previous centuries, the increasing correlation between crop yield and reconstructed PMDI over recent decades suggests that while producers have enjoyed an exponential increase in total yields since the early 1900s due to developments in genetics and farming practices, interannual variability in crop yields could become increasingly volatile in southwest Wisconsin as climate variability and extremes increase (WICCI, 2011). Understanding the impacts of climate variability on agricultural systems and associated human communities has benefitted from insights derived from tree-ring records elsewhere (Huhtamaa and Helama, 2017; Stambaugh et al., 2011; Therrell et al., 2006). These results highlight the potential for improved understanding of past and future growing conditions for economically vital crops in the Driftless Area as well.

Crop data for Grant County, Wisconsin, and their relationship to climate shown as (a) annual yield of corn and soybeans for Grant County, Wisconsin, with 20-year smoothing splines shown in bold and standardized crop indices compared to the Driftless Oaks signal-free (SSF) chronology, and (b) correlations between the corn and soy crop indices and the Driftless Oaks Palmer’s drought severity index (PMDI) reconstruction, with confidence interval based on n = 40.
IV Conclusions
Development of local tree-ring data produced a reconstruction that provided a regional perspective on climate conditions in the Driftless Area over the past 303 years. The Driftless Oaks reconstruction better captured moderate moisture conditions when compared to the existing gridded reconstructions available through the NADA and LBDA. This illustrates the value of increasing the density of available tree-ring data in enabling multi-scale perspectives on past climate. The newly developed Driftless Oaks drought reconstruction indicates that, though severe, the recent extreme wet and dry events that affected the Driftless Area were likely within the range of reconstructed regional climate. The relatively infrequent occurrence of extreme droughts in the Driftless Area over the instrumental period relative to any other similar time span suggests that either the projections for wetter conditions in this region derived from climate models are already being realized (Cook et al., 2020; Pendergrass et al., 2017) or that moisture conditions over the instrumental record are historically anomalous and a return to drier conditions should be expected (Pederson et al., 2013). Given the increasing correlation between the variability of moisture availability and agricultural production over the same time period and the ubiquitous presence of severe droughts in the past, it seems prudent to contemplate the susceptibility of modern agriculture to such extended droughts and perhaps consider the development and implementation of crop-production buffers that may alleviate some of the societal-scale impacts from future droughts. Additionally, the Driftless Oaks reconstruction highlights the need to consider the impacts of non-stationary hydrologic conditions on the calibration of proxy-based reconstructions while identifying a potentially severe drought in the early 1700s. A return of extreme conditions similar to those documented in the 1700s could be devastating to the agricultural economy and culture of the region.
Footnotes
Acknowledgements
This project was fundamentally enabled by the generosity and curiosity of the people on whose land we worked. We gratefully acknowledge the hundreds of private landowners who invited us to walk their land with them and to visit the oaks that have lived there since the Driftless Area was a prairie and savanna landscape, the Wisconsin Department of Natural Resources for providing sampling permission on state lands, the Iowa Department of Natural Resources for granting permission, and John Pearson in particular for guiding us to many of the old oaks previously sampled in Iowa. The fieldwork for this project was enormously challenging and over 75 undergraduate students from UW-Platteville contributed to coring oaks over its duration. In particular, Jamie Jefferson, Steve LaBarge, Giselle Varrientos, and Kendall Welch made substantial investments of time and energy to make this project possible. Lane Johnson, John Eads, Jim Valiga, and Tom Wilding contributed to fieldwork during their time as instructors at UW-Platteville and were instrumental in making winter fieldwork possible. James Hibbard, archivist for the University of Wisconsin-Platteville and curator of the Southwest Wisconsin Room, generously invested the time to locate hand-written notes from the 1800s describing the collection of timbers used in the construction of dwellings similar to those we sampled. Erik Flesch, curator of the Mining and Rollo Jamison Museum, also helped guide our thinking with respect to construction techniques during the early Euro-American settlement period of the Driftless Area. Two anonymous reviewers provided articulate, nuanced, and thoughtful feedback and our work was greatly improved by their insights. Finally, we acknowledge that our attempt here to describe the history of drought in the Driftless Area was enabled by the displacement of Indigenous Peoples and that the stories provided by tree rings are but one perspective of a place of tremendous cultural history and diversity. We recognize that the oldest of the trees we cored took root among the fires that made the prairie, and that our research was conducted on the ancestral lands of the Ho-Chunk, Sauk and Meskwaki, Kiikaapoi, Miami, Očeti Šakówiŋ, and Bodéwadmiké peoples. We hope that by better understanding the history of this place we can become better neighbors through stewardship of the land that supports us and the community of life of which we are a part.
Declaration of conflicting interests
The author(s) declared no potential conflicts of interest with respect to the research, authorship, and/or publication of this article.
Funding
The author(s) disclosed receipt of the following financial support for the research, authorship, and/or publication of this article: Funding for this research was provided by the University of Wisconsin Water Resources Institute [WR13R003]; and the University of Wisconsin-Platteville Pioneer Academic Center for Community Engagement (PACCE).